Spatial and temporal analysis of PCP protein dynamics during neural tube closure
- University of Texas at Austin, United States
Figures
Figure 1 with 3 supplements
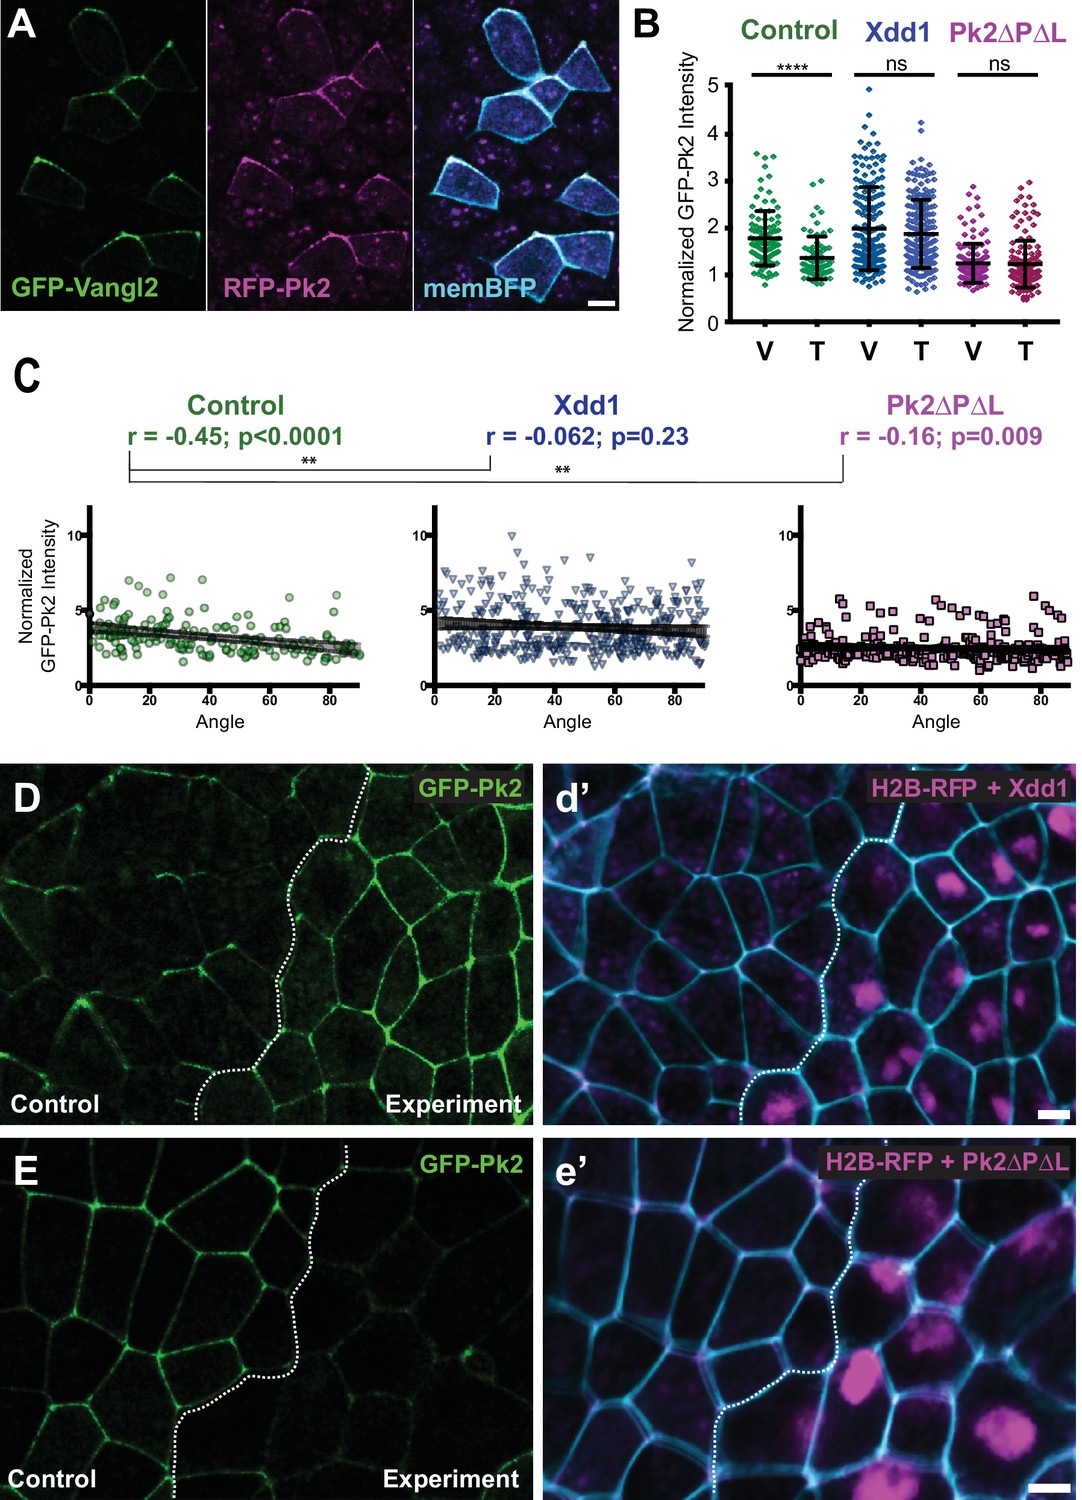
Planar polarized localization of Prickle2 and Vangl2 in the neural plate.
(A) Neural epithelium mosaically labeled with GFP-Vangl2, RFP-Pk2, and membraneBFP showing the overlapping localizations of Pk2 and Vangl2. Anterior is up, and scale = 10 µm. (B) Graph plotting GFP-Pk2 intensity along V-junctions (0–45° relative to mediolateral axis) and T-junctions (46–90° relative to mediolateral axis) normalized as a ratio to the mean cytoplasmic intensity in control cells and cells expressing Xdd1 and Pk2-ΔPΔL. Error bars represent standard deviation. Ctrl V vs. T, p<0.0001***; Xdd1 V vs. T, p=0.5799; Pk2-ΔPΔL V vs. T, p=0.173; Ctrl V vs. Xdd1 T, p=0.5770; Ctrl T vs. Pk2-ΔPΔL V, p=0.0268 (Mann Whitney test for significance). n = 101 V and 71 T from three experiments, seven embryos (Ctrl); n = n = 171 V and 199 T from four experiments, five embryos (Xdd1); n = 128 V and 142 T from three experiments, seven embryos (Pk2-ΔPΔL). (C) Distributions of data shown in (B) plotted against the angle of the junction at which the intensity was measured. Correlation coefficients for Xdd1 and Pk2-ΔPΔL were significantly different from controls using the Fischer R-to-Z transformation. n = 172 junctions (Control), n = 263 junctions (Xdd1) and n = 245 junctions (Pk2-ΔPΔL) (D-E) Confocal images of Xenopus neural epithelia labeled evenly with GFP-Pk2 and membraneBFP and mosaically with H2B-RFP, serving as a tracer for either Xdd1 (C) or Pk2-ΔPΔL (D) expression. Scale = 10 µm.
Figure 1—figure supplement 1
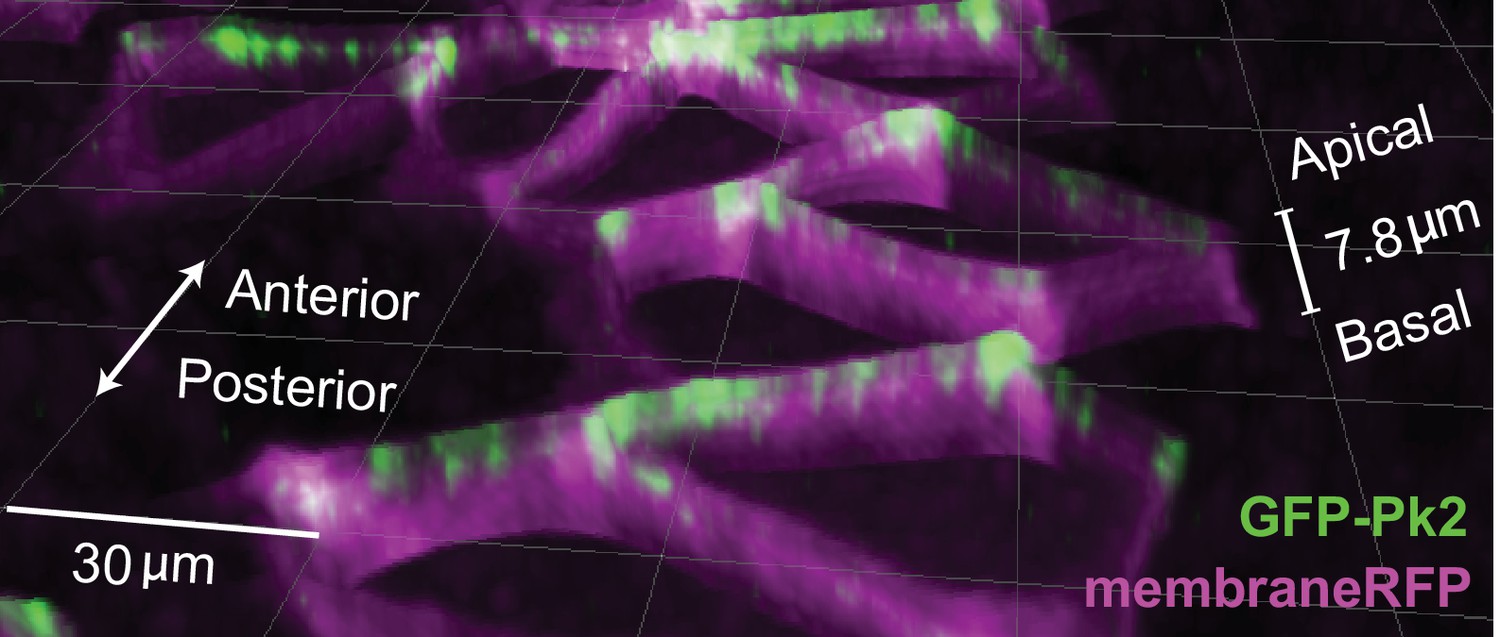
GFP-Pk2 localizes to anterior apicolateral regions of cells in the Xenopus neural plate.
Pseudo 3D render of neural epithelium mosaically labeled with GFP-Pk2 and membraneRFP showing Pk2 restricted to the apicolateral anterior regions.
Figure 1—figure supplement 2
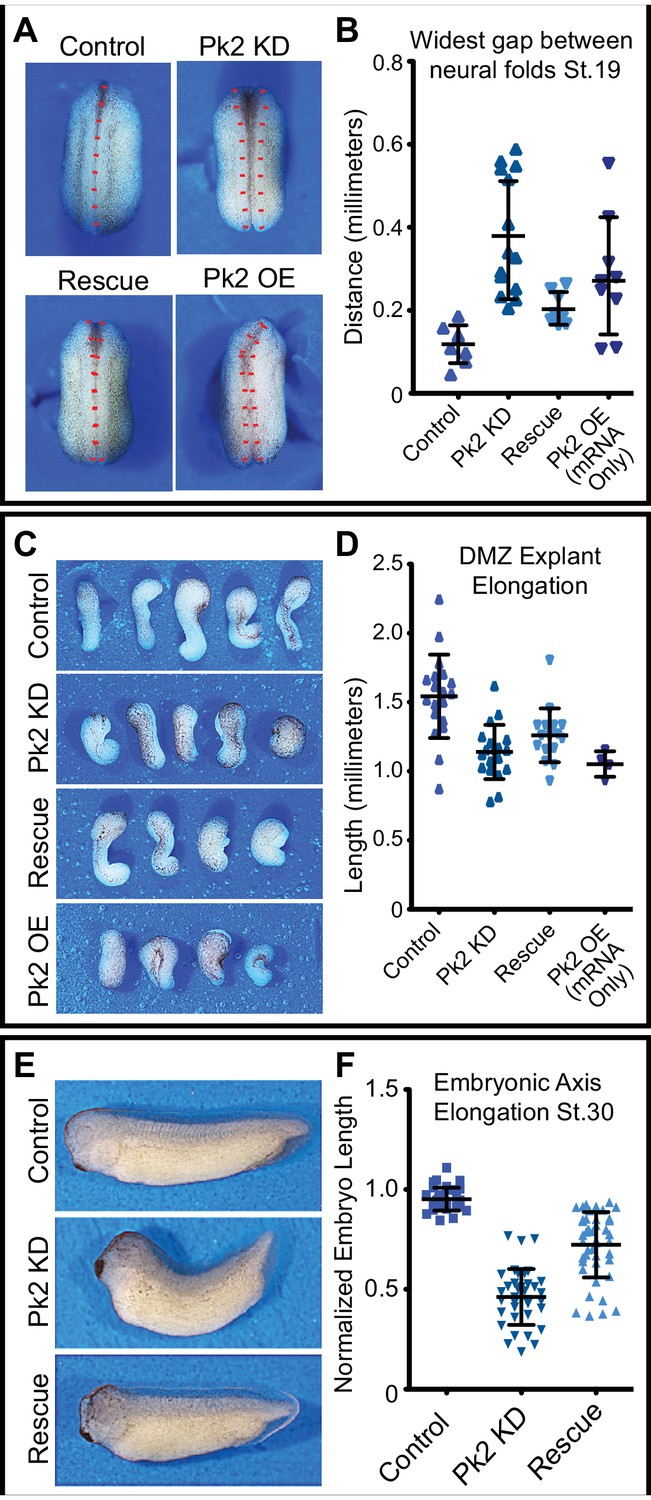
Pk2 knockdown results in embryonic convergent extension phenotypes.
(A) Dorsal view: stereoscope images of a representative Stage 20 control embryo, an embryo that has been injected dorsally with 25 ng Pk2 morpholino, an embryo that received morpholino plus a 400 pg GFP-Pk2 mRNA rescue dose, and an embryo that received only the 400 pg Pk2 mRNA. Anterior is up. (B) Graph of the distance between the neural folds at stage 20. n = 8 (Control), 14 (Pk2 KD), 8 (Rescue), 9 (RNA/OE). Control vs. KD, p<0.0001; vs. Rescue, p=0.0019; vs. OE, p=0.0079. (Mann-Whitney Test for significance). Error bars represent standard deviation. (C) Images of Dorsal marginal zone (DMZ) explants dissected from stage 11.5 embryos of the treated under the same conditions as in (A). (D) Graph of DMZ explant length at a time when embryos that had not been dissected had reached Stage 20. n = 19 (Control), 19 (Pk2 KD), 16 (Rescue), 4 (RNA/OE). Control vs. KD, p<0.0001; vs. Rescue, p=0.0010; vs. OE, p=0.0041. (Mann-Whitney Test for significance). Error bars represent standard deviation. (E) Representative images of Stage 30 embryos that received 30 ng Pk2 morpholino, morpholino plus 400 pg rescue GFP-Pk2 mRNA, or controls that received neither. Anterior is left and dorsal is up. (F) Graph of the length of the dorsal embryonic length of embryos represented by those shown in (E). n = 35 (Control), n = 37 (Pk2 KD), n = 44 (Rescue). Control vs. KD, p<0.0001; vs. Rescue, p<0.0001. (Mann-Whitney Test for significance). Error bars represent standard deviation.
Figure 1—figure supplement 3
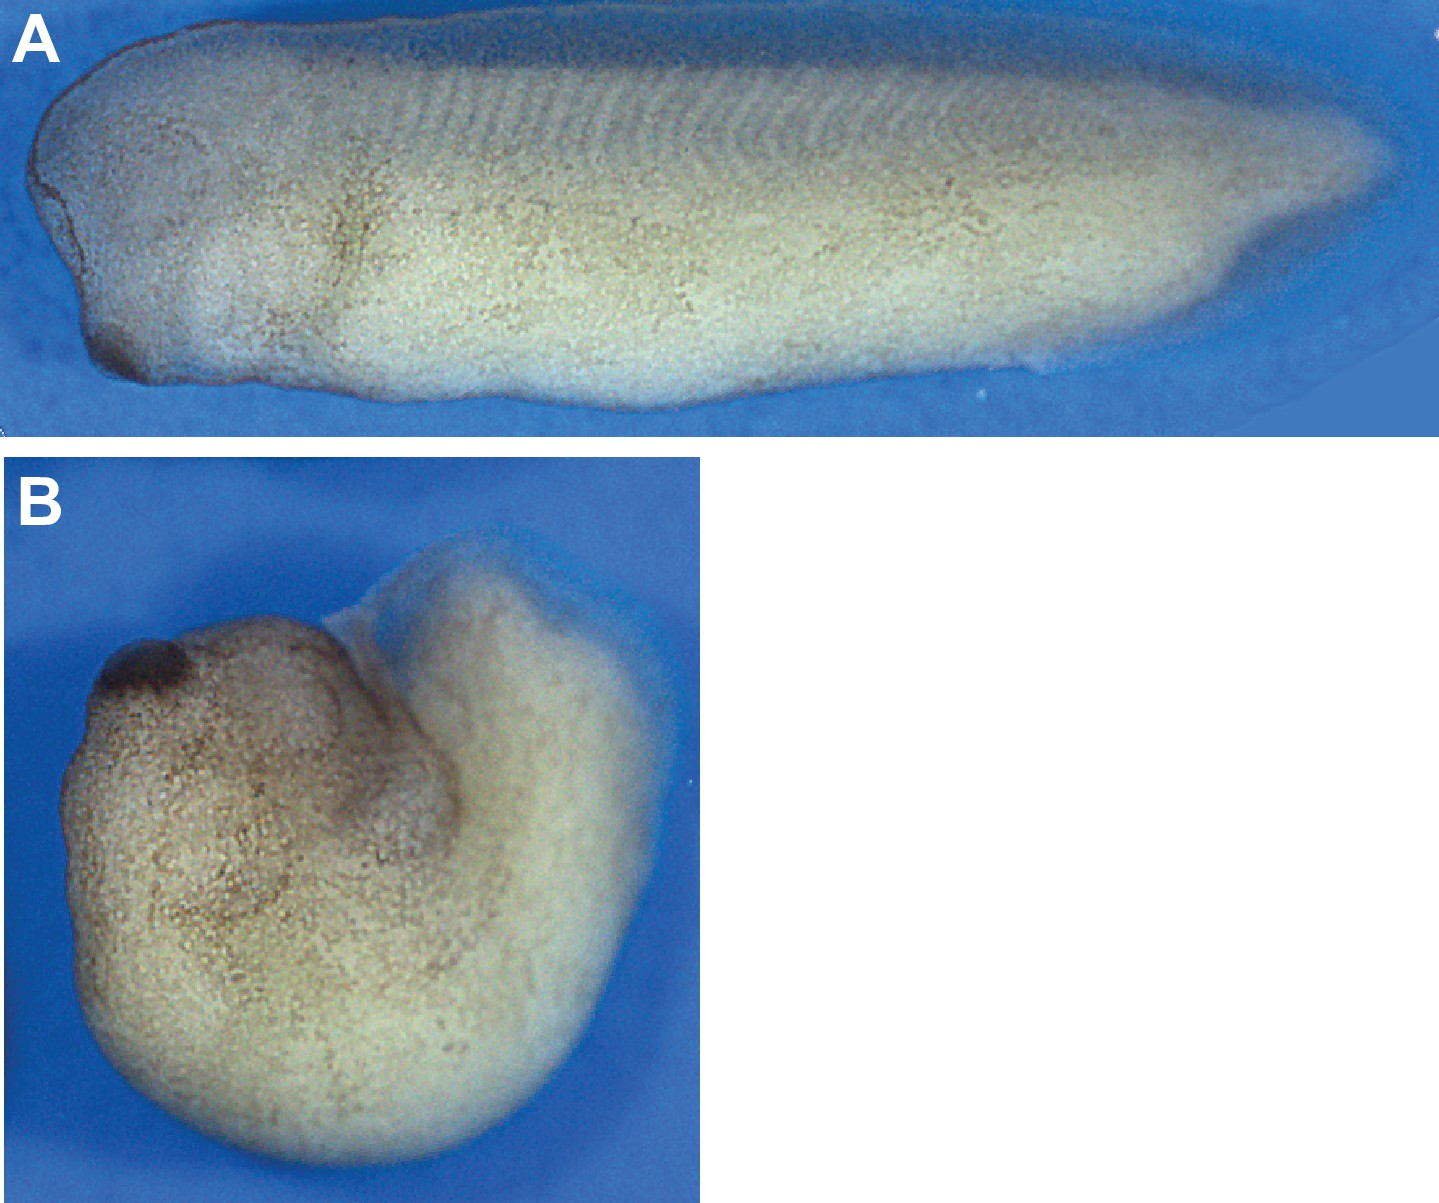
A dominant negative Pk2 disrupts convergent extension.
(A–B) Stereo images of a stage 30 control embryo (A) and clutchmate dorsally expressing Pk2-ΔPΔL (B) which failed to properly extend the body axis.
Figure 2 with 1 supplement
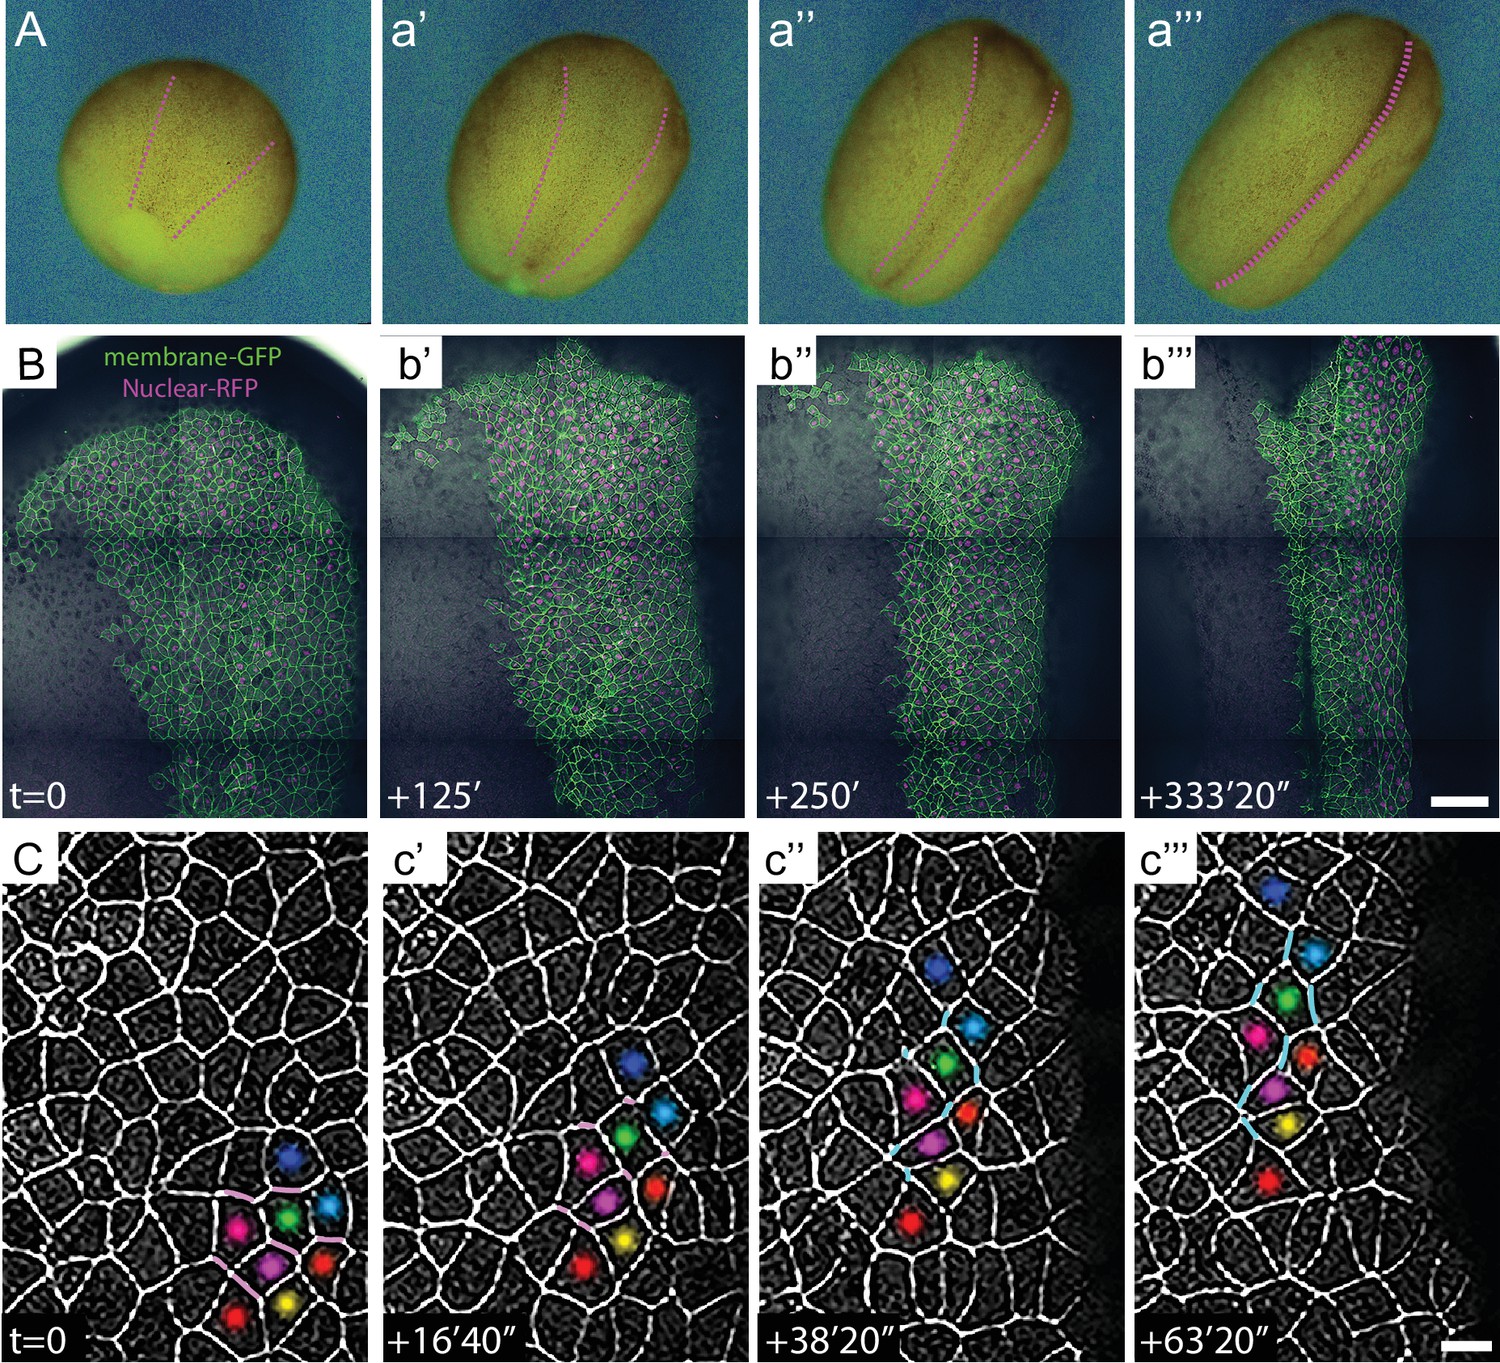
High-magnification time-lapse imaging of convergent extension in the closing Xenopus neural tube.
(A) Stereo image stills from a time-lapse movie of Xenopus neural tube morphogenesis from stages 12 to 19. (B) Stills from time-lapse confocal imaging of the dorsal side of an embryo from stages 12 to 16. Cells labeled with membraneGFP and nuclear H2B-RFP are merged with the DIC image of the same embryo. Images are shown ~2 hr. apart (128 min. interval). Scale = 200 µm. (C) Higher magnification images of cell rearrangements in neural ectoderm from the time-lapse shown in (B). Labeling of individual cells with colored dots across time points demonstrates the cellular rearrangements contributing to the narrowing and lengthening of tissue and T transitions labeled with magenta for shrinking (T1-T2) and cyan for growing (T2-T3) junctions. Scale = approx. 20 µm.
Figure 2—figure supplement 1
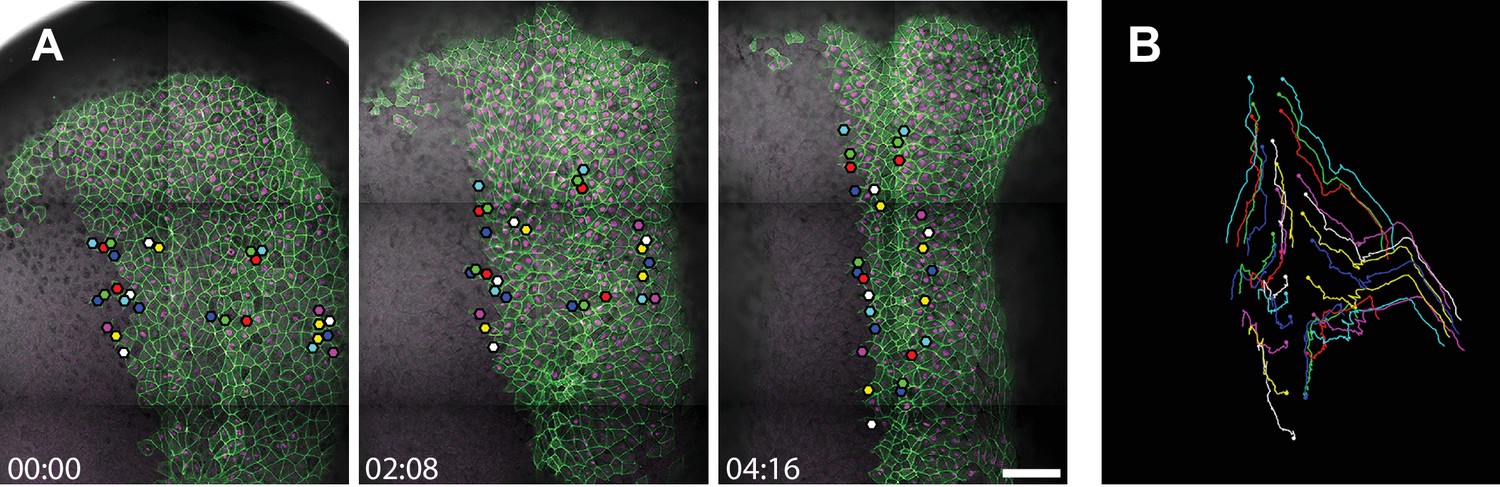
In vivo imaging of cell trajectories in the closing neural tube.
Three successive still images from the time-lapse movie shown in Figure 2 and Video 1 with a subset of cells labeled with membraneGFP and H2B-RFP being tracked. Scale = 200 µm. The far right panel shows the overall trajectories of the tracked cells through the duration of the tracking interval (4 hr, 16 min).
Figure 3
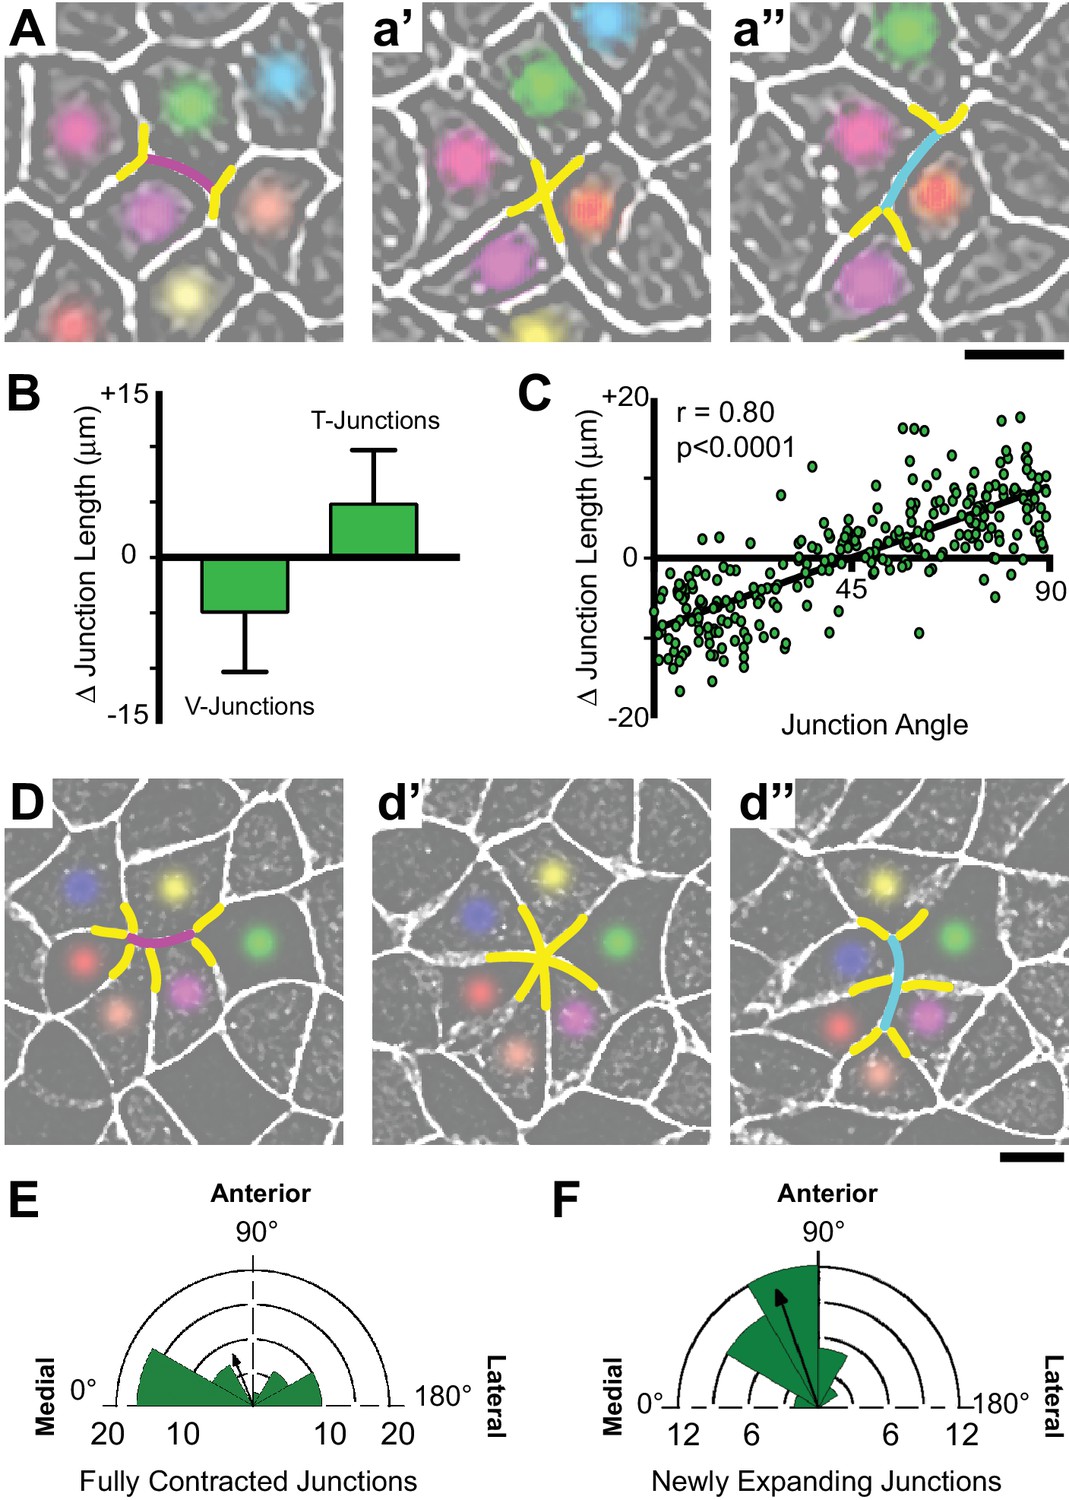
Polarized apical junction dynamics facilitate mediolateral cell intercalations.
(A) Confocal images of junction dynamics in the Xenopus neural plate epithelium labeled with membraneGFP. Magenta lines mark the shrinking of a V-junction during a T transition; after complete shrinkage mediolaterally (T1-T2) (a’), a new junction (cyan) elongates perpendicularly along the AP axis (T2-T3) (a’’). Scale = approx. 20 µm. (B) Graph showing the mean change (±s.d.) in junction length for V- and T-junctions. (C) Plot of the average angles of junctions over 1800 s against the change in junction length. Each dot represents on cell-cell junction. n = 267 junctions from three embryos across three different experiments. (D) The simultaneous mediolateral shrinking of two neighboring v-junctions (magenta) leads to formation of a multicellular rosette (d’), and new junctions (cyan) that emerge from the resolving rosette are oriented along the AP axis (d’’). Scale = approx. 20 µm. (E) Rose diagram plotting the orientation of shrinking junctions that lead to the formation of multicellular rosettes and the mean resultant vector (arrow). n = 42 junctions from four embryos across three separate experiments. (F) Rose diagram plotting the orientation of new junctions emerging from resolving rosettes and mean resultant vector (arrow). n = 36 new junctions from 3 embryos across three separate experiments.
Figure 4 with 1 supplement

PCP function is required for polarized junction shrinking in the neural plate.
(A) Confocal images from a Xenopus neural plate evenly labeled with membraneBFP and Utrophin-RFP (actin biosensor), but mosaically co-expressing H2B-RFP (magenta nuclei) together with Xdd1 on one side (right). The lateral boundaries of the neural plate are marked in each frame by yellow lines, demonstrating that Xdd1 expression disrupts the medial movement of the right neural fold in comparison to the control fold on the left. Scale = 50 µm (B) Graph of average angle of junctions versus junction length change for cells expressing Xdd1 to compare with control plot in Figure 3C. n = 187 junctions from four embryos across three experiments. (C) Graph with the total number of T transition events expressed as transitions per hour per the number of cells examined, with each point representing a single embryo. Error bars represent standard deviation. For statistical analysis, Control vs. Xdd1, and Control vs. Pk2-ΔPΔL ML, p=0.0025** for both classes of transitions (Mann-Whitney Test for significance). n = 4 experiments, seven embryos, 1167 cells (Control); three experiments, five embryos, 560 cells (Xdd1); three experiments, five embryos, 841 cells (Pk2-ΔPΔL). (D) The calculated rate of junction contraction for completed Type one to Type two transition (T1-T2) (complete contraction of a V-junction, see Figure 3A–a’). Error bars represent standard deviation. Ctrl vs. Xdd1, p<0.0001****, Ctrl vs. Pk2-ΔPΔL, p<0.0001****, Xdd1 vs. Pk2-ΔPΔL, p=0.2051. (Mann-Whitney statistical test). n = 24 junctions from four embryos across three experiments (Ctrl), n = 19, 2, 2 (Xdd1), and n = 9, 3, 3 (Pk2-ΔPΔL). (E) Plot of the angle of the long axis of control and Xdd1-expressing cells at Stages 12–12.5 (early) and Stages 13–14 (late), with lines connecting angles of the same cell at the two different time points. All measurements are from different regions of embryos that mosaically express Xdd1, similar to as shown in (A). n = 136 control cells and 114 Xdd1-expressing cells from four embryos across three experiments.
Figure 4—figure supplement 1
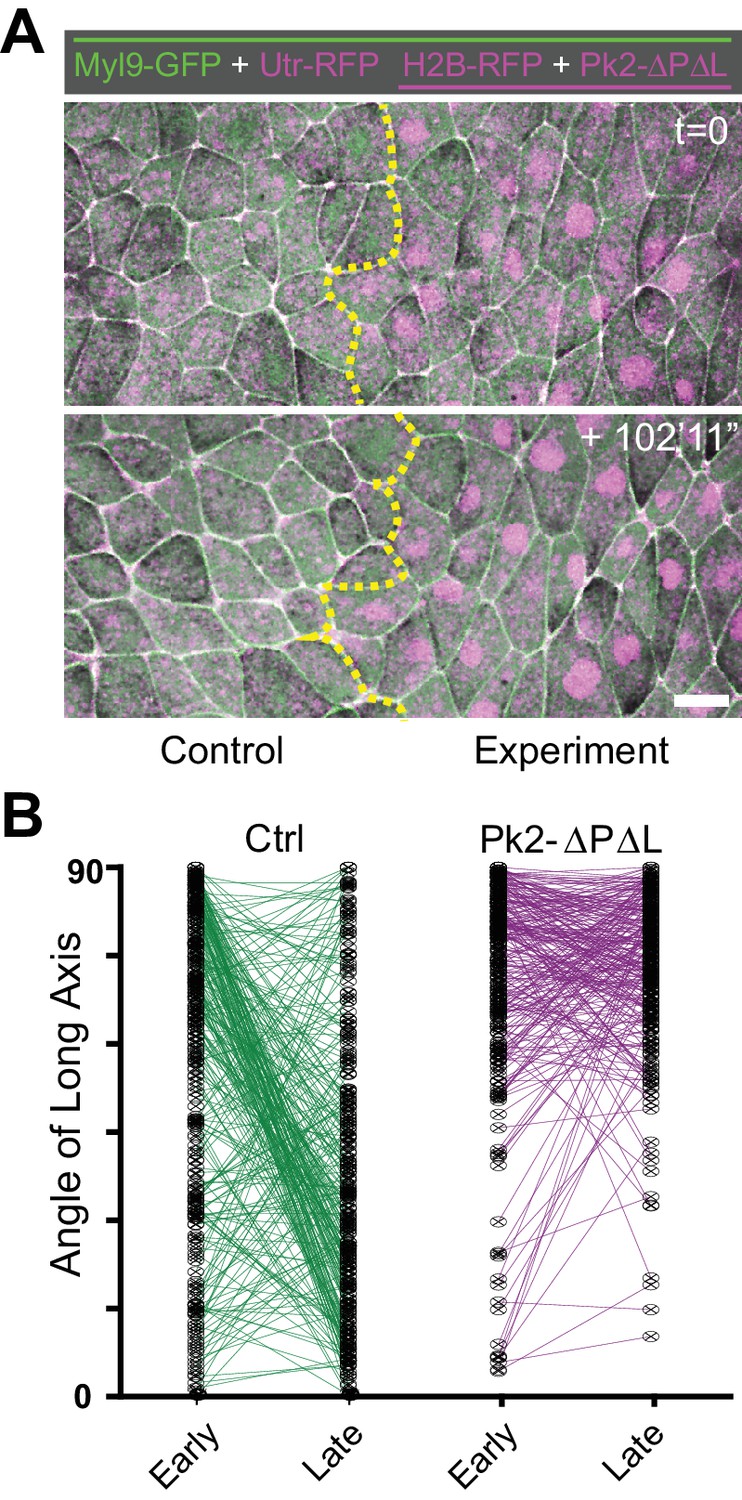
A dominant negative Pk2 disrupts polarized cell rearrangements.
(A) Confocal images from a Xenopus neural plate at stage 12.5 (top) and stage 14 (bottom) evenly labeled with Myl9-GFP and Utrophin-RFP (actin biosensor), but mosaically co-expressing H2B-RFP (magenta nuclei) together with Pk2-ΔPΔL on one side (right). Scale = 20 µm. (B) Plot of the angle of the long axis of control and Pk2-ΔPΔL-expressing cells at Stages 12–12.5 (early) and Stages 13–14 (late), with lines connecting angles of the same cell at the two different time points. All measurements are from different regions of embryos that mosaically express Pk2-ΔPΔL, similar to as shown in (A). n = 144 control cells and 143 Pk2-ΔPΔL-expressing cells from 4 embryos across three experiments.
Figure 5 with 1 supplement
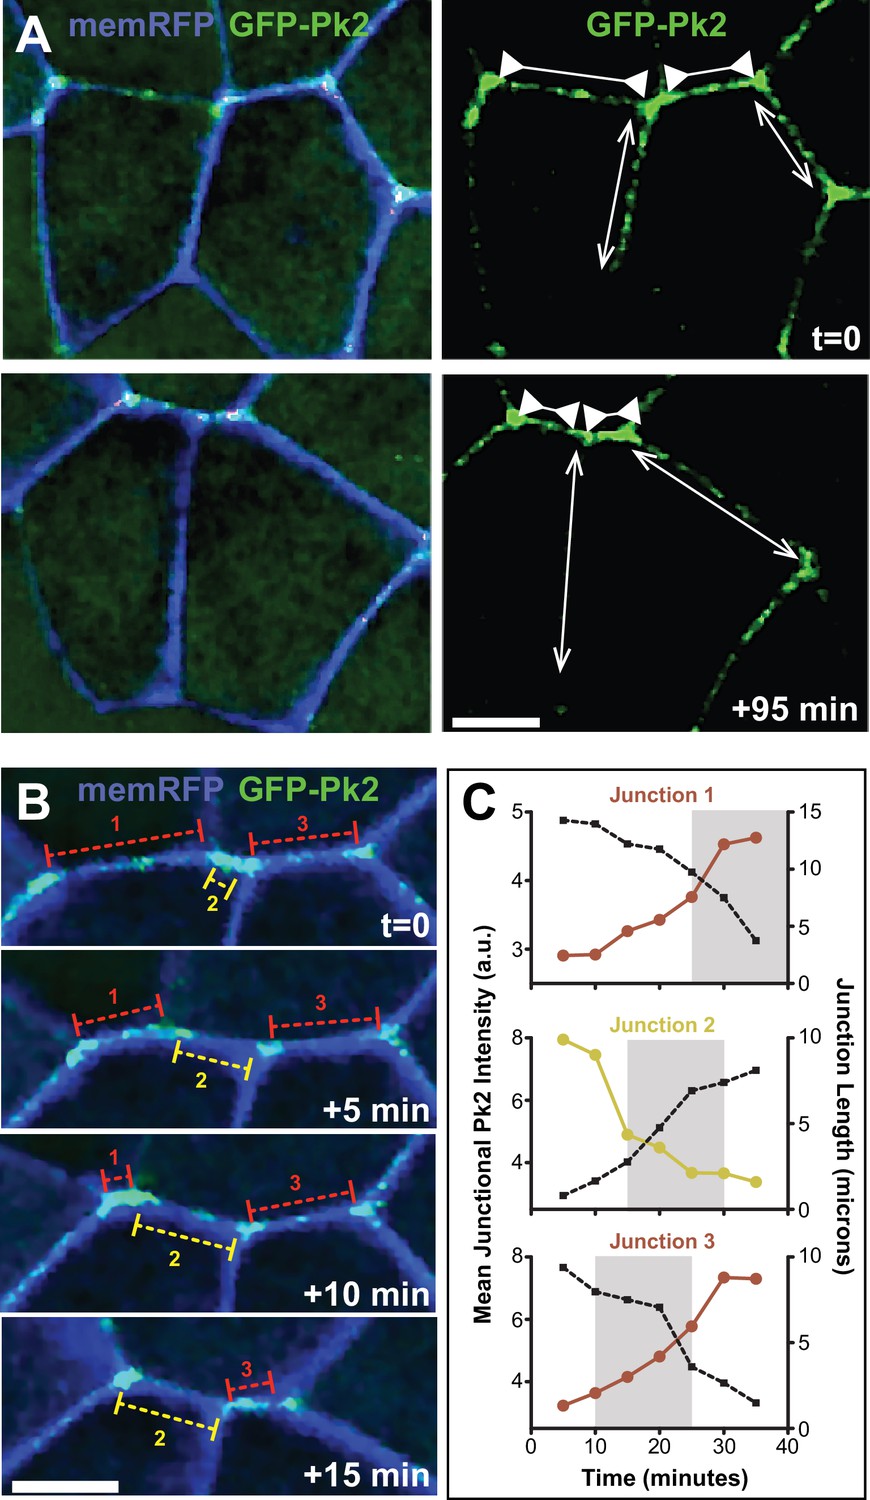
Pk2 is dynamically enriched at shrinking V-junctions.
(A) Confocal images of neural epithelial cells labeled with membraneRFP (pseudocolored blue) and GFP-Pk2 showing the change in length of shrinking junctions (inward facing arrowheads) and growing junctions (outward facing arrows) along with the corresponding change in GFP-Pk2 intensity at two different time points. Scale = 10 µm (B) Higher magnification view of the horizontal junctions shown in A, shown at 5-min intervals. Red brackets indicated shrinking junctions; yellow brackets indicate growing junctions. Scale = 10 µm (C) Plots of intensity (red/yellow traces) and length (black dashed traces) for each of the indicated junctions in Panel B. Plots show 30 min of junction dynamics ending in either junction resolution or junction formation and expansion; gray area behind select data points indicate the interval of the four frames shown in (B), which are offset due to different junctions appearing and resolving at different times.
Figure 5—figure supplement 1
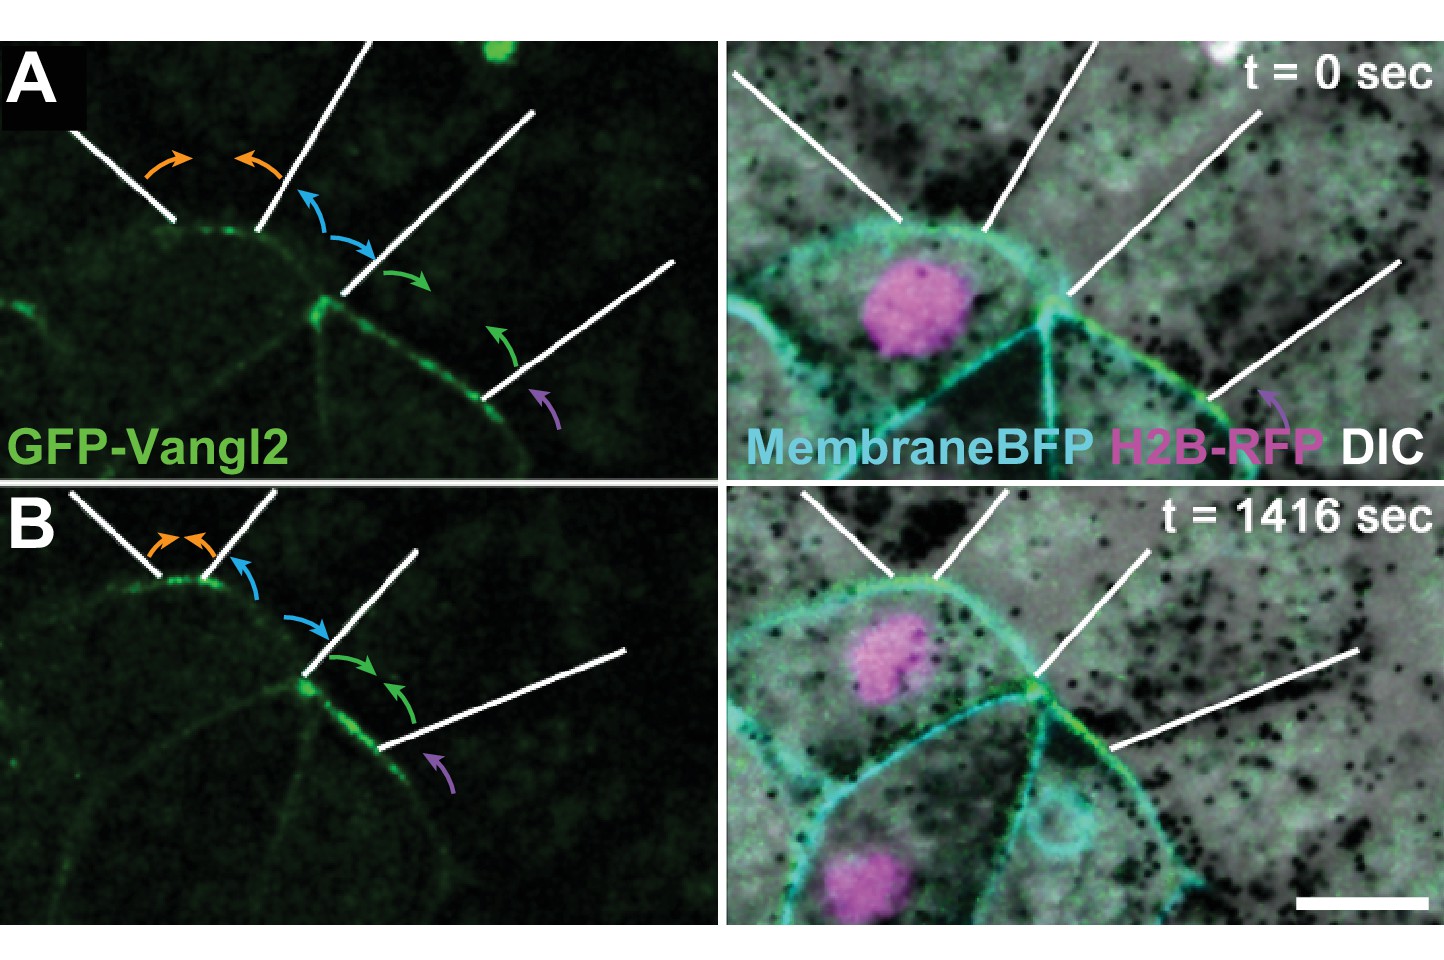
Distinct Vangl2 dynamics at adjacent growing and shrinking junctions.
(A) Confocal stills of a neural epithelium mosaically labeled with GFP-Vangl2 (left) and co-labeled with H2B-RFP and membraneBFP merged with the DIC image (right). White lines indicate junctions of unlabeled neighboring cells. Colored arrows indicate shrinking (orange, green) or growing (blue, purple) behaviors of adjoined cell-cell junctions. Note dramatic changes of Vangl2 intensity at shrinking junctions only. Scale = 10 µm.
Figure 6 with 2 supplements

Pk2 and Vangl2 dynamics at shrinking and growing junctions.
(A) Raw GFP-Pk2 pixel intensities strongly correlate with junction length changes. Inset shows a magnified view of the core of the plot. n = 71 junctions from five embryos across four experiments. (B) Raw GFP-Vangl2 pixel intensities strongly correlate with junction length changes. n = 37 junctions from 2 embryos from two different experiments. (C) GFP-caax displays only a weak correlation with junction length changes. Inset shows a magnified view of the core of the plot. n = 108 junctions from seven embryos across six experiments. Even when normalized against GFP-caax, Pk2 and Vangl2 levels show a strong correlation to junction length changes, as shown in Figure 6—figure supplement 1 Figure 6
Figure 6—figure supplement 1
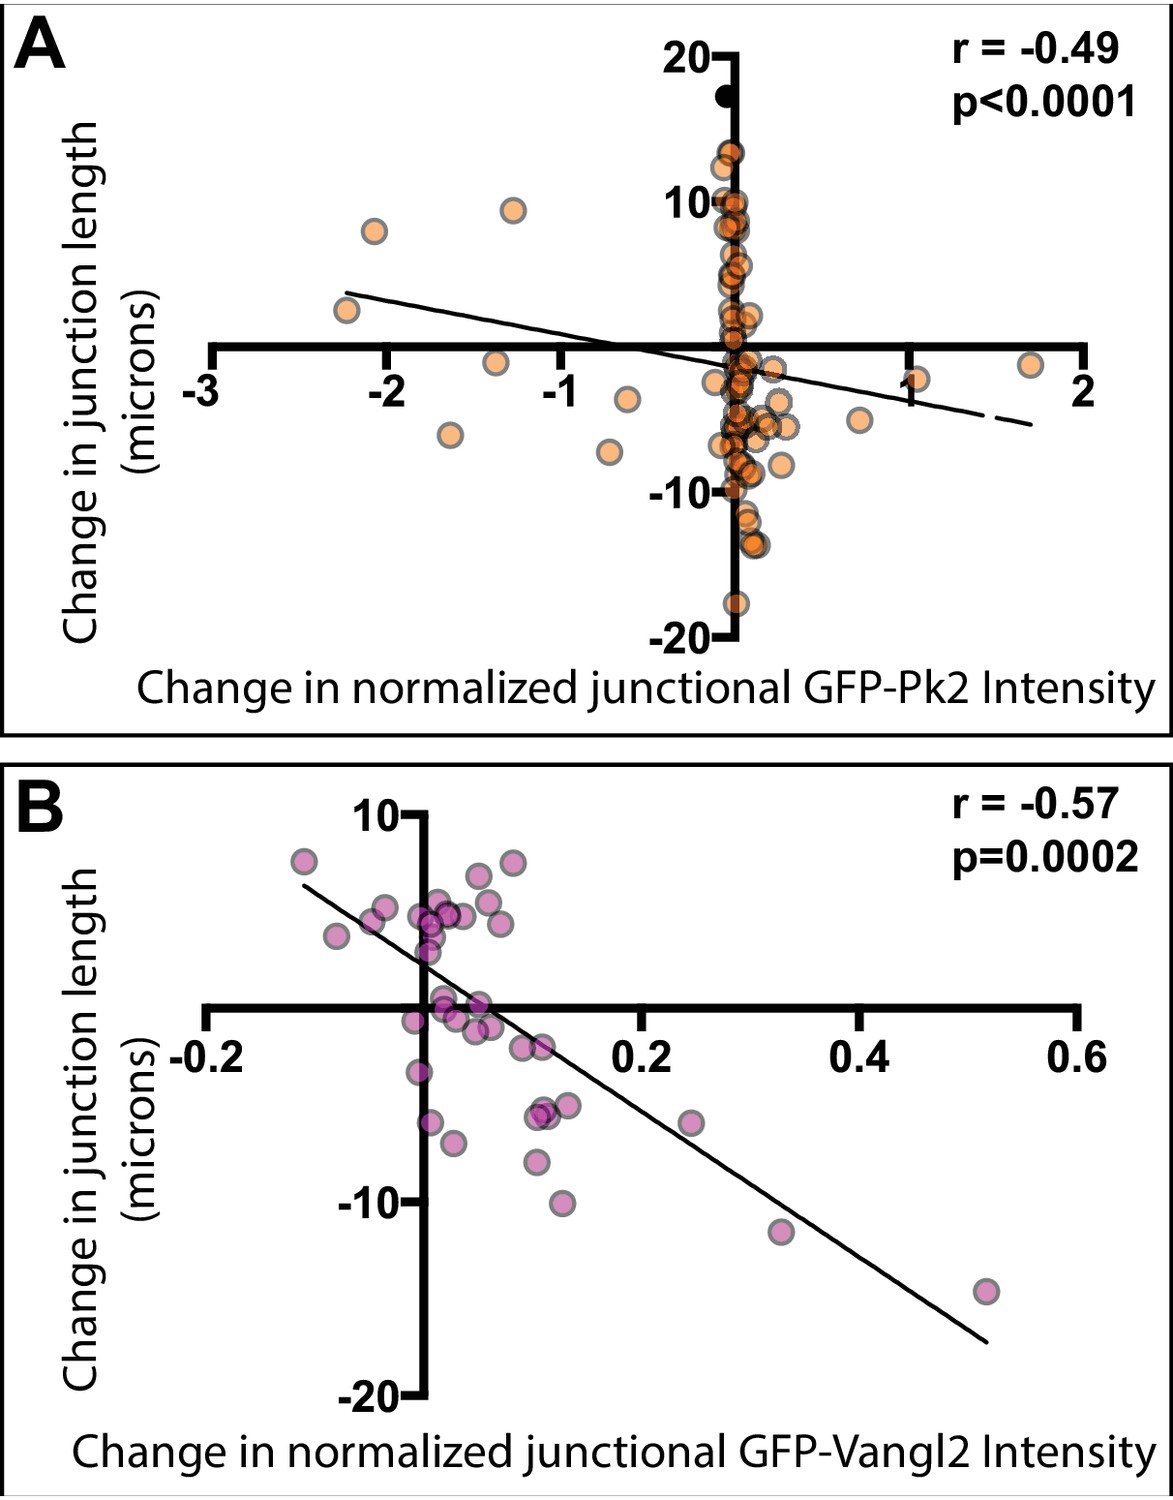
PCP protein localization is correlated with junctional behavior.
(A) Plot of normalized GFP-Pk2 intensities versus change in junction length (r = −0.49; p<0.001; n = 71). Normalization was performed by subtracting background and expressing the intensity of GFP-Pk2 levels as the ratio to the intensity of co-expressed membrane label. (B) Plot of normalized GFP-Vangl2 intensities versus change in junction length (r = −0.57; p=0.002; n = 37). Normalization was performed as per GFP-Pk2, above.
Figure 6—figure supplement 2
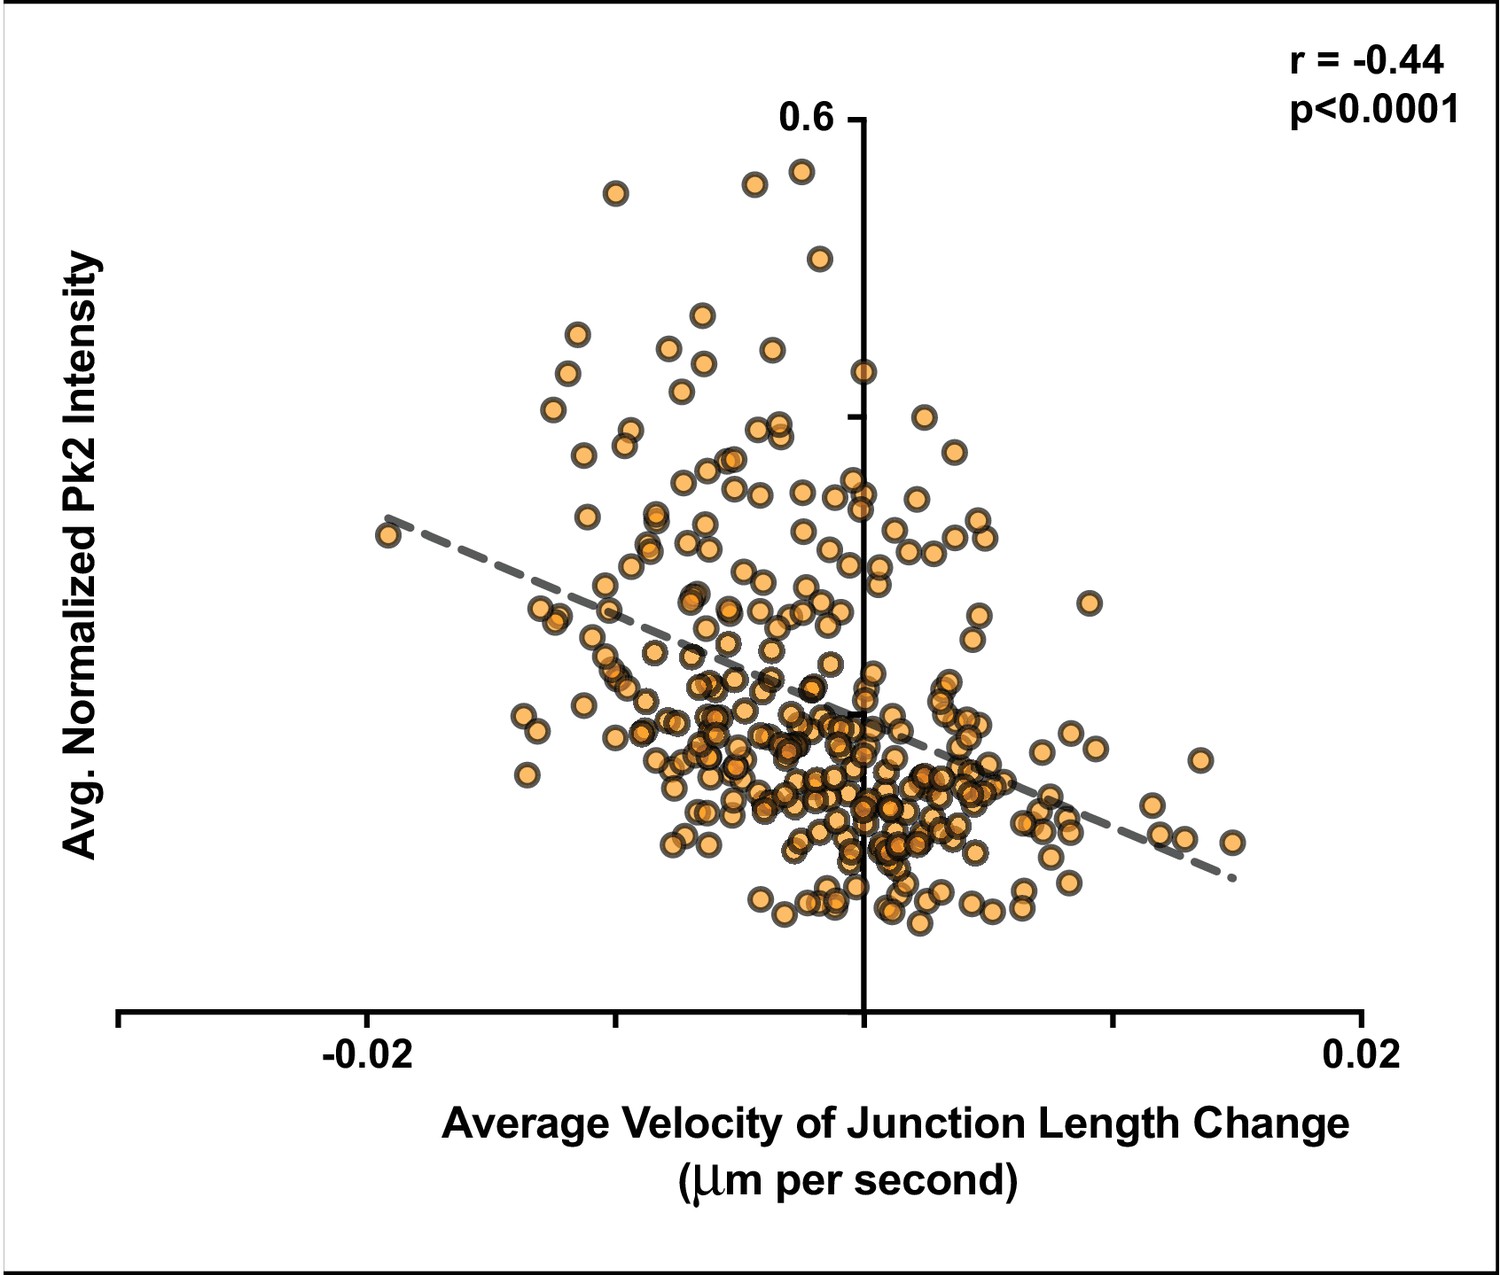
Pk2 is more highly enriched at shrinking mediolateral junctions.
(A) Plot of average Pk2 intensities normalized to the membrane label intensities at two time points against the change in the length of the junction divided by the time in seconds between the two time points that the measurements were taken. All measurements are taken from V-junctions that remained within 30 degrees of the mediolateral axis throughout the duration of analysis. Junctions that were shrinking at a greater rate tended to have higher levels of normalized Pk2 localized as compared to other V-junctions that were not shrinking at a comparable rate. n = 205 intervals from 22 cells of five embryos across five separate experiments.
Figure 7
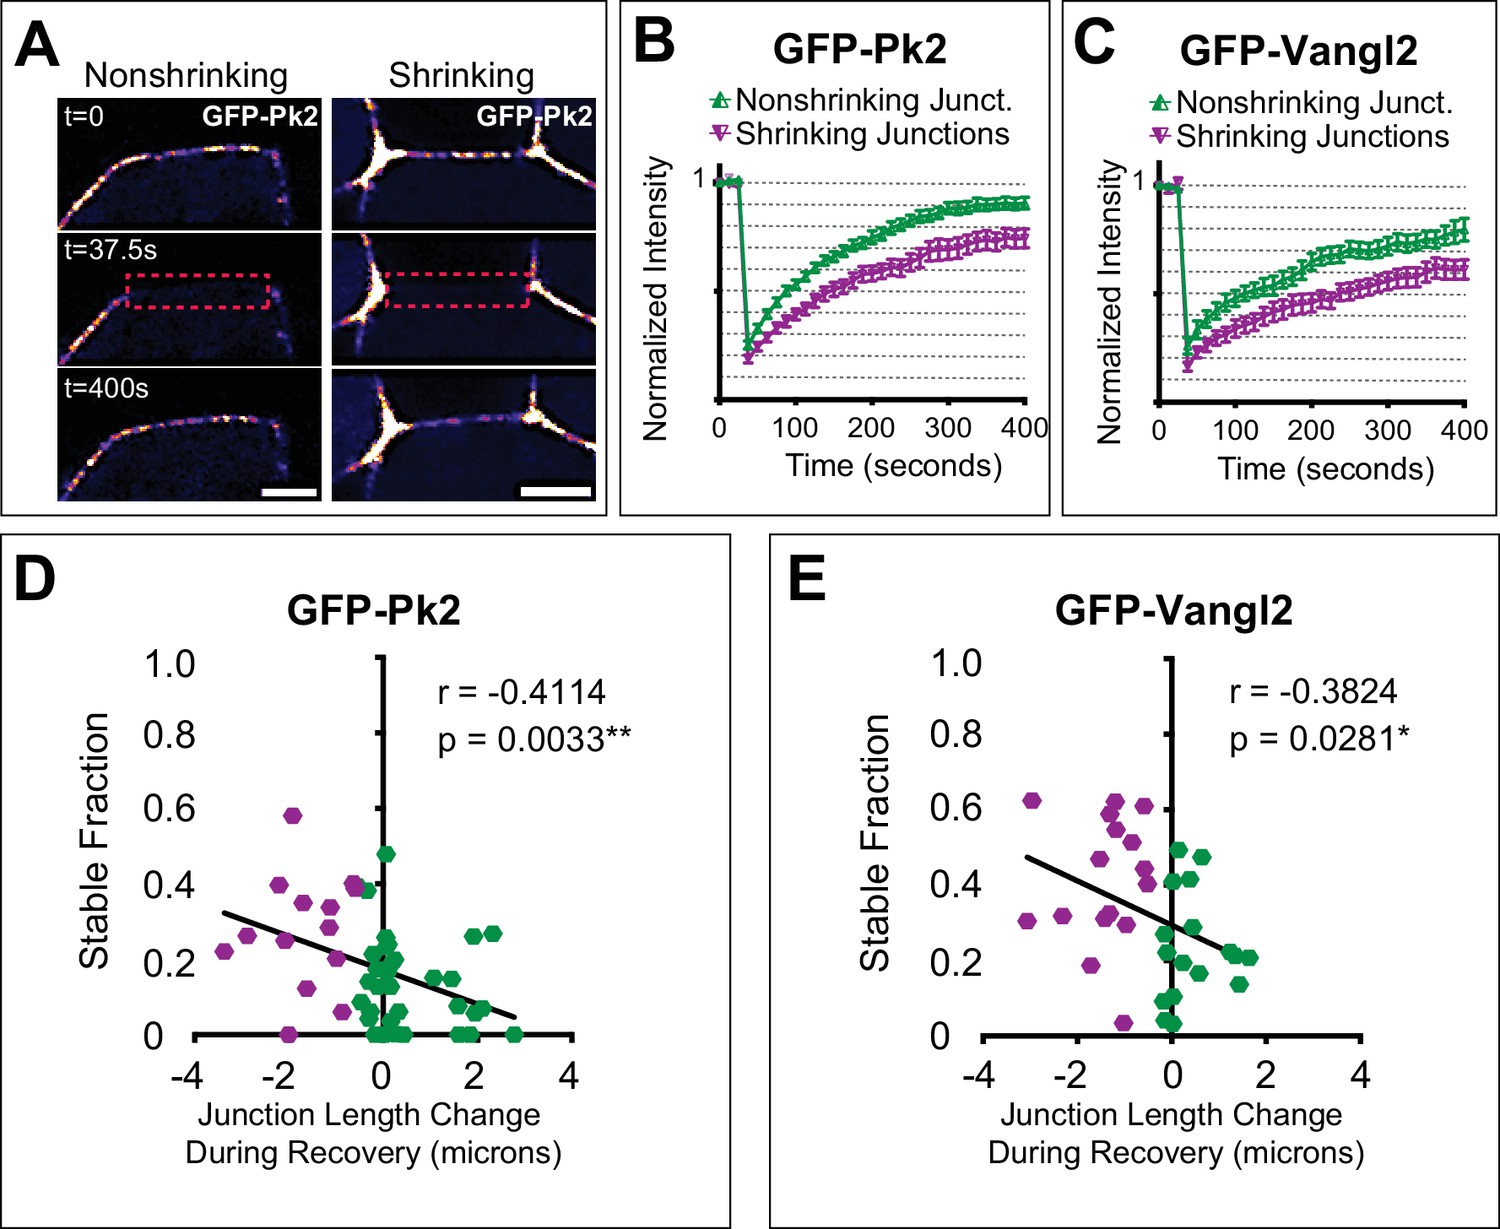
Turnover of Pk2 and Vangl2 correlates with junction behavior.
(A) Still images from time-lapse movies captured before and after photobleaching a nonshrinking and shrinking junction of cells mosaically labeled with GFP-Pk2 in the neural plate, with a LUT applied for warmer colors representing higher fluorescence intensities. Dashed red box marks the bleached region of interest. Note that the cell on the anterior side of the junctions is unlabeled. Scale = 5 µm. (B, C) Graphs showing mean fluorescence recovery after photobleaching at shrinking and nonshrinking junctions for GFP-Pk2 (n = 34 nonshrinking, n = 15 shrinking) and GFP-Vangl2 (n = 17 nonshriking, n = 16 shrinking). Shrinking junctions were defined as those that were reduced by 0.5 μm or more in length over the course of bleaching and fluorescence intensity recovery. Error bars represent SEM. (D–E) Graphs plotting the change in junction length during photobleaching and recovery against the calculated nonmobile fraction for the individual junctions analyzed in (B) and (C) with associated linear regression model and correlation analysis statistics included. n = 49 (GFP-Prickle2); n = 33 (GFP-Vangl2).
Figure 8 with 1 supplement
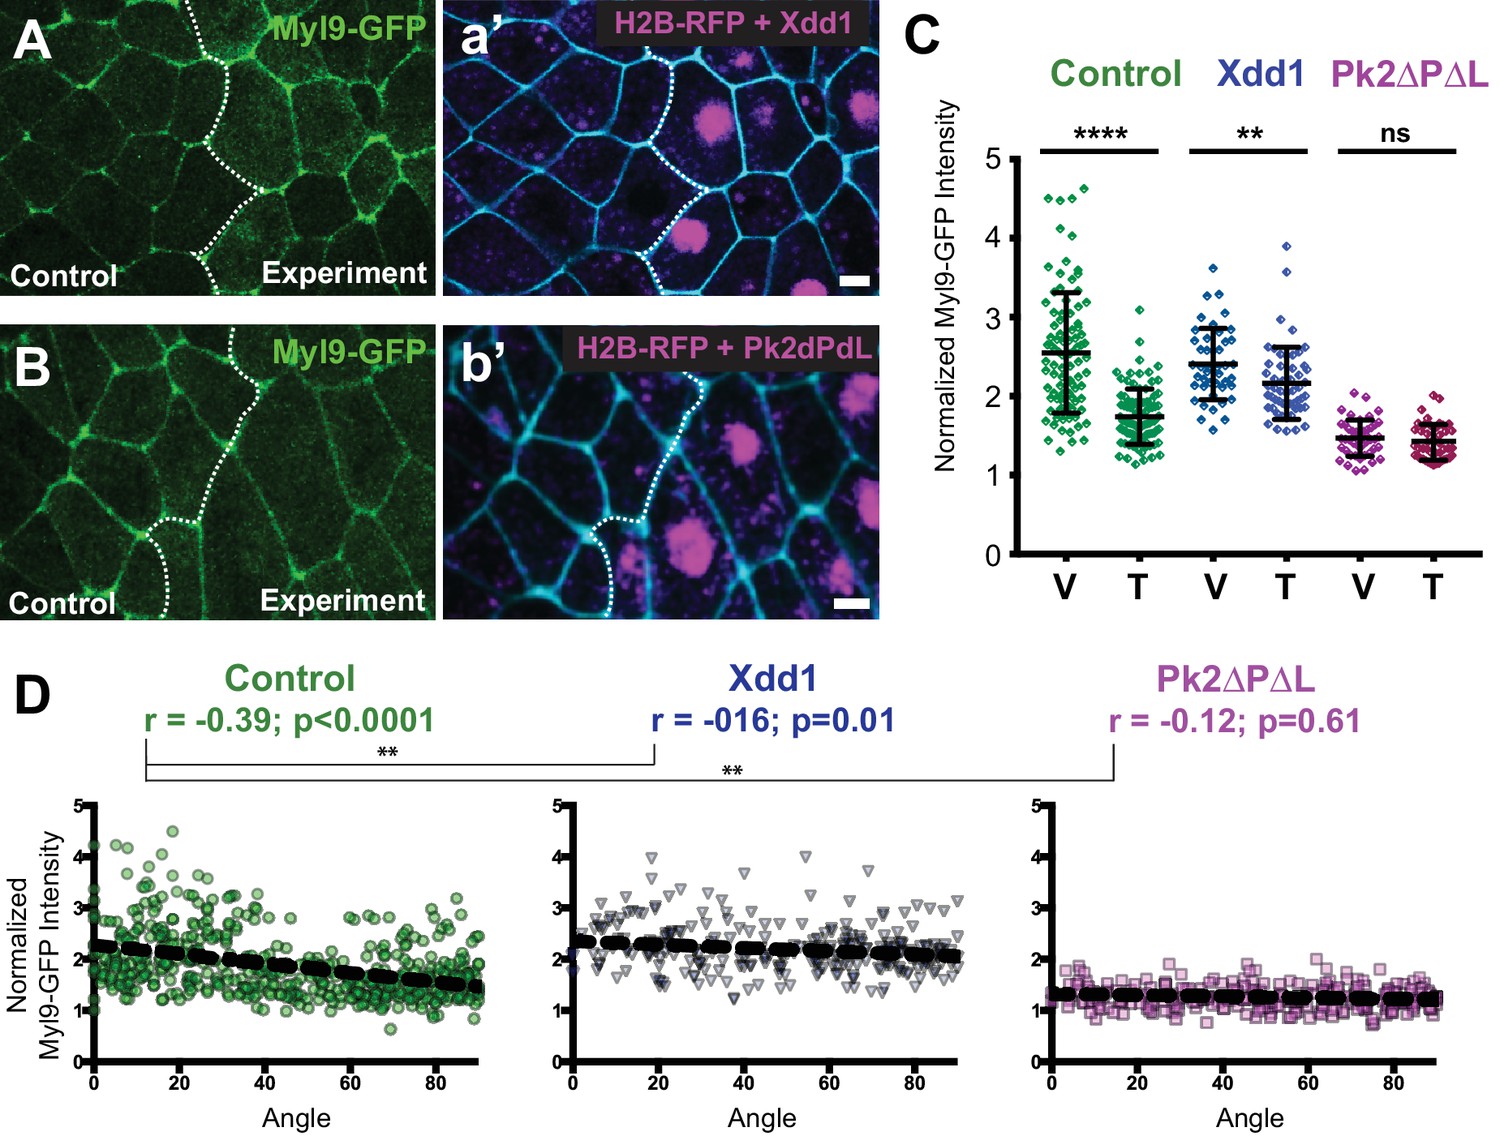
PCP function is required for polarization of actomyosin contractility during junction shrinking.
(A–B). Confocal images of Xenopus neural epithelia labeled evenly with Myl9-GFP and membraneBFP and mosaically with H2B-RFP serving as a tracer for either Xdd1 (A) or Pk2-ΔPΔL (B) expression. Scale = 10 µm (C) Graph plotting Myl9-GFP intensity along V-junctions (0–45° relative to mediolateral axis) and T-junctions (46–90° relative to mediolateral axis) normalized as a ratio to the mean cytoplasmic intensity of the cells sharing the junction. Control cells (n = 91 V, 91T) and cells expressing Xdd1 (n = 44 V, 53 T) and Pk2-ΔPΔL (n = 45 V, 45 T). Ctrl V vs. T, p<0.0001****; Pk2-ΔPΔL V vs. T, p=0.2304; Xdd1 V vs. T, p=0.0022**; Control V vs. Xdd1 V, p=0.5826; Control T vs. Xdd1 T, p<0.0001****; Control T vs. Pk2-ΔPΔL T, p<0.0001**** (Mann-Whitney Test for significance). Error bars represent standard deviation. (D) Distributions of normalized Myl9-GFP intensity plotted against the angle of the junction at which intensity was measured in control cells and cells expressing Xdd1 or Pk2-ΔPΔL. Correlation coefficients for Xdd1 and Pk2-ΔPΔL were shown to be significantly different from controls using the Fischer R-to-Z transformation. n = 498 junctions (Control), n = 263 junctions (Xdd1) and n = 245 junctions (Pk2-ΔPΔL) from four experiments, five embryos (Xdd1); three experiments, seven embryos (Pk2-ΔPΔL).
Figure 8—figure supplement 1
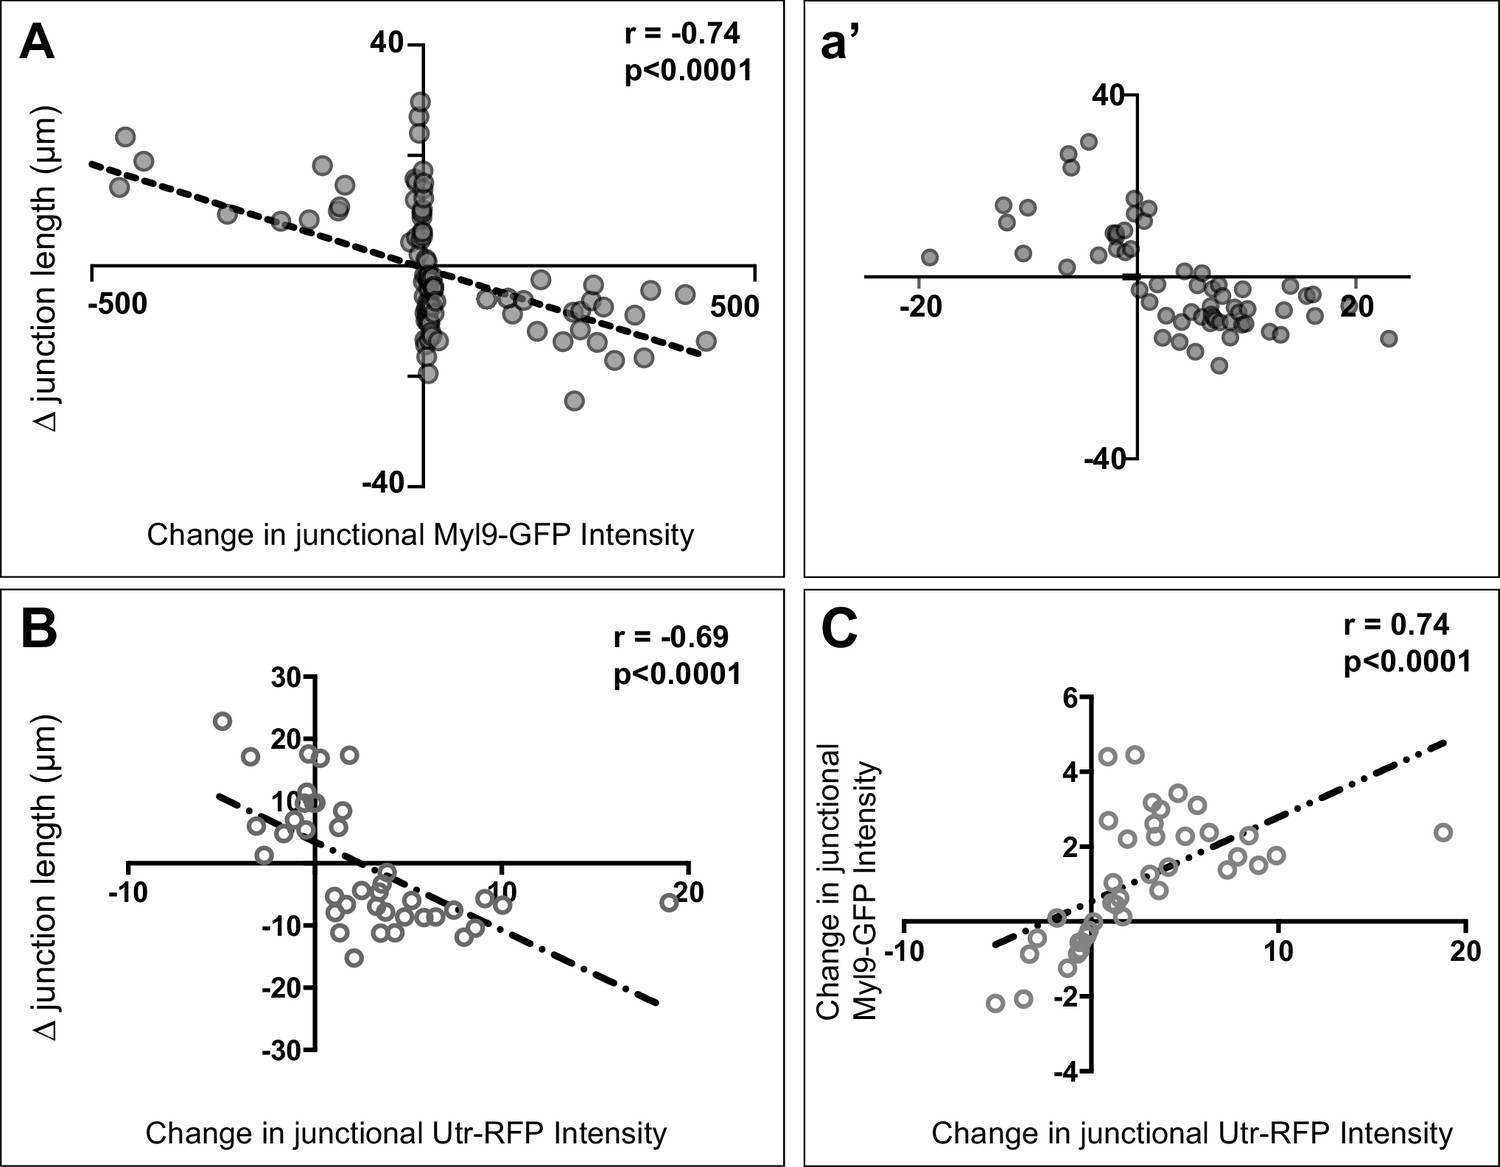
(A) Plot showing the correlation between changes in junction length and Utrophin-RFP (actin biosensor) intensities. (B) Plot showing the correlation between changes in junction length and Myl9-GFP intensities. (C) Plot showing the correlation between changes in junction length and Myl9-GFP and Utrophin-RFP (actin biosensor) intensities. n = 39 junctions for each plot.
Figure 9
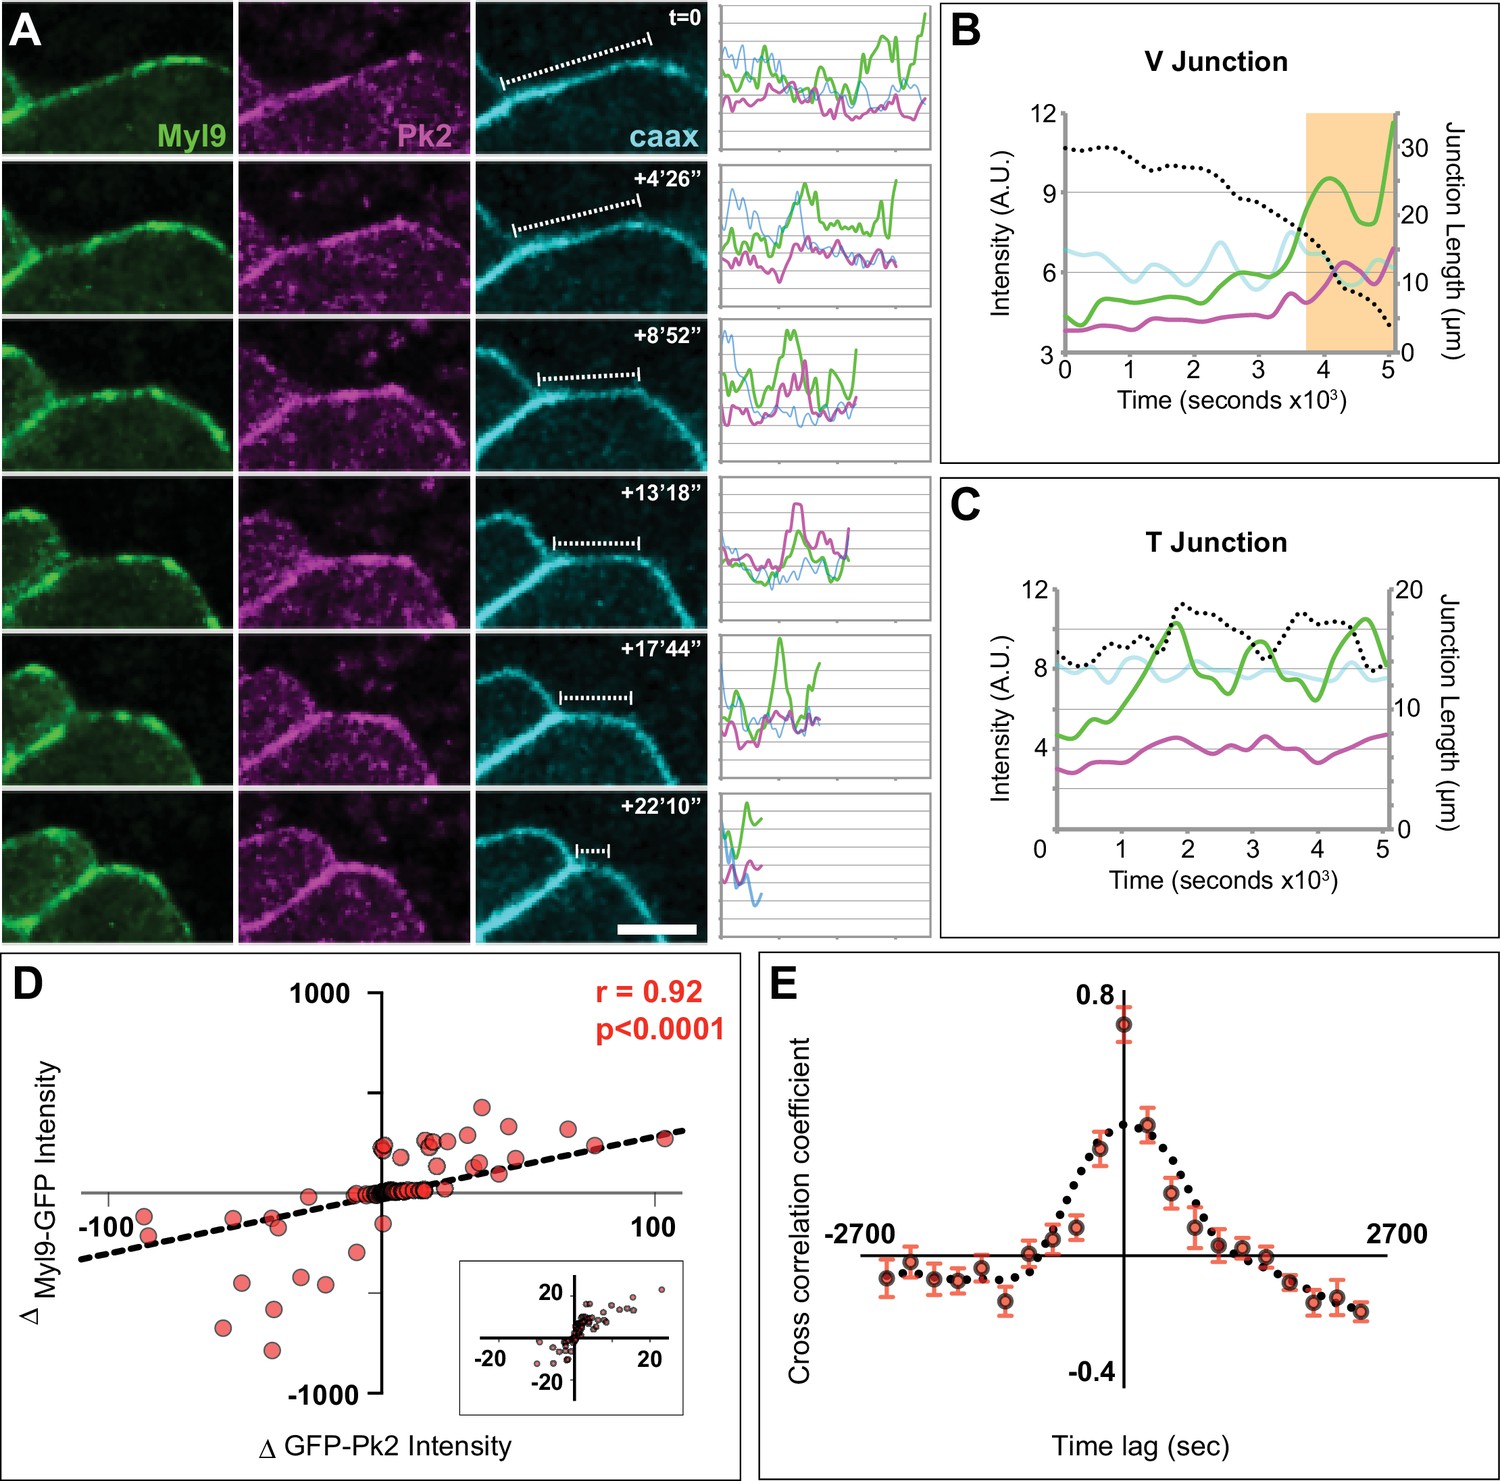
Spatiotemporal coordination of Prickle2 and actomyosin accumulation at shrinking junctions.
(A) Confocal images of a shrinking V-junction mosaically labeled with Myl9-GFP, RFP-Pk2, and membraneBFP over the course of a 1600 s time lapse and associated intensity plot profile for each fluorophore across the length of the junction. Scale = 10 µm. (B) Plot of mean intensities over time for the V-junction in (A) which shows the pulsed co-accumulation of Pk2 (pink) and Myl9 (green) as junction length shrinks (black dashed line). The orange box marks the time points portrayed in (A) (C) Plot of mean intensities over time for a mosaically labeled T-junction showing the pulsed co-accumulation of Pk2 (pink) and Myl9 (green) as junction fluctuates between shrinking and growing (black dashed line). (D) Scatter plot of the change in RFP-Pk2 intensity against the change in GFP-Myl9 intensity and associated correlation; a magnified view of the core of this plot is shown in Panel c’. n = 96 junctions from three embryos across two experiments. (E) Cross correlation analysis of changes in RFP-Pk2 and GFP-Myl9 intensities over time, with a mean cross correlation coefficient of 0.7 at 0 s time lag demonstrating synchronous accumulation dynamics. n = 22 junctions from three embryos; error bars represent SEM.
Videos
Video 1
Time-lapse confocal images of a Xenopus laevis neural plate mosaically labeled with GFP-Vangl2 (left), RFP-Pk2 (middle), and memBFP (right, merged with GFP-Vangl2, RFP-Pk2, and DIC channels).
Still images and scale are shown in Figure 1A.
Video 2
Time-lapse confocal images of the dorsal side of a Xenopus laevis embryo from stages 12 to 16.
Cells labeled with membraneGFP and nuclear H2B-RFP are merged with the DIC image of the same embryo. Still images and scale are shown in Figure 2B.
Video 3
Time-lapse confocal images of the dorsal side of a Xenopus laevis embryo from stages 12 to 16.
Cells labeled with membraneGFP and pseudo-colored to help track cell rearrangements during neural convergent extension. Still images and scale are shown in Figure 2C.
Video 4
Time-lapse confocal images of a Xenopus laevis neural plate mosaically labeled with GFP-Pk2 (left) and memRFP (right, pseudo-colored blue and merged with GFP-Pk2 and DIC channels).
Still images and scale are shown in Figure 5A and a magnified view is shown in Video 5 and analysis of the mediolaterally aligned junctions annotated in the beginning of the movie are provided in Figure 5B,C.
Video 5
Time-lapse confocal images of a Xenopus laevis neural plate mosaically labeled with GFP-Pk2 and memRFP (pseudo-colored blue) merged with DIC.
Shrinking and growing junctions are annotated with red and yellow lines, respectively, and analysis of these junctions is provided in Figure 5C.
Video 6
Time-lapse confocal images of a Xenopus laevis neural plate mosaically labeled with Myl9-GFP (top left), RFP-Pk2 (bottom left), and memBFP (top right).
The bottom right panel is a merge of the Myl9-GFP and RFP-Pk2 channels. Still images and analysis of these movies is provided in Figure 9A,B.
Additional files
-
Transparent reporting form
- https://doi.org/10.7554/eLife.36456.026
Download links
A two-part list of links to download the article, or parts of the article, in various formats.
Downloads (link to download the article as PDF)
Open citations (links to open the citations from this article in various online reference manager services)
Cite this article (links to download the citations from this article in formats compatible with various reference manager tools)
Spatial and temporal analysis of PCP protein dynamics during neural tube closure
eLife 7:e36456.
https://doi.org/10.7554/eLife.36456


