Intermittent subthalamic nucleus deep brain stimulation induces risk-aversive behavior in human subjects
- Massachusetts General Hospital, Harvard Medical School, United States
- Baylor College of Medicine, United States
- Brown University, United States
Figures
Figure 1
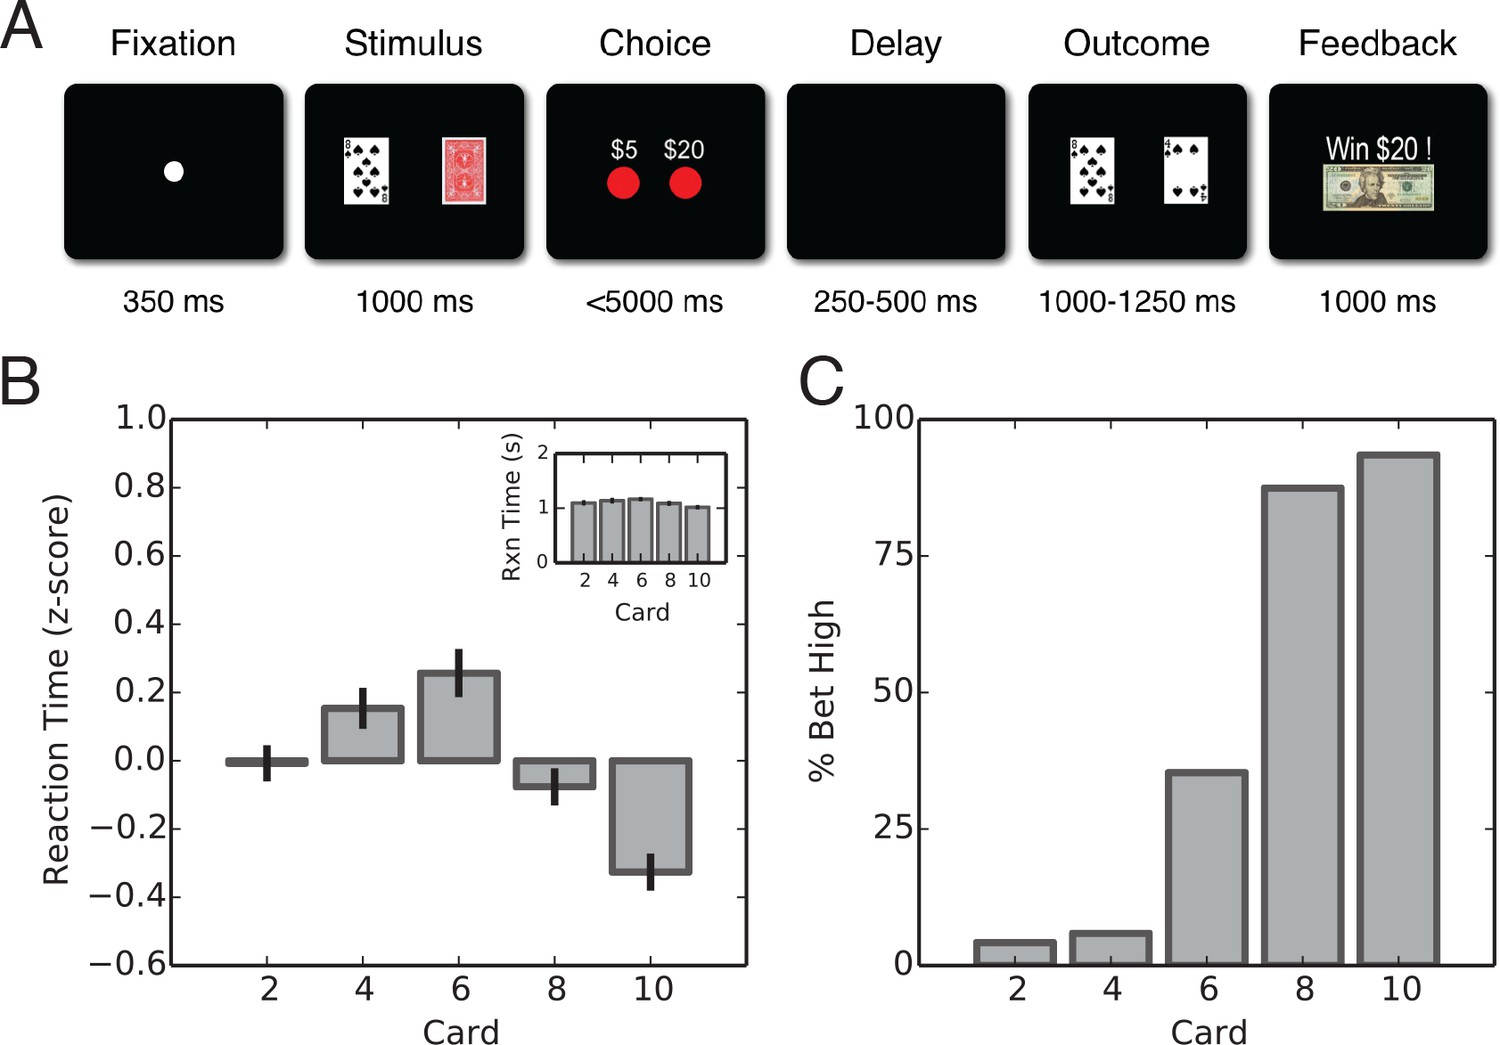
Task description and behavioral results.
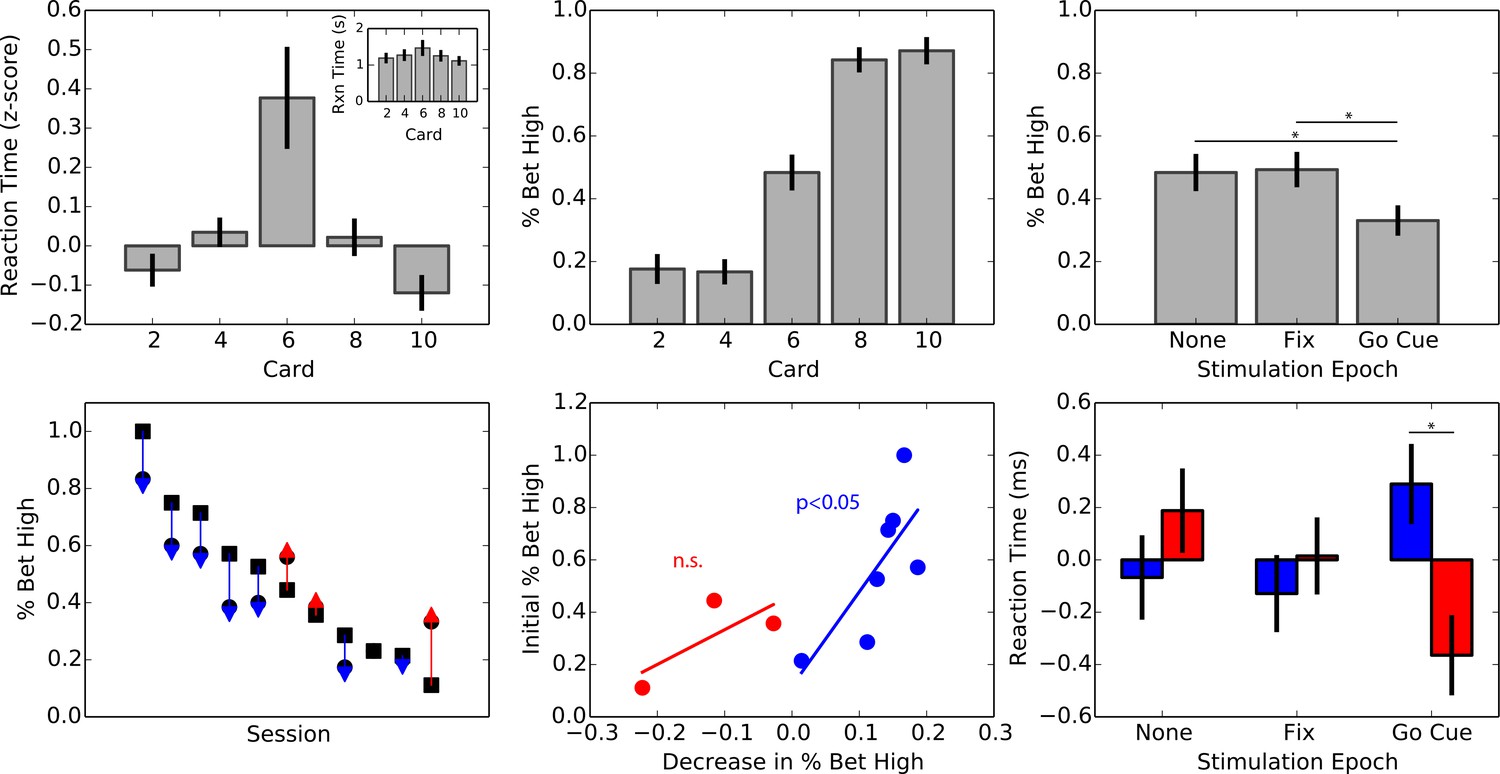
(A) Schematic representation of the gambling task. A fixation point is presented to indicate the start of the trial. Next, the subject’s card is presented alongside with the back of the computer’scard. Subjects are then presented with the option of placing a $5 or $20 wager. Following a delay, the computer’s card is revealed and feedback is presented. (B) Average z-scored and raw (inset) reaction times by card for intraoperative population (, ; ANOVA). Reaction times were the longest for the high-uncertainty trials and amongst the lowest for the low-uncertainty trials. (C) Average percentage of high wagers by card value. Intraoperative subjects displayed a strong risk-averse bias that was particularly noticeable on high-uncertainty trials in which a high wager was placed only 24% of the time on average, deviating significantly from a 50/50 strategy (, ).
-
Figure 1—source data 1
SQLite database containing two tables: behavior and spikes.
The behavior table contains fields for ID, subject, structure (brain region), session (session numer), startIndex, endIndex, startTimestamp (time in seconds for beginning of trial), endTimestamp (time in seconds for end of trial), fixationTimestamp (time in seconds for the fixation cue), pcardTimestamp (time in seconds for card presentation), buttonTimestamp (time in seconds for the gocue), choiceTimestamp (time in seconds when the button press was registered), fulldeckTimestamp (time in seconds for when the opponent’s card is revealed), feedbackTimestamp (time in seconds for feedback), reactionTime (time in seconds), trialNumber (trial number), conditionNumber (condition number), pcard (player’s card), ccard (opponent’s card), choice (wager), winLoss (outcome), value (value of wager). The spikes table contains spiking data for each trial and can be referenced to the behavioral table ID variable by trialID.
- https://doi.org/10.7554/eLife.36460.004
Figure 2 with 4 supplements
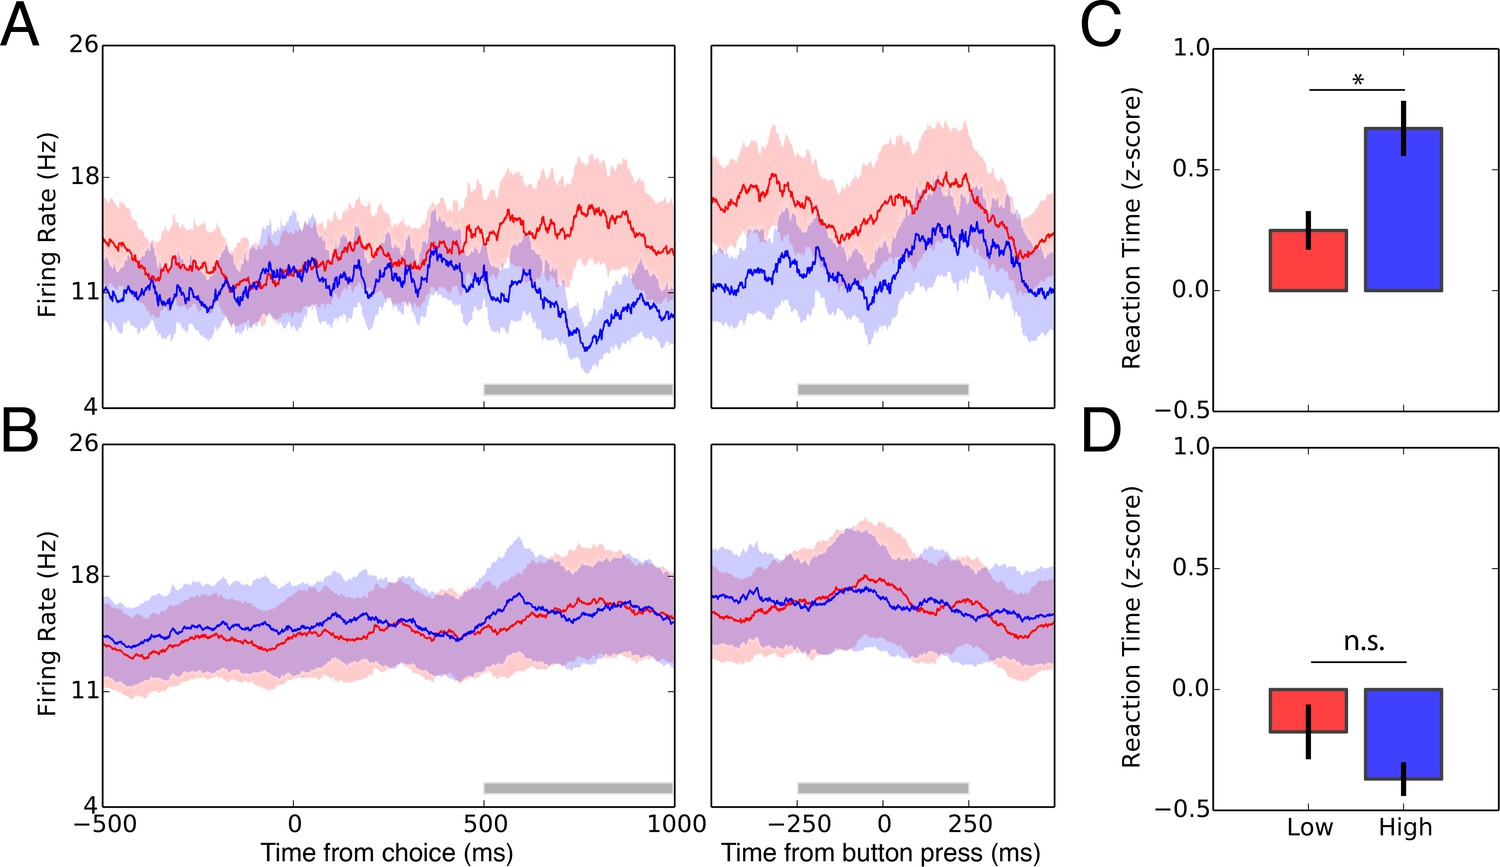
Single-neuron activity of decision signaling in the STN.
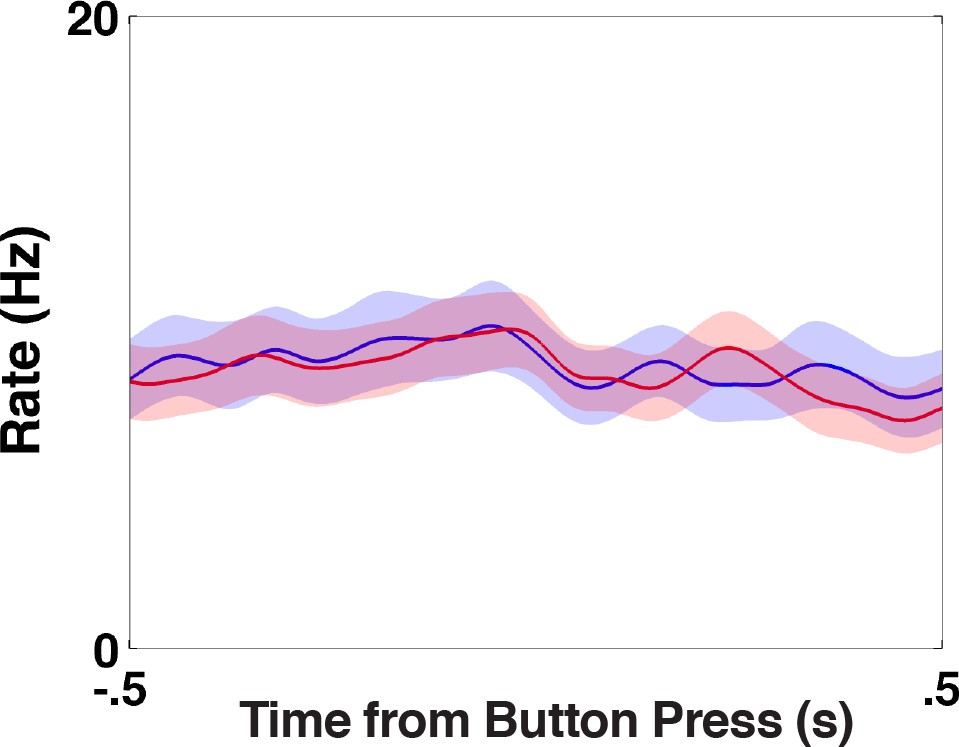
(A) Peri-stimulus time histogram for low wagers (red) vs. high wagers (blue) on high-uncertainty trials zeroed to the onset of the choice period (left panel) and button press (right panel). STN activity predicted the upcoming decision during a 500 ms window (gray bar) during the choice period (, ) but not during the button press (, ). (B) Peri-stimulus time histogram for low wagers (red) and high wagers (blue) on low-uncertainty trials referenced to the onset of the choice period (left panel) and button press (right panel). STN activity did not encode the upcoming decision for low-uncertainty trials during the choice period (, ; , ) or the button press (, ; , ). Shaded regions in (A) and (B) represent standard errors. (C) Average z-scored reaction times for low (red) and high (blue) wagers on high-uncertainty trials. Reaction times were longer for high wagers compared with low wagers (, ). (D) Similarly, reaction times were not significantly modulated by the wager on low-uncertainty trials (, ).
Figure 2—figure supplement 1
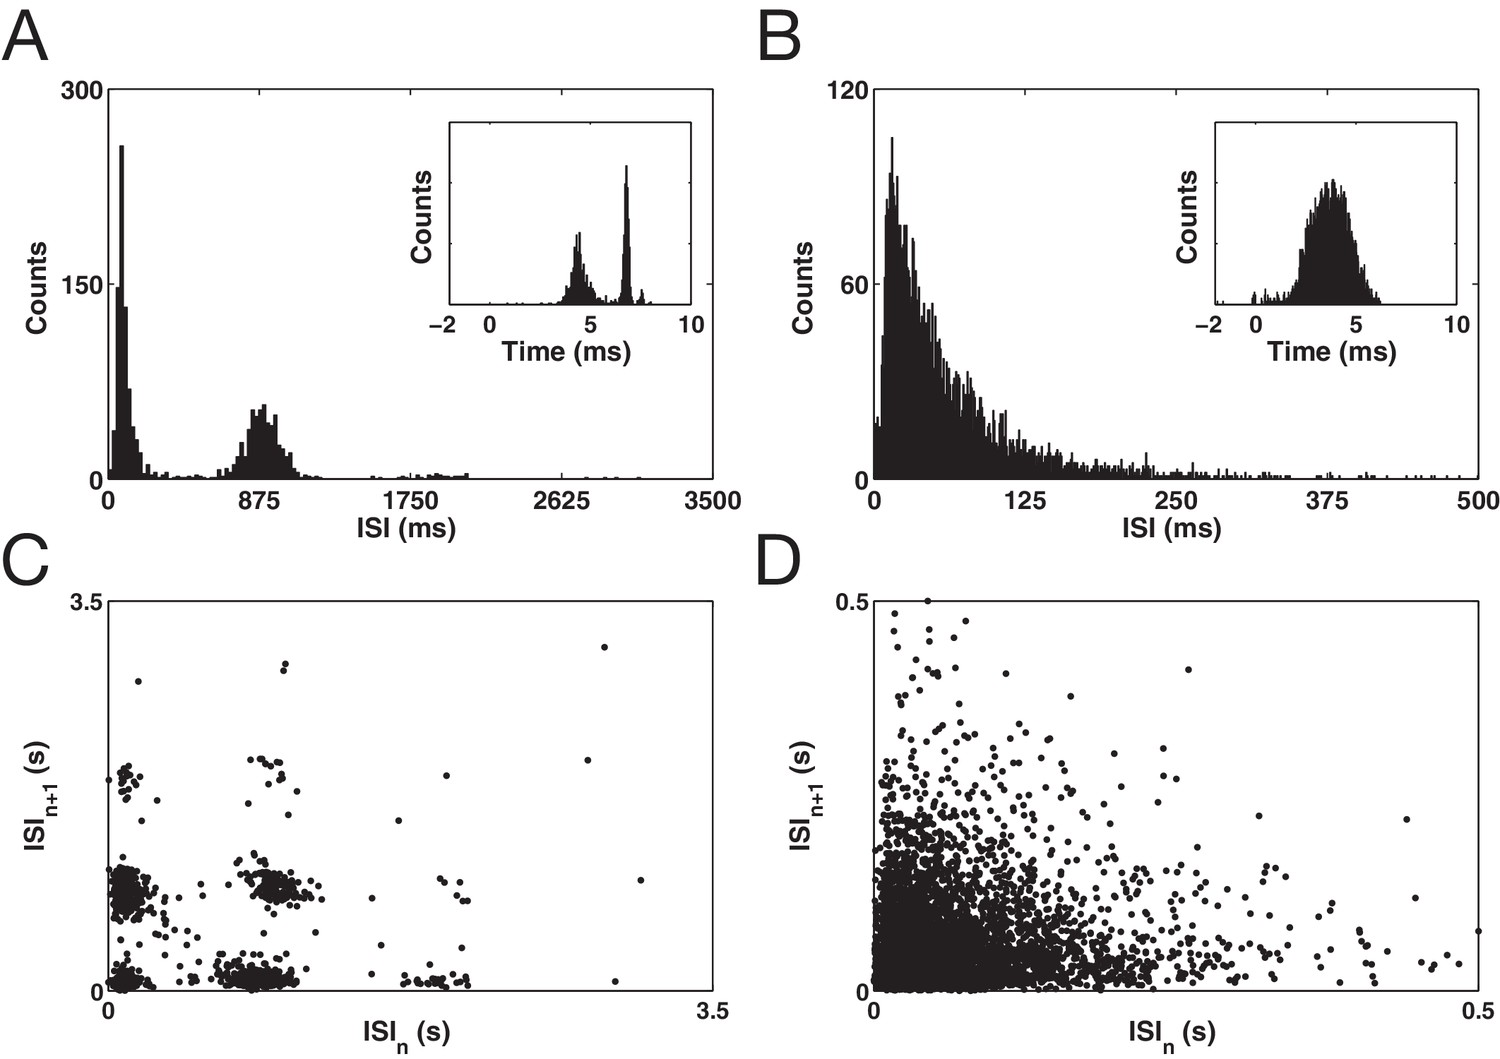
Examples of two well isolated putative STN neurons.
(A and B) Inter-spike interval histogram (ISI) plots. Inset displays log ISI distributions. (C and D) Inter-spike interval return maps visualizing second order spike train patterns.
Figure 2—figure supplement 2

Example raster of low- (red) and high-wagers (blue) on high-uncertainty (6-card) trials centered on the choice period.
https://doi.org/10.7554/eLife.36460.008
Figure 2—figure supplement 3
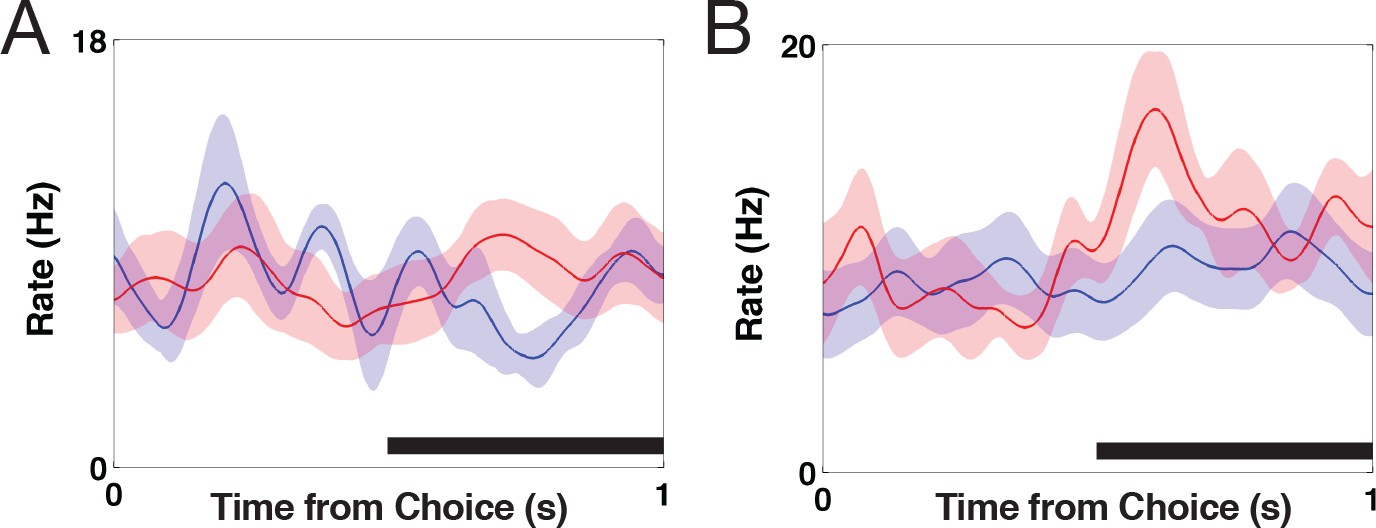
Uncertainty signaling in the STN.
(A) Peri-stimulus time histogram for the low wager (red) and high wager (blue) on 4-card trials referenced to the choice period ((8) = −1.89, = 0.09). f(B) Peri-stimulus time histogram for bet low (red) and bet high (blue) on 8-card trials referenced to the choice period((13) = −2.06, = 0.5). Both the 4- and 8-card trials represent an intermediate level of uncertainty and encode upcoming decisions during the 500 ms window (black bar).
Figure 2—figure supplement 4
STN activity during movement.
Peri-stimulus time histogram of all trials zeroed on button press for bet low (red) and bet high (blue) trials ((19)=0.68, = 0.5). The uncertainty signal occurs late in the choice period. To ensure that this was not movement related, we show that there was no differential STN activity around the button press.
Figure 3 with 1 supplement
Effect of intermittent stimulation on decision-making in the STN.
(A) Average z-scored reaction times by card (, ; ANOVA) and average raw reaction times (inset). Reaction times were the longest for the high-uncertainty trials and the lowest for the low-uncertainty trials. (B) Average percentage of high wagers by card value. Subjects did not significantly deviate from a 50/50 strategy (, ). (C) Bet high percentage by intermittent stimulation condition. Subjects displayed risk-averse behavior when stimulation was delivered prior to the choice period, placing a high wager 15% less than when stimulation was omitted (, ). (D) Bet high percentage on the no stimulation condition (square marker) and on the choice period condition (circle). The arrow indicates the direction of change, risk-averse (blue) or risk-seeking (red). 8/11 subjects displayed a trend towards risk-averse behavior. (E) Scatter plot of percentage change in high wagers during the choice period against high wager percentage on the no stimulation condition, for increases (red) and decreases (blue) in high wagers. Subjects that tended to place a high wager in the baseline (no stimulation) condition tended to experience the greatest change with stimulation. (F) Average z-scored reaction times for low (blue) and high (red) wagers by stimulation condition. No overall effect of stimulation was observed on reaction times (, ; ANOVA) or wager (, ; ANOVA). However, there was a difference in reaction times for high vs. low wagers selectively during the choice period (, ).
-
Figure 3—source data 1
SQLite database containing a single table: behavior.
The behavior table contains fields for ID, subject, session (session number), reactionTime (time in seconds), trialNumber (trial number), conditionNumber (condition number), pcard (player’s card), ccard (opponent’s card), leftChoice (value of wager mapped to left button), stimulation (stimulation condition), choice (wager), winLoss (outcome), value (value of wager).
- https://doi.org/10.7554/eLife.36460.015
Figure 3—figure supplement 1

Stimulator latency profile.
The implanted pulse generator is activated telemetrically by a hand-held controller. The controller is computer-controlled via a TTL pulse (blue trace). The latency between the rising edge of the TTL pulse and the onset of stimulation through the electrode contact is shown by the dashed line (n = 26; 174 0.002 ms; mean Sc.D.). The black trace represents an example stimulation train (five volts, 100 Hz). Baseline activity for the TTL pulse (blue trace) is adjusted for visualization.
Tables
Table 1
Summary table for neuroimaging and intraoperative study populations.
Mean and standard deviation data are given for 24 healthy control subjects (19 male, 5 female) and 6 Parkinson’s Disease patients (five men, one female).
| Mean | Standard Deviation | ||
|---|---|---|---|
| Neuroimaging (n = 24) | Age (years) | 36 | 7.5 |
| Intraoperative (n = 6) | Age (years) | 63.2 | 6.8 |
| Disease Duration (years) | 8.2 | 3.3 | |
| Levodopa dose (mg, daily) | 530 | 300 |
Table 2
Summary of neural task responses.
t-tests were performed for differences in neural responses across task epochs between low- and high-uncertainty trials. Windows of comparison, mean differences, t-values, and p-values are reported for the population with 13 degrees of freedom.
| Epoch | Window | T | P | |
|---|---|---|---|---|
| Fixation | 0–500 ms | −1.52 | 1.25 | 0.23 |
| Card | 0–500 ms | −1.34 | 0.70 | 0.49 |
| Choice | 0–500 ms | −1.79 | 1.31 | 0.21 |
| Choice | 500–1000 ms | −3.75 | 2.96 | 0.01 |
| Feedback | 0–500 ms | 0.17 | −0.17 | 0.86 |
Table 3
Summary table for intermittent stimulation study population.
Mean and standard deviation data are given for 13 subjects (12 men and one woman) who participated in the intermittent stimulation study.
| Mean (n = 13) | Standard Deviation | |
|---|---|---|
| Age (years) | 62.6 | 7.4 |
| Disease Duration (years) | 15.5 | 5.6 |
| Time since surgery (years) | 3.9 | 2.5 |
| Levodopa dose (mg, daily) | 575 | 310 |
| Therapeutic left voltage (volts) | 2.9 | 0.8 |
| Therapeutic right voltage (volts) | 2.9 | 0.7 |
| Therapeutic frequency (Hz) | 180 | 14.3 |
| Study voltage (volts) | 1.0 | 0.9 |
Table 4
Stimulation effect on individual subjects.
Fraction of high-wagers when stimulation was omitted and applied prior to the choice period. The change in decision-making is highlighted blue for a decrease and red for an increase in risk-seeking choices.
| No stim | pre-Choice | Change |
|---|---|---|
| 1.00 | 0.83 | blue-0.16 |
| 0.75 | 0.60 | blue-0.15 |
| 0.71 | 0.57 | blue-0.14 |
| 0.57 | 0.38 | blue-0.18 |
| 0.52 | 0.40 | blue-0.12 |
| 0.44 | 0.56 | red0.11 |
| 0.35 | 0.38 | red0.02 |
| 0.28 | 0.17 | blue-0.11 |
| 0.23 | 0.23 | 0.00 |
| 0.21 | 0.20 | blue-0.01 |
| 0.11 | 0.33 | red0.22 |
Additional files
-
Transparent reporting form
- https://doi.org/10.7554/eLife.36460.017
Download links
A two-part list of links to download the article, or parts of the article, in various formats.
Downloads (link to download the article as PDF)
Open citations (links to open the citations from this article in various online reference manager services)
Cite this article (links to download the citations from this article in formats compatible with various reference manager tools)
Intermittent subthalamic nucleus deep brain stimulation induces risk-aversive behavior in human subjects
eLife 7:e36460.
https://doi.org/10.7554/eLife.36460


