Focal optogenetic suppression in macaque area MT biases direction discrimination and decision confidence, but only transiently
- Johns Hopkins University, United States
- Columbia University, United States
- Washington National Primate Research Center, University of Washington, United States
Figures
Figure 1 with 1 supplement
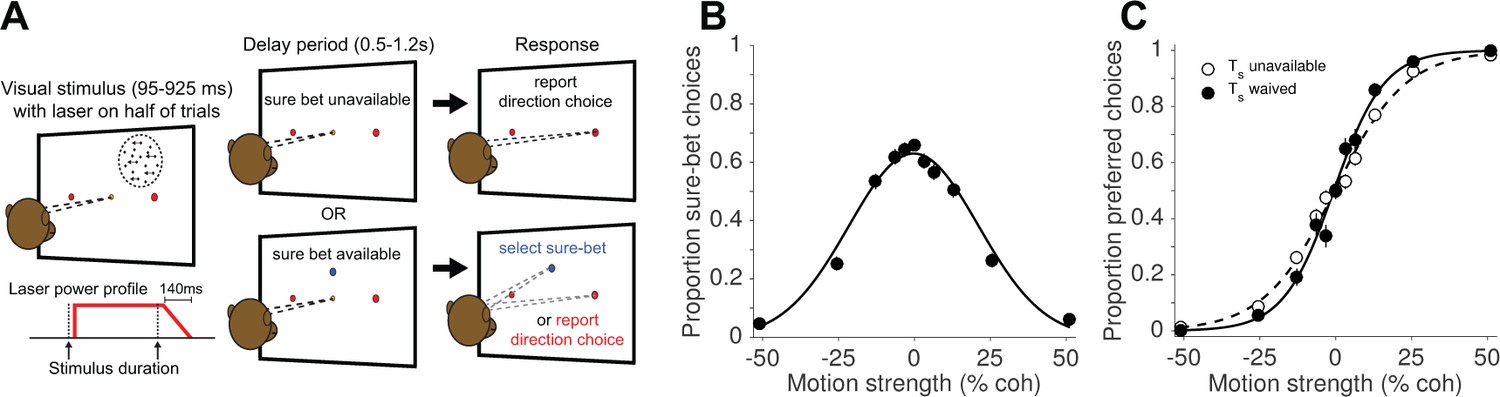
Direction discrimination task with post-decision wagering (PDW).
(A) The monkey fixates on a central fixation point to initiate the trial. Two red choice targets are presented, followed by a random-dot motion (RDM) stimulus in the receptive field of the recorded neurons (left panel), shown for an experimenter-controlled variable duration (Figure 1—figure supplement 1). On a random half of trials, a ‘sure-bet’ target (Ts) is presented (blue spot in the lower panels). After a delay period, the monkey can report his choice by a leftward or rightward saccade to one of the red targets to obtain a large juice reward if he is correct, or, if available, choose the sure-bet target for a small but guaranteed reward. On half of trials, including both Ts-present and Ts-absent trials, the RDM stimulus was accompanied by red laser illumination (step-rampdown power profile) of a cluster of neurons expressing the light-sensitive chloride pump Jaws. (B) Proportion sure-bet choices as a function of motion strength (‘confidence function’) for all no-laser trials (N = 2 monkeys, 23 sessions, 9912 trials). Error bars in B and C indicate standard errors of the proportions and are often smaller than the data points. (C) Proportion of preferred-direction choices as a function of motion strength (‘choice function’) for all no-laser trials, separated by whether the sure-bet option was unavailable (dashed) or available but waived (solid).
-
Figure 1—source data 1
Data and Matlab code for reproducing all panels and figure supplements for Figure 1.
- https://doi.org/10.7554/eLife.36523.004
Figure 1—figure supplement 1
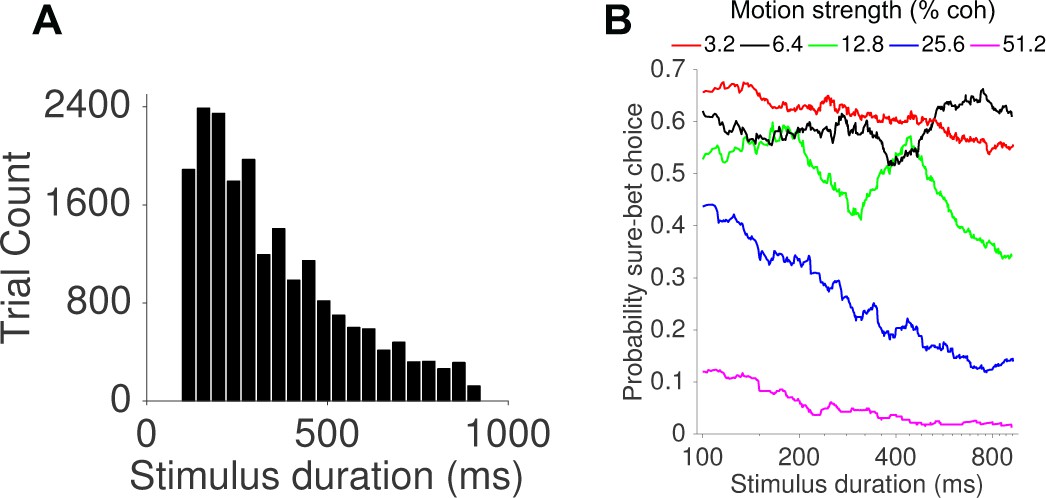
Distribution of viewing duration and its effect on confidence.
(A) Histogram of the duration of visual stimuli (and photosuppression for laser trials, not including the ramp-down). Duration on each trial was drawn from a truncated exponential distribution with range 95–925 ms and median 300 ms. (B) The probability of sure-bet choices as a function of stimulus duration and motion strength.
Figure 2
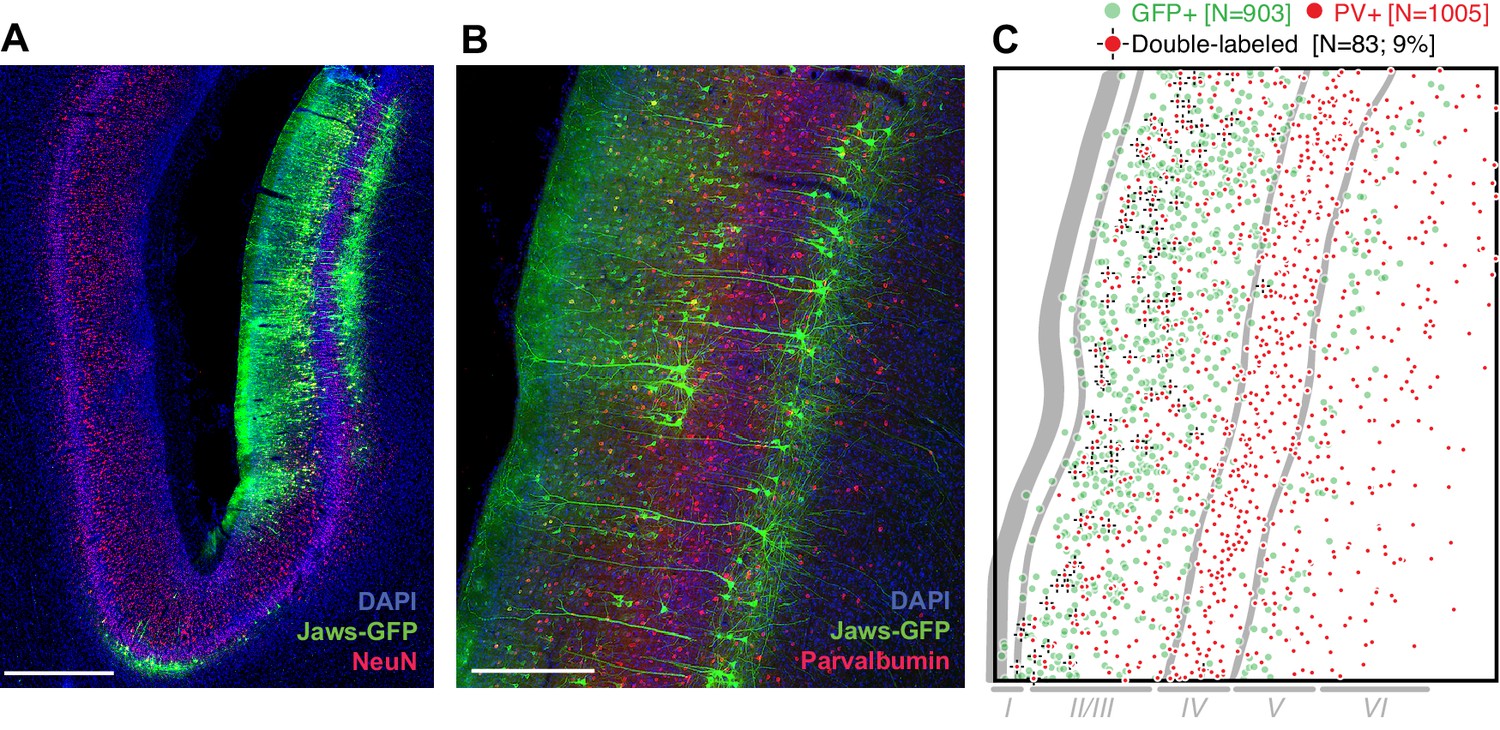
Transduction of neurons in macaque lateral intraparietal area (LIP) by AAV-CamKIIα-Jaws-KGC-GFP-ER2.
(A) Histological section imaged at 10X showing expression of Jaws (green) following a series of viral vector injections along a single injectrode penetration in area LIP (different monkey and brain area than was tested in experiments described below). Expression was strongest in layers II/III and V. Red: NeuN. Blue: DAPI. Scale bar = 1 mm. (B) 20X image of a nearby section stained for Jaws-GFP (green) and the inhibitory marker parvalbumin (PV, red). Scale bar = 500 µm. (C) Cell counts from the image in B, quantifying the small but nontrivial minority of neurons double-labeled for Jaws-GFP and PV. Approximate layer boundaries are indicated in gray.
Figure 3 with 2 supplements

Photosupression of neural activity in area MT.
(A) Fractional change in firing rate of isolated single units (N = 26) in response to a high-coherence RDM stimulus and laser suppression, relative to RDM stimulus alone. Single-unit data were collected during a fixation task. The inset shows the fractional change in multi-unit activity recorded at the 23 sites tested in the discrimination task. (B) Average firing rate (peristimulus time histogram) of single units showing significant Jaws-mediated suppression (N = 20). Laser onset occurred 20 ms after stimulus onset, resulting in suppression that preceded the onset of visually-driven activity (i.e., firing rate driven below baseline, then recovered to near-baseline levels during visual stimulation). A post-suppression rebound of activity was observed after turning off the laser (and visual stimulus). All PSTHs depict spike counts in 1 ms bins convolved with a 40 ms causal boxcar filter and converted to spikes/s (C, D) Average multi-unit activity for N = 23 sites passing the selection criteria for the behavioral experiment (see Materials and methods), aligned to stimulus (dots) onset (C) and offset (D). The majority of sessions included a ramp-down of 140 ms in laser power starting 20 ms after stimulus offset, reducing the post-suppression burst seen when no ramp-down was used (inset). Shaded region shows ± SEM. Figure 3—figure supplement 1 shows an estimated spatial distribution of irradiance based on Monte Carlo simulations of light transmission in brain tissue, and Figure 3—figure supplement 2 illustrates an example of varying laser power at a fixed distance.
-
Figure 3—source data 1
Data and Matlab code for reproducing all panels and figure supplements for Figure 3.
- https://doi.org/10.7554/eLife.36523.009
Figure 3—figure supplement 1
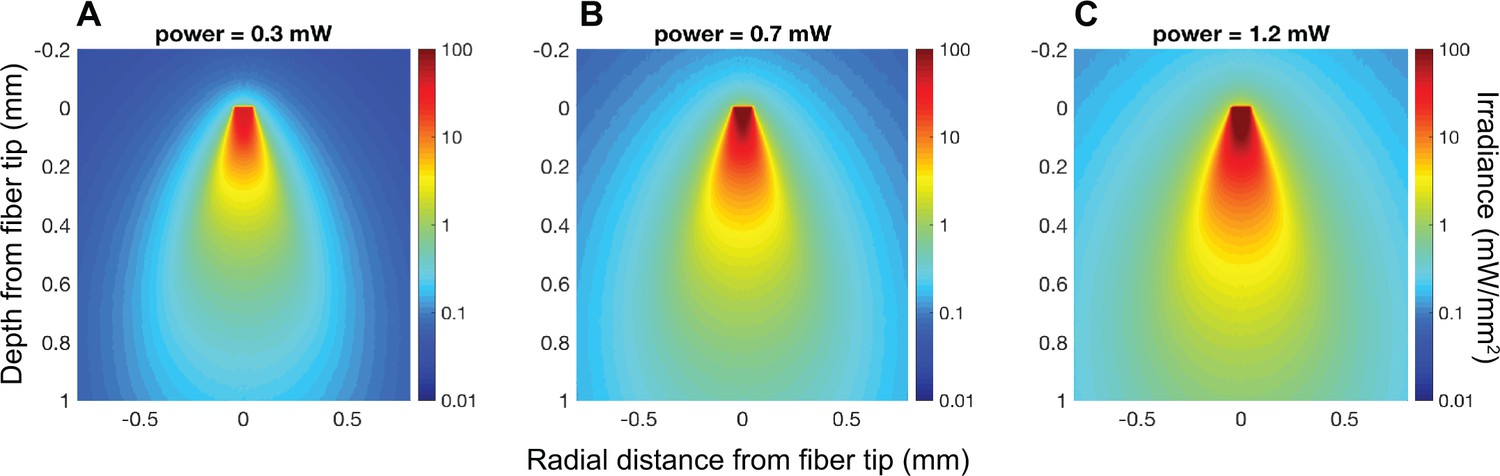
Predicted irradiance based on Monte Carlo simulations of light transmission in brain tissue (validated with previously published in-vivo measurements; Stujenske et al., 2015), for three different levels of total laser power: 0.3 mW (A), 0.7 mW (B), and 1.2 mW (C) at a wavelength of 633 nm.
Panel B is closest to the average power level used in the majority of our experiments. The shape of the spatial distribution of light intensity is only approximate because the simulations did not take into account the tapered fiber tip (see supplemental material in Dai et al., 2014). Nevertheless, the simulations indicate that irradiance drops below 3–5 mW/mm2 (incapable of driving strong photocurrent) at distances greater than 400–500 µm.
Figure 3—figure supplement 2
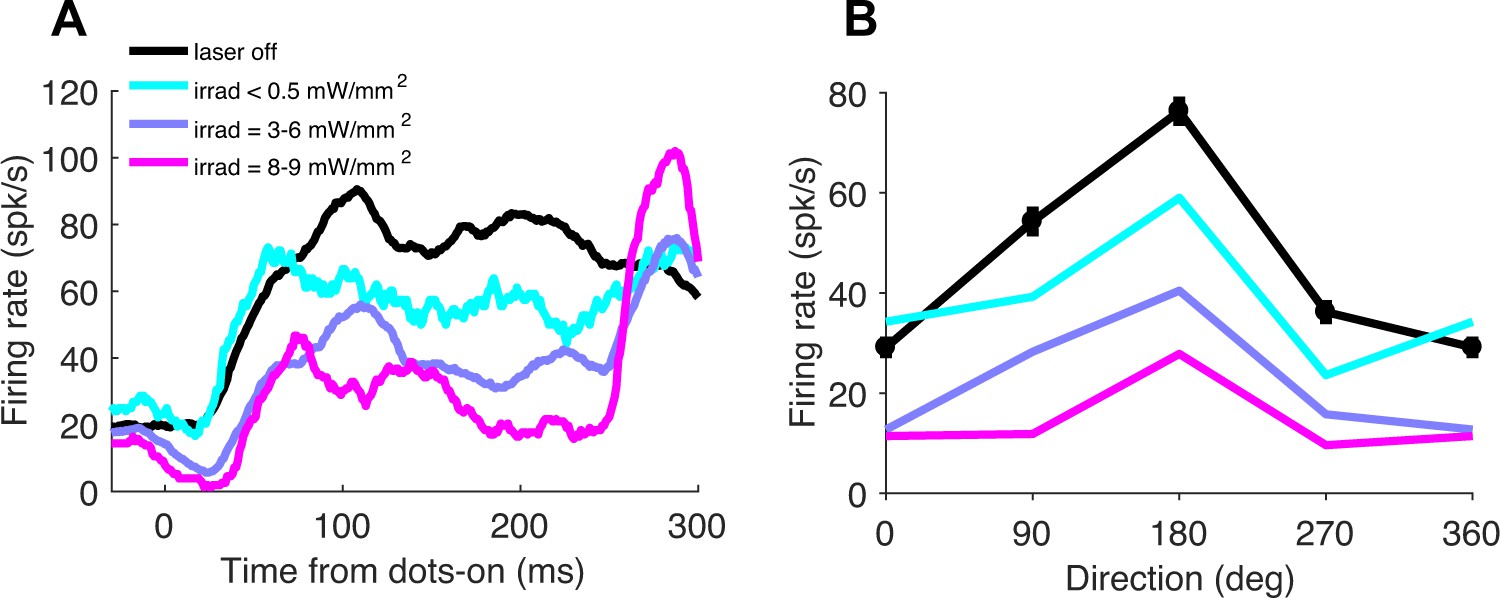
Titration of laser power.
(A) Average multiunit response (PSTH) to preferred-direction motion (99% coherence) for N = 5 mapping sessions where laser power was varied systematically at a fixed distance (~350 µm fiber-to-electrode separation). Each site was tested with at least three power levels (converted to predicted irradiance) within the ranges indicated. Prior to commencing the discrimination task, a power level was chosen such that activity was suppressed roughly to the level exemplified by the purple and magenta traces (3–9 mW/mm2) but erring on the side of lower power. (B) Average firing rates as a function of motion direction (tuning curve) for the same five sessions, aligned such that the preferred direction was 180 deg. Error bars are ± SEM, shown only for the black trace for clarity.
Figure 4 with 3 supplements
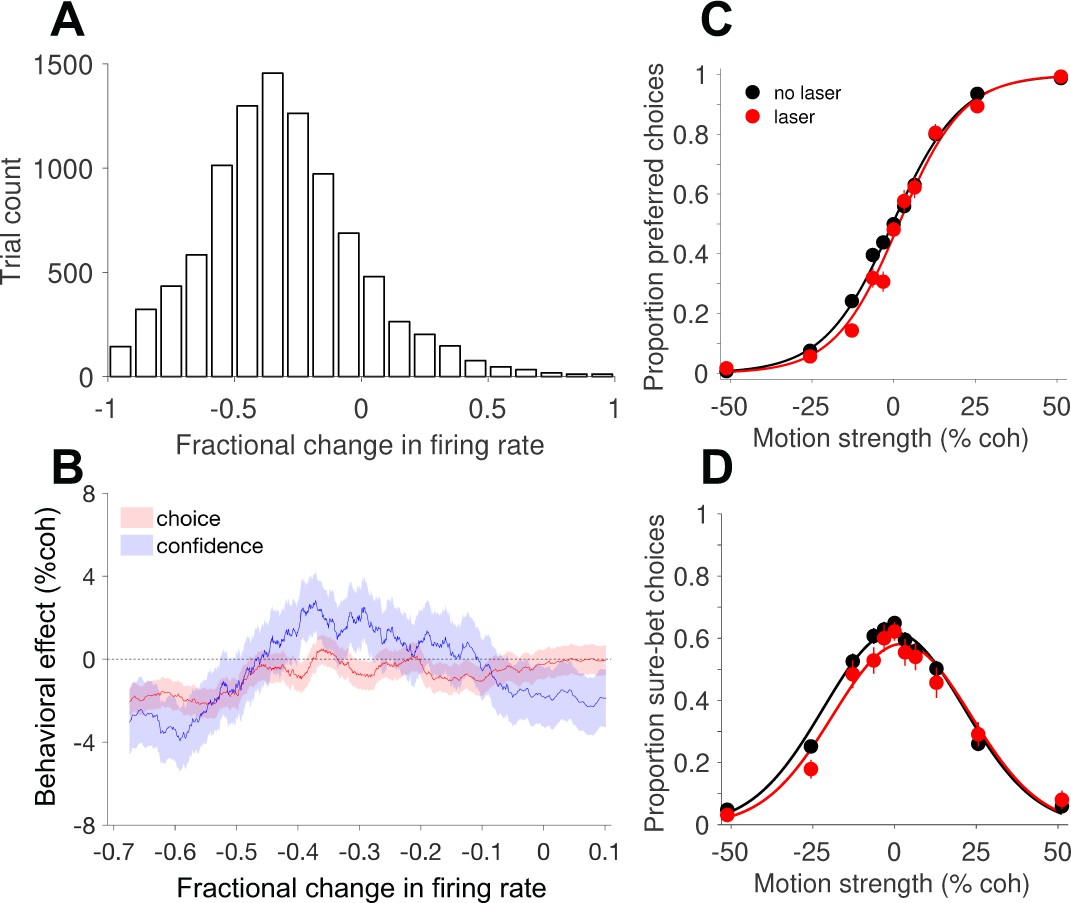
Behavioral effects of photosuppression depend on the magnitude of reduction in neural activity.
(A) Histogram of the fractional change in multi-unit firing rate (∆R) on laser trials, relative to the mean on no-laser trials for the corresponding session and trial type (Equation 4). (B) Behavioral effects, expressed as the horizontal shift in the choice function (Equation 1, red) and bell-shaped confidence function (Equation 3, blue), plotted as a function of ∆R. Each abscissa coordinate represents the mean of a sliding quantile, hence all the data in A are represented even though the abscissa range is different. Shaded error regions indicate ± SEM. Figure 4—figure supplement 2 shows the results of a corresponding control analysis of no-laser trials. (C) Choice functions for the set of laser trials (red) exhibiting strong suppression (∆R < −0.45, N = 3107 trials) compared to all no-laser trials (black, N = 9249 trials). (D) The corresponding confidence functions (proportion sure-bet choices as a function of motion strength) for the set of trials shown in C. For comparison, Figure 4—figure supplement 1 shows the effects of electrical microstimulation from previous experiments in monkey D, and Figure 4—figure supplement 3 shows the distribution of effects session by session, including all trials irrespective of ∆R and other influencing factors (see below).
-
Figure 4—source data 1
Data and Matlab code for reproducing all panels and figure supplements for Figure 4.
- https://doi.org/10.7554/eLife.36523.014
Figure 4—figure supplement 1
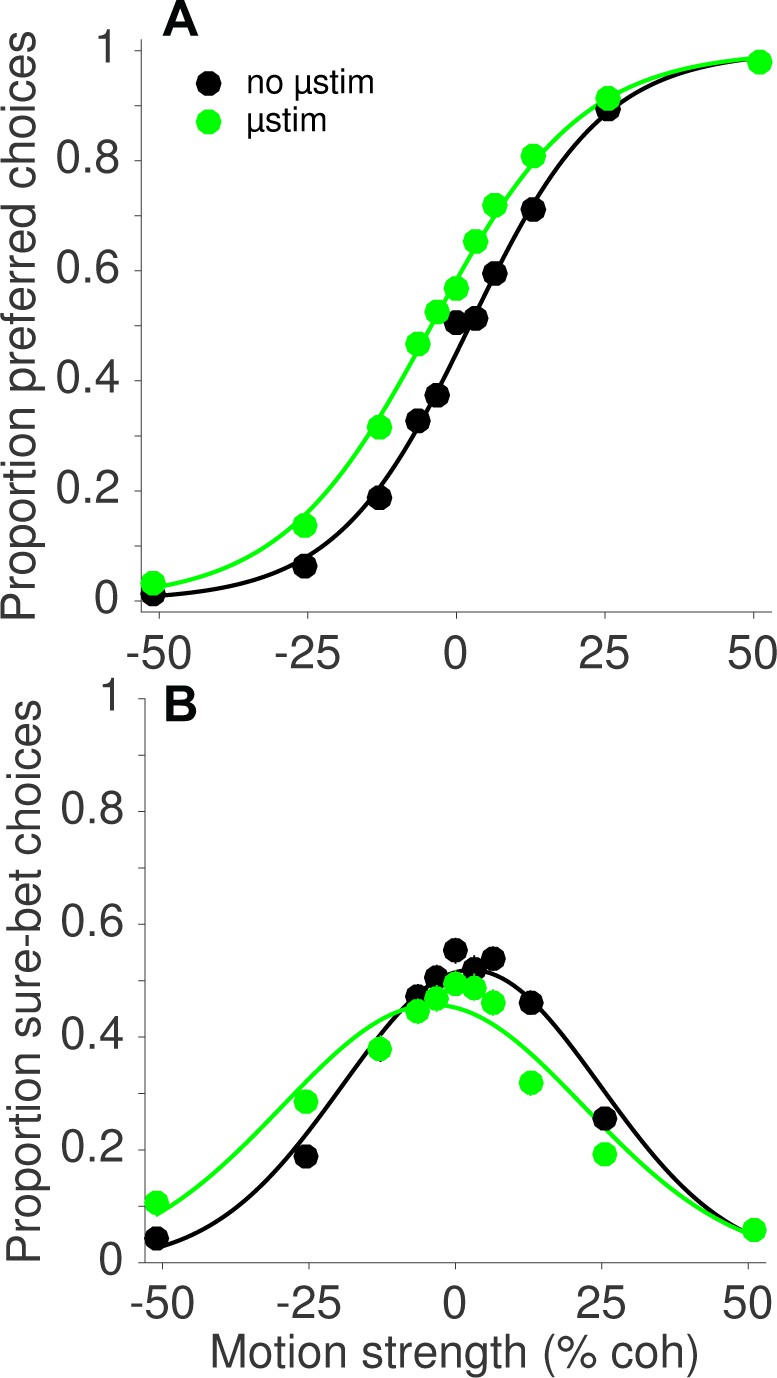
Effects of electrical microstimulation (µStim) on choice and confidence.
Data are shown from one monkey used in a previous study (Fetsch et al., 2014a) who also participated in the present study, showing (A) a leftward shift of the choice function on µStim trials (green) and (B) a corresponding shift in the confidence function.
Figure 4—figure supplement 2
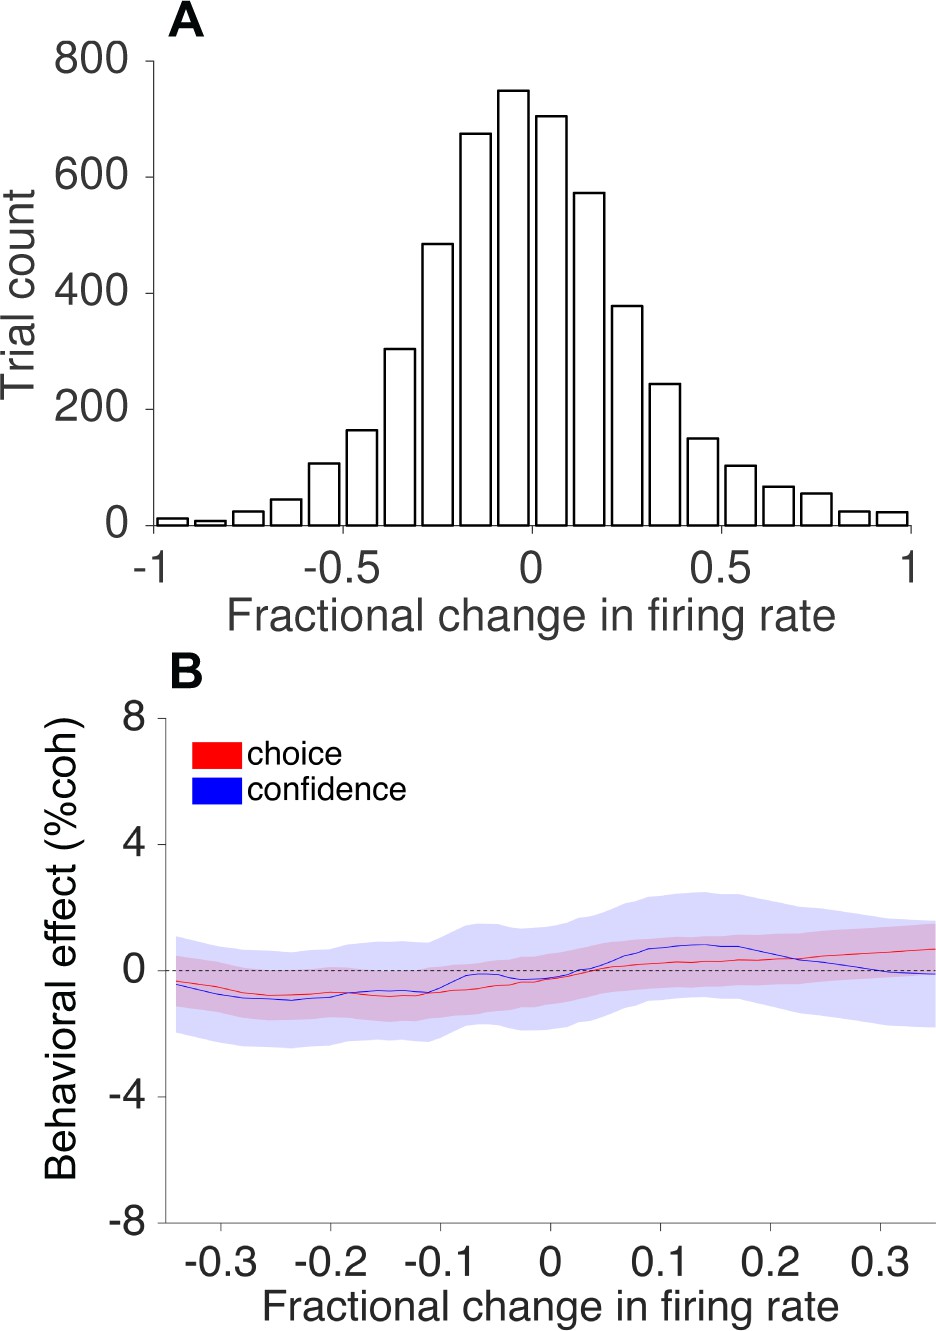
Sham-laser control analysis.
Similar to Figure 4A+B but using only no-laser trials, to test whether variability in recorded neural activitycan explain shifts in choice and confidence functions even in the absence of photosuppression. (A) Distribution of fractional difference in firing rate for each no-laser trial relative to the mean of trials from the corresponding session and trial type. (B) Sliding-window analysis of randomly assigned ‘sham-laser’ trials sorted by the abscissa value in A, showing only a weak, nonsignificant relationship between fluctuations in firing rate and shifts in the choice and confidence functions.
Figure 4—figure supplement 3
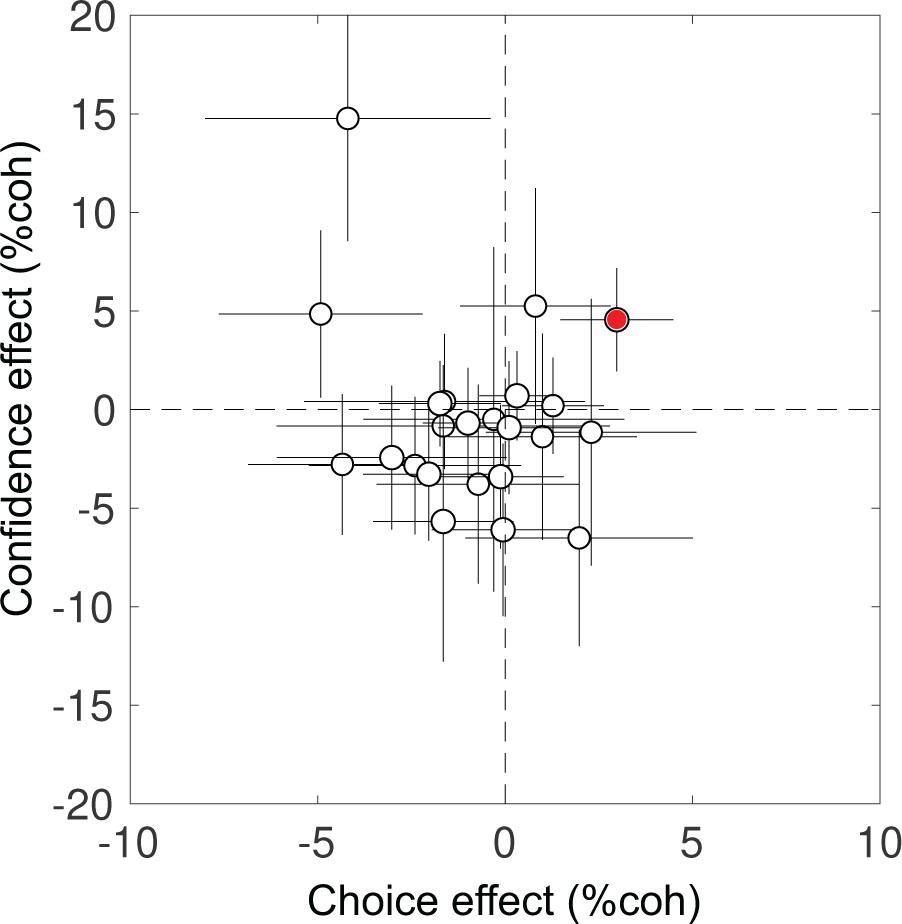
Behavioral effects on individual sessions.
Effects of photosuppression on choice (abscissa) and confidence (ordinate) based on all trials in each session (N = 23, mean = 872 trials per session, S.D. = 487 trials). Negative values indicate effects in the predicted direction based on the motion selectivity of the recorded neurons. Red filled symbol shows one ‘paradoxical’ outlier session with positive shifts in both choice (p=0.05) and confidence (p=0.07) that showed similar attenuation as a function of trial number and duration (see Materials and methods). Error bars are ± SEM.
Figure 5
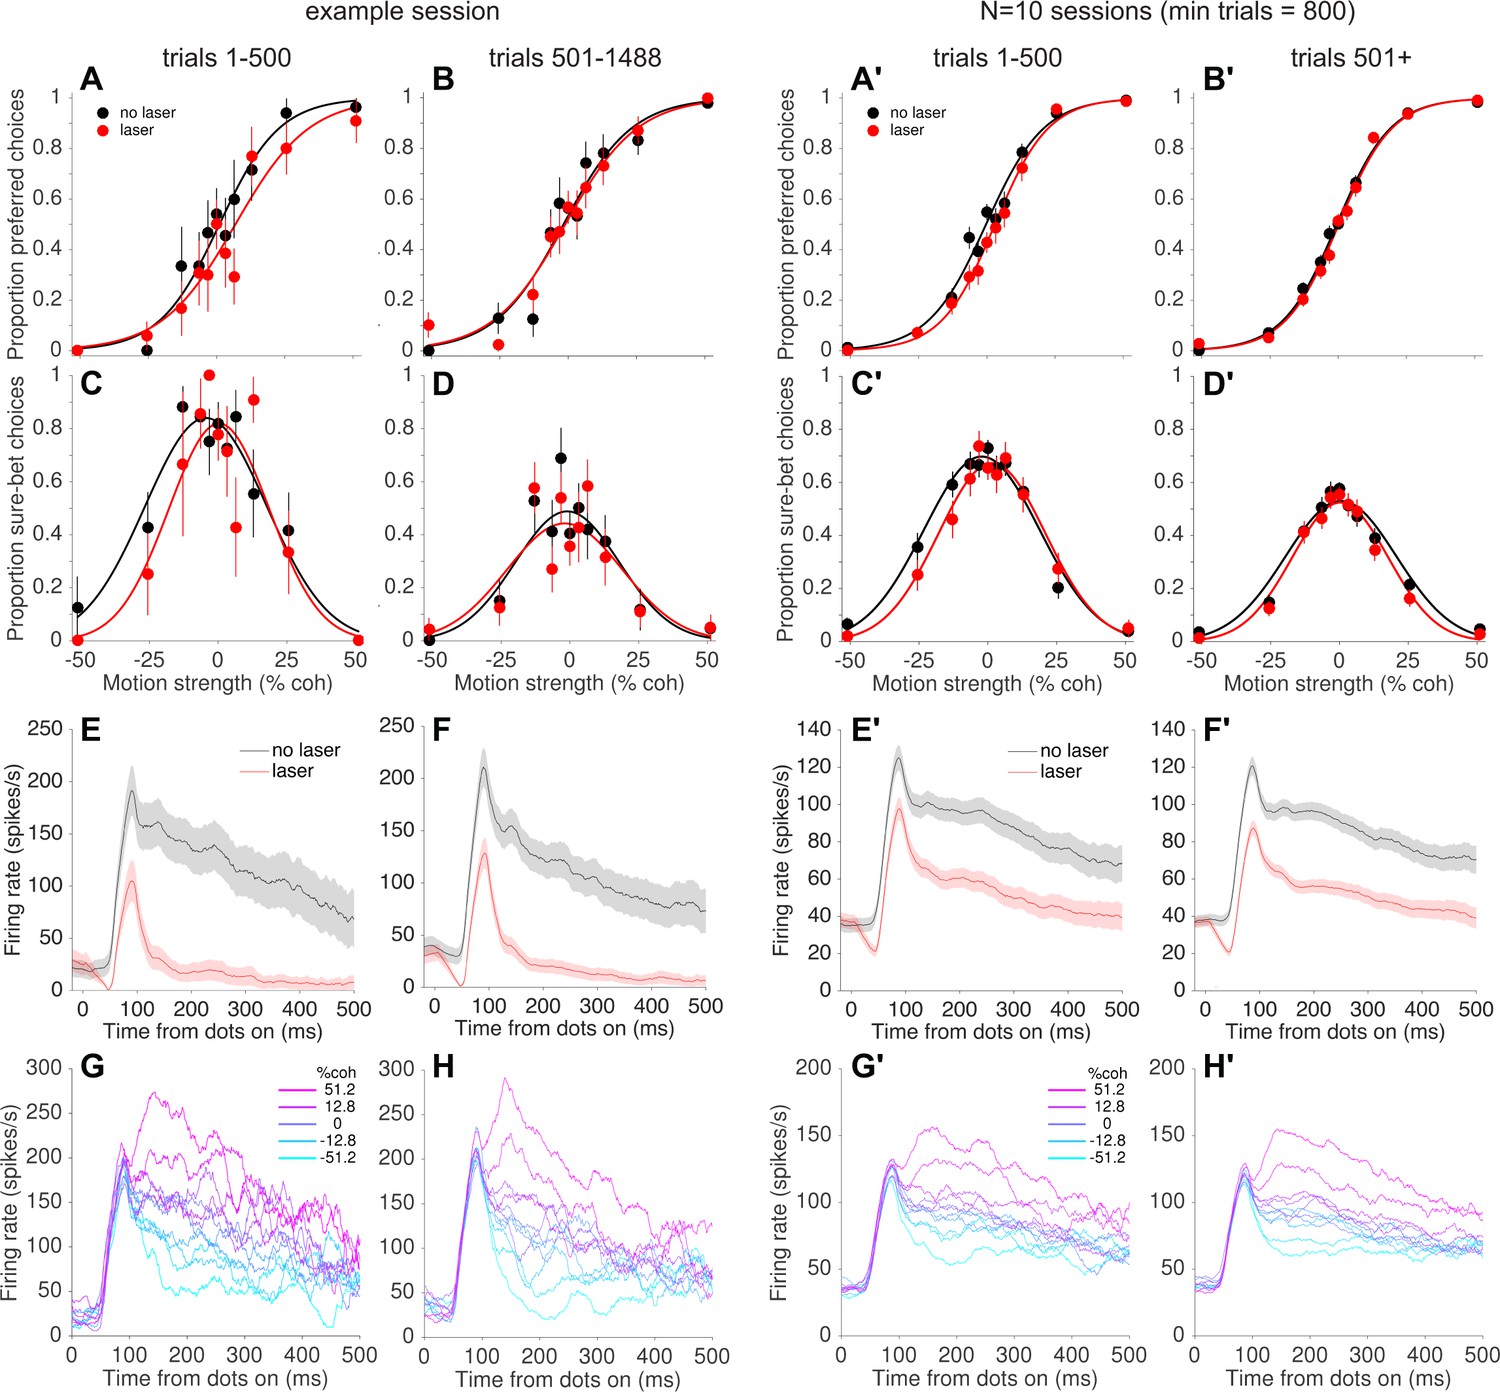
Behavioral, but not neural, effects of photosuppression dissipated over time within a session.
(A, B) Choice functions for laser (red) and no-laser (black) trials for an example session, separated by trials early within the session (A, trials 1–500) versus later in the same session (B, trial number >500). Error bars show standard error of the proportions. (C, D) Corresponding confidence functions for the same groups of trials in A and B, respectively. The decrease in overall sure-bet proportion between C and D, indicating an increase in overall confidence over the course of a session, was a behavioral peculiarity of one monkey that was unrelated to photosuppression (i.e., occurred throughout training and in no-laser control sessions). (E,F) Average multi-unit activity showing a similar degree of suppression for early (E) and late (F) trials. Shaded regions indicate ± SEM. (G,H) Average firing rate on no-laser trials, early (G) vs. late (H) in the session, separated by signed motion coherence (positive = preferred direction, magenta; negative = null (antipreferred) direction, cyan). (A'–H') Same as A–H but for all sessions with >800 trials (N = 10 sessions, 4438 laser trials with ∆R < −0.25, 6489 no-laser trials).
-
Figure 5—source data 1
Data and Matlab code for reproducing all panels for Figure 5.
- https://doi.org/10.7554/eLife.36523.016
Figure 6 with 2 supplements

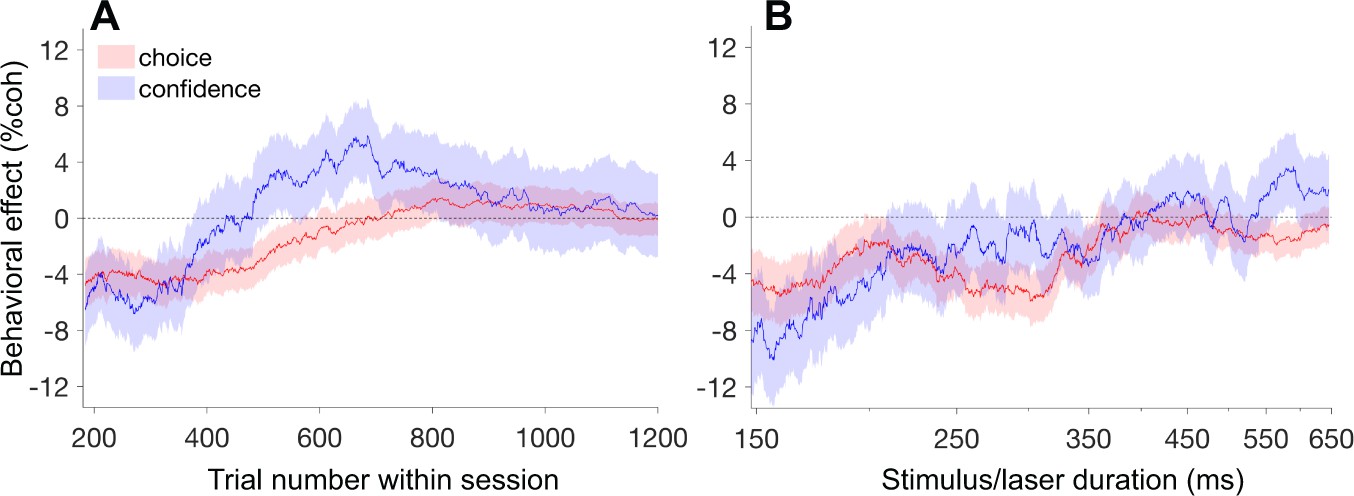
Attenuation of behavioral effects of photosuppression on long and short time scales.
(A) Shifts of the choice (red) and confidence (blue) functions (± SEM) as a function of trial number (~8 min per 100 trials). Trials were pooled across sessions, conditioned on ∆R < −0.25 and duration <300 ms (N = 8057), and behavioral effects (Equations 1 and 3) were calculated over a sliding window of 1750 trials sorted by trial number. (B) Corresponding sliding-window analysis of trials sorted by stimulus/laser duration, after conditioning on ∆R < −0.25 and trial number <500. N = 7381 trials, window width = 1600 trials. Figure 6—figure supplement 1 shows the absence of such attenuation in µStim data collected previously. Figure 6—figure supplement 2 repeats these analyses after omitting one outlier session (see Materials and methods and Figure 4—figure supplement 3).
-
Figure 6—source data 1
Data and Matlab code for reproducing all panels and figure supplements for Figure 6.
- https://doi.org/10.7554/eLife.36523.020
Figure 6—figure supplement 1
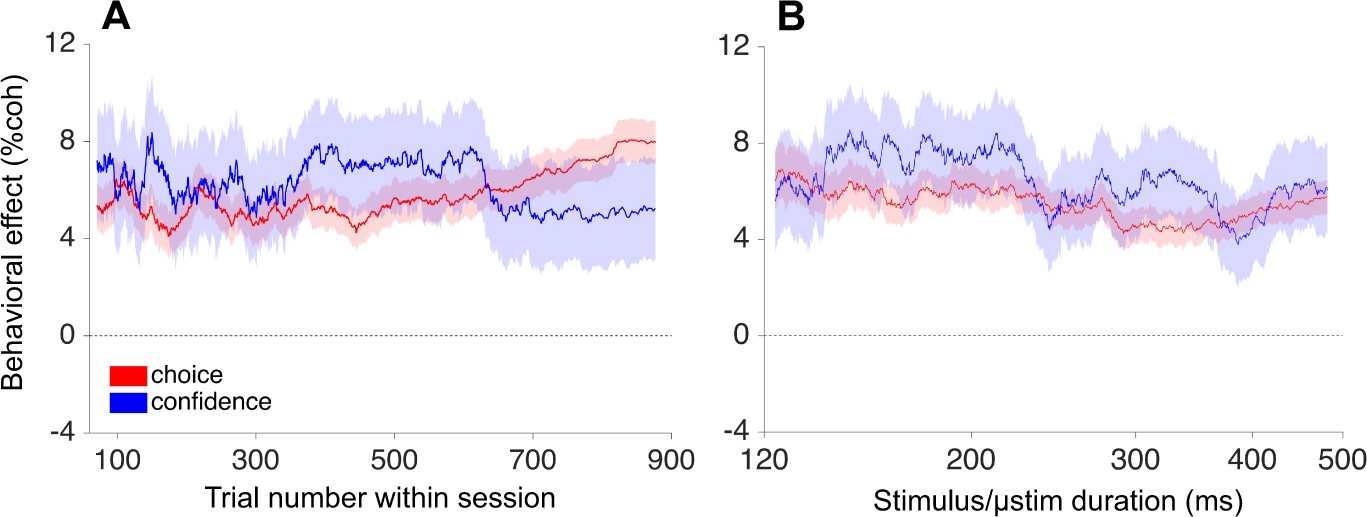
Effects of electrical microstimulation (µStim) as a function of trial number and duration.
(A,B) Results of the same analyses shown in Figure 6, applied to a previously obtained µStim dataset (see also Figure 4—figure supplement 1). The compensatory effects seen with photosuppression were essentially absent for µStim, which produced relatively consistent effects on choice and confidence over the course of the session (A) and on trials of different duration (B).
Figure 6—figure supplement 2
Results of Figure 6A–B after omitting one outlier session (see Materials and methods and Figure 4—figure supplement 3).
https://doi.org/10.7554/eLife.36523.019
Figure 7
Compensation on a sub-second time scale.
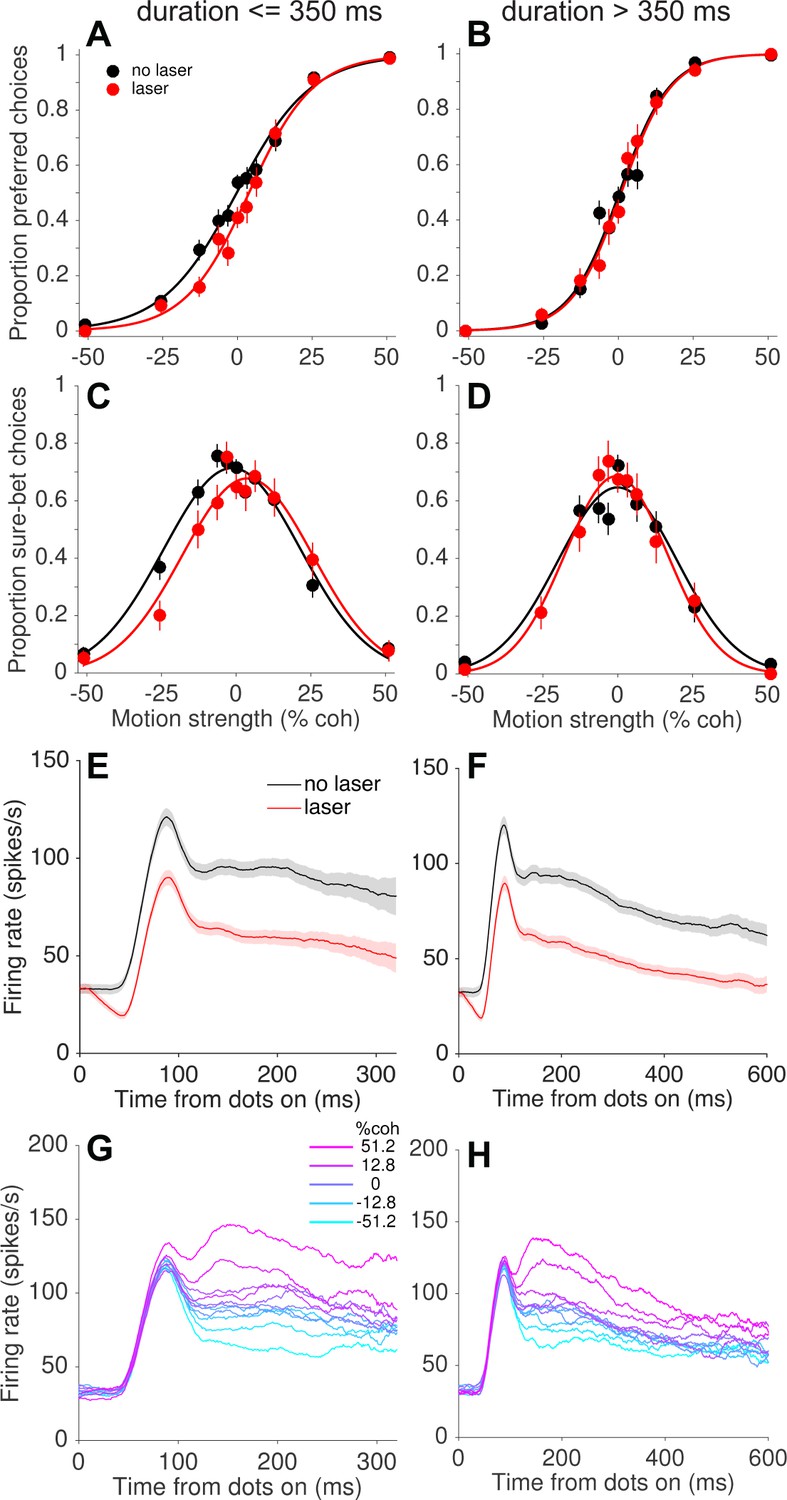
Behavioral effects of photosuppression were present on trials with stimulus/laser epochs of short duration but not of longer durations (left and right columns, respectively), whereas the degree of suppression and direction selectivity were similar across durations. Format as in Figure 5. Data include trials with ∆R < −0.25 and trial number <500 (N = 4249 and 3132 trials for left and right columns, respectively). All durations were randomly interleaved.
-
Figure 7—source data 1
Data and Matlab code for reproducing all panels for Figure 7.
- https://doi.org/10.7554/eLife.36523.022
Author response image 1
Behavioral effects of photosuppression in one ‘paradoxical’ session, separated by: early trials (A-B) versus late trials (C-D); and short durations (E-F) versus long durations (G-H).
https://doi.org/10.7554/eLife.36523.024
Author response image 2

Qualitative estimate of the spatial extent of photosuppression, furnished by multiunit recordings during pilot mapping sessions using a 16-channel linear array (V-Probe, Plexon Inc.; N=3 sessions).
Left panel: The optical fiber was glued to the probe at a known position near one of the central contacts, which were spaced 150 µm apart. Right panel: Fractional change in firing rate (+/- SEM) as a function of distance from the fiber tip (N=3 sessions). Total power for these sessions was 0.6-0.9 mW, eliciting suppression that was limited to a distance of 300 µm (although these neurons were less light-sensitive than we typically observed).
Author response image 3

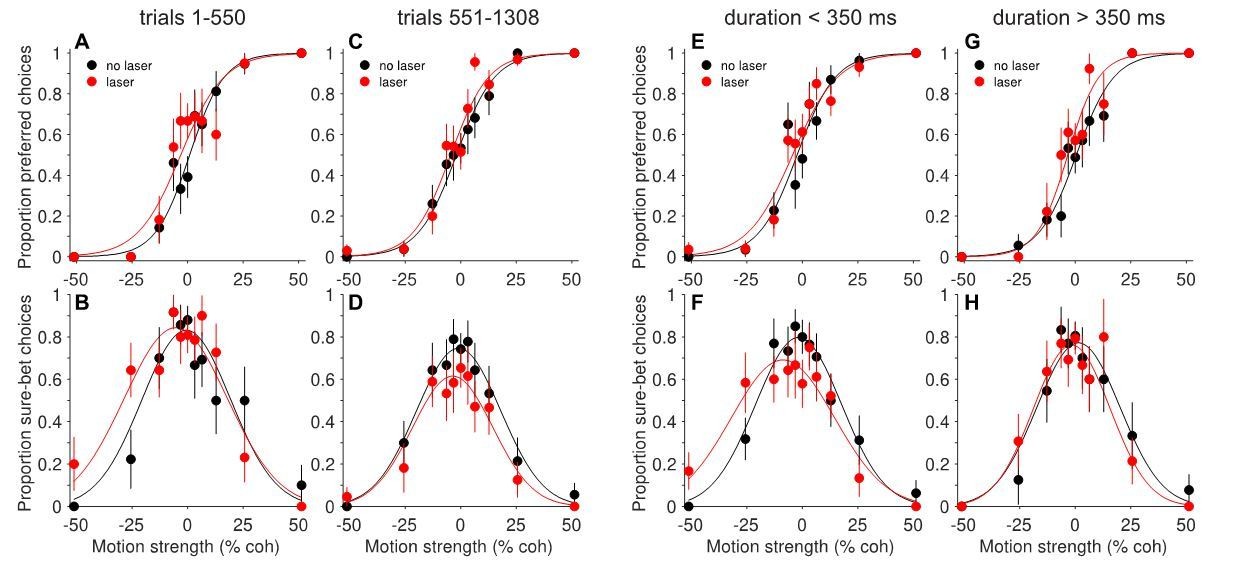
Behavioral effects of photosuppression as a function of trial number within session (left column) and stimulus/laser duration (right column), as in main text Figure 6, plotted separately for the two monkeys.
Note that the abscissa range in panel C was chosen to facilitate comparison with panel A; the inset shows the full extent of trial numbers for monkey N.
Author response image 4
Fits to a bounded accumulation model (Fetsch et al., 2014) using the data shown in main text Figure 5A'+C' (left column) and Figure 7A+C (right column).
The model implements the biasing effect of photosuppression – on both choice and confidence – as an offset to the mean of the momentary evidence (i.e., motion strength). It also has free parameters that permit a change in the drift rate (sensitivity) and/or the sensory noise on laser trials. These parameters can account for more subtle effects including changes in the slope of the choice function, and the height and width of the confidence function. Importantly, however, the mechanism for establishing confidence still operates on the same decision variable as the one used for choice.
Download links
A two-part list of links to download the article, or parts of the article, in various formats.
Downloads (link to download the article as PDF)
Open citations (links to open the citations from this article in various online reference manager services)
Cite this article (links to download the citations from this article in formats compatible with various reference manager tools)
Focal optogenetic suppression in macaque area MT biases direction discrimination and decision confidence, but only transiently
eLife 7:e36523.
https://doi.org/10.7554/eLife.36523


