Dynamics of human protein kinase Aurora A linked to drug selectivity
- Howard Hughes Medical Institute, Brandeis University, United States
- University of Massachusetts Medical School, United States
Figures
Figure 1

Dephosphorylated Aurora A samples both the active and inactive conformation.
(A) Superposition of X-ray structures of dephosphorylated Aurora A (residues 122–403) with Mg2+·AMPPCP (AMPPCP in gray sticks and magnesium as yellow sphere) in the inactive (cyan, PDB 4C3R [Zorba et al., 2014]) and active (orange, PDB 6CPF) state, solved from crystals of the same crystallization well. (B) Zoom-in of (A) to visualize the nucleotide binding region (K162, D274, and E181), the R-spine (L196, Q185, F275, H254, and D311) and the activation loop region (D256, K258, and T292). (C) Same zoom-in as in (B), but dephosphorylated Aurora A in active state (orange) is superimposed with phosphorylated Aurora A (red, PDB 1OL7 [Bayliss et al., 2003]). (D) Superposition of the DFG(W) motif in the three states shown in (B) and (C). (E) Superposition of phosphorylated Aurora A in active conformation (red) and apo, dephosphorylated Aurora A also in the active conformation (yellow, PDB 6CPE). (F) Zoom-in of (E) showing the same region as in (B).
Figure 2
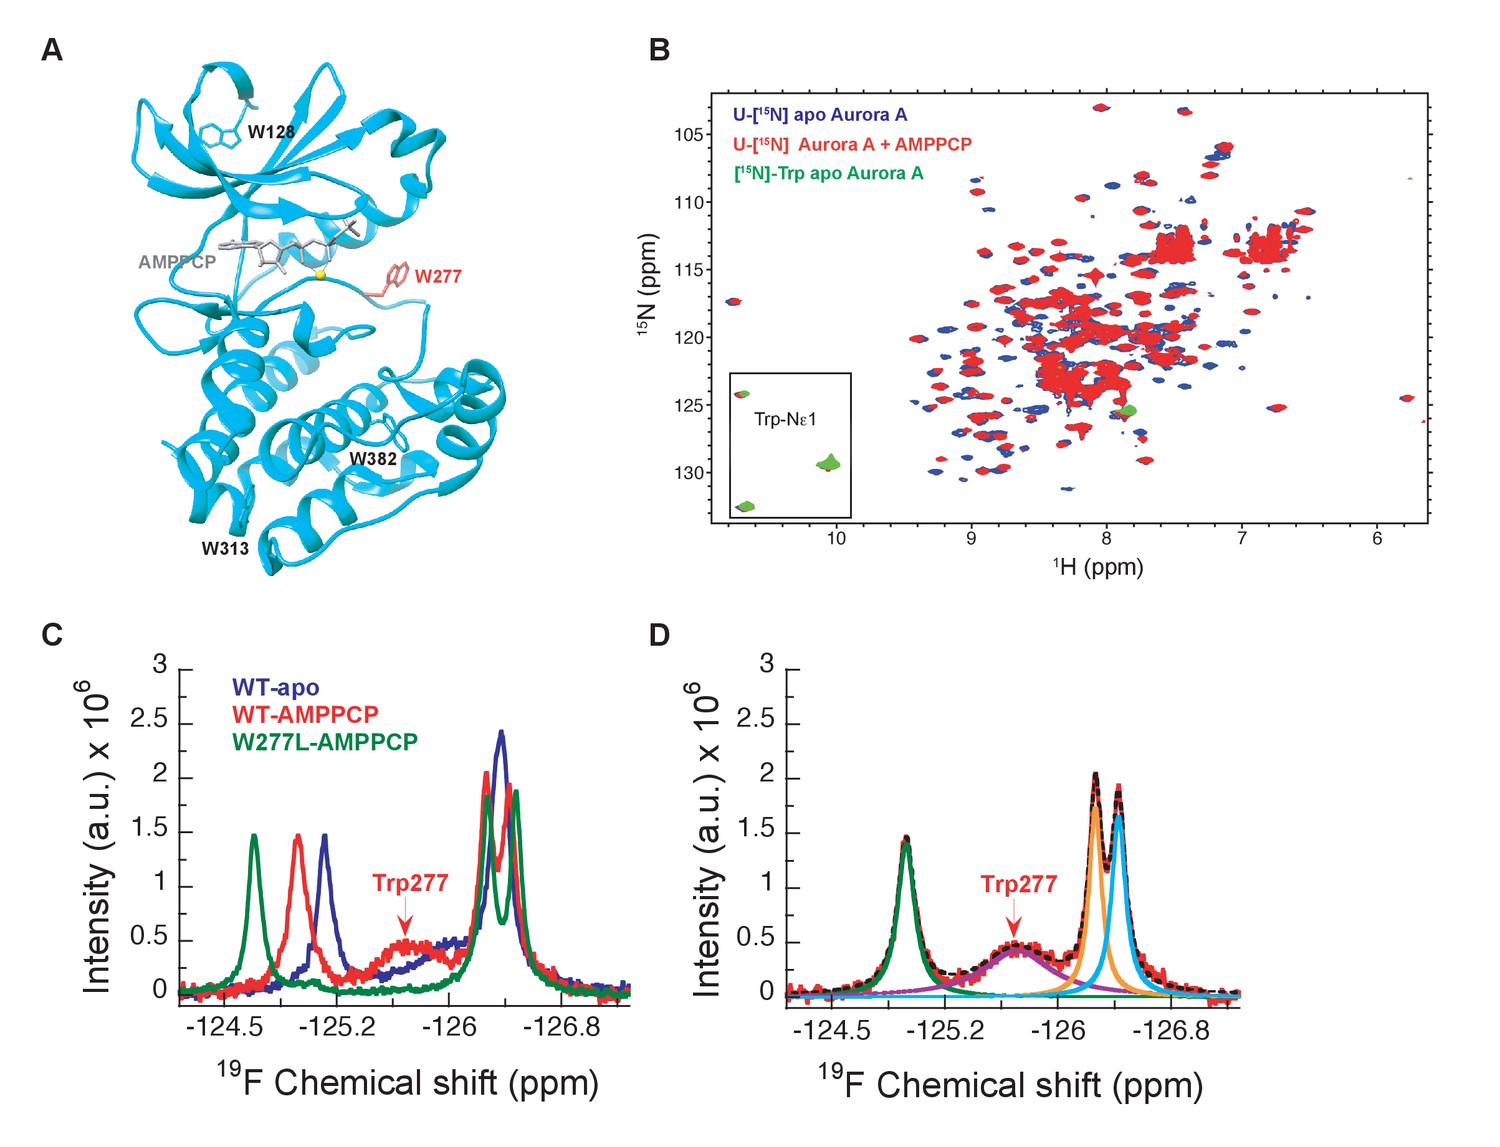
NMR spectra indicate extensive dynamics of the DFG-loop.
(A) The four tryptophan residues in Aurora A are shown on the structure (PDB 4C3R [Zorba et al., 2014]) in stick representation; Trp277 in the DFGW-loop is highlighted in red. (B) Overlay of [1H-15N]-TROSY-HSQC spectra of dephosphorylated Aurora A in its apo-state (U-[15N], blue; [15N]-Trp, green) and AMPPCP-bound (U-[15N], red). Only three instead of the four expected cross peaks for tryptophan side chains are detected. (C) 19F NMR spectra of 5-fluoro-Trp labeled dephosphorylated wild-type Aurora A (apo in blue and AMPPCP-bound in red) and the W277L Aurora A mutant bound to AMPPCP (green). The assignment of Trp277 following the DFG-loop is shown. (D) 19F spectrum of wild-type Aurora A bound to AMPPCP (red) together with its deconvolution into four Lorentzian line shapes, the overall fit is shown as a black, dotted line. The integrals for all four signals are equal, but the linewidth for Trp277 (purple) is approximately 5-fold larger.
Figure 3
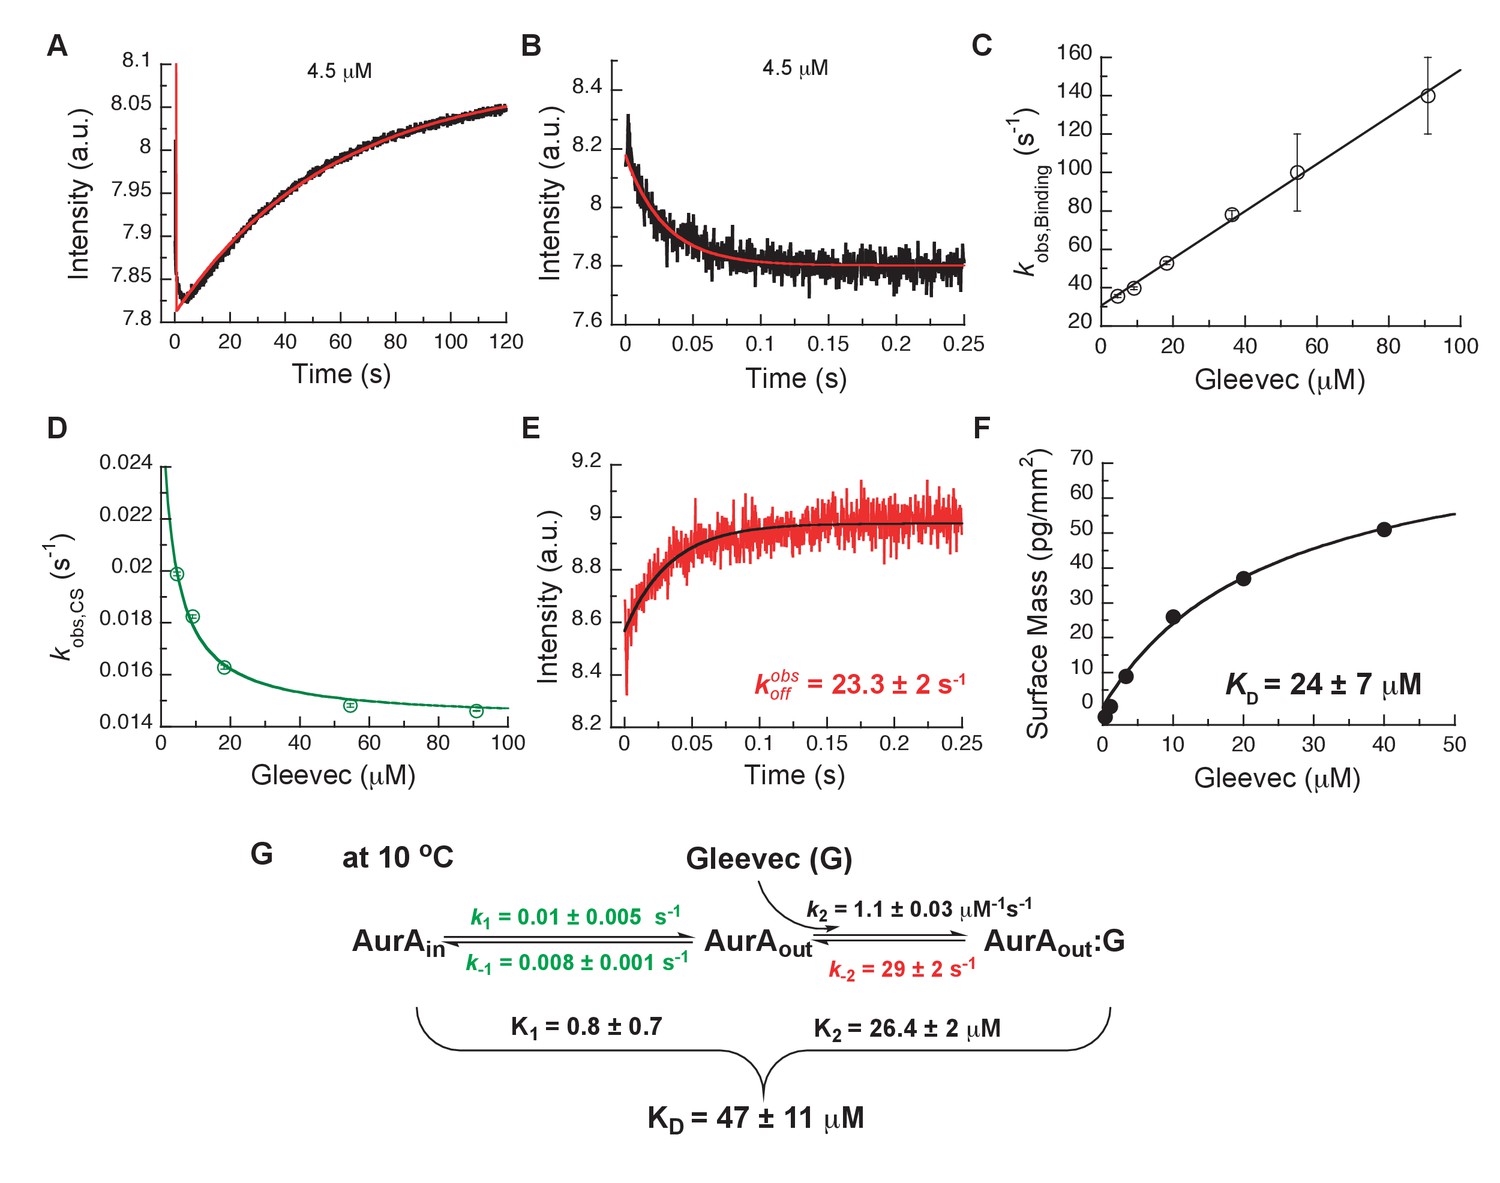
Kinetics of Gleevec binding to Aurora A at 10°C measured by stopped-flow Trp fluorescence to dissect all binding steps.
(A) Kinetics after mixing 0.5 µM Aurora A with 4.5 µM Gleevec is double exponential with a fast decrease and a slow increase in fluorescence signal. (B) The decrease in fluorescence intensity due to the fast binding phase was completed within 0.25 s. (C) Observed rate constants of fast binding phase were plotted against increasing concentrations of Gleevec (= 1.1 ± 0.3 µM−1s−1, = 31 ± 2 s−1 from the y-intercept). (D) The increase in fluorescence intensity of slow phase (A) is attributed to conformational selection. The plot of of this slow phase versus Gleevec concentration was fit to Equation 1 and yields = 0.014 ± 0.001 s−1 and = 0.011 ± 0.002 s−1. (E) Dissociation kinetics of pre-incubated solution with 5 µM Aurora A and 5 µM Gleevec measured by stopped-flow fluorescence after an 11-fold dilution of the complex yields the = 23.3 ± 2 s−1. (F) The macroscopic dissociation constant () of Gleevec binding to Aurora A measured by Creoptix WAVE. (G) Gleevec (labeled as G) binding scheme to Aurora A corresponds to a two-step binding mechanism: conformational selection followed by the physical binding step. The corresponding microscopic rate constants obtained from the global fit and calculated overall equilibrium and dissociation constants are shown. Fluorescence traces are the average of at least five replicate measurements (n > 5), and error bars and uncertainties given in C-G denote the (propagated) standard deviation in the fitted parameter.
Figure 4
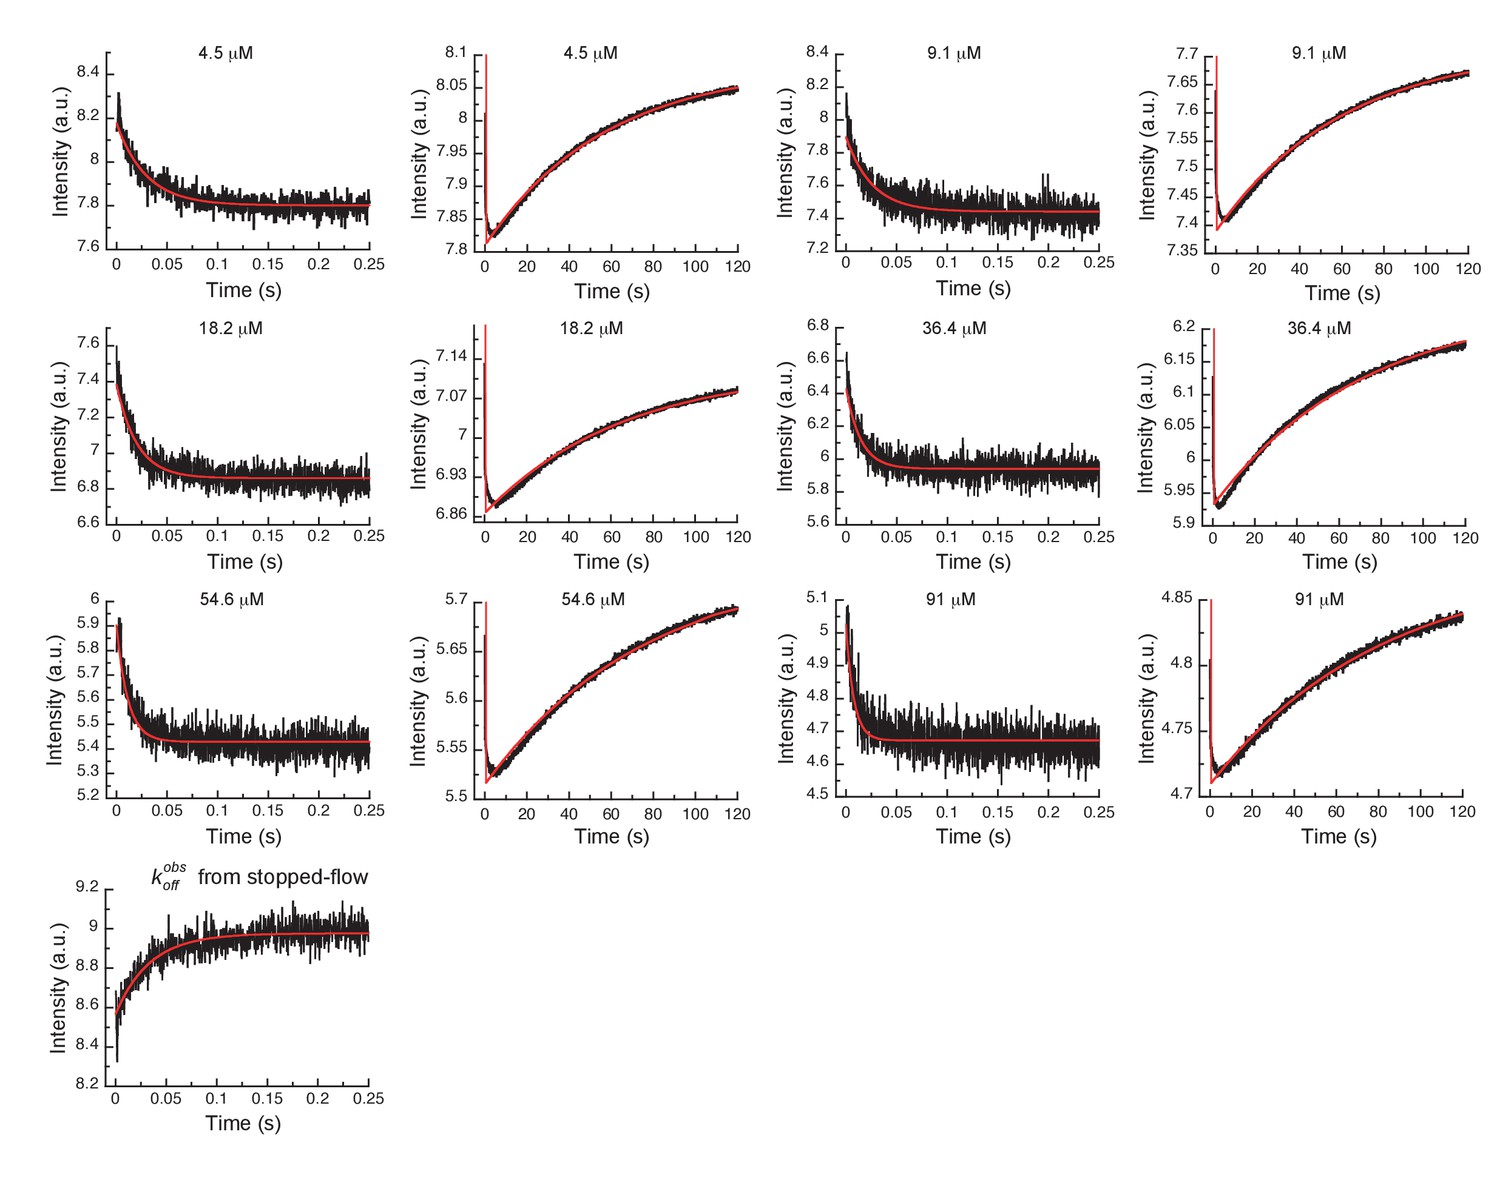
Global fits of Gleevec binding- and dissociation-kinetics to Aurora A at 10°C.
Fitting of kinetic traces (average, n > 5) of the mixing of 0.5 µM Aurora A with different Gleevec concentrations at two timescales, 0.25 and 120 s, and dissociation kinetics () were performed using the KinTek Explorer software with the binding scheme in Figure 3G. Red lines show the results of the global fit to the experimental data in black.
Figure 5 with 2 supplements
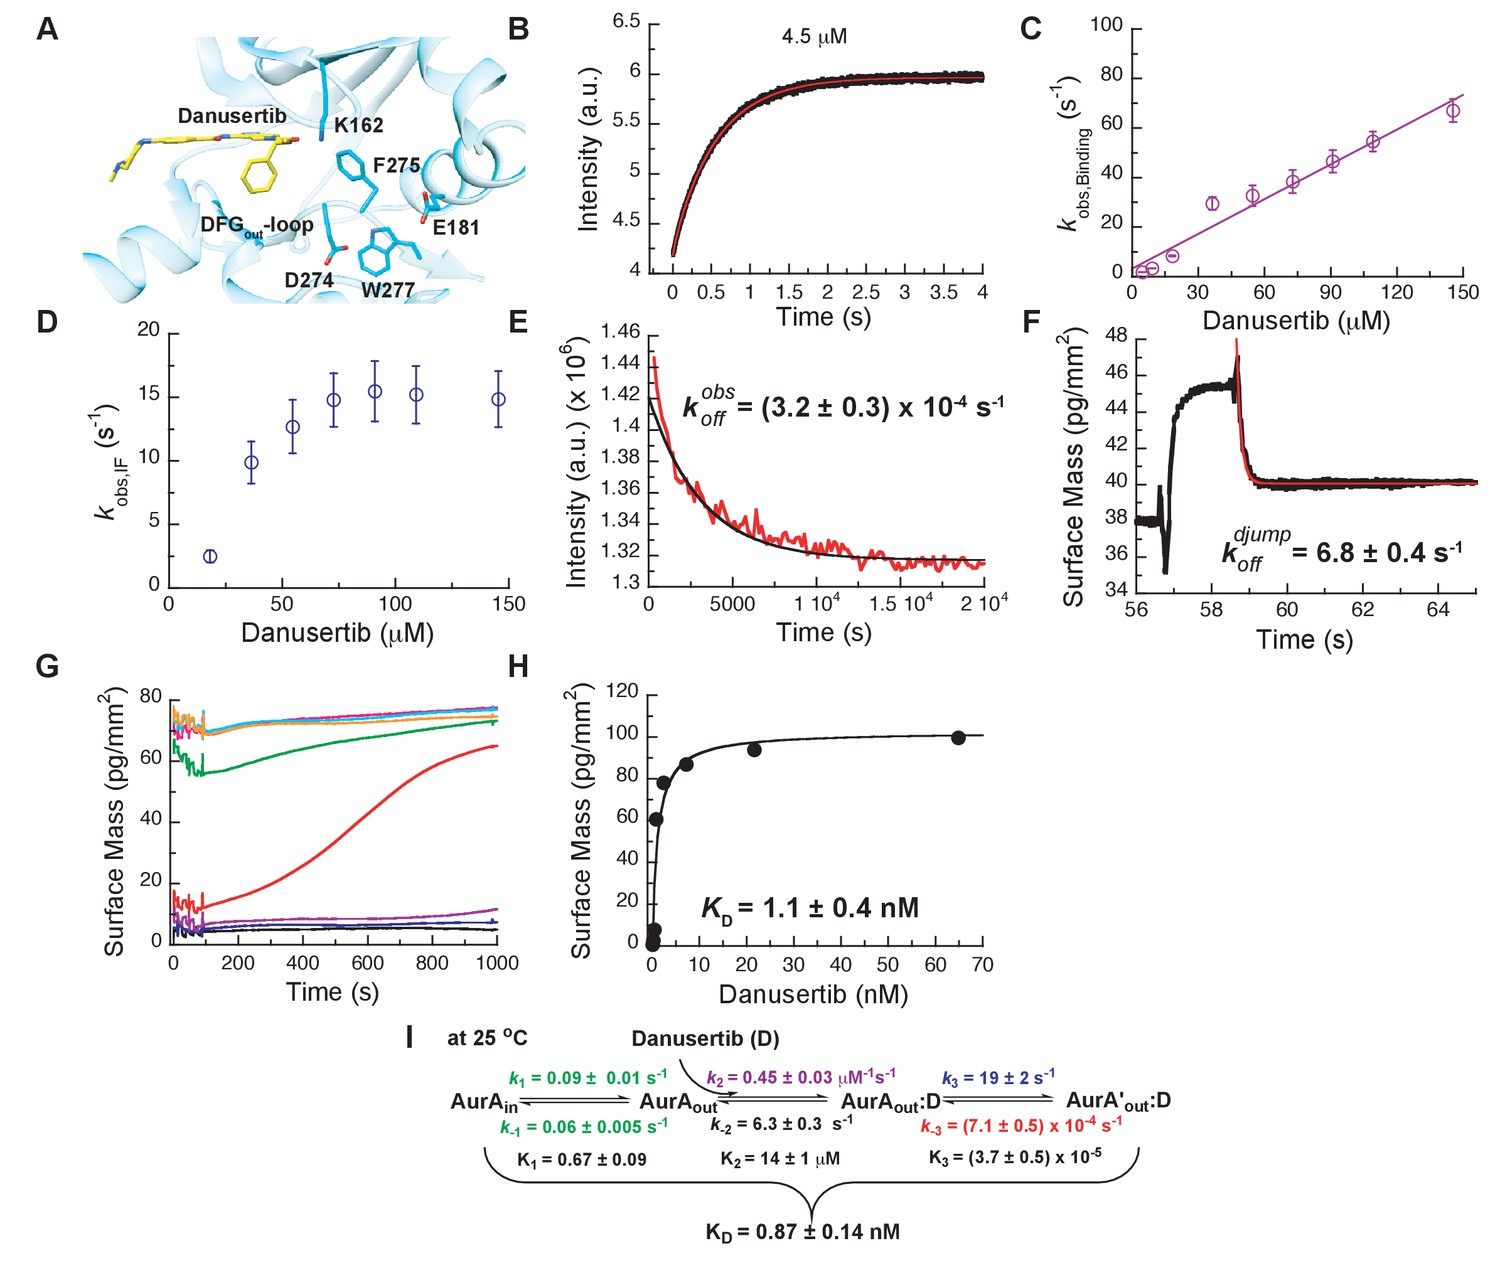
Mechanism of Danusertib binding to Aurora A at 25°C.
(A) Danusertib bound to the DFG-out conformation of Aurora A is shown highlighting important active-site residues in stick representation (PDB 2J50 [Fancelli et al., 2006]). (B) The increase in fluorescence upon Danusertib binding is fitted to a double exponential. (C) Plot of versus the concentration of Danusertib for the fast phase yields = 0.4 ± 0.1 μM−1s−1 and = 4.6 ± 3 s−1 and the for the slow phase (D) reaches a plateau around 16 ± 2 s−1. (E) Dissociation of Danusertib from Aurora A at 25°C after a 30-fold dilution of the Aurora A/Danusertib complex measured by Trp-fluorescence quenching and fitting with single exponential gives a value of = (3.2 ± 0.3) × 10−4 s−1. (F) Double-jump experiment (2 s incubation time of 1 μM Danusertib to Aurora A followed by 60 s long dissociation step initiated by a wash with buffer) was measured by Creoptix WAVE waveguide interferometry to properly define the value of = 6.8 ± 0.4 s−1. (G) Macroscopic dissociation constant () determined by Creoptix WAVE waveguide interferometry: surface-immobilized Aurora A was incubated with various concentrations of Danusertib (0.1 nM (black), 0.2 nM (blue), 0.4 nM (purple), 0.8 nM (red), 2.4 nM (green), 7.2 nM (pink), 21.6 nM (cyan), and 64.8 nM (orange)) and surface mass accumulation was observed until establishment of equilibrium. (H) A plot of the final equilibrium value versus Danusertib concentration yields a = 1.1 ± 0.4 nM. (I) Binding scheme of Danusertib (labeled D) highlighting a three-step binding mechanism, containing both conformational selection and induced-fit step. Red lines in (B, F) and black line in (E) are the results from fitting. Kinetic constants shown in I determined from global fitting (Figure 6). Fluorescence traces are the average of at least five replicate measurements (n > 5), and error bars and uncertainties given in C-E, H, and I denote the (propagated) standard deviation in the fitted parameter.
Figure 5—figure supplement 1

Additional kinetic experiments to corroborate the three-state binding mechanism for Danusertib to Aurora A.
(A) Kinetic trace at 35°C of 18.2 µM Danusertib binding to 0.1 µM Aurora A. The red line represents the best fit of the trace to a double exponential function. The initial fast increase in fluorescence is a convolution of the fast binding and induced-fit steps, whereas the slower phase gives an observed rate constant of approximately 0.1 s−1, suggestive of a third process (i.e., conformational selection). (B) Double-jump experiments measured with Creoptix WAVE waveguide intereferometry at 25°C using Danusertib and a 0.2, 0.4, 0.8 and 2 s incubation time. In the first step of the double jump, Danusertib is incubated with surface-immobilized Aurora A kinase before washing with buffer alone initiates dissociation in a second step. All traces show a single exponential decay with an observed rate constant of 6 s−1 and its amplitude increases with longer incubation time as more AurAout:D is formed. (C) Dilution of the Aurora A/Danusertib complex formed after 1 hour of incubation. The slow dissociation of Aurora A/Danusertib (limited by ) was measured by Creoptix WAVE waveguide interferometry and fitted to a single exponential with a value of = (2 ± 0.6) × 10−4 s−1. (D) Representative selection of emission spectra obtained after the addition of increasing concentrations of Danusertib (0–11.25 nM from dark to light blue) to Aurora A (excitation at 295 nm). Plot of the increase in fluorescence intensity at 368 nm versus Danusertib concentration yields a value of 0.4 ± 0.1 nM determined by fitting the data to Equation 6. Fluorescence trace in A is the average of five replicate measurements (n = 5), and the uncertainties given in D denotes the standard deviation in the fitted parameter.
Figure 5—figure supplement 2
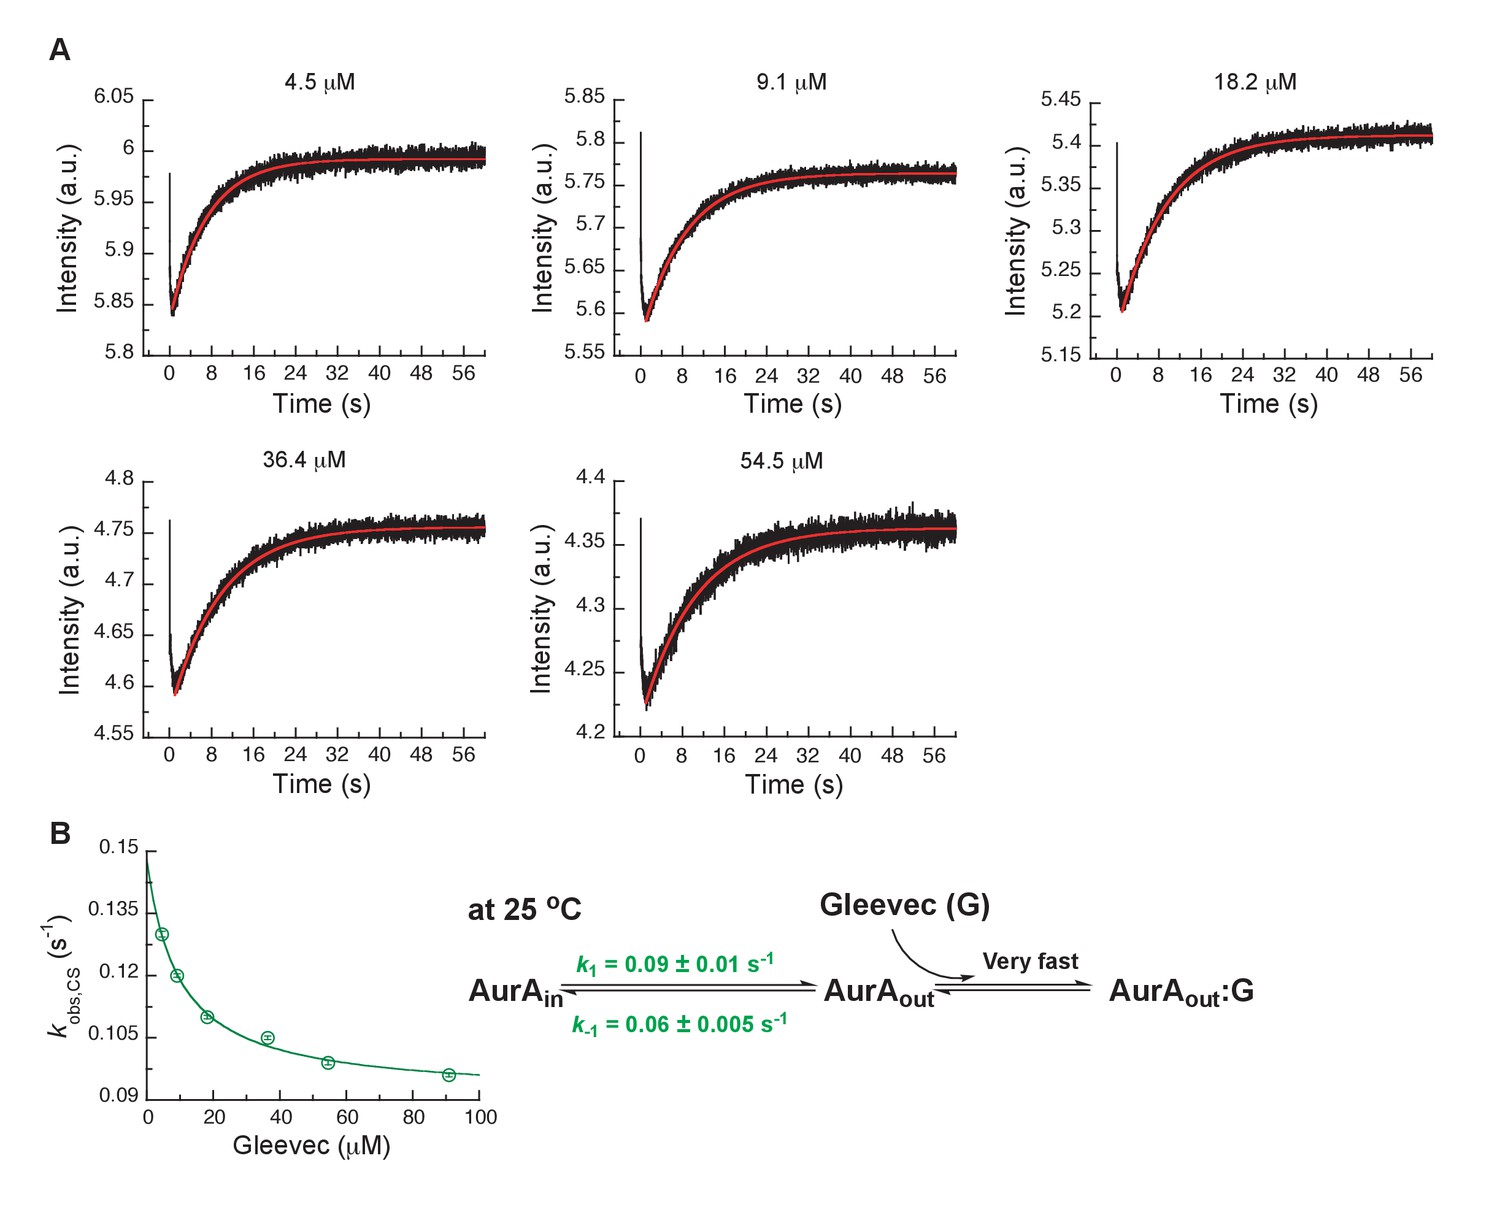
Kinetics of Gleevec binding to Aurora A at 25°C to determine DFG-in/DFG-out equilibrium in apo Aurora A.
(A) 0.5 µM Aurora A was mixed with indicated Gleevec concentrations. The increase in fluorescence intensity of slow phase reflects the conformational selection step (see Figure 3A). (B) of the slow phase as a function of the Gleevec concentration is an inverse hyperbolic function and fitting to Equation 1 gives = 0.09 ± 0.01 s−1 and = 0.06 ± 0.005 s−1. Corresponding binding scheme is depicted. Fluorescence traces are the average of at least five replicate measurements (n > 5), and error bars and uncertainties given in B denote the standard deviation in the fitted parameter.
Figure 6 with 2 supplements
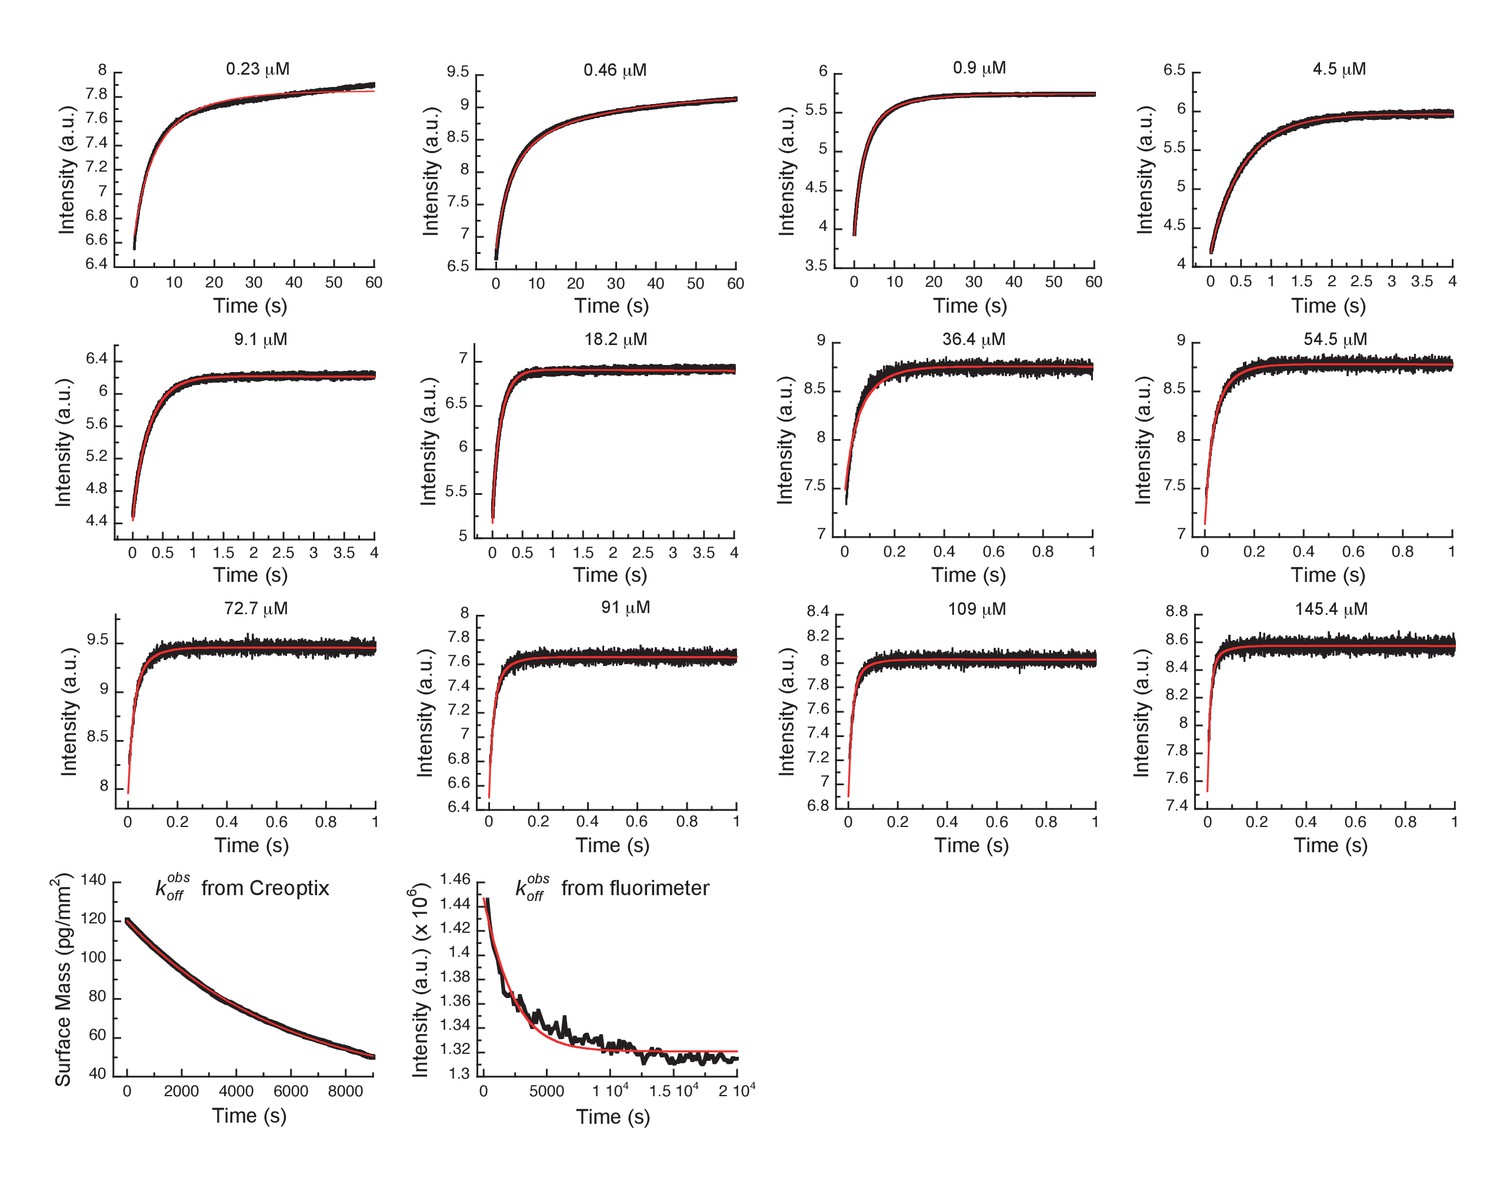
Global fits of Danusertib binding and dissociation kinetics to Aurora A at 25°C.
Binding kinetics was monitored by stopped-flow fluorescence for different concentrations of Danusertib (indicated) to 0.5 µM Aurora A, and dissociation kinetics () by Creoptix and fluorimeter (see Figure 5). Fluorescence traces are the average of at least five replicate measurements (n > 5). Global fitting was performed using the KinTek Explorer software using the model shown in Figure 5I.
Figure 6—figure supplement 1
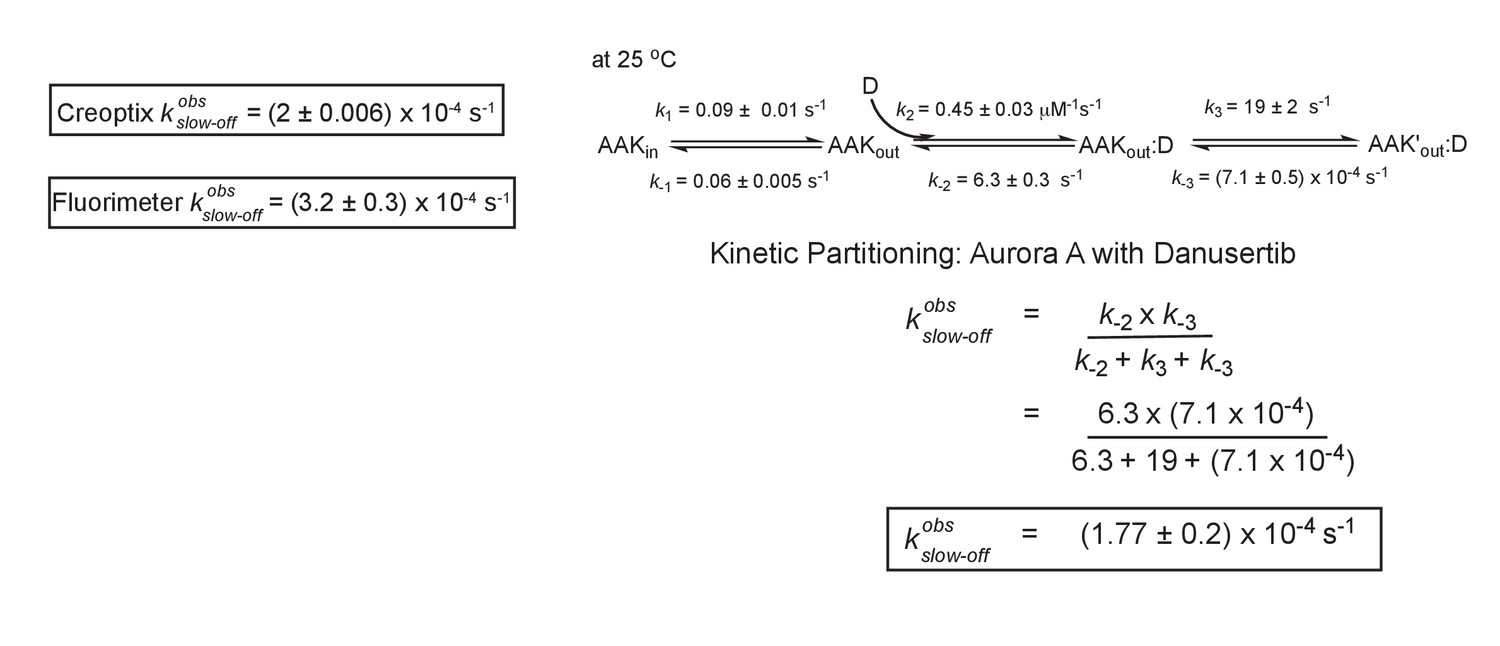
Kinetic partitioning of Aurora A with Danusertib.
The apparent discrepancy between the experimentally observed off rates and the microscopic rate constant, , can be explained by considering the kinetic partitioning. Uncertainties given denote the (propagated) standard deviation in the fitted parameter.
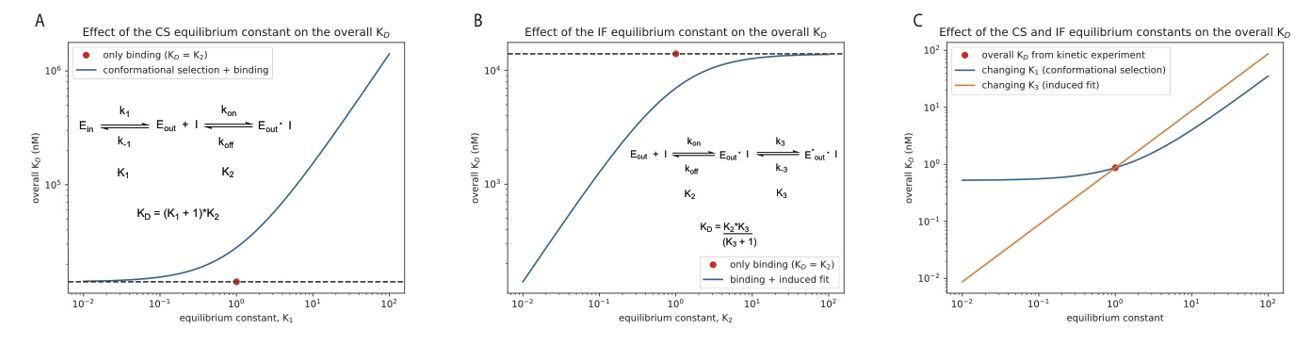
Figure 6—figure supplement 2
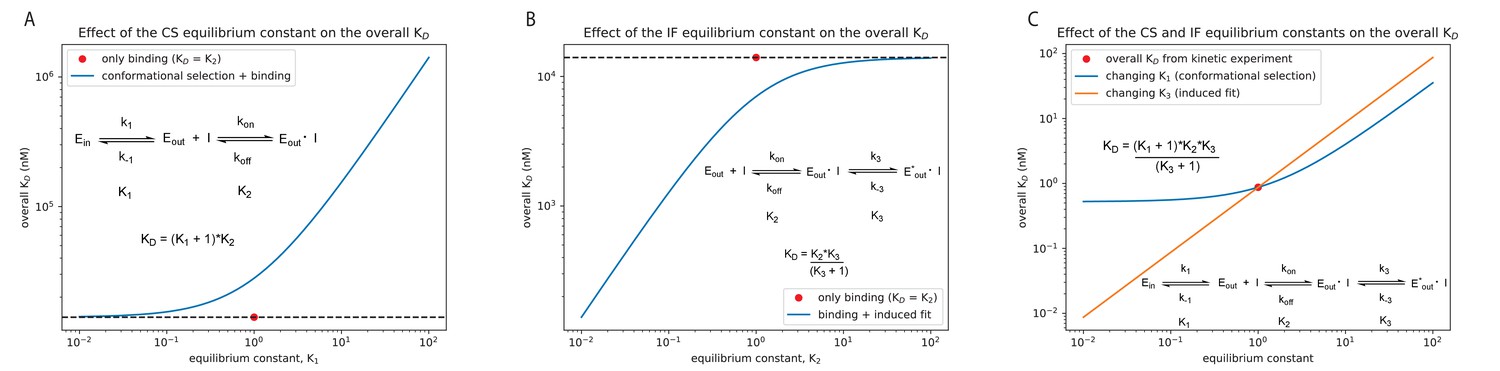
Effect of the equilibrium constant for the conformational selection and induced-fit step on the overall for Danusertib.
The equilibrium constant was changed in both directions by two orders of magnitude starting from unity for the conformational selection (CS) mechanism (A) and induced-fit (IF) step (B). A CS step only weakens the overall affinity compared to the equilibrium constant of the physical binding step (; 14 μM for Danusertib, see Figure 5), whereas an IF step makes the binding tighter. (C) Effect on the overall for Danusertib when changing the equilibrium constants and by two orders of magnitude starting from their actual values (see Figure 5I).
Figure 7 with 1 supplement
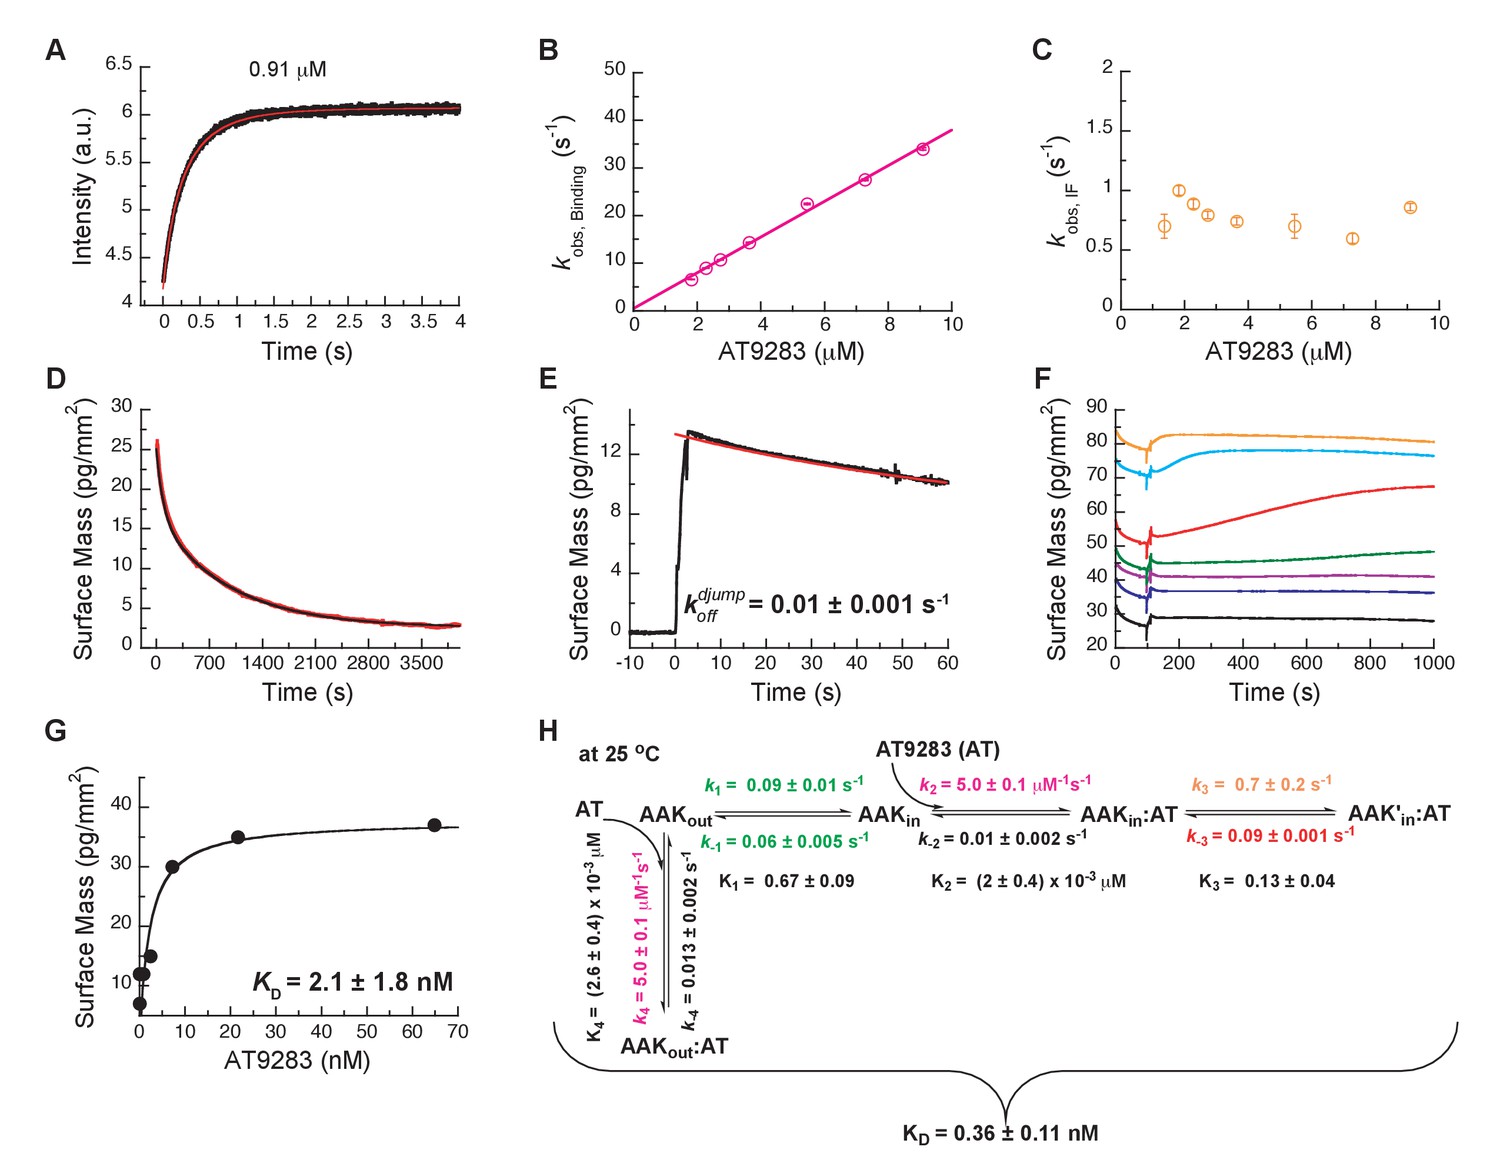
Mechanism of AT9283 drug binding to Aurora A at 25°C.
(A) The increase in fluorescence at 25°C upon AT9283 binding fitted to a double exponential. (B) The plot of versus AT9283 concentration for the fast phase yields = 3.4 ± 0.5 μM−1s−1 and an underdetermined intercept () and (C) the of the slow phase reaches a plateau around 0.8 ± 0.2 s−1. (D) Dilution of the Aurora A/AT9283 complex formed after 1 hour of incubation. The slow dissociation was measured by Creoptix WAVE waveguide interferometry and fitted with a double exponential with rate constants of (1.1 ± 0.02) × 10−2 s−1 and (0.1 ± 0.01) × 10−2 s−1. (E) Double-jump experiments (1 s incubation time of 1 μM AT9283 to Aurora A followed by 60 s long dissociation step initiated by a wash with buffer) was measured by Creoptix WAVE waveguide interferometry to properly define the value of = (1.0 ± 0.1) x 10−2 s−1. (F) Macroscopic dissociation constant () determined by Creoptix WAVE waveguide interferometry: surface-immobilized Aurora A was incubated with various concentration of AT9283 (0.03 nM (black), 0.27 nM (blue), 0.8 nM (purple), 2.4 nM (green), 7.2 nM (red), 21.6 nM (cyan), and 64.8 nM (orange)) and surface mass accumulation was observed until establishment of equilibrium. (G) A plot of the final equilibrium value versus AT9283 concentration yields a = 2.1 ± 1.8 nM. (H) Binding scheme for AT9283 (labeled AT) highlighting a four-steps binding mechanism, that contains binding to two different states, a conformational selection mechanism and an induced-fit step. Kinetic constants shown in H were determined from global fitting (see Figure 8). Fluorescence traces are the average of at least five replicate measurements (n > 5), and error bars and uncertainties given in B, C, G and H denote the (propagated) standard deviation in the fitted parameter.
Figure 7—figure supplement 1
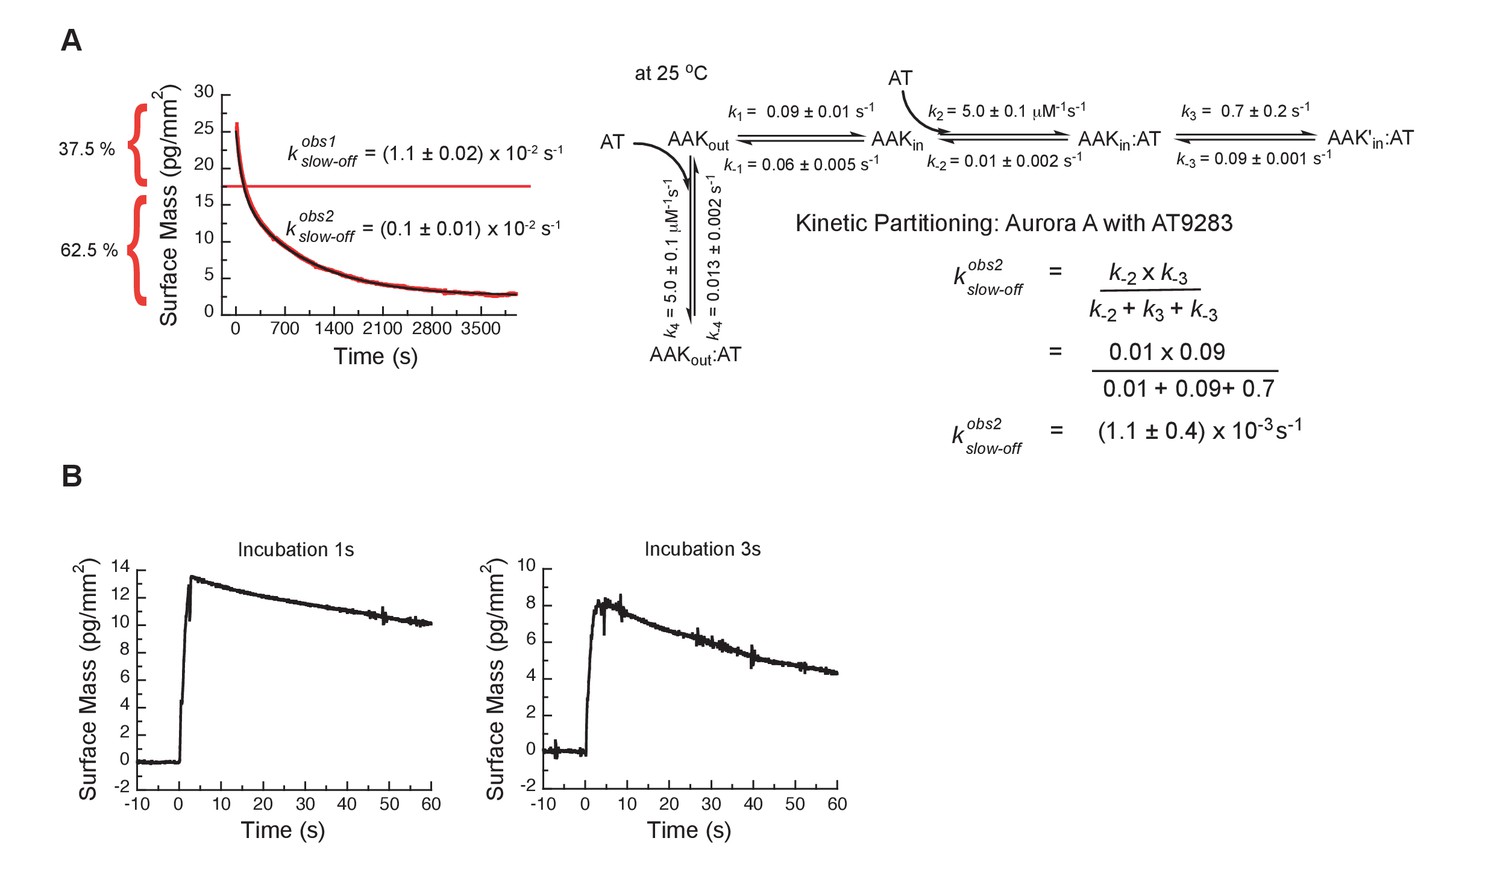
Kinetic partitioning of Aurora A with AT9283.
(A) The apparent discrepancy between the experimentally observed off rates and the microscopic rate constant, , can be explained by considering the kinetic partitioning. (B) Double-jump experiments measured by Creoptix WAVE waveguide interferometry at 25°C of AT9283 at 1 and 3 s incubation time before induction of dissociation by a buffer wash are best described with a single exponential function of ( = 0.01 s−1). Uncertainties given in A denote the (propagated) standard deviation in the fitted parameter.
Figure 8 with 1 supplement
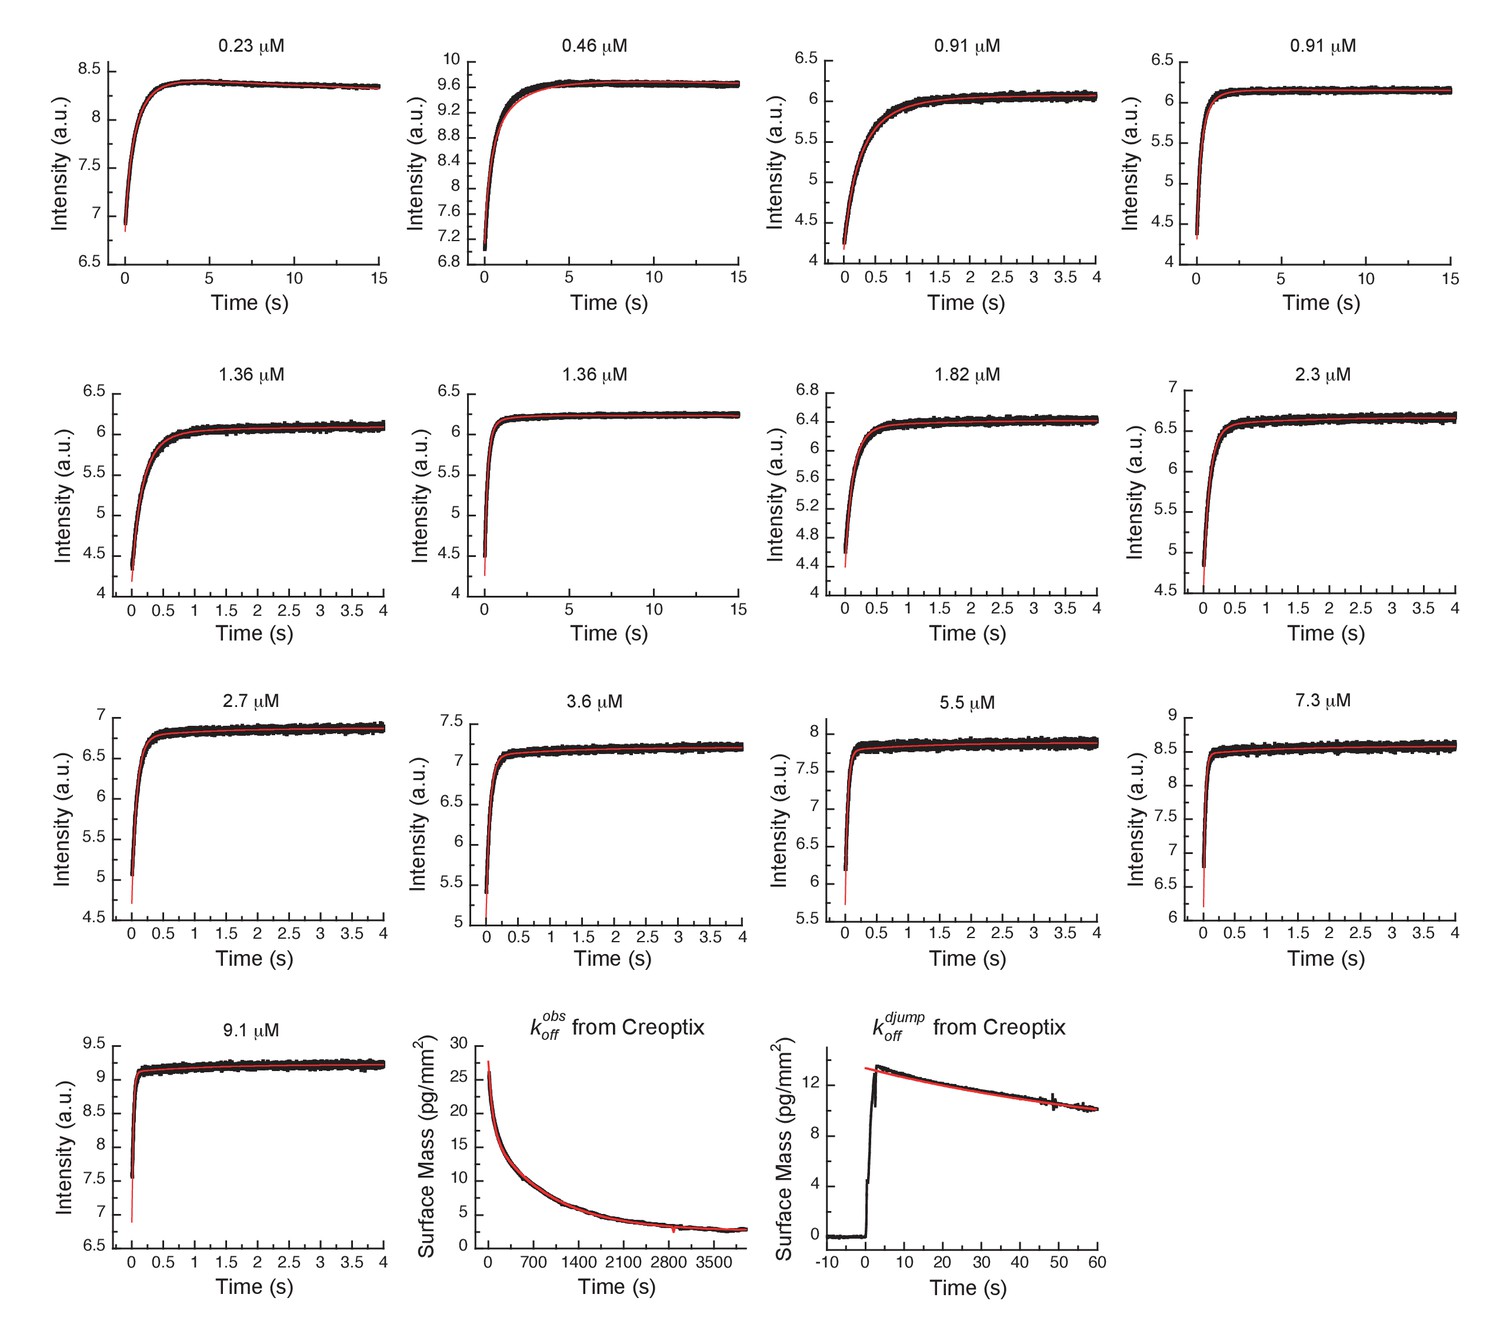
Global fits of AT9283 binding and dissociation kinetics to Aurora A at 25°C.
Binding kinetics was monitored by stopped-flow fluorescence at different concentrations of AT9283 (indicated) to 0.5 µM Aurora A. Dissociation kinetics were obtained for fully equilibrated drug/kinase complex () or for the initial encounter complex () by using a 1 hour or a short 2 s incubation of the kinase with AT9283, respectively, before inducing dissociation by a buffer wash using Creoptix WAVE waveguide interferometry. Global fitting was performed with KinTek Explorer software using the model in Figure 7H (reduced χ2 = 3.2). Fluorescence traces are the average of at least five replicate measurements (n > 5).
Figure 8—figure supplement 1
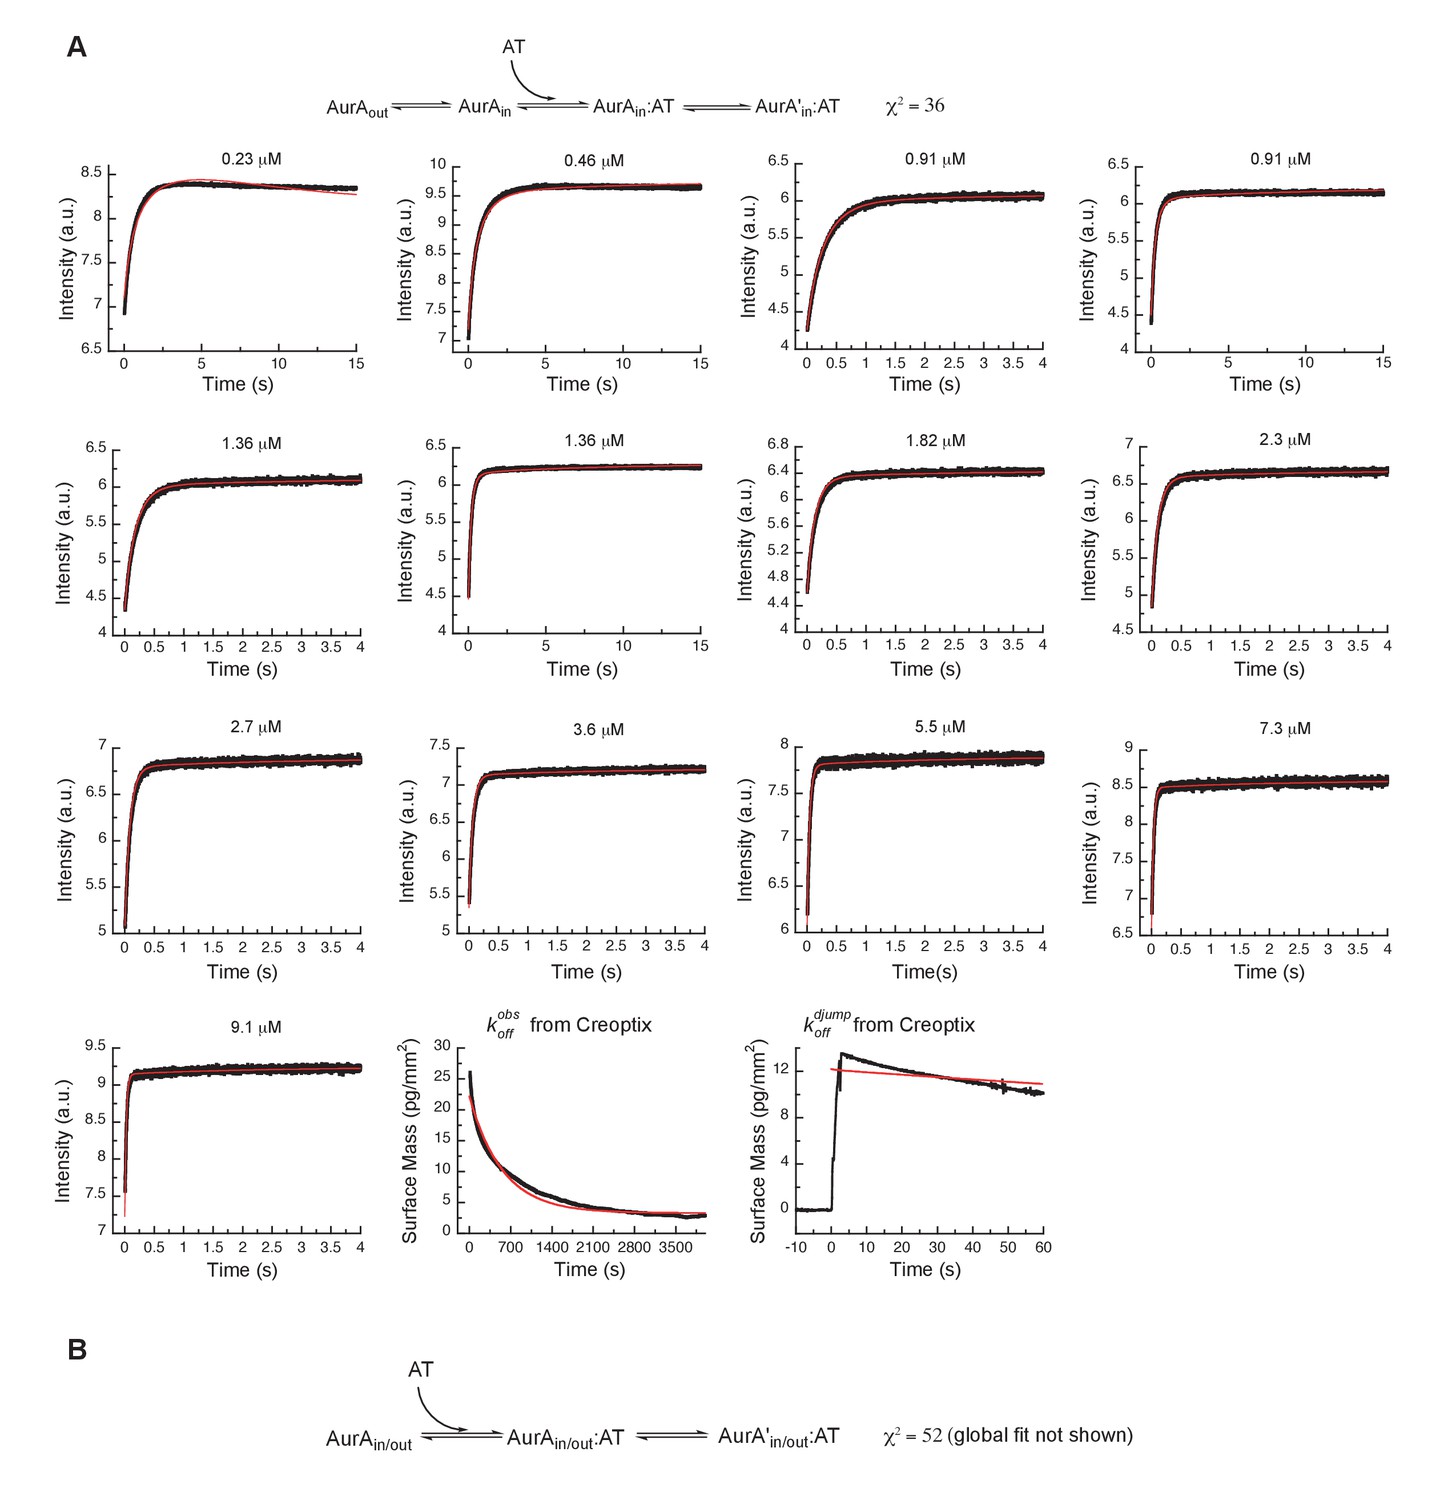
Alternative binding models of AT9283 to Aurora A cannot explain the experimental data.
(A) Our initial three-state binding scheme, where AT9283 binds only the DFGin state of Aurora A and is followed by an induced-fit step, is incorrect. The best global fit (shown in red) did not describe the data as can be seen by visual inspection and from the reduced χ2 value of 36. (B) An alternative model, where AT9283 can bind to Aurora A irrespective of the state of the DFG-loop, and binding is followed by an induced-fit step did not result in adequate fits (data not shown) and yield a reduced χ2 value of 52. In both cases the values for the interconversion between AurAout and AurAin were taken from the Gleevec experiment (Figure 5—figure supplement 2). Fluorescence traces are the average of at least five replicate measurements (n > 5).
Figure 9

X-ray structures of Aurora A bound to inhibitor AT9283 reveal multiple binding modes.
(A) AT9283 (pink) bound to the active site of Aurora A (PDB 2W1G, [Howard et al., 2009]) shows the DFGin-loop conformation and a salt bridge between K162 and E181. (B) Aurora A dimer (light and dark blue ribbon) in complex with AT9283 (pink) and inhibiting monobody (Mb, grey), showing DFGout-loop and broken K162 and E181 salt bridge (PDB 6CPG).
Figure 10
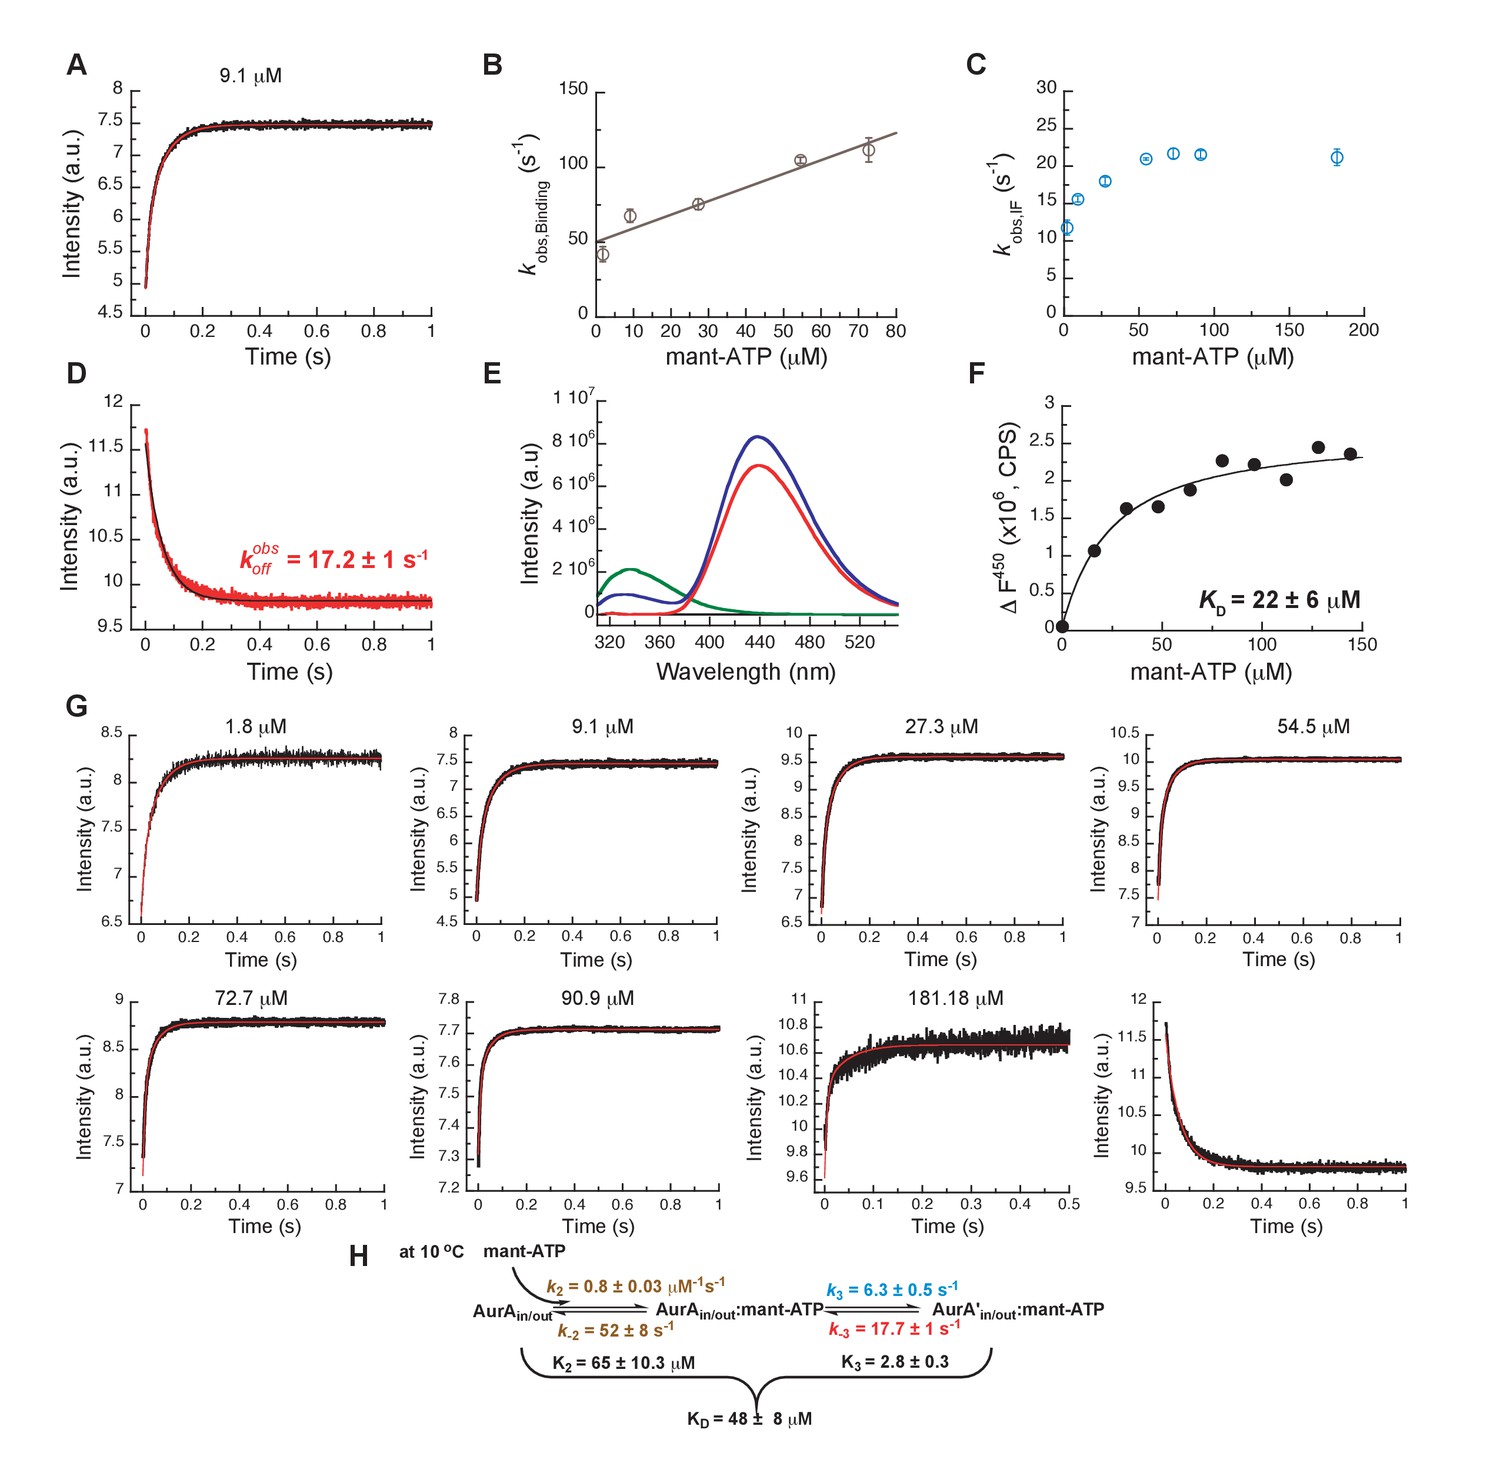
Mechanism of ATP binding to Aurora A at 10°C.
(A) Binding of mant-ATP to Aurora A was followed by an increase in fluorescence with biphasic kinetics. The plot of versus concentration of mant-ATP of the fast phase (B) yields = 0.8 ± 0.2 μM−1s−1 and = 50 ± 8 s−1 and the slow phase (C) reached a plateau around 21 ± 1 s−1 (). (D) Dissociation kinetics of 10 μM Aurora A/10 μM mant-ATP complex was measured after a 11-fold dilution into buffer and yields = 17.2 ± 1 s−1. (E, F) Macroscopic dissociation constant of Aurora A with mant-ATP measured by fluorescence energy transfer. (E) Emission spectra (excitation at 290 nm) of 1 μM Aurora A (green), 160 μM mant-ATP (red), and 1 μM Aurora A/160 μM mant-ATP (blue). (F) The change in fluorescence at 450 nm () versus mant-ATP concentrations yields = 22 ± 6 μM. (G) Global fitting (red) of all kinetics data (black) in KinTek Explorer to the binding scheme shown in (H) results in the kinetic constants given in the scheme and an overall = 48 ± 8 μM, calculated from all rate constants. Fluorescence traces are the average of at least five replicate measurements (n > 5), and error bars and uncertainties given in B, C, D, F, and H denote the (propagated) standard deviation in the fitted parameter.
Author response image 1
Tables
Table 1
Data collection and refinement statistics for dephosphorylated Aurora A (122-403).
https://doi.org/10.7554/eLife.36656.004| apo-Aurora A (6CPE) | Aurora A + AMPPCP (6CPF) | Aurora A + Mb + AT9283 (6CPG) | |
|---|---|---|---|
| Data collection | |||
| Space group | P 61 2 2 | P 61 2 2 | P 21 21 21 |
| Cell dimensions | |||
| a, b, c (Å) | 80.55, 80.55, 169.79 | 81.75, 81.75, 172.87 | 63.86, 69.7, 175.56 |
| α, β, γ (°) | 90, 90, 120 | 90, 90, 120 | 90, 90, 90 |
| Resolution (Å) | 84.90–2.45 (2.55–2.45)* | 86.44–2.30 (2.39–2.30)* | 43.14–2.80 (2.87–2.80)* |
| Rmeas | 0.073 (1.308) | 0.113 (2.260) | 0.189 (1.268) |
| I/σ(I) | 15.0 (1.6) | 10.3 (1.3) | 8.9 (1.1) |
| CC1/2 | 0.998 (0.711) | 0.997 (0.465) | 0.986 (0.625) |
| Completeness (%) | 99.9 (100) | 100 (100) | 99.2 (98.8) |
| Redundancy | 7.6 (6.3) | 9.7 (7.8) | 5.4 (5.3) |
| Refinement | |||
| Resolution (Å) | 64.52–2.45 | 54.79–2.30 | 36.17–2.80 |
| No. reflections | 12617 (1224) | 15756 (1527) | 19556 (1845) |
| Rwork/Rfree | 0.2151/0.2528 | 0.2179/0.2587 | 0.2792/0.3350 |
| No. atoms | |||
| Protein | 2035 | 2055 | 5122 |
| Ligand/ion | 11 | 32 | 56 |
| Water | 4 | 6 | |
| B factors | |||
| Protein | 71.83 | 63.68 | 78.84 |
| Ligand/ion | 75.77 | 76.44 | 81.05 |
| Water | 52.52 | 45.84 | |
| R.m.s. deviations | |||
| Bond lengths (Å) | 0.005 | 0.004 | 0.003 |
| Bond angles (°) | 0.98 | 0.97 | 0.98 |
-
The number of crystals for each structure is one for apo-Aurora A and Aurora A + AMPPCP and two crystals for Aurora A + Mb + AT9283.
*Values in parentheses are for highest-resolution shell.
Additional files
-
Transparent reporting form
- https://doi.org/10.7554/eLife.36656.020
Download links
A two-part list of links to download the article, or parts of the article, in various formats.
Downloads (link to download the article as PDF)
Open citations (links to open the citations from this article in various online reference manager services)
Cite this article (links to download the citations from this article in formats compatible with various reference manager tools)
Dynamics of human protein kinase Aurora A linked to drug selectivity
eLife 7:e36656.
https://doi.org/10.7554/eLife.36656


