Chimeric antigen receptors that trigger phagocytosis
- University of California, San Francisco, United States
Figures
Figure 1 with 2 supplements
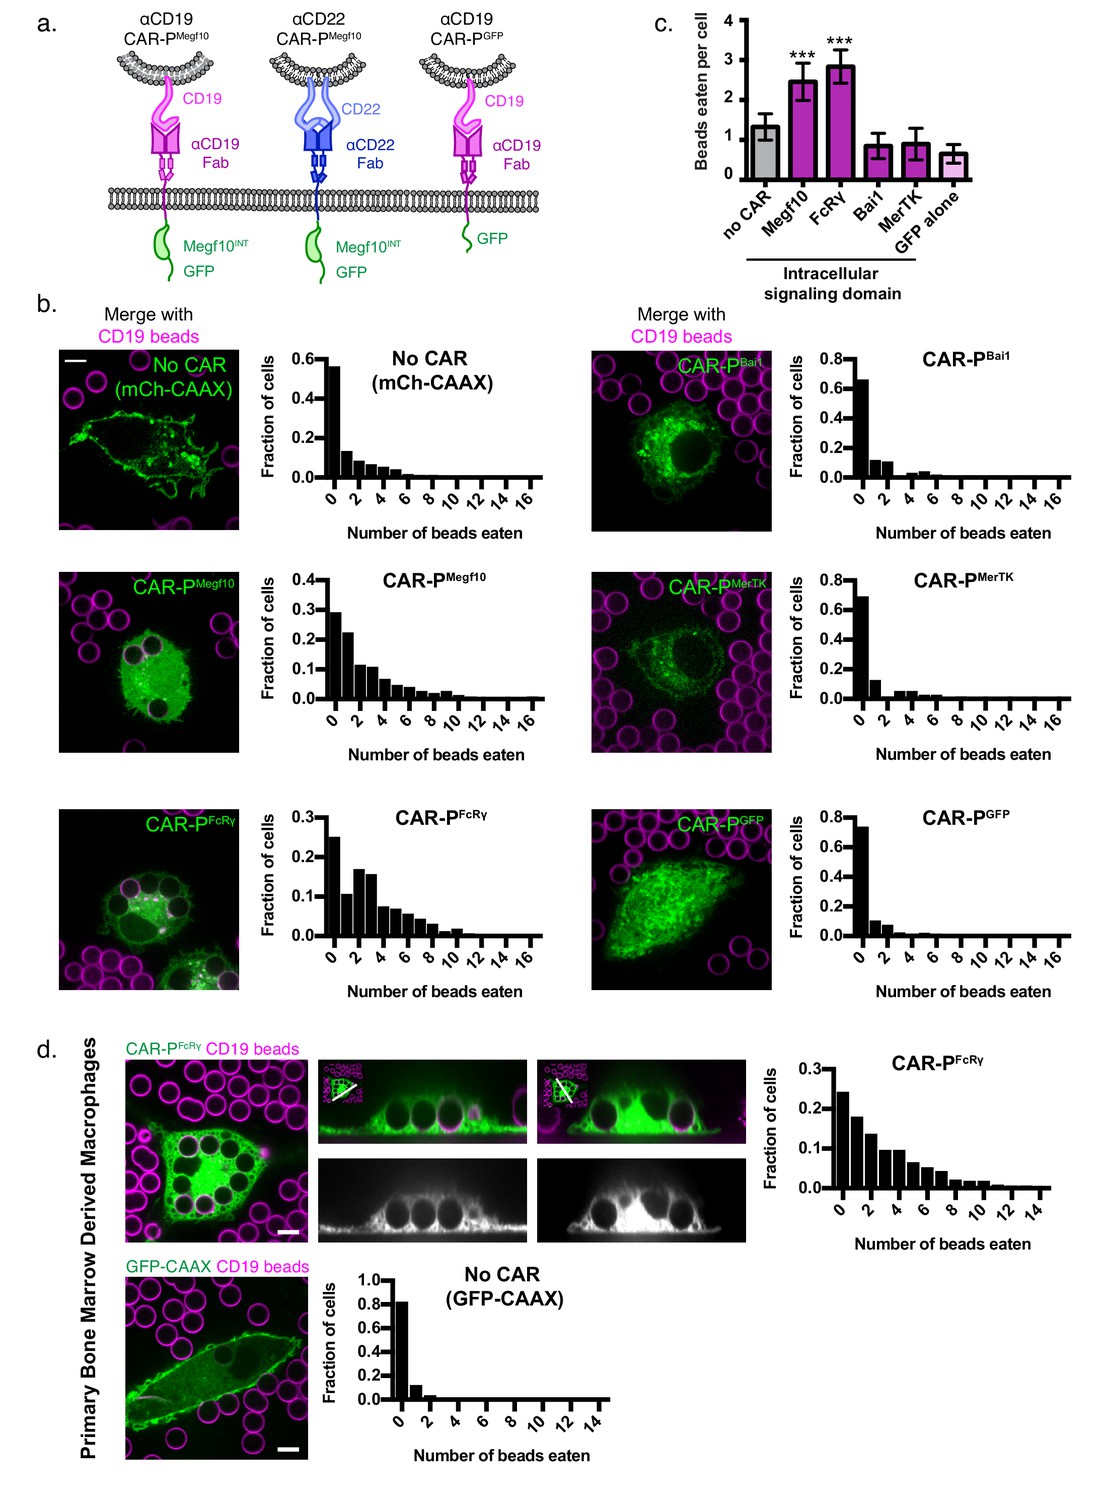
Identification of intracellular signaling region for CAR-P.
(A) Schematics show the structure of CAR-P constructs. An ɑCD19 (purple) or ɑCD22 (blue, center) scFv directs CAR specificity. Intracellular signaling domains from Megf10 or the indicated engulfment receptor (green) activate engulfment. CAR-PGFP contains only GFP and no intracellular signaling domains (right). All constructs include a transmembrane domain from CD8 and a C-terminal GFP. (B) J774A.1 macrophages expressing ɑCD19 CAR-P with the indicated intracellular signaling domain (green) engulf 5 µm silica beads covered with a supported lipid bilayer containing His-tagged CD19 extracellular domain. The beads were visualized with atto390-labeled lipid incorporated into the supported lipid bilayer (magenta). Cells infected with the cell membrane marker, mCherry-CAAX, were used as a control (no CAR, top left). To the right of each image is a histogram depicting the frequency of cells engulfing the indicated number of beads. The average number of beads eaten per cell is quantified in (C). (D) Bone marrow derived macrophages were infected with CAR-PFcRɣ or GFP-CAAX (green, left and center top; grey, center bottom) and incubated with CD19 beads (magenta) for 45 min. Images show an x-y plane through the center of the engulfed beads (left), or a cross section (center) of the z plane indicated in the inset panel (white line). The histogram depicts the number of cells engulfing the indicated number of beads. The scale bar indicates 5 µm and n = 78–163 cells per condition, collected during three separate experiments. Error bars denote 95% confidence intervals and *** indicates p<0.0001 compared to mCherry-CAAX control by Kruskal-Wallis test with Dunn’s multiple comparison correction.
Figure 1—figure supplement 1
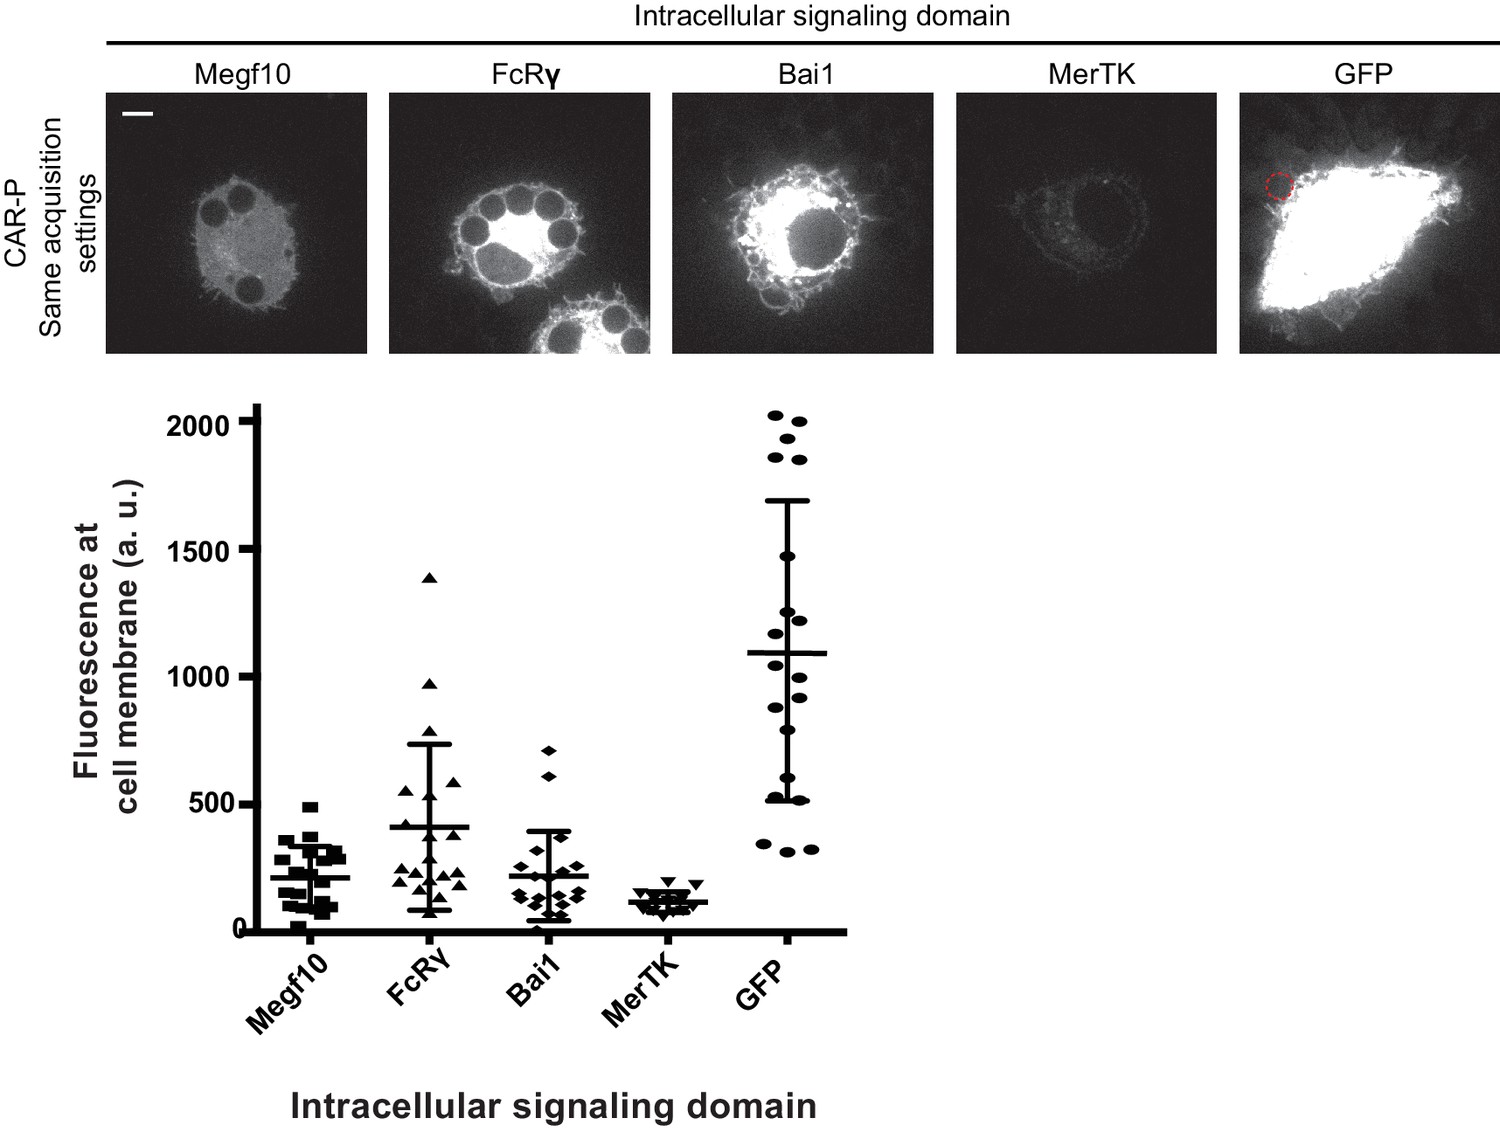
Expression level of CAR-P constructs in macrophages.
Images of macrophages infected with various ɑCD19 CAR-PGFP constructs were acquired with identical acquisition settings and scaling to depict differences in expression levels. Fluorescent intensity at the cell cortex of 20 representative ɑCD19 CAR-PGFP-infected macrophages was quantified using the mean intensity of a two pixel width linescan at the cell membrane, minus the mean intensity of a linescan immediately adjacent to the cell. The images are the same cells included in Figure 1B and fluorescent intensity was measured from the same macrophages assayed in Figure 1C. The dashed red line indicates the position of a bead in contact with the CAR-PGFP macrophage. The scale bar indicates 5 µm.
Figure 1—video 1
CAR-PMegf10 macrophage engulfs silica beads
A macrophage infected with ɑCD19 CAR-PMegf10 (green) engulfs 5 µm silica beads coated in a supported lipid bilayer (labeled with atto647, magenta) and ligated to his-tagged CD19 extracellular domain. The field of view is 43 × 43 µm. The movie is a maximum intensity projection of 17 z-planes acquired at 0.5 µm intervals. Z-stacks were acquired every 30 s for 30 min and time is indicated in the bottom right.
Figure 2
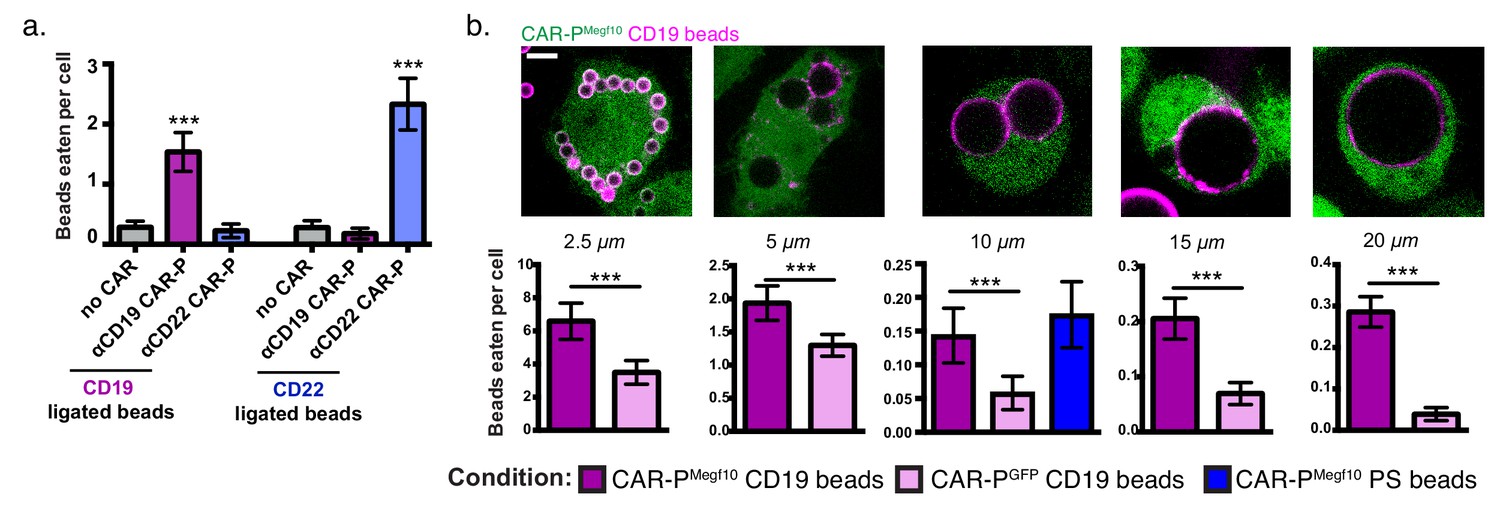
CAR-P expression drives specific engulfment of diverse beads.
(A) Macrophages infected with the ɑCD19 (purple) or ɑCD22 (blue) CAR-PMegf10 or mCherry-CAAX control were fed 5 µm beads ligated with either CD19 (left) or CD22 (right). Engulfment is quantified as the mean beads eaten per cell. The fraction of phagocytic cells is as follows: 31/144 GFP-CAAX cells engulfed CD19 beads, 87/149 ɑCD19 CAR-PMegf10 engulfed CD19 beads, 20/142 ɑCD22 CAR-PMegf10 engulfed CD19 beads, 28/140 GFP-CAAX cells engulfed CD22 beads, 18/151 ɑCD19 CAR-PMegf10 engulfed CD22 beads, 103/148 ɑCD22 CAR-PMegf10 engulfed CD22 beads (pooled data was collected during three separate experiments). Error bars denote 95% confidence intervals and *** indicates p<0.0001 compared to mCherry-CAAX control by Kruskal-Wallis test with Dunn’s multiple comparison correction. (B) J774A.1 macrophages expressing the ɑCD19 CAR-PMegf10 (green) were fed beads of various sizes (magenta, diameter of bead indicated below image). The beads were covered in a supported lipid bilayer ligated to His-tagged CD19 extracellular domain and the number of beads engulfed per cell is reported below each image (magenta bars indicate CAR-PMegf10 macrophages and pink bars indicate CAR-PGFP). The ɑCD19 CAR-PMegf10 macrophages were also incubated with 10 µm beads coated in phosphatidylserine (PS) and ICAM-1 (blue bar in graph, 51/390 cells engulfed a bead). The fraction of cells engulfing a CD19 bead is as follows: 135/169 CAR-PMegf10 and 134/187 CAR-PGFP cells engulfed 2.5 um bead, 126/395 CAR-PMegf10 and 112/499 CAR-PGFP cells engulfed a 5 um bead, 48/377 CAR-PMegf10 and 21/378 CAR-PGFP cells engulfed a 10 um bead, 120/706 CAR-PMegf10 and 45/675 CAR-PGFP cells engulfed a 15 um bead, 194/760 CAR-PMegf10 and 23/587 CAR-PGFP cells engulfed a 20 um bead (data is pooled from at least three separate experiments). Error bars denote 95% confidence intervals of the mean. *** indicates p<0.0001 respectively by Mann-Whitney test. All scale bars represent 5 µm.
Figure 3 with 1 supplement
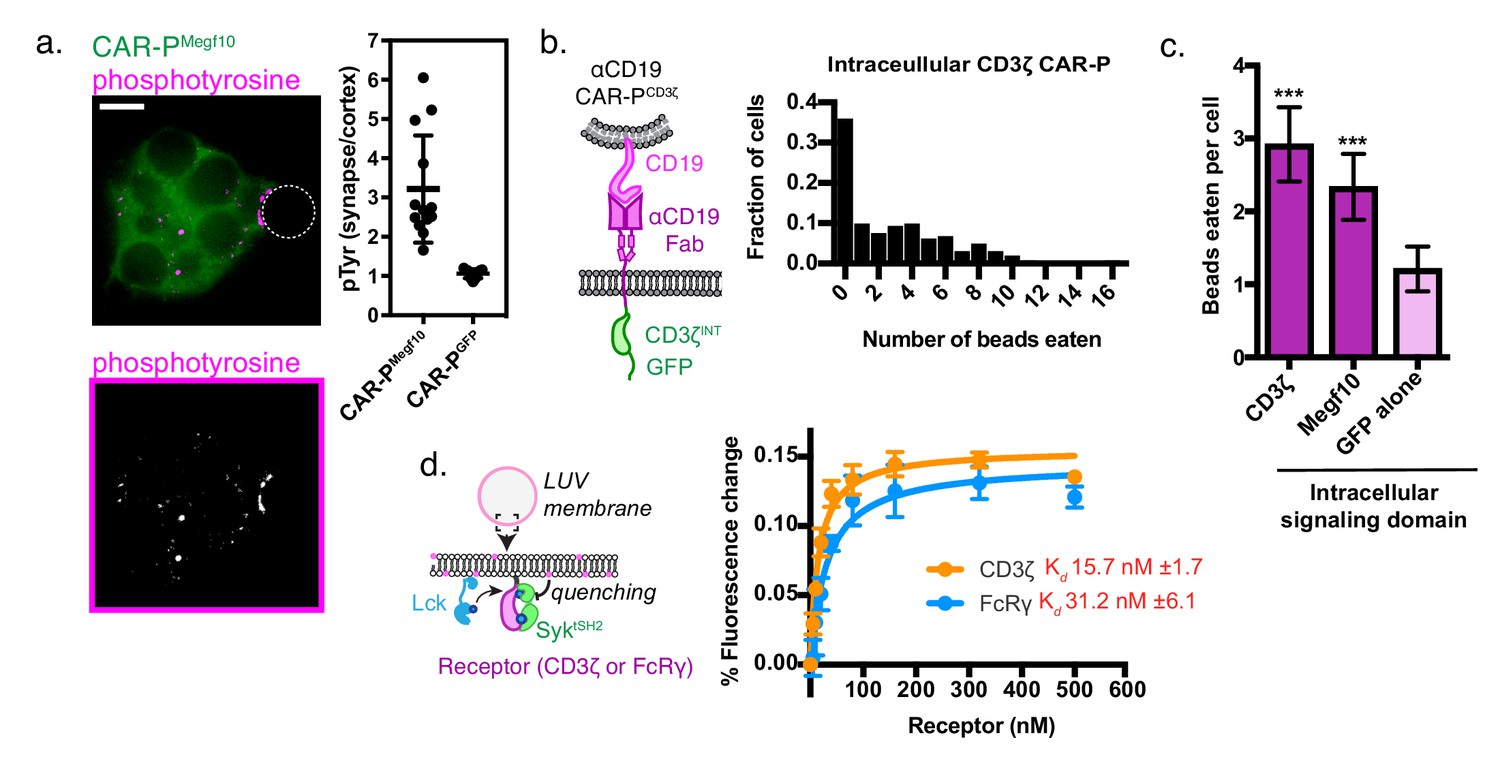
A phosphorylated ITAM at the cell-target synapse drives engulfment.
(A) Macrophages expressing ɑCD19 CAR-PMegf10 (green, top) or ɑCD19 CAR-PGFP were incubated with CD19-ligated beads (position indicated with dotted line), fixed and stained for phosphotyrosine (magenta, top; greyscale, bottom). The fold enrichment of phosphotyrosine at the cell-bead synapse compared to the cell cortex is graphed on the right (n ≥ 11; each dot represents one cell-bead synapse; lines represent the mean ±one standard deviation). (B) Schematic shows the structure of CAR-P constructs in the plot at right. An αCD19 (purple) scFv directs CAR specificity. The intracellular signaling domains from CD3ζ activate engulfment. On the right is a histogram depicting the fraction of macrophages engulfing the indicated number of CD19-coated beads. (C) Comparison showing the average number of beads eaten per cell in J774A.1 macrophages expressing αCD19 CAR-Ps with the indicated intracellular signaling domain. 5 μm silica beads covered with a supported lipid bilayer containing His-tagged CD19 extracellular domain were used as an engulfment target (n = 156–167 cells per condition collected during three separate experiments). Error bars denote 95% confidence intervals and *** indicates p<0.0001 compared to CAR-PGFP control by Kruskal-Wallis test with Dunn’s multiple comparison in correction. (D) Model of the liposome-based fluorescence quenching assay used to determine affinity between the Syk tSH2 domains and the receptor tails of CD3ζ and FcRɣ, two intracellular signaling domains that promote engulfment. Binding between the Syk tSH2 reporter (Syk tSH2), green, and a receptor tail, purple, was detected by rhodamine quenching of BG505 dye on the reporter (see Materials and methods). Kd was determined by assessing mean fluorescence quenching for the last 20 timepoints collected ~45 min after ATP addition over a receptor titration from 0 to 500 nM. Each point represents the mean ± SD from three independent experiments. Kd ± SE was calculated by nonlinear fit assuming one site specific binding.
Figure 3—figure supplement 1
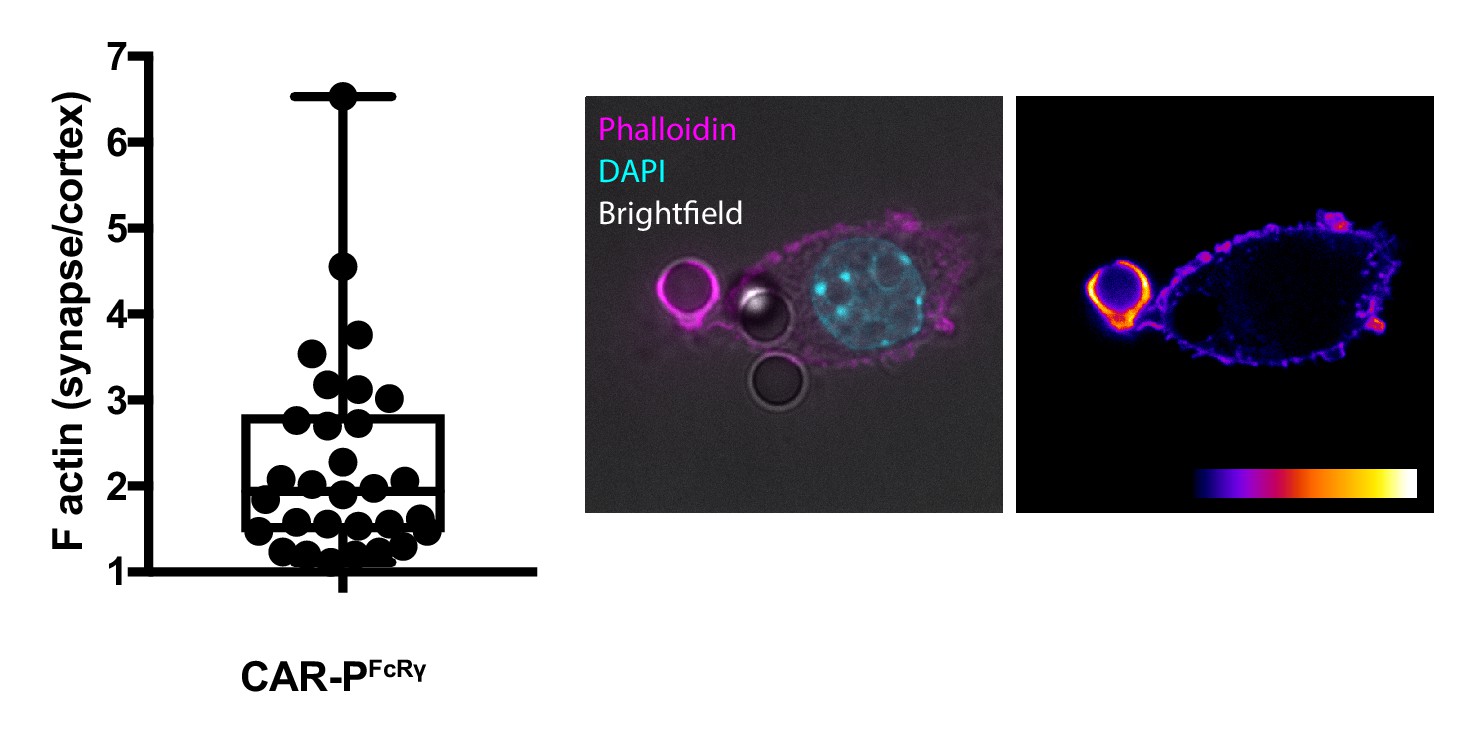
F-actin is enriched at the cell-target synapse.
Phalloidin staining (magenta overlayed with brightfield and DAPI, left; heatmap, right) of F-actin in a CAR-PFcRɣ expressing macrophage shows a 2.3 fold enrichment at the cell-bead synapse (standard deviation of 1.2). The graph depicts actin enrichment at 30 cell-bead synapses collected on three separate days. Each dot represents a cell-bead synapse. The box plot indicates the interquartile range. The cell is in contact with a second bead, but this site of contact has not initiated cup formation and no actin enrichment.
Figure 4 with 7 supplements
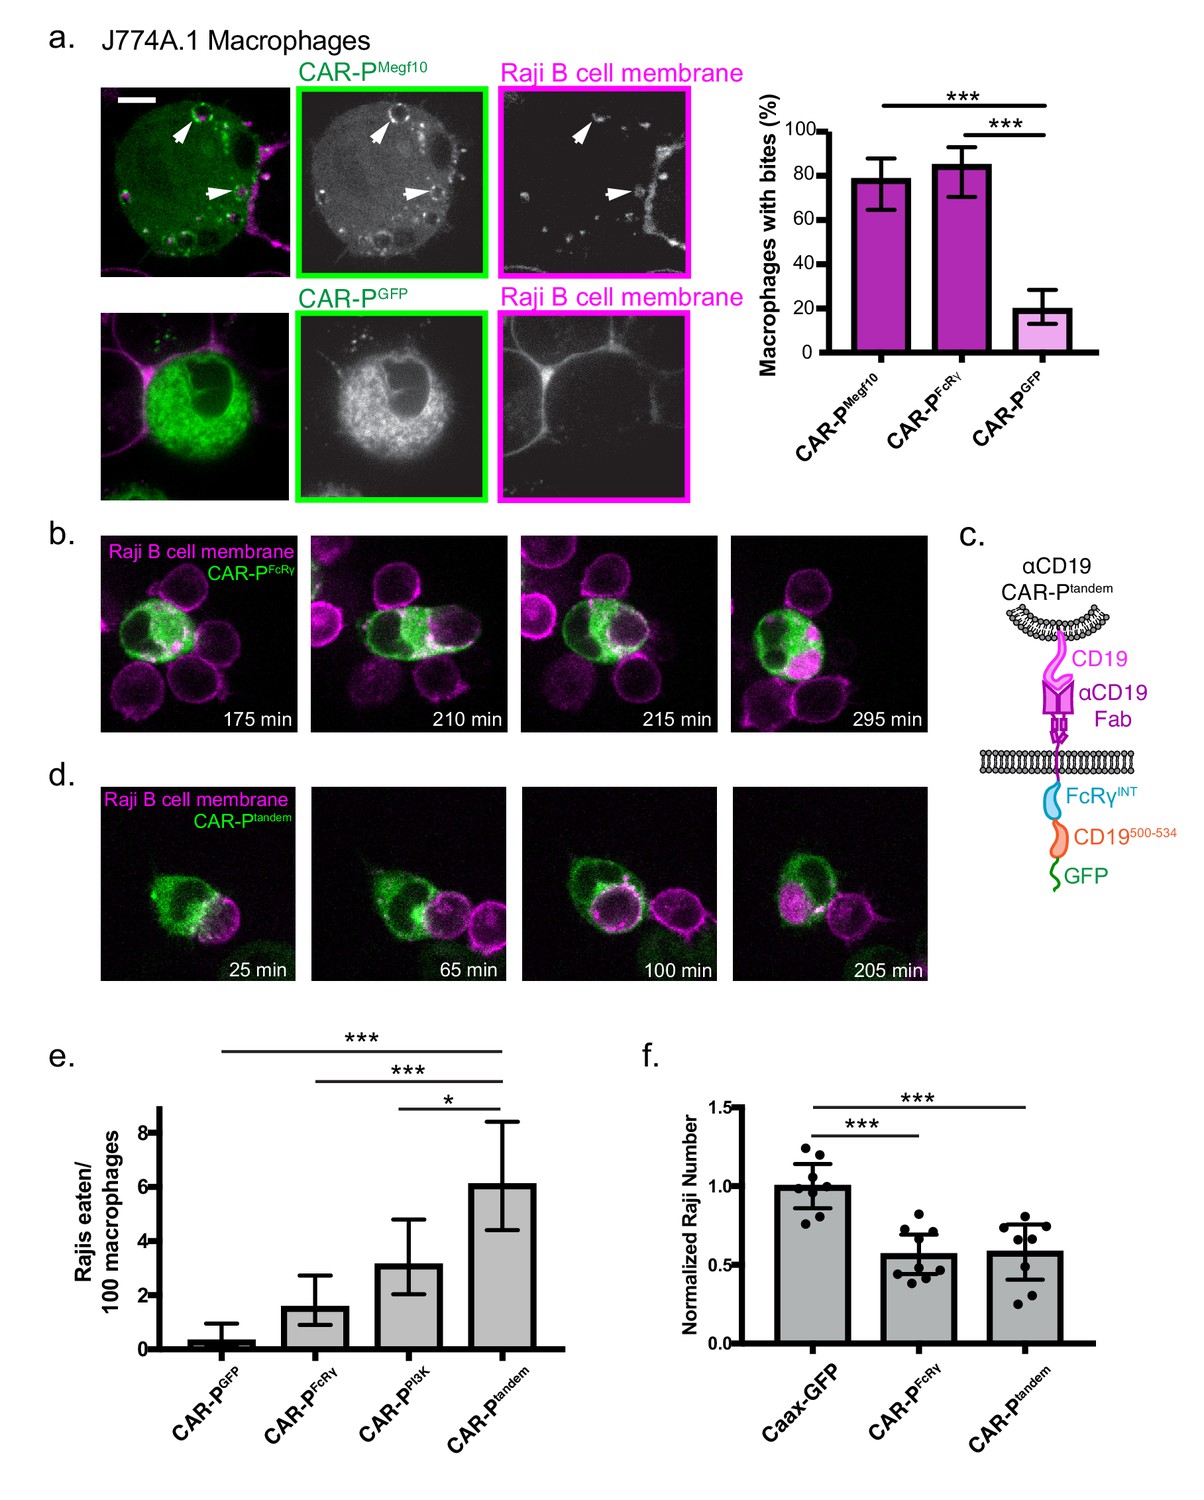
CAR-P promotes trogocytosis and whole cell eating.
(A) J774A.1 macrophages expressing the ɑCD19 CAR-PMegf10 (top panel, green in merge, left; greyscale, center) engulf pieces of CD19 +Raji B cells (labeled with mCherry-CAAX; magenta in merge, left; greyscale, right). The corresponding control ɑCD19 CAR-PGFP-infected cells are shown below. Arrows point to pieces of ingested Raji B cell. The proportion of CAR-P expressing macrophages internalizing one or more bite within 90 min is quantified on the right. Bites are defined as a fully internalized mCherry-positive vesicle >1 µm in diameter; n = 46 CAR-PMegf10 macrophages, n = 39 CAR-PFcRɣ macrophages and 102 CAR-PGFP macrophages acquired during three separate experiments. (B) Time course of a J774A.1 macrophage expressing CAR-PFcRɣ (green) internalizing a whole Raji B cell labeled with mCherry-CAAX (magenta). These images correspond to frames from Figure 4—video 2. (C) Schematic shows the structure of CAR-Ptandem construct, combining the intracellular signaling domain from FcRɣ and the p85 recruitment domain from CD19. (D) Time course of a J774A.1 macrophage expressing CAR-Ptandem (green) internalizing a whole Raji B cell labeled with mCherry-CAAX (magenta). These images correspond to frames from Figure 4—video 3. (E) Macrophages and Raji B cells were incubated together at a 1:2 macrophage:Raji ratio, and the number of whole Raji B cells eaten per 100 macrophages during 4–8 hr of imaging is graphed. Graph depicts pooled data from four independent experiments; n = 921 CAR-PGFP, n = 762 CAR-PFcRɣ, n = 638 CAR-PPI3K, n = 555 CAR-Ptandem cells. Sample sizes were selected for their ability to detect a 5% difference between samples with 95% confidence. (F) 10,000 macrophages and 20,000 Raji B cells were incubated together for 44 hr. The number of Rajis was then quantified by FACS. 2–3 technical replicates were acquired each day on three separate days. The number of Rajis in each replicate was normalized to the average number present in the GFP-CAAX macrophage wells on that day. * indicates p<0.01, *** indicates p<0.0001 by two-tailed Fisher Exact Test (a and e) or by Ordinary one way ANOVA with Dunnet’s correction for multiple comparisons (f); error bars denote 95% confidence intervals.
Figure 4—figure supplement 1
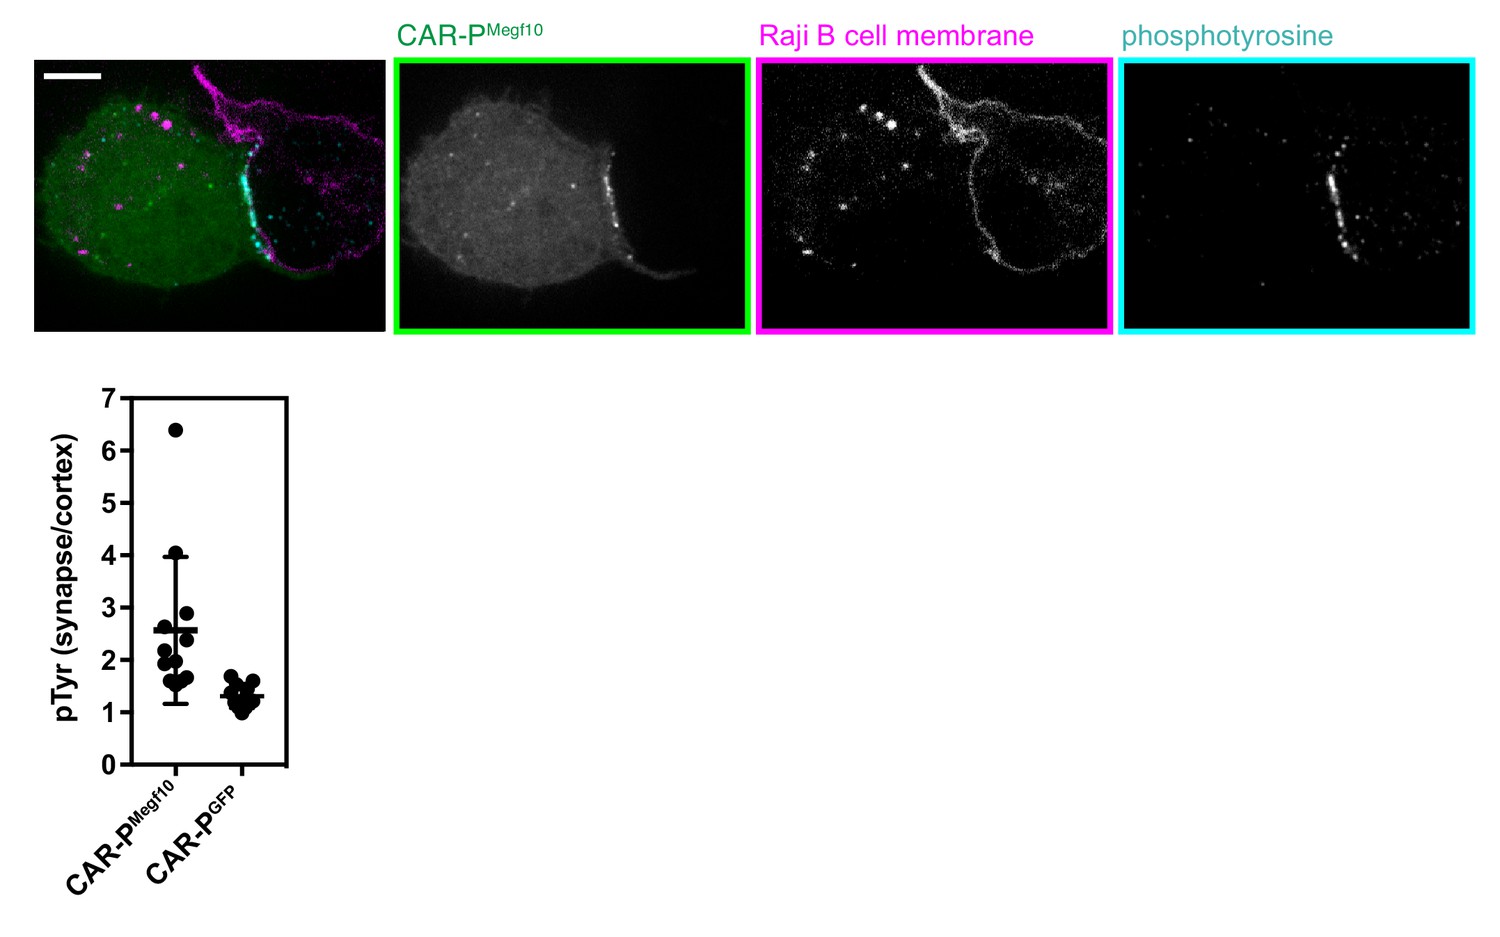
CAR-P localizes with pTyr at synapse with Raji B cell.
Phosphotyrosine staining (teal) of macrophages expressing CAR-PMegf10 (green) in contact with Raji B cells (cell membrane visualized with mCherry-CAAX, magenta). Below, the enrichment at the synapse is quantified as the mean intensity of a five pixel width linescan at the synapse divided by the mean intensity at the adjacent cell cortex for at least 11 sites of contact. Each dot represents one cell-cell synapse, lines represent the mean ±one standard deviation, and the graph is the pooled results o three biological replicates. The scale bar indicates 5 µm.
Figure 4—figure supplement 2
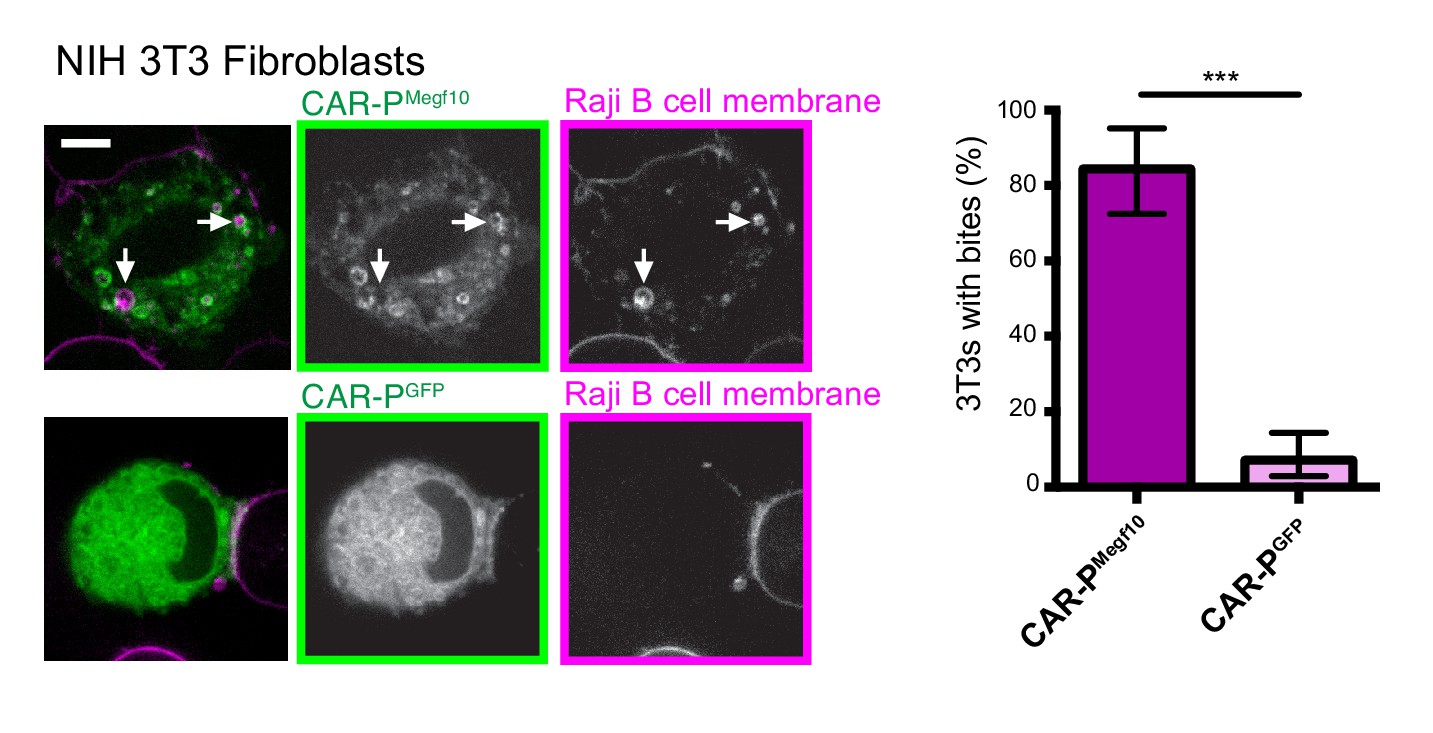
NIH 3T3 cells internalize Raji B cell bites.
NIH 3T3 cells expressing the ɑCD19 CAR-PMegf10 (green in merge, left; greyscale, center) engulf pieces of CD19 +Raji B cells (labeled with mCherry-CAAX; magenta in merge, left; greyscale, right). The control ɑCD19 CAR-PGFP-infected 3T3s are shown below. Arrows point to pieces of ingested Raji B cell. The proportion of cells taking at least one bite after 90 min co-incubation is graphed on the left (graphs show the pooled data of three separate experiments; n = 111 CAR-PMegf10 3T3 cells and 121 CAR-PGFP 3T3; *** indicates p<0.0001 by two-tailed Fisher Exact Test; error bars denote 95% confidence intervals). Bites are defined as a fully internalized piece of mCherry-labeled material >1 µm in diameter.
Figure 4—figure supplement 3
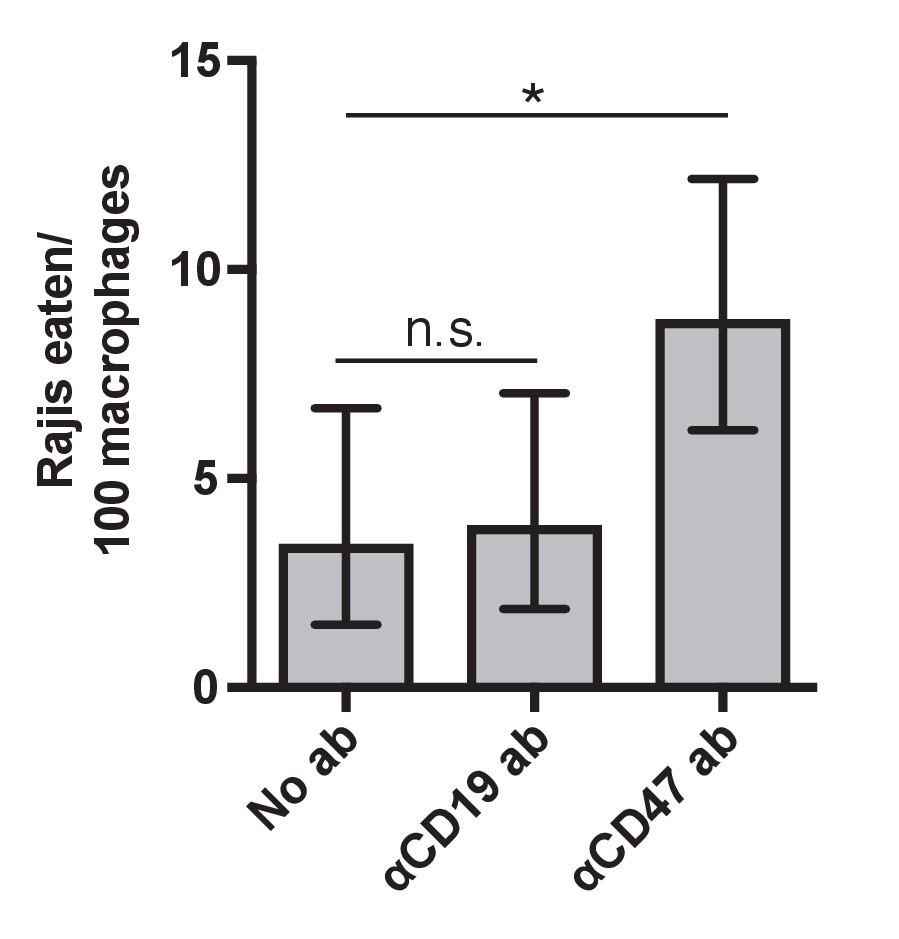
Opsonization by an anti-CD47 antibody enhances whole cell internalization through CAR-P Macrophages expressing CAR-PFcRɣ and Raji B cells were incubated together at a 1:2 macrophage:Raji ratio (20,000 macrophages and 40,000 Rajis) without antibody addition (No ab) or in the presence of anti-CD19 or anti-CD47 antibodies as indicated.
The number of whole Raji B cells eaten per 100 macrophages during 4–8 hr of imaging is graphed. Graph depicts pooled data from three independent experiments; n = 232 with no antibody, n = 257 with anti-CD19 antibody, n = 347 with anti-CD47 antibody; * indicates p<0.05 by two-tailed Fisher Exact test.
Figure 4—figure supplement 4
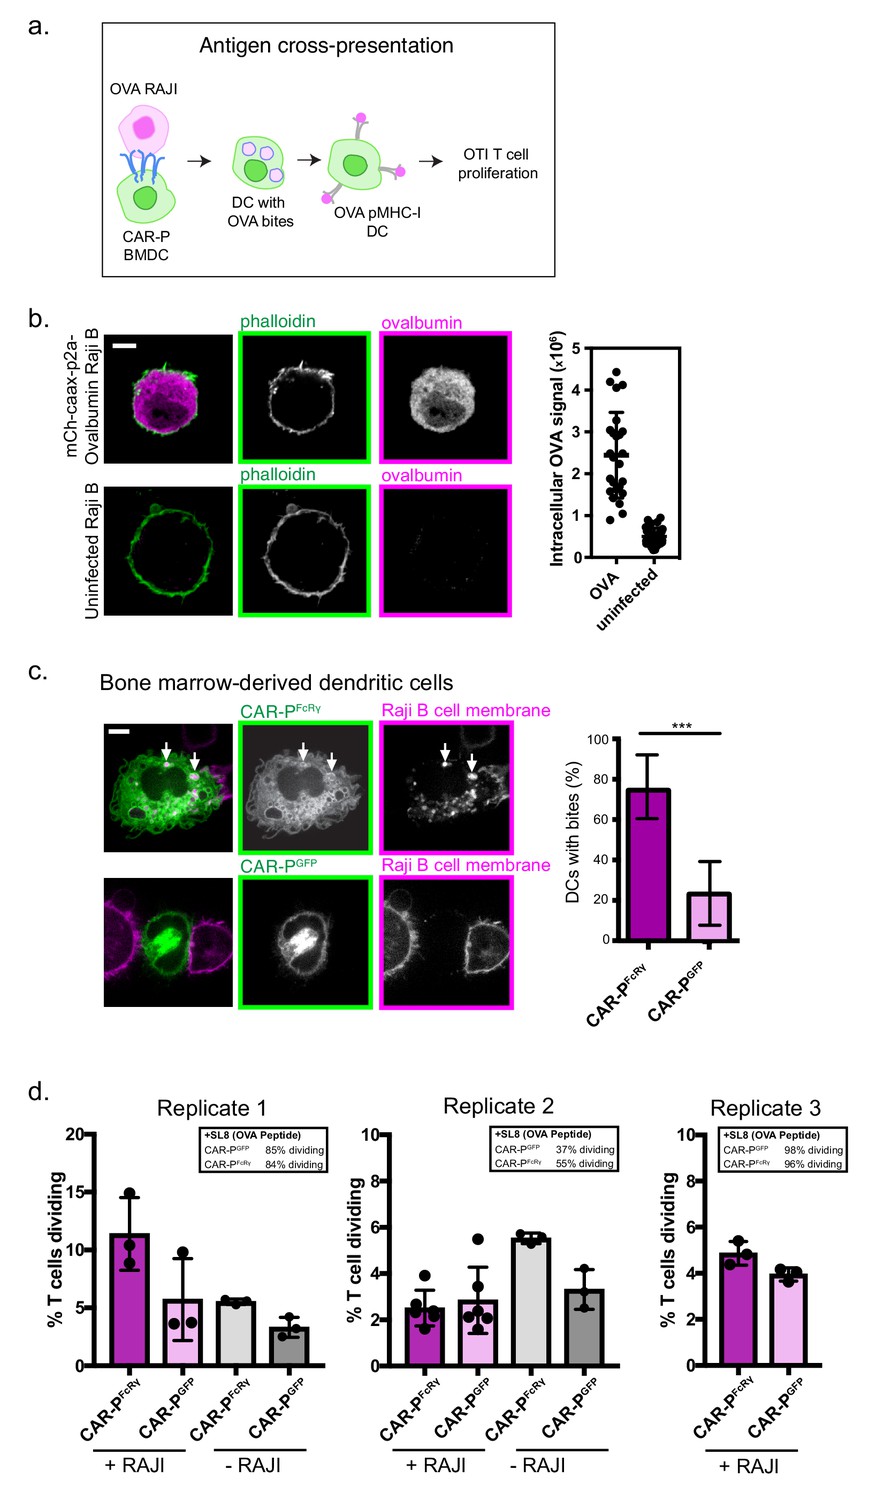
CAR-P promotes internalization of cancer antigen.
(A) Schematic of antigen internalization and cross-presentation assay. CAR-P expressing Bone Marrow Derived Dendritic Cells (BMDC) were differentiated using GM-CS. CAR-P BMDC were incubated with Raji B cells expressing soluble ovalbumin (OVA). DC with OVA bites (internalized antigen) were then incubated with OTI T cells (OVA specific CD8 +T cells) and OTI proliferation assessed as a measure of T cell stimulation. Results from each step of this assay are shown in sequence in (B), (C), and (D). (B) Ovalbumin staining (magenta) in Raji B cells infected with mCherry-CAAX-p2a-Ovalbumin lentivirus (OVA) and uninfected controls (uninfected) shows robust OVA expression in infected cells. At right the intracellular OVA signal is plotted as corrected total cell fluorescence (CTCF) for the ovalbumin channel. Each dot represents the CTCF of one cell; n = 26 cells OVA, n = 33 cells (uninfected); lines represent the mean ±one standard deviation, and the graph is the pooled results of three biological replicates. The scale bar indicates 5 µm. (C) Bone marrow-derived dendritic cells expressing the CAR-PFcRɣ (top panel, green in merge, left; greyscale, center) engulf pieces of CD19 +Raji B cells (labeled with mCherry-CAAX; magenta in merge, left; greyscale, right). The control ɑCD19 CAR-PGFP-infected dendritic cells are shown below. Arrows point to pieces of ingested Raji B cell. The proportion of cells taking at least one bite after 90 min co-incubation is graphed on the right of images. Graphs show the pooled data of two separate experiments; n = 28 CAR-PFcRɣ dendritic cells and n = 33 CAR-PGFP dendritic cells; *** indicates p<0.0001 by two-tailed Fisher Exact Test; error bars denote 95% confidence intervals. Bites are defined as a fully internalized piece of mCherry-labeled material >1 µm in diameter. (D) OTI T cell proliferation after 72 hr incubation with CAR-P transduced CD11c + dendritic cells.±RAJI below the x-axis indicates whether Raji-OVA B cells were added to CAR-P transduced dendritic cells prior to OTI addition. To measure proliferation, T cells were uniformly stained with eFluor670 dye on day 0, and proliferation was measured by dilution of the cell-bound dye. Graphs show the mean ±SD of three independent biological replicates. Data points are values for individual wells of differentiated CD11c + dendritic cells. Boxed data indicate the mean % T cells dividing when dendritic cells were pulsed with SL8 (OVA) peptide, which directly binds to MHC without undergoing cross presentation. If dendritic cell differentiation was successful, the pulsed dendritic cells should be capable of inducing robust OTI proliferation. Sample sizes were selected to match previous studies that were able to detect robust T cell stimulation (Roberts et al., 2016).
Figure 4—video 1
CAR-PMegf10 macrophage engulfs bites of a Raji B cell.
A macrophage infected with ɑCD19 CAR-PMegf10 (green) engages with a Raji B cell (labeled with mCherry-CAAX). The field of view is 43 × 43 µm. The movie is a maximum intensity projection of 7 z-planes acquired at 1 µm intervals. Images were acquired every 20 s for 30 min and time is indicated in the bottom right.
Figure 4—video 2
CAR-PFcRɣ macrophage engulfs a Raji B cell.
A macrophage infected with ɑCD19 CAR-PFcRɣ (green) engages with a Raji B cell (labeled with mCherry-CAAX). The field of view is 53 × 53 µm. Images were acquired every 5 min. Time is indicated in the bottom right.
Figure 4—video 3
CAR-Ptandem macrophage engulfs a Raji B cell.
A macrophage infected with ɑCD19 CAR-Ptandem (green) engages with a Raji B cell (labeled with mCherry-CAAX). The field of view is 53 × 53 µm. Images were acquired every 5 min. Time is indicated in the bottom right.
Tables
Key resources table
| Reagent type (species) or resource | Designation | Source or reference | Identifiers | Additional information |
|---|---|---|---|---|
| Cell line (Mus musculus) | J774A.1 Macrophages | UCSF Cell Culture Facility | ||
| Cell line (Homo sapiens) | Raji B Cells | Other | Obtained from M. McManus, UCSF | |
| Cell line (Mus musculus) | 3t3 Fibroblasts | UCSF Cell Culture Facility | ||
| Cell line (Mus musculus) | C57BL/6J | PMID: 21356739 | Bone Marrow Derived Macrophages (BMDM) | |
| Cell line (Mus musculus) | C57BL/6J | PMID: 7489412 | Bone Marrow derived Dendritic Cells (BMDC) | |
| Cell line (Homo sapiens) | HEK293T cells | UCSF Cell Culture Facility | Lentivirus production | |
| Genetic Reagent (Mus musculus) | OTI | PMID: 8287475 | E. Roberts/M. Krummel Lab UCSF | |
| Recombinant DNA reagent | CD19-mMegf10 CAR | this paper | Signal peptide: aa 1–21 CD8 (Uniprot Q96QR6_HUMAN) Extracellular antibody sequence: V-L chain: aa 23–130 anti-CD19 CAR (Genbank AMZ04819) -- GS linker: ggtggcggtggctcgggcggtggtgggtcgggt ggcggcggatct -- V-H chain: aa 148–267 anti-CD19 CAR (Genbank AMZ04819) Stalk/Transmembrane: aa 138–206 CD8 (Uniprot Q96QR6_HUMAN) Cytosolic sequence: aa 879–1147 Mouse Megf10 (Uniprot Q6DIB5 (MEG10_MOUSE)) Fluorophore: mGFP | |
| Recombinant DNA reagent | CD19-FcGamma CAR | this paper | Signal peptide: aa 1–21 CD8 (Uniprot Q96QR6_HUMAN) Extracellular antibody sequence: V-L chain: aa 23–130 anti-CD19 CAR (Genbank AMZ04819) -- GS linker: ggtggcggtggctcgggcggtggtgggtcgg gtggcggcggatct -- V-H chain: aa 148–267 anti-CD19 CAR (Genbank AMZ04819) Stalk/Transmembrane: aa 138–206 CD8 (Uniprot Q96QR6_HUMAN) Cytosolic sequence: aa 19–86 Mouse Fc ERG precursor (Uniprot P20491 (FCERG_MOUSE)) Fluorophore: mGFP | |
| Recombinant DNA reagent | CD19-empty CAR | this paper | Signal peptide: aa 1–21 CD8 (Uniprot Q96QR6_HUMAN) Extracellular antibody sequence: V-L chain: aa 23–130 anti-CD19 CAR (Genbank AMZ04819) -- GS linker: ggtggcggtggctcgggcggtggtgggtcggg tggcggcggatct -- V-H chain: aa 148–267 anti-CD19 CAR (Genbank AMZ04819) Stalk/Transmembrane: aa 138–206 CD8 (Uniprot Q96QR6_HUMAN) Cytosolic sequence: basic linker NHRNRRR (nucleotide AACCACAGG AACCGAAGACGT) Fluorophore: mGFP | |
| Recombinant DNA reagent | CD22-Megf10 CAR | this paper | Signal peptide: aa 1–21 CSF2R (Uniprot P15509 (CSF2R_HUMAN)) Extracellular antibody sequence: aa 22–258 of translated JP 2016502512-A/1: M971 Chimeric Antigen (Genbank HZ530416.1) Stalk/Transmembrane: aa 138–206 CD8 (Uniprot Q96QR6_ HUMAN) Cytosolic sequence: aa 879–1147 Mouse Megf10 (Uniprot Q6DIB5 (MEG10_ MOUSE)) Fluorophore: mGFP | |
| Recombinant DNA reagent | CD22-empty CAR | this paper | Signal peptide: aa 1–21 CSF2R (Uniprot P15509 (CSF2R_HUMAN)) Extracellular antibody sequence: aa 22–258 of translated JP 2016502512-A/1: M971 Chimeric Antigen (Genbank HZ530416.1) Stalk/Transmembrane: aa 138–206 CD8 (Uniprot Q96QR6_HUMAN) Cytosolic sequence: basic linker NHRNRRR (nucleotide AACCACAGGAACCGAAGACGT) Fluorophore: mGFP | |
| Recombinant DNA reagent | CD19-MerTK CAR | this paper | Signal peptide: aa 1–21 CD8 (Uniprot Q96QR6 _HUMAN) Extracellular antibody sequence: V-L chain: aa 23–130 anti-CD19 CAR (Genbank AMZ04819) -- GS linker: ggtg gcggtggctcgggcggtggtgggtcgggtggcggcggatct -- V-H chain: aa 148–267 anti-CD19 CAR (Genbank AMZ04819) Stalk/Transmembrane: aa 138–206 CD8 (Uniprot Q96QR6_HUMAN) Cytosolic sequence: aa 519–994 Mouse MerTK (Uniprot Q60805 (MERTK_MOUSE)) Fluorophore: mGFP | |
| Recombinant DNA reagent | CD19-Bai1 CAR | this paper | Signal peptide: aa 1–21 CD8 (Uniprot Q96QR6_HUMAN)Extracellular antibody sequence: V-L chain:aa 23–130 anti-CD19 CAR (Genbank AMZ04819)-- GS linker: ggtggcggtggctcgggcggtggtgggtcgggtggcgg cggatct -- V-H chain: aa 148–267 anti-CD19 CAR (GenbankAMZ04819) Stalk/Transmembrane: aa 138–206 CD8 (UniprotQ96QR6_HUMAN) Cytosolic sequence: aa1188–1582 Mouse Bai1 (Uniprot Q3UHD1 (BAI1_MOUSE)) Fluorophore: mGFP | |
| Recombinant DNA reagent | CD19-CD3zeta CAR | this paper | Signal peptide: aa 1–21 CD8 (Uniprot Q96QR6_ HUMAN) Extracellular antibody sequence: V-L chain: aa 23–130 anti-CD19 CAR (Genbank AMZ04819) -- GS linker: ggtggcggtggctcg ggcggtggtgggtcgggtggcggcggatct -- V-H chain: aa 148–267 anti-CD19 CAR (Genbank AMZ04819) Stalk/Transmembrane: aa 138–206 CD8 (Uniprot Q96QR6_HUMAN) Cytosolic sequence: aa 52–164, Human TCR CD3 zeta chain (Uniprot P20963) Fluorophore: sfGFP | |
| Recombinant DNA reagent | CD19-PI3K CAR | this paper | Signal peptide: aa 1–21 CD8 (Uniprot Q96QR6 _HUMAN) Extracellular antibody sequence: V-L chain: aa 23–130 anti-CD19 CAR (Genbank AMZ04819) -- GS linker: ggtggcggtggct cgggcggtggtgggtcgggtggcggcggatct -- V-H chain: aa 148–267 anti-CD19 CAR (Genbank AMZ04819) Stalk/Transmembrane: aa 138–206 CD8 (Uniprot Q96QR6_HUMAN) Cytosolic sequence: aa 500–534 Mouse CD19 (Uniprot CD19_MOUSE) Fluorophore: mCherry | |
| Recombinant DNA reagent | CD19 tandem CAR | this paper | Signal peptide: aa 1–21 CD8 (Uniprot Q96QR6_ HUMAN) Extracellular antibody sequence: V-L chain: aa 23–130 anti-CD19 CAR (Genbank AMZ04819) -- GS linker: ggtggcggtggctc gggcggtggtgggtcgggtggcggcggatct -- V-H chain: aa 148–267 anti-CD19 CAR (Genbank AMZ04819) Stalk/Transmembrane: aa 138–206 CD8 (Uniprot Q96QR6_HUMAN) Cytosolic sequence: aa 500–534 Mouse CD19 (Uniprot CD19 _MOUSE) fused to aa 19–86 Mouse Fc ERG precursor (FCERG_MOUSE) Fluorophore: mGFP | |
| Recombinant DNA reagent | GFP-CaaX | this paper | eGFP fused to a c terminal CaaX targeting sequence: aaaatgtccaaggatggta agaaaaagaagaagaagtcaaaaaccaagtgtgttatcatg | |
| Recombinant DNA reagent | mCherry-CaaX | this paper | mCherry fused to a c terminal CaaX targeting sequence: aaaatgtccaaggatggt aagaaaaagaagaagaagtcaaaaaccaagtgtgttatcatg | |
| Recombinant DNA reagent | OVA/p2a/mCherry-CaaX | this paper | Cytoplasmic Ovalbumin (UNIPROT: SERPINB14)/p2 a site: GGAAGCGGAGCTACTAA CTTCAGCCTGCTGAAGCAGGCTGGAGA CGTGGAGGAGAACCCTGGACCT/followed by mCherry fused to a c terminal CaaX targeting sequence: aaaatgtccaaggatggtaagaaaaagaag aagaagtcaaaaaccaagtgtgttatcatg | |
| Peptide, recombinant protein | His10-CD3 zeta | Hui and Vale (2014) PMID: 24463463 | aa 52–164, Human TCR CD3 zeta chain (Uniprot CD3Z_HUMAN) fused to Hisx10 tag | |
| Peptide, recombinant protein | His10-FcRɣ | this paper | aa 45–85, Human FcRɣ (Uniprot FCERG _HUMAN) fused to Hisx10 tag | |
| Peptide, recombinant protein | SNAP-Syk tSH2 | this paper | aa 1–262, Mouse Syk (Uniprot KSYK_MOUSE) with N-term SNAP tag | |
| Peptide, recombinant protein | His10-Lck Y505F | Hui and Vale (2014) PMID: 24463463 | full length Human Lck with inhibitory Tyr 505 mutated to Phe (Uniprot LCK_HUMAN) fused to Hisx10 tag | |
| Antibody | anti phospho-Tyrosine | Santa Cruz | PY20 | 1:100 IF primary |
| Antibody | anti mouse IgG coupled to Alexa Fluor 647 | Thermo/Lifetech | A21236 | 1:200 IF secondary |
| Antibody | anti mouse CD11c coupled to APC | BioLegend | 117313 | FACS |
| Antibody | anti mouse F4/80 coupled to APC/Cy7 | BioLegend | 123117 | FACS |
| Other | DMEM | Gibco | 11965–092 | |
| Other | Pen-Strep-Glutamine | Corning | 30–009 Cl | |
| Other | Fetal Bovine Serum (FBS) | Atlanta Biologicals | S1150H | |
| Other | RPMI | Gibco | 11875–093 | |
| Other | HEPES | Gibco | 1530080 | |
| Other | 2-Mercaptoethanol | Sigma | M6250-100mL | |
| Commercial assay or kit | MycoAlert Mycoplasma Testing Kit | Lonza | LT07-318 | |
| Recombinant DNA reagent | pMD2.G lentiviral plasmid | other | Addgene 12259 | D. Stainier, Max Planck; VSV-G envelope |
| Recombinant DNA reagent | pCMV-dR8.91 | other | Current Addgene 8455 | |
| Recombinant DNA reagent | pHRSIN-CSGW | other | As cited James and Vale (2012), PMID: 22763440 | |
| Other | Lipofectamine LTX | Invitrogen | 15338–100 | Lentivirus production |
| Other | Lipofectamine | Invitrogen | 18324–012 | Added to spin infections to improve transduction |
| Other | Hamilton Gastight Syringes | Hamilton | 8 1100 | |
| Other | POPC | Avanti | 850457 | |
| Other | Ni2+-DGS-NTA | Avanti | 790404 | |
| Other | PEG5000-PE | Avanti | 880230 | |
| Other | atto390 DOPE | ATTO-TEC GmbH | AD 390–161 | |
| Other | PBS (Tissue Culture Grade) | Gibco | 20012050 | |
| Other | Bioruptor Pico | Diagenode | Used for producing SUVs | |
| Other | 5 um silica microspheres | Bangs | SS05N | |
| Peptide, recombinant protein | CD19-His8 | Sino Biological | 11880H08H50 | |
| Peptide, recombinant protein | CD22-His8 | Sino Biological | 11958H08H50 | |
| Other | 2.5 um silica microspheres (size titration) | Corpuscular | C-SIO-2.5 | |
| Other | 5 um silica microspheres (size titration) | Corpuscular | C-SIO-5 | |
| Other | 10 um silica microspheres (size titration) | Corpuscular | C-SIO-10 | |
| Other | 15 um silica microspheres (size titration) | Corpuscular | C-SIO-15 | |
| Other | 20 um silica microspheres (size titration) | Corpuscular | C-SIO-20 | |
| Other | Low retention tubes for microsphere cleaning | Eppendorf | 22431081 | |
| Other | MatriPlate | Brooks | MGB096-1-2-LG-L | |
| Peptide, recombinant protein | M-CSF | Peprotech | 315–02 | |
| Other | IMDM | Thermo | 12440079 | |
| Other | Retronectin | Clontech | T100A | |
| Commercial assay or kit | CD8 + T cell purification kit | Stemcell | 19853 | |
| Other | eFluor670 proliferation dye | Thermo | 65-0840-85 | |
| Chemical compound, drug | phRSIN-CSGW | Sigma | L4516 | |
| Other | Fluorobrite DMEM | Gibco | A1896701 | |
| Other | DMEM minus phenol red | Gibco | A14430-01 | |
| Other | Rhodamine PE | Avanti | 810150C | |
| Other | DOPS | Avanti | 840035C | |
| Other | SNAP-Cell 505-Star | NEB | S9103S | |
| Other | PD MiniTrap G-25 column | GE Healthcare | 28-9225-29 AB | |
| Other | 6.4% Paraformaldehyde solution | Electron Microscopy Sciences | 50980495 | |
| Chemical compound, drug | AlexaFluor 647 Phalloidin | Thermo/Molecular Probes | A22284 | |
| Software, algorithm | ImageJ | NIH | ||
| Software, algorithm | Illustrator | Adobe | CC, CS6 | |
| Software, algorithm | Photoshop | Adobe | CC, CS6 | |
| Software, algorithm | Fiji | https://fiji.sc/ | ||
| Software, algorithm | Prism | GraphPad | 7 | |
| Antibody | anti human CD19 (mouse antibody) | OriGene | TA506240 Clone OTI2F6 | IgG2a mouse monoclonal antibody |
| Antibody | anti human CD47 (mouse antibody) | BD | 556044 Clone B6H12 | IgG1 mouse monoclonal antibody |
| Antibody | anti Ovalbumin (rabbit antibody) | Pierce | PA1-196 | IgG rabbit polyclonal antibody |
Additional files
-
Transparent reporting form
- https://doi.org/10.7554/eLife.36688.017
Download links
A two-part list of links to download the article, or parts of the article, in various formats.
Downloads (link to download the article as PDF)
Open citations (links to open the citations from this article in various online reference manager services)
Cite this article (links to download the citations from this article in formats compatible with various reference manager tools)
Chimeric antigen receptors that trigger phagocytosis
eLife 7:e36688.
https://doi.org/10.7554/eLife.36688


