The Ca2+ transient as a feedback sensor controlling cardiomyocyte ionic conductances in mouse populations
- Northeastern University, United states
- Northeastern University, United States
- Cardiovascular Research Laboratory, David Geffen School of Medicine, University of California, United states
- David Geffen School of Medicine, University of California, United States
Figures
Figure 1
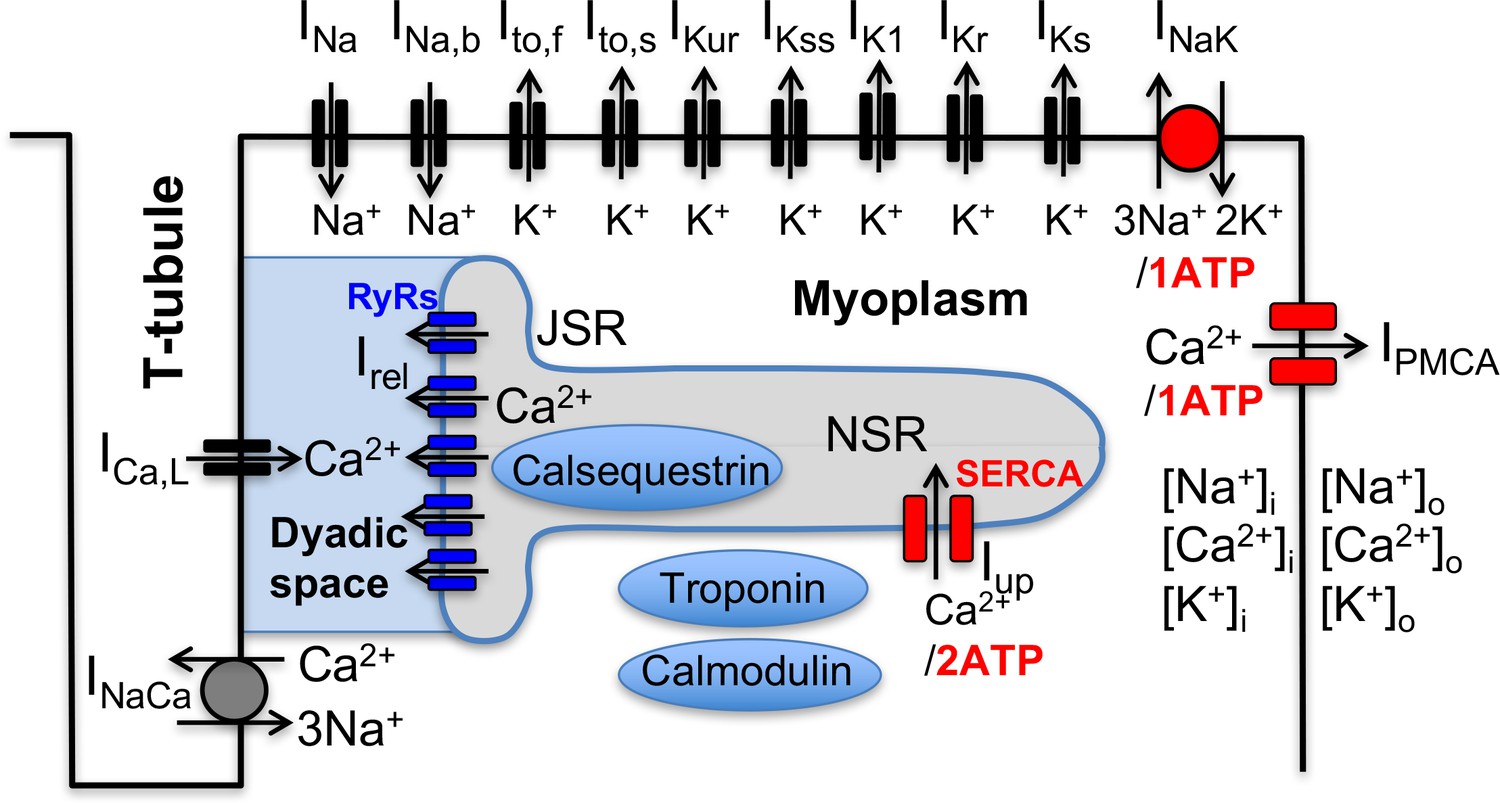
Schematic representation of the sarcolemmal currents and intracellular Ca2+ cycling proteins of the mouse ventricular myocyte model.
https://doi.org/10.7554/eLife.36717.002
Figure 2
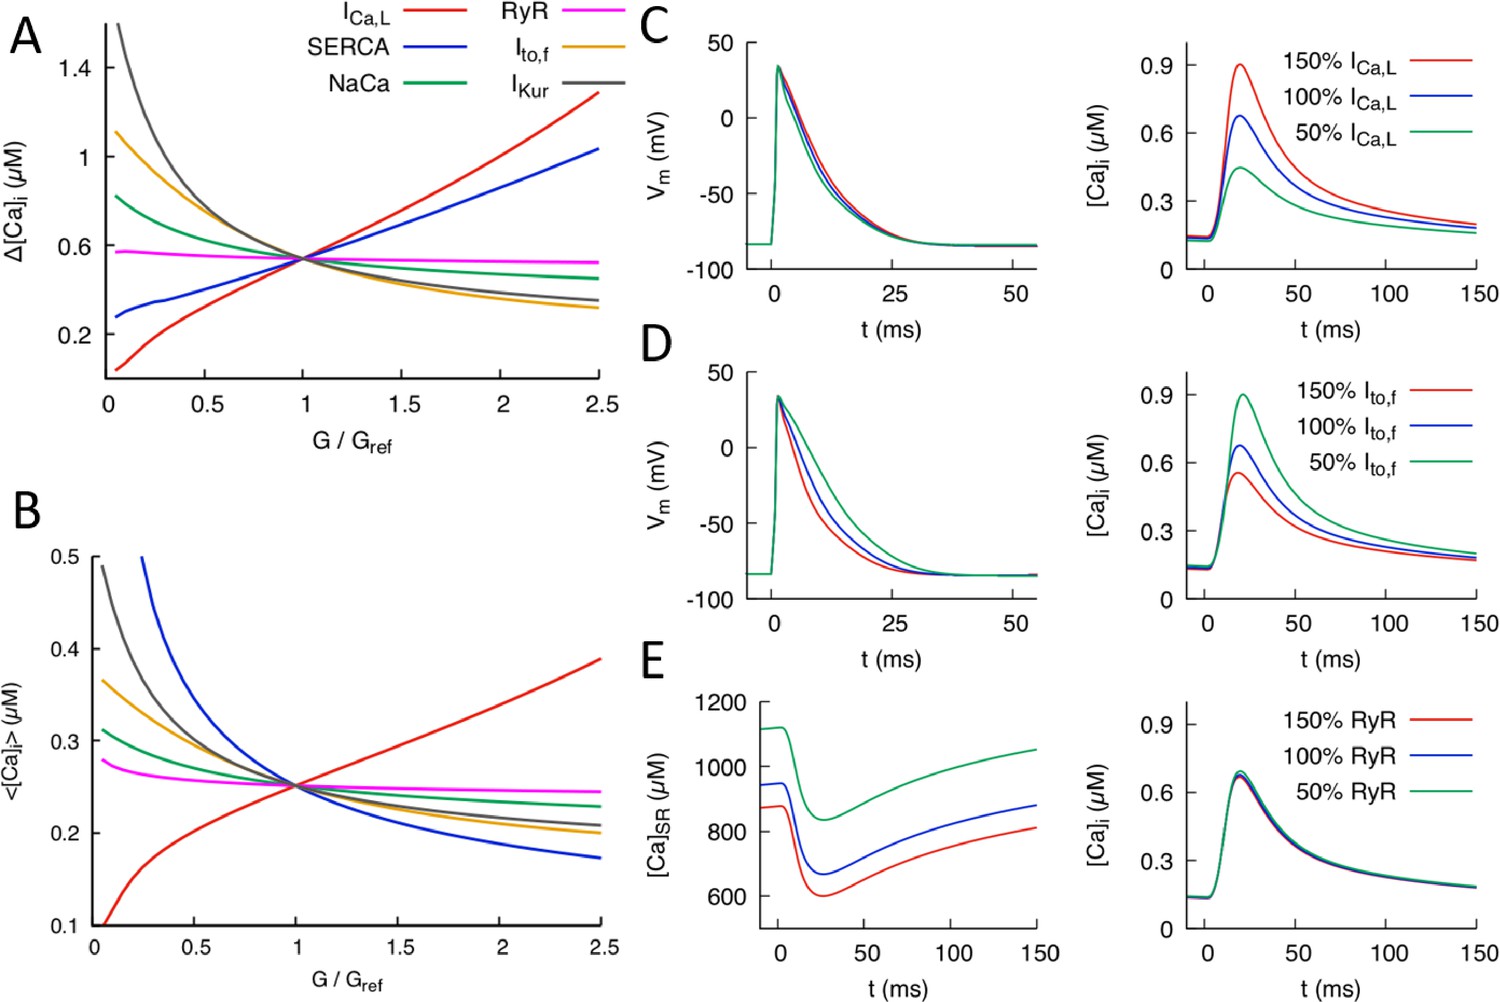
Effects of individual conductances on the Ca2+ transient (CaT).
(A) CaT amplitude defined as the difference between the peak and diastolic values of the cytosolic Ca2+ concentration versus G/Gref where G is the individual conductance value and Gref some fixed reference value. (B) Time-averaged over one pacing period () versus G/Gref. Illustration of the effect of varying conductance (C) and conductance (D) on AP and CaT profiles, where 50%, 100%, and 150% correspond to Gref=0.5, 1.0, and 1.5, respectively. (E) Effect of varying RyR conductance on SR Ca2+concentration and CaT. Different time windows are plotted for the CaT and SR load (0 to 150 ms) and AP waveforms (0 to 50 ms) in (C-–E).
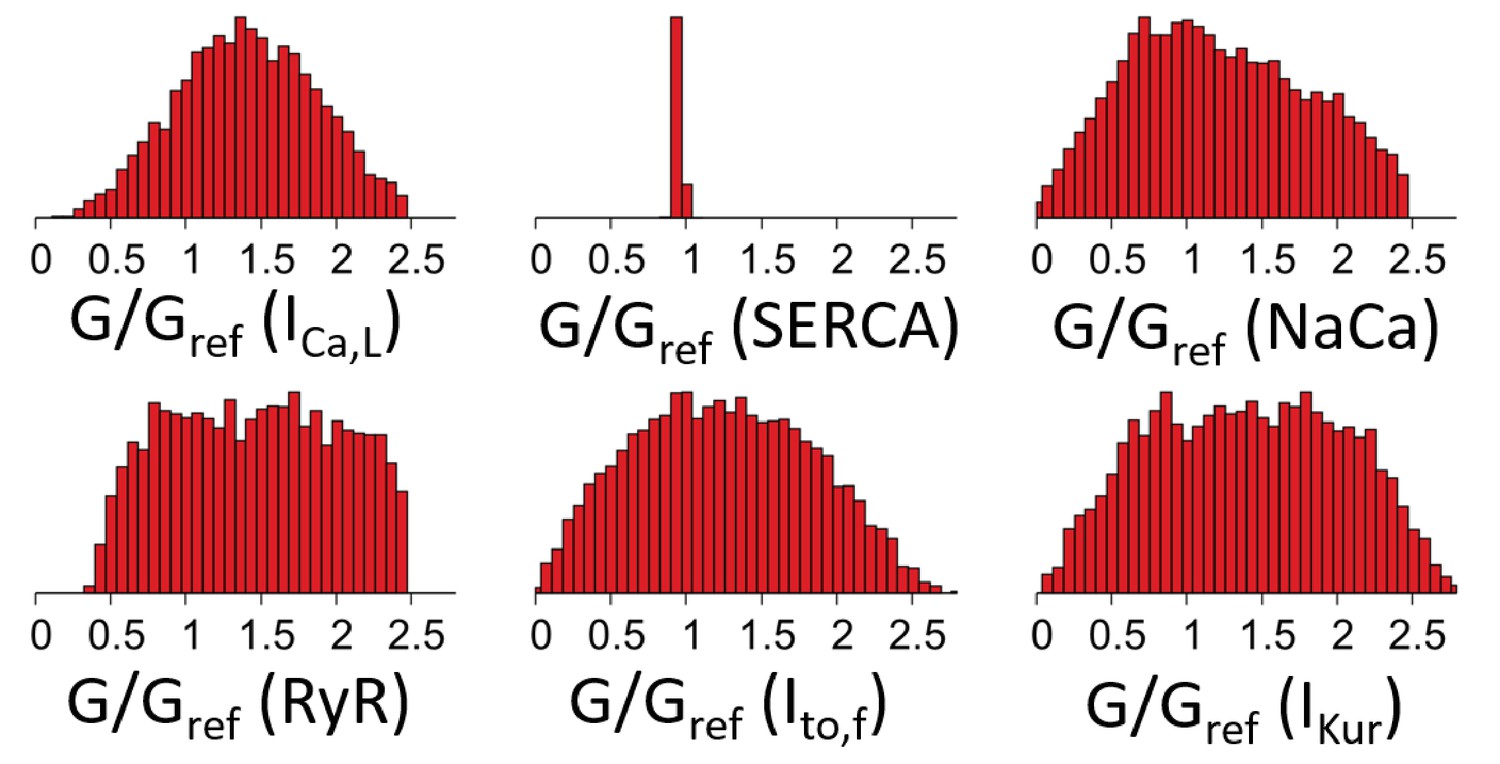
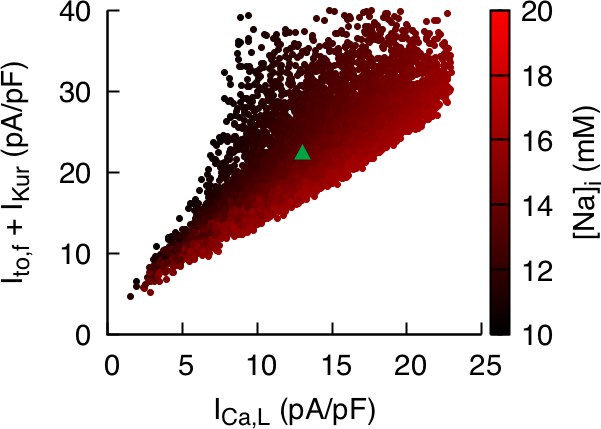
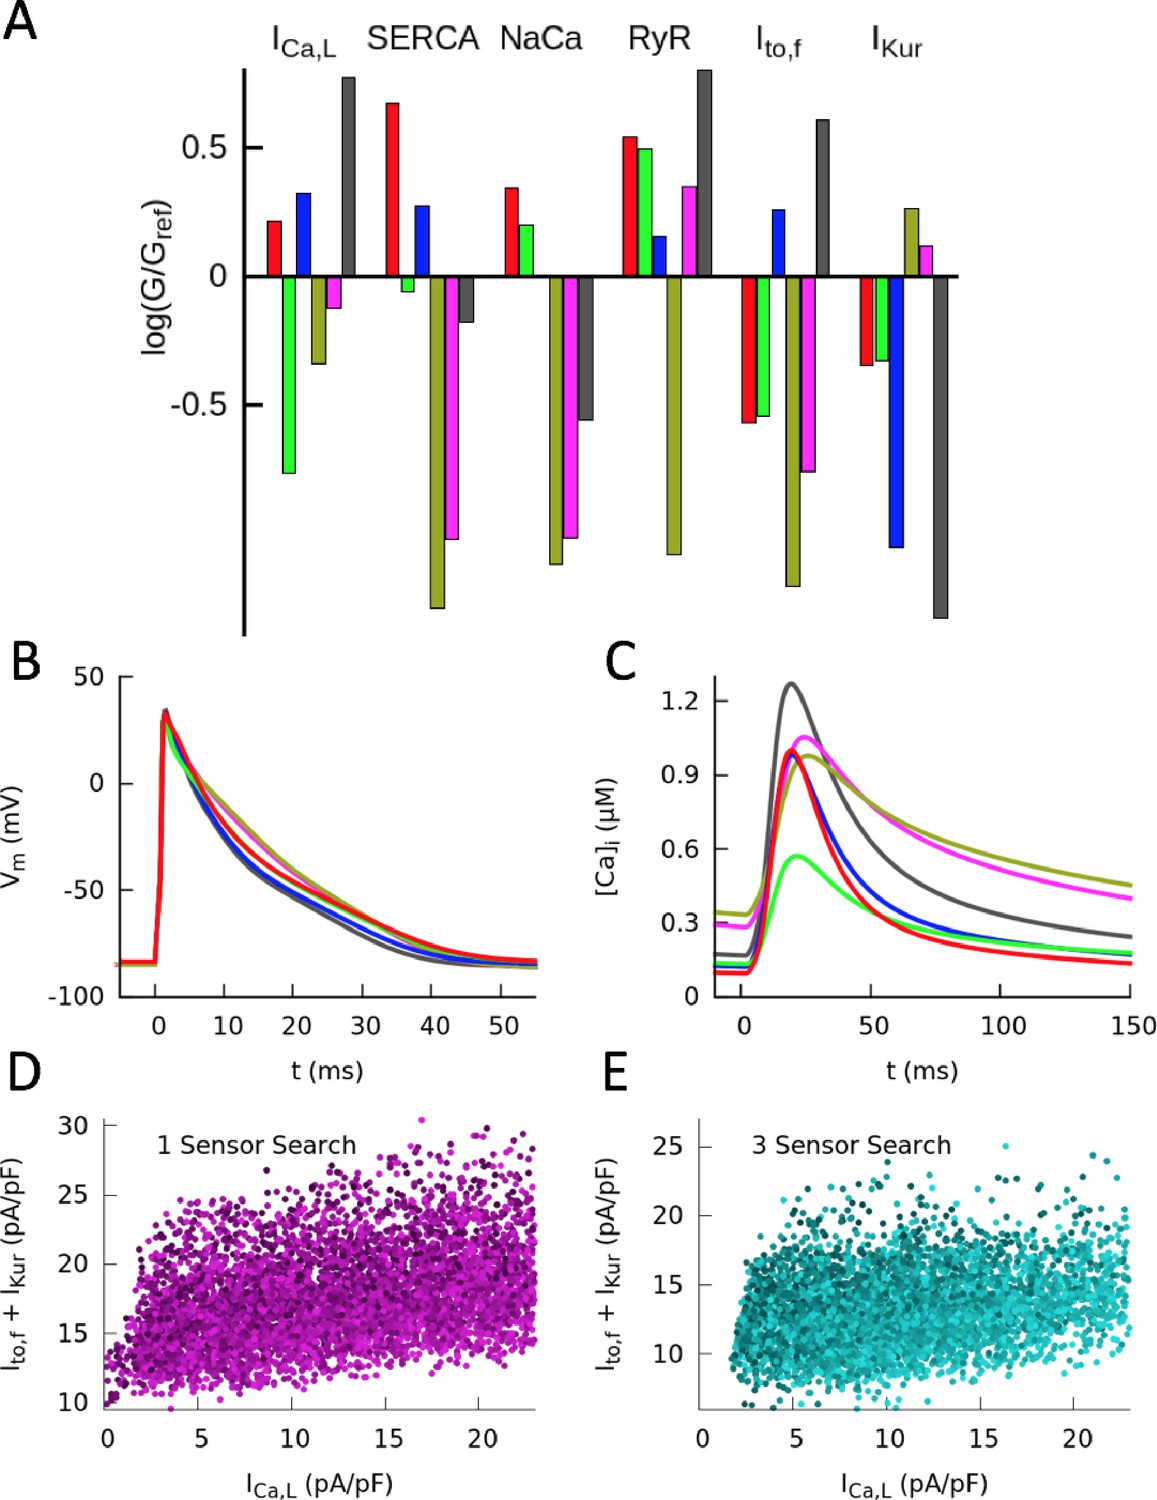
Figure 3 with 3 supplements

Computationally determined good enough solutions (GES) with calcium sensing.
(A) Examples of GES representing combinations of 6 conductances that produce a normal CaT and intracellular Na+ concentration. Each color represents a different GES and the corresponding AP and CaT profiles are shown in B) and C), respectively. (D) Histograms of individual normalized conductances G/Gref for a collection of 7263 GES showing that some conductances are highly variable while others are highly constrained. (E) Three-dimensional (3D) plot revealing a three-way compensation between conductances of , , and . Each GES is represented by a red dot. All GES lie close to a 2D surface in this 3D plot. Pairwise projections (grey shadows) do not show evidence of two-way compensation between pairs of conductances. (F) Alternate representation of three-way compensation obtained by plotting versus the sum of and . Peak values of those currents after a voltage step from −50 to 0 mV are used to make this plot that can be readily compared to experiment. Different time windows are plotted for the AP waveforms and CaT in B and C, respectively.
Figure 3—figure supplement 1
Histograms of individual ion channel conductances in 8320 GESs found by a GES search constrained only by Ca2+ transient amplitude and average, but not constrained by intracellular sodium concentration .
https://doi.org/10.7554/eLife.36717.005
Figure 3—figure supplement 2
Correlation between and the sum of and is weaker but still significant when intracellular sodium concentration is not constrained.
https://doi.org/10.7554/eLife.36717.006
Figure 3—figure supplement 3
Computationally determined GES with voltage sensing.
(A) Examples of GES representing combinations of 6 conductances that produce a normal AP with predominantly voltage sensing. Sensors are = , = and = with . Each color represents a different GES and the corresponding AP and CaT profiles are shown in (B) and (C), respectively. Correlation between and the sum of and is not present among models constrained by (D) or by , and (E).
Figure 4 with 1 supplement
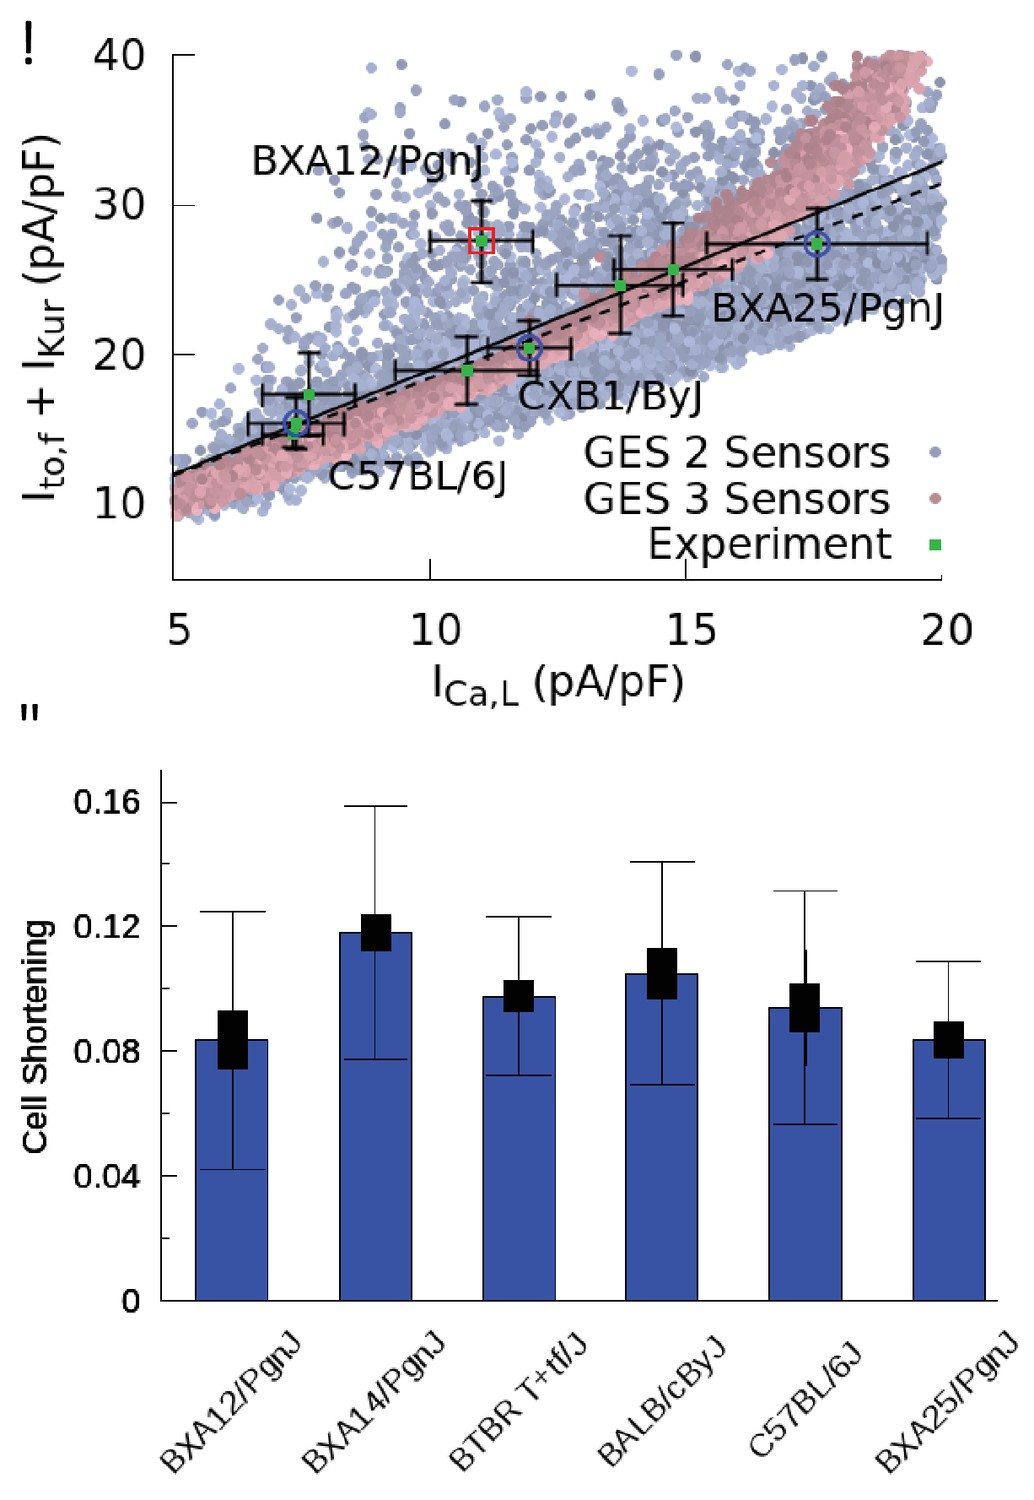
Good enough solutions in the Hybrid Mouse Diversity Panel (HMDP).
(A) Central result of this paper showing quantitative agreement between theoretically predicted and experimentally measured compensation of inward Ca2+ and outward K+ currents. Equivalent plot of Figure 3F showing the sum of and versus for nine different mouse strains using peak values of those currents (proportional to conductances) after a voltage step from −50 to 0 mV. Mean current values (green filled squares) are shown together with standard errors of the mean (thin bars) for each strain. The number of cells used for each strain is given in Table 1 of the Materials and methods section. Computationally determined GES are superimposed and shown as faded red points using all three sensors (CaT amplitude, average , and diastolic ) and faded blue points for two sensors (CaT amplitude and average ). Lines represent linear regression fits using the method of Chi-squared minimization with errors in both coordinates including (solid line, p=0.0144) and excluding (dashed line, p=0.0007) the outlier strain BXA12/PgnJ marked by a red box. The small p values of those fit validate the computationally predicted three-way compensation of Ca2+ and K+ currents. The three strains selected for the organ scale study (C57BL/6J, CXB1/ByJ, and BXA25/PgnJ) with low, medium, and high conductance, respectively, are highlighted by blue circles. (B) Cell shortening, measured as the fraction of resting cell length at 4 Hz pacing frequency in different HMPD strains where thick and thin bars correspond to standard error of the mean and standard deviation, respectively. A standard ANOVA test shows no significant differences in cell shortening between strains (p=0.4136) supporting the hypothesis that different combinations of conductances produce a similar CaT and contractile activity.
Figure 4—figure supplement 1
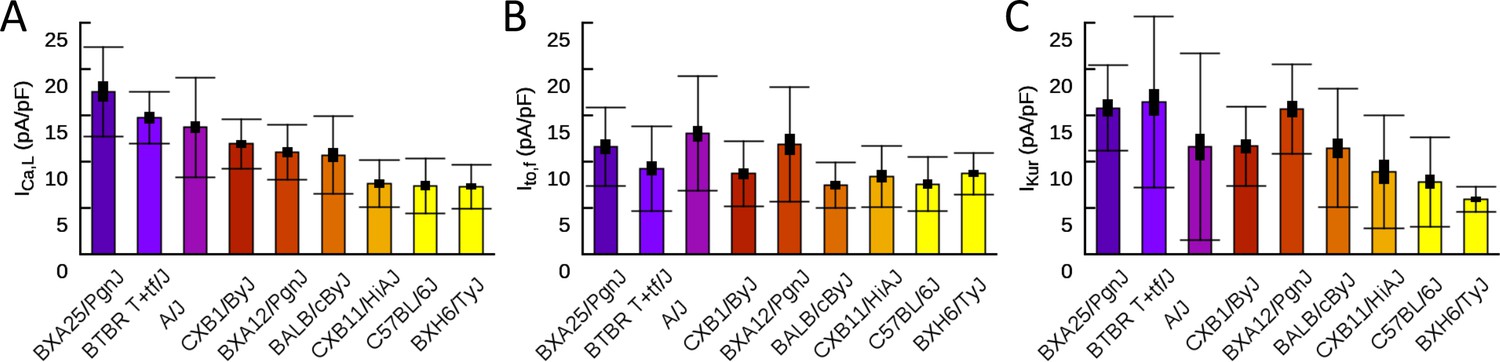
Patch clamp measurements of mean (A), (B), and (C) functional current density averaged over multiple cells for nine HMDP mouse strains with standard errors (thick bars) and standard deviations (thin bars).
https://doi.org/10.7554/eLife.36717.009
Figure 5 with 2 supplements
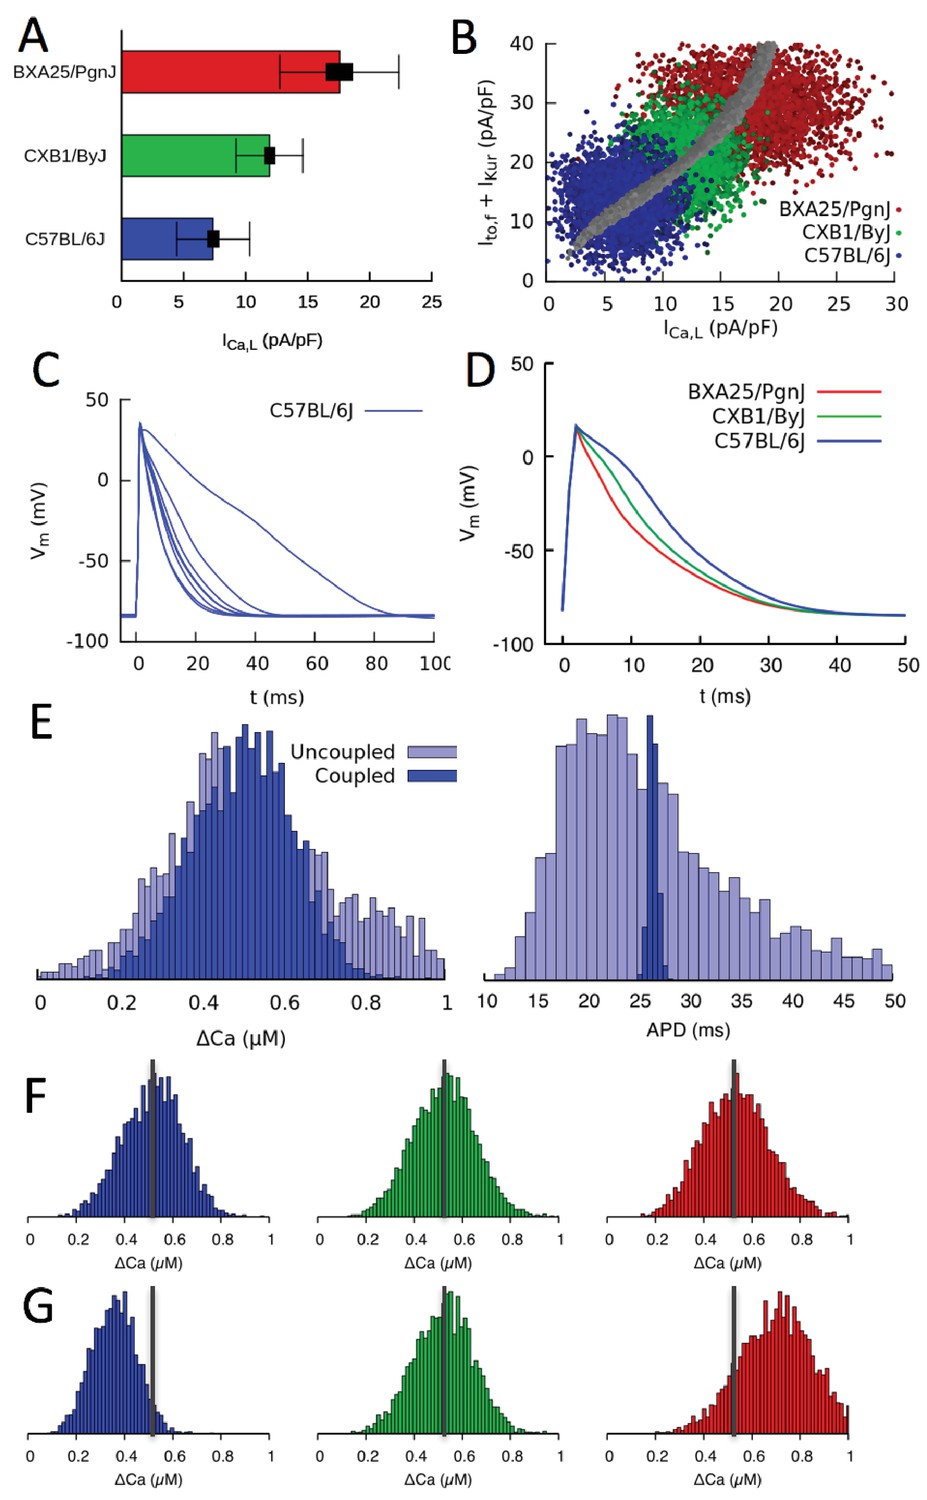
Organ scale compensation.
(A) Mean conductance in three different HMDP strains where thick and thin bars denote standard error and standard deviation, respectively. (B) Sets of conductances generated to be representative of individual cells within ventricular tissue of the three strains by assigning normally distributed random values to the , and conductances using experimentally determined means and standard deviations. The blue, green, and red points correspond to the three HMDP strains with low (C57BL/6J), medium (CXB1/ByJ), and high (BXA25/PgnJ) conductance, respectively, and the grey points are the results of the three-sensor GES search (same as Figure 3F). (C) Variable AP waveforms in uncoupled myocytes with conductances randomly chosen from the distribution shown in B for C57BL/6J and D) AP waveforms for coupled myocytes in tissue for C57BL/6J and the two other strains. AP waveforms of uncoupled cells vary significantly from cell to cell as observed experimentally (Fig. Figure 5—figure supplement 1) but are uniform in electrotonically coupled cells, as expected. (E) Histograms of Ca2+ transient (CaT) amplitude (Ca) and action potential duration (APD) for C57BL/6J in electrotonically uncoupled and coupled cells. Importantly, in coupled cells, the more uniform APD translates into a much more uniform CaT amplitude, reflecting the strong effect of the cell’s APD on its CaT amplitude. (F) Distribution of CaT amplitudes within electrotonically coupled cells in tissue scale simulations using the parameter distributions from B. The three strains have the same mean CaT amplitude averaged over all cells marked by a thick vertical gray line, thereby demonstrating that compensation of Ca2+ and K+ currents remains operative at a tissue scale. (G) Distribution of CaT amplitudes obtained by varying only conductance and with and conductances fixed to their reference values. Lack of compensation between Ca2+ and K+ currents in this case yields different mean CaT amplitude.
Figure 5—figure supplement 1
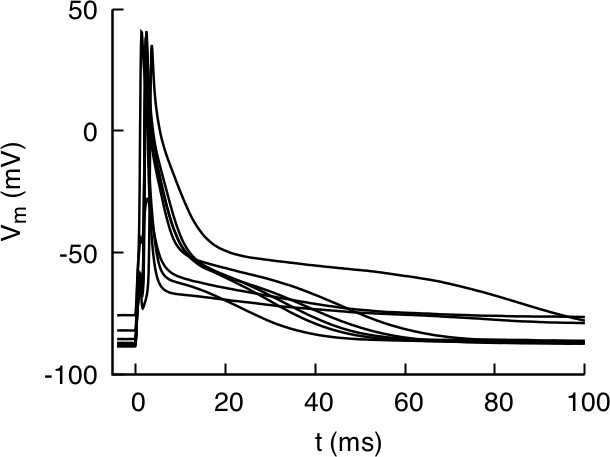
Action potential recordings from isolated myocytes for mouse strain C57BL/6J paced at 4 Hz under current clamp.
The recordings illustrate the typical degree of cell-to-cell variability of AP morphology observed in all strains.
Figure 5—figure supplement 2
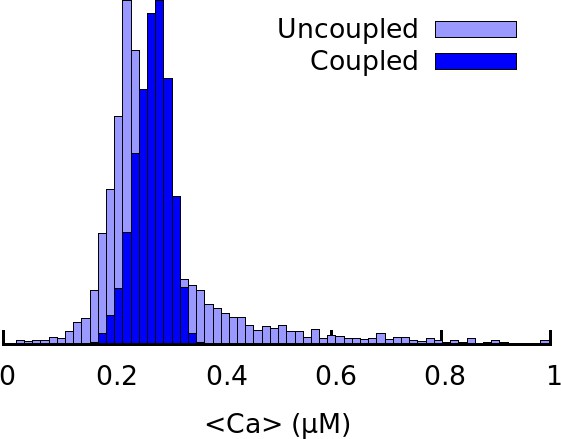
Histogram of average Ca2+ concentration corresponding to Figure 5E for C57BL/6J in electrotonically uncoupled and coupled cells.
https://doi.org/10.7554/eLife.36717.013
Figure 6
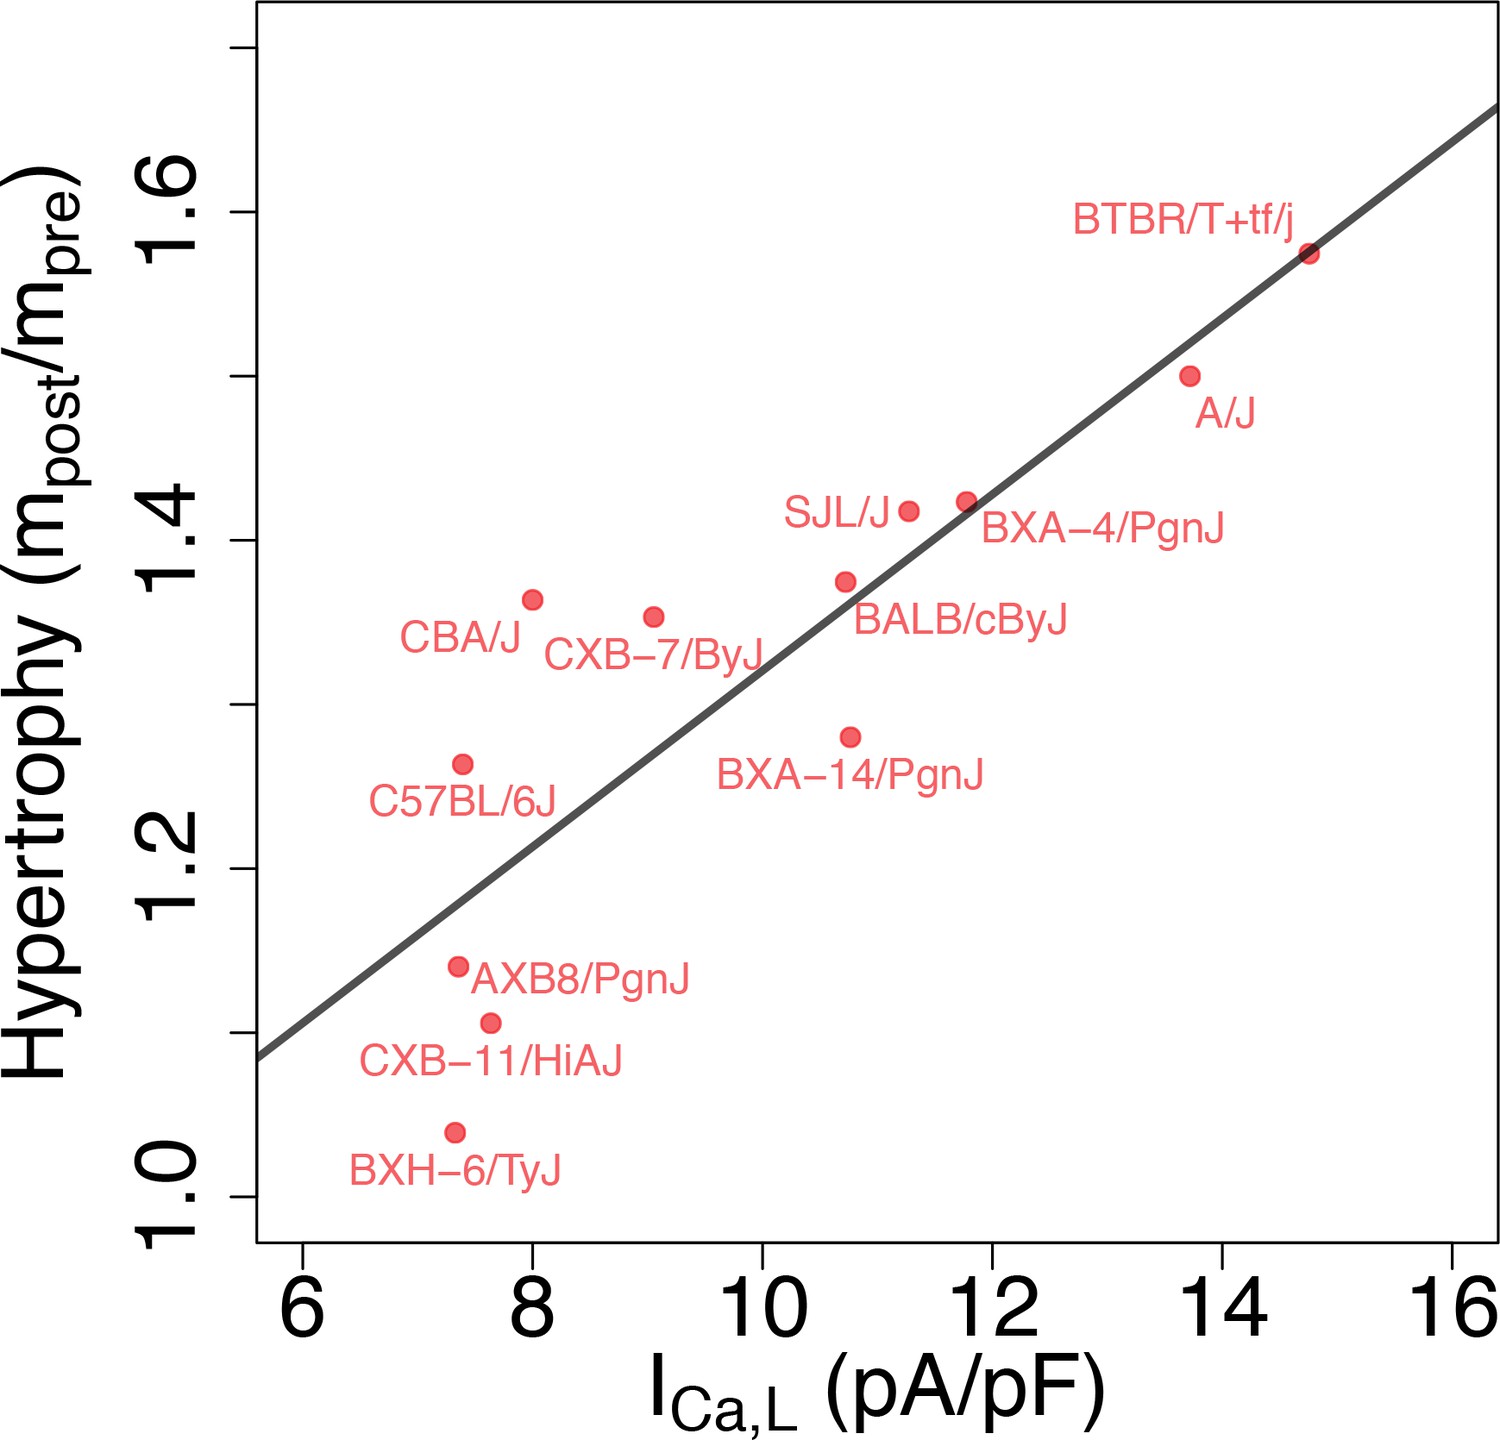
Correlation between L-type Ca2+ current conductance and cardiac hypertrophic response to a stressor for different HMDP strains.
The Pearson correlation is r = 0.86 (p=3e-4).
Figure 7

Compensation and gene expression.
Plot showing the existence of a statistically very significant correlation (Pearson correlation coefficient and p-value, ) between the expression level of Kcnip2, encoding the KChIP2 accessory subunits that interact with Kv4.2 channels () and of Cacna1c, a gene encoding the 1C subunit of the Cav1.2 L-type calcium channels () across 206 mice. Cardiac gene expression was measured in control (Pre-ISO) strains and 21 days after injection of isoproterenol (post-ISO) in 100 HMDP strains (a smaller number due to higher mortality of certain strains). Note that the significant correlation holds when considering separately pre-ISO (blue points, , ) and post-ISO (red points, , ) data. Lines show best fits of a linear model for pre-ISO (blue), post-ISO (red), and pre- and post-ISO combined (black). Expression data is taken from Santolini et al. (2018) and is averaged over all microarray probes for each gene.
Tables
Table 1
Patch clamp measurements of , , and functional current density.
Mean current density averaged over cells isolated from multiple hearts for each strain is given together with the standard error.
| Strain | (pA/pF) | n | (pA/pF) | n | (pA/pF) | n | (pA/pF) | n |
|---|---|---|---|---|---|---|---|---|
| A/J | 13.71947 1.23085 | 19 | 11.61804 2.79089 | 13 | 13.03735 1.64818 | 14 | 5.23445 0.48377 | 13 |
| BALB/cByJ | 10.72278 1.3951 | 9 | 11.496 2.03274 | 10 | 7.46938 0.82615 | 9 | 8.197 0.62438 | 10 |
| BTBR T+tf/J | 14.75667 1.14159 | 6 | 16.42364 2.78295 | 11 | 9.271 1.43985 | 10 | 6.093 0.39553 | 9 |
| BXA12/PgnJ | 11.01333 0.98995 | 9 | 15.66429 1.70548 | 8 | 11.89875 2.18027 | 8 | 8.34556 1.30065 | 9 |
| BXA25/PgnJ | 17.57 4.81376 | 5 | 15.8049 1.74509 | 7 | 11.62704 1.59613 | 7 | 7.11986 1.31554 | 6 |
| BXH6/TyJ | 7.32625 0.59327 | 16 | 5.954 0.43731 | 10 | 8.73172 0.67617 | 11 | 7.98545 0.87545 | 11 |
| C57BL/6J | 7.3925 0.93181 | 10 | 7.82727 1.45134 | 11 | 7.594 0.92097 | 10 | 9.16273 1.62148 | 11 |
| CXB1/ByJ | 11.93909 0.81022 | 11 | 11.69556 1.42095 | 9 | 8.73883 1.11087 | 10 | 6.089 0.5724 | 10 |
| CXB11/HiAJ | 7.63625 0.89344 | 8 | 8.90316 2.49755 | 6 | 8.42537 1.24635 | 7 | 6.8481 1.3638 | 7 |
| AXB8/PgnJ | 7.355 1.09612 | 6 | - | - | - | |||
| BXA14/PgnJ | 11.28091 1.00796 | 15 | - | - | - | |||
| BXA4/PgnJ | 11.77615 1.19476 | 13 | - | - | - | |||
| BXD34/TyJ | 11.12556 1.13741 | 9 | - | - | - | |||
| CBA/J | 7.956 0.81269 | 10 | - | - | - | |||
| CXB7/ByJ | 9.05386 0.6087 | 16 | - | - | - | |||
| SJL/J | 11.2745 0.99708 | 20 | - | - | - |
Table 3
Heart mass before and 3 weeks after Isoproterenol (ISO) injection.
https://doi.org/10.7554/eLife.36717.015| Strain | Heart mass pre-ISO, (g) | Heart mass post-ISO, (g) |
|---|---|---|
| A/J | 0.088666667 | 0.133 |
| AXB8/PgnJ | 0.087 | 0.0992 |
| BALB/cByJ | 0.10105 | 0.1389 |
| BTBR T+tf/J | 0.14162 | 0.223 |
| BXA-12/PgnJ | 0.064 | NA |
| BXA-14/PgnJ | 0.0975 | 0.1248 |
| BXA-4/PgnJ | 0.1031 | 0.14675 |
| BXD-34/TyJ | 0.1215 | NA |
| BXH-6/TyJ | 0.0845 | 0.0878 |
| C57BL/6J | 0.096716667 | 0.1222 |
| CBA/J | 0.095333333 | 0.13 |
| CXB-11/HiAJ | 0.1135 | 0.1255 |
| CXB-7/ByJ | 0.109 | 0.1475 |
| SJL/J | 0.087 | 0.123333333 |
Table 2
Cell Shortening at 4 Hz pacing.
https://doi.org/10.7554/eLife.36717.017| Strain | L/L (4 Hz) | n |
|---|---|---|
| BXA12/PgnJ | 0.0835 0.0184 | 5 |
| BXA14/PgnJ | 0.1182 0.0108 | 14 |
| BTBR T+tf/J | 0.0978 0.0095 | 7 |
| BALB/cByJ | 0.105 0.0158 | 5 |
| C57BL/6J | 0.0989 0.016 | 6 |
| BXA25/PgnJ | 0.0838 0.0112 | 5 |
Table 4
Reference values of ionic current parameters varied in the GES search.
https://doi.org/10.7554/eLife.36717.018| Parameter | Definition | Reference value | Reference source |
|---|---|---|---|
| Ca2+ current flux | 333.32 mmol/(Cm C) | Measured | |
| Peak uptake rate | 1.17 M/ms | Chosen* | |
| Peak NaCa rate | 36.6 M/s | Bondarenko et al., 2004 | |
| Release current strength | 12.9 sparks /mA | Mahajan et al. (2008) | |
| peak conductance | 0.16 A/F | Measured | |
| peak conductance | 0.144 A/F | Measured |
-
* was chosen such that the reference Ca2+ transient amplitude was normal.
Table 5
Mouse ventricular myocyte model parameters.
https://doi.org/10.7554/eLife.36717.019| Parameter | Definition | Value |
|---|---|---|
| Physical constants and ionic concentrations | ||
| Cell capacitance | 3.1 10F | |
| Cell volume | 2.58 10l | |
| Submembrane volume | 0.02 | |
| F | Faraday Constant | 96.485 C/mmol |
| R | Universal gas constant | 8.314 J |
| T | Temperature | 298 K |
| External Na+ concentration | 140 mM | |
| Internal K+ concentration | 143.5 mM | |
| External K+ concentration | 5.4 mM | |
| External Ca2+ concentration | 1.8 mM | |
| Cytosolic buffering parameters | ||
| Troponin C concentration | 70 mol/l cyt | |
| on rate for Troponin C binding | 0.0327 (M ms) | |
| off rate for Troponin C binding | 0.0196 (ms) | |
| SR binding site concentration | 47 mol/l cyt | |
| SR binding site disassociation constant | 0.6 M | |
| Calmodulin binding site concentration | 24 mol/l cyt | |
| Calmodulin binding site disassociation constant | 7 M | |
| Membrane binding site concentration | 15 mol/l cyt | |
| Membrane binding site disassociation constant | 0.3 M | |
| Sarcolemma binding site concentration | 42 mol/l cyt | |
| Sarcolemma binding site disassociation constant | 13 M | |
| SR release parameters | ||
| Spark lifetime | 10 ms | |
| NSR-JSR diffusion time | 20 ms | |
| u | Release slope | 4 |
| Release slope threshold | 90 M / l cytosol | |
| - diffusion time | 0.50 ms* | |
| - diffusion time | 0.75 ms | |
| Exchanger, uptake, and SR leak parameters | ||
| Uptake threshold | 0.5 M | |
| NaCa saturation threshold | 0.1 | |
| NaCa energy barrier position | 0.35 | |
| Ion mobility constant | 21 mM | |
| Ion mobility constant | 87.5 mM | |
| Ion mobility constant | 1380 M | |
| Leak current conductance | 1.74 10 | |
| Ionic current parameters | ||
| Na+ current conductance | 13 mS/F | |
| Na+ background current conductance | 0.0026 mS/F | |
| Ca2+ background current conductance | 0.000367 mS/ F | |
| Strength of local LCC calcium flux | 9000 mM/(cm C) | |
| conductance | 0.2938 mS/F | |
| conductance | 1.716 mS/F | |
| conductance | 0.025 mS/F | |
| conductance | 0 mS/F | |
| Maximal flux | one pA/pF | |
| Saturation constant for Ca2+ current | 0.5 M | |
| Constant | 0.00054 cm/s | |
| Constant | 0.083 | |
-
*We have reduced this value from the original value of Mahajan et al. (2008) so that the Ca2+ transient increases when SERCA uptake rate is increased.
Table 6
Simulation outputs corresponding to physiological sensors
https://doi.org/10.7554/eLife.36717.020| Abbreviation | Description | Reference value |
|---|---|---|
| Average cytostolic Ca2+ over one beat | 0.24 M | |
| Ca2+ transient amplitude | 0.5 M | |
| Diastolic Na+ | 14 mM |
Additional files
-
Transparent reporting form
- https://doi.org/10.7554/eLife.36717.021
Download links
A two-part list of links to download the article, or parts of the article, in various formats.
Downloads (link to download the article as PDF)
Open citations (links to open the citations from this article in various online reference manager services)
Cite this article (links to download the citations from this article in formats compatible with various reference manager tools)
The Ca2+ transient as a feedback sensor controlling cardiomyocyte ionic conductances in mouse populations
eLife 7:e36717.
https://doi.org/10.7554/eLife.36717


