Stage-dependent remodeling of projections to motor cortex in ALS mouse model revealed by a new variant retrograde-AAV9
- University of Ulm, Germany
- University Hospital Heidelberg, Germany
- University of Kiel, Germany
Figures
Figure 1
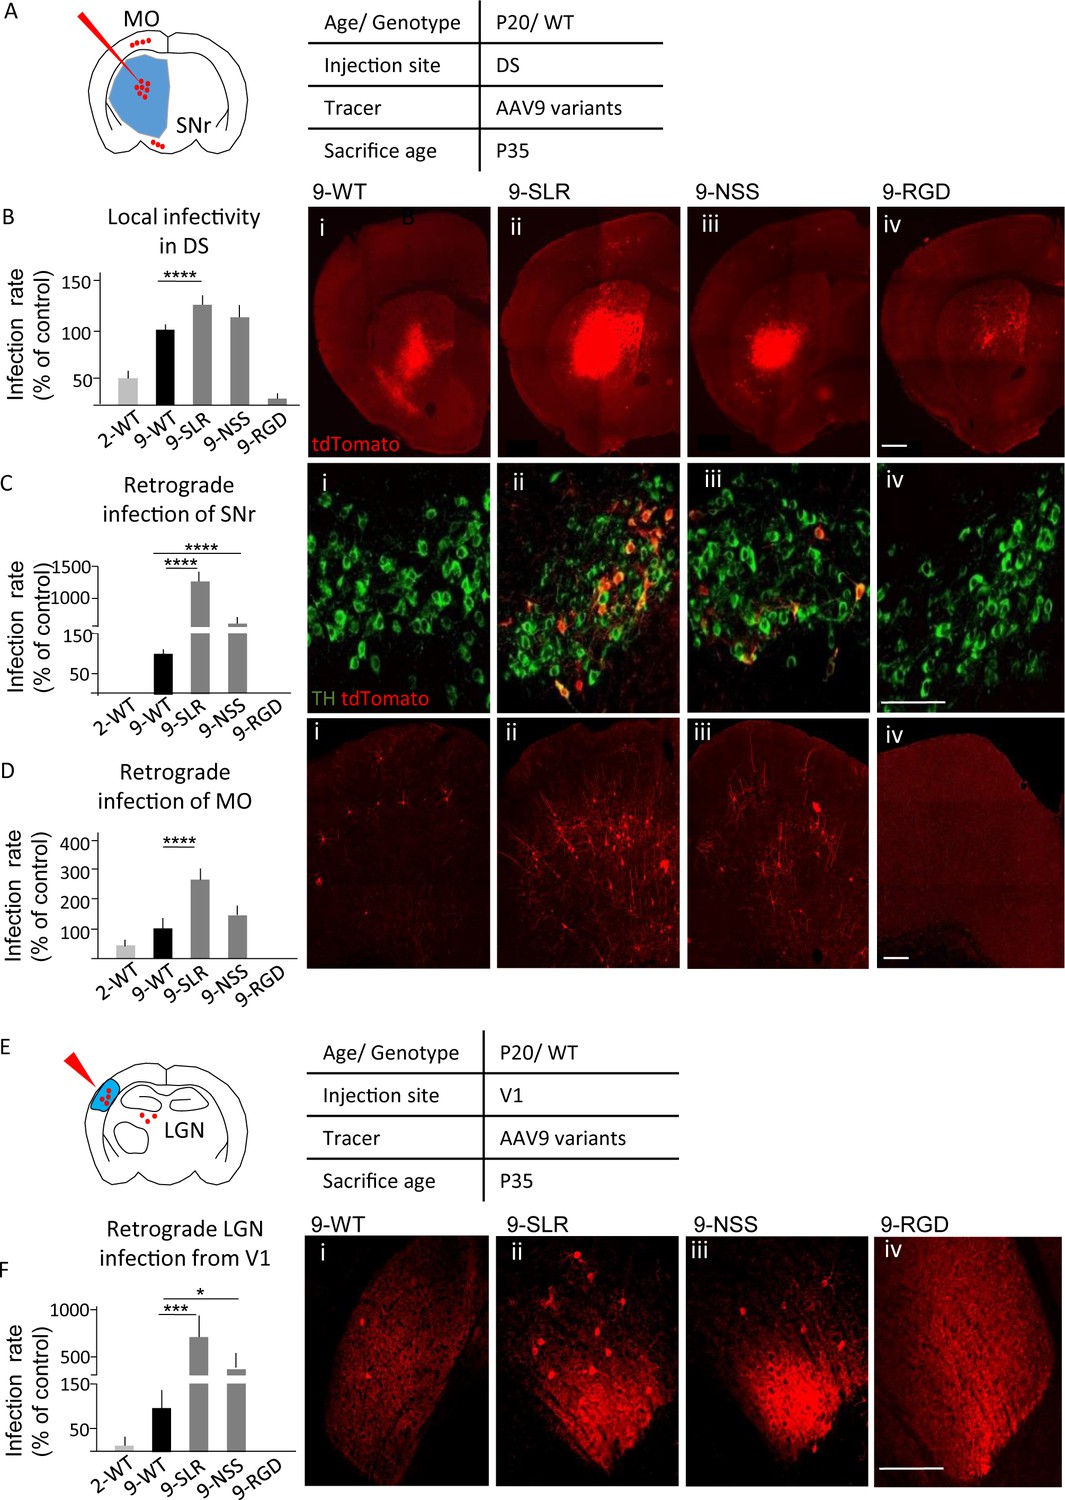
AAV9-SLR is a new AAV variant with pronounced retrograde infectivity.
AAV9-SLR, AAV9-NSS and AAV9-RGD variants (or WT-AAV9 and WT-AAV2) were injected in dorsal striatum (N = 3) and local infection rate (B), retrograde infection to Substantia Nigra (C) and Motor Cortex (D) were assessed. (A) Experimental design showing injection site in dorsal striatum (DS) and brain regions that have been investigated for retrograde infection (SNr and MO). (B) AAV9-SLR displayed a significantly higher local infection rate than WT-AAV9 (143 ± 10%; post-hoc p=0.0001), whereas rAAV-NSS was comparable to WT-AAV9 (114 ± 8%, p=0.0910) and AAV-RGD was significantly less effective (8 ± 1%, p=0.0001). Detailed statistic provided in Supplementary file 1a. (B i-iv) representative images of injection site in DS. Scale bar 500 μm. (C): after DS injection, rAAV9-SLR produced a ten-fold increase in retrogradely infected TH +neurons compared to WT-AAV9 (1267 ± 152%, p=0.0001); rAAV9-NSS was more effective than WT-AAV9 (600 ± 100%, p=0.0001) but less effective than AAV9-SLR. WT-AAV2 and AAV-RGD did not retrogradely infect TH+ neurons. Detailed statistic provided in Supplementary file 1b. (C i-iv) representative images of SNr. Scale bar 30 μm. (D) after DS injection, rAAV9-SLR displayed the highest rate of retrograde infection in motor cortex (236 ± 32% of WT-AAV9, p=0.0001), followed by rAAV9-NSS (145 ± 25% p=0.0909), both more effective than WT-AAV9. Detailed statistic provided in Supplementary file 1c. (D i-iv) representative images of motor cortex. Scale bar 100 μm. (E) Experimental design showing injection site in primary visual cortex (V1) and brain regions that have been investigated for retrograde infection (LGN). After injection in primary visual cortex injection (V1, N = 3), retrograde infection of neurons in lateral geniculate nucleus (LGN) was assessed. (F) rAAV9-SLR displayed a strong retrograde infection of LGN neurons (700 ± 240%, p=0.0005), followed by AAV9-NSS (400 ± 133% of WT-AAV9, p=0.0446). No LGN infection resulted from the injection of WT-AAV2 or AAV9-RGD. Detailed statistic provided in Supplementary file 1d. (F i-iv) Representative images of LGN. Scale bar 30 μm. Manual cell counting was normalized on the volume of the injection sites, values are expressed in terms of percentage over AAV9-WT. Ordinary one-way ANOVA with Dunnett multiple comparison test was used.
-
Figure 1—source data 1
Detailed statistic concerning AAV variants infectivity (Figure 1).
- https://doi.org/10.7554/eLife.36892.003
Figure 2 with 2 supplements
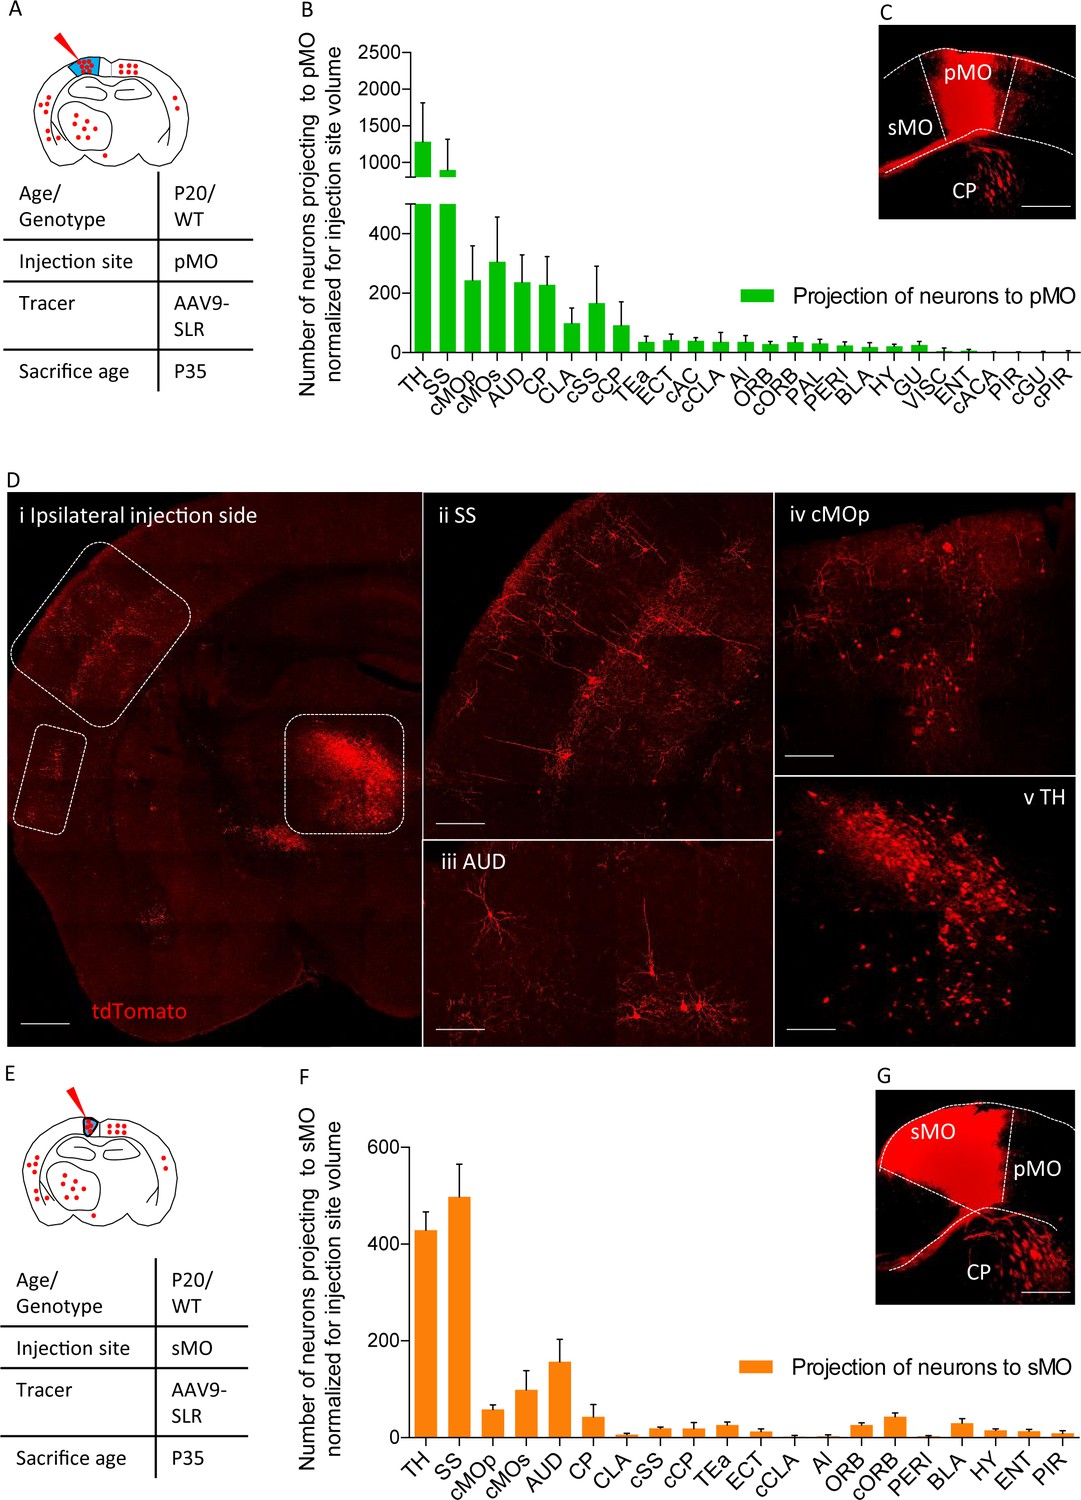
Projections to primary and secondary motor cortex in P20 wild-type.
(A) Experimental design depicting injection site in pMO and relative projecting neurons. (B) List of the regions projecting to primary MO (pMO) identified by injection of AAV9-SLR in pMO of WT mice (representative injection site in panel (C) scale bar 300 µm). Total neuronal count has been normalized for the volume of the injection site (raw neuronal counts in Supplementary file 1e; detailed statistic on normalized counts provided in Supplementary file 1f;). The largest contribution to the input to pMO was provided by thalamus (TH), followed by somatosensory (SS), contralateral secondary motor cortex (cMOs) and contralateral primary motor cortex (cMOp). Additional inputs came from: auditory cortex (AUD), caudoputamen (CP), contralateral SS (cSS), CLA, baso-lateral amygdala (BLA) and hypothalamus (HY). List of the regions projecting to primary motor cortex in terms of total neuronal count and in term of percentage over the total pool of positive neurons in Figure 2—figure supplement 1A–B, detailed statistic provided in Supplementary file 1e and 1g. (D) Representative images of retrogradely-labelled neurons projecting to pMO. (i) Ipsilateral brain section displaying main regions targeting primary motor cortex. Scale bar 500 μm. (ii) Detail of SS, scale bar 200 μm. (iii) Detail of AUD, scale bar 200 μm. (iv) Detail of cMOp, scale bar 200 μm. (v) Detail of TH, scale bar 200 μm. (E) Experimental design depicting injection site in sMO and relative projecting neurons. (F): List of the regions projecting to secondary MO (sMO) identified by injection of AAV9-SLR in sMO of WT mice (representative injection site in panel (G) scale bar 300 µm). Total neuronal count has been normalized for the volume of the injection site (detailed statistic provided in Supplementary file 1e-1g). Input toward pMO and sMO is qualitatively similar (display of total neuronal count in Figure 2—figure supplement 1C, detailed statistic provided in Supplementary file 1e-1g). List of the regions projecting to secondary motor cortex in terms of percentage over the total pool of positive neurons in Figure 2—figure supplement 1D, detailed statistic provided in Supplementary file 1f. Projections from thalamus, to both pMO and sMO, have been further broken down for each thalamic nucleus (Figure 2—figure supplement 2A–D, detailed statistic provided in Supplementary file 1h-1i-1j). Abbreviations: Thalamus (TH), homolateral somatosensory cortex (SS), contralateral secondary motor cortex (cMOs), contralateral primary motor cortex (cMOp), auditory cortex (AUD), caudoputamen (CP), contralateral somatosensory cortex (cSS), claustrum (CLA), contralateral caudoputamen (cCP), temporary association area (TEa), ectorinal cortex (ECT), contralateral anterior cingulate (cAC), contralateral claustrum (cCLA), agranular insular area (AI), orbital cortex (ORB), contralateral orbital cortex (cORB), paraventricular hypothalamic area (PAL), perirhinal area (PERI), basolateral amygdala (BLA), hypothalamus (HY), gustatory area (GU), visceral area (VISC), entorhinal area (ENT), contralateral anterior part of anterior commissure (cACA), endopiriform nucleus (EP), piriform area (PIR), contralateral gustatory area (cGU), contralateral piriform area (cPIR).
-
Figure 2—source data 1
Detailed statistic concerning projecting neurons to primary motor cortex (pMO) and secondary motor cortex (sMO) in WT animals(P20) traced via AAV9-SLR injection.
Numbers are expressed in term of total neuronal count.
- https://doi.org/10.7554/eLife.36892.009
Figure 2—figure supplement 1
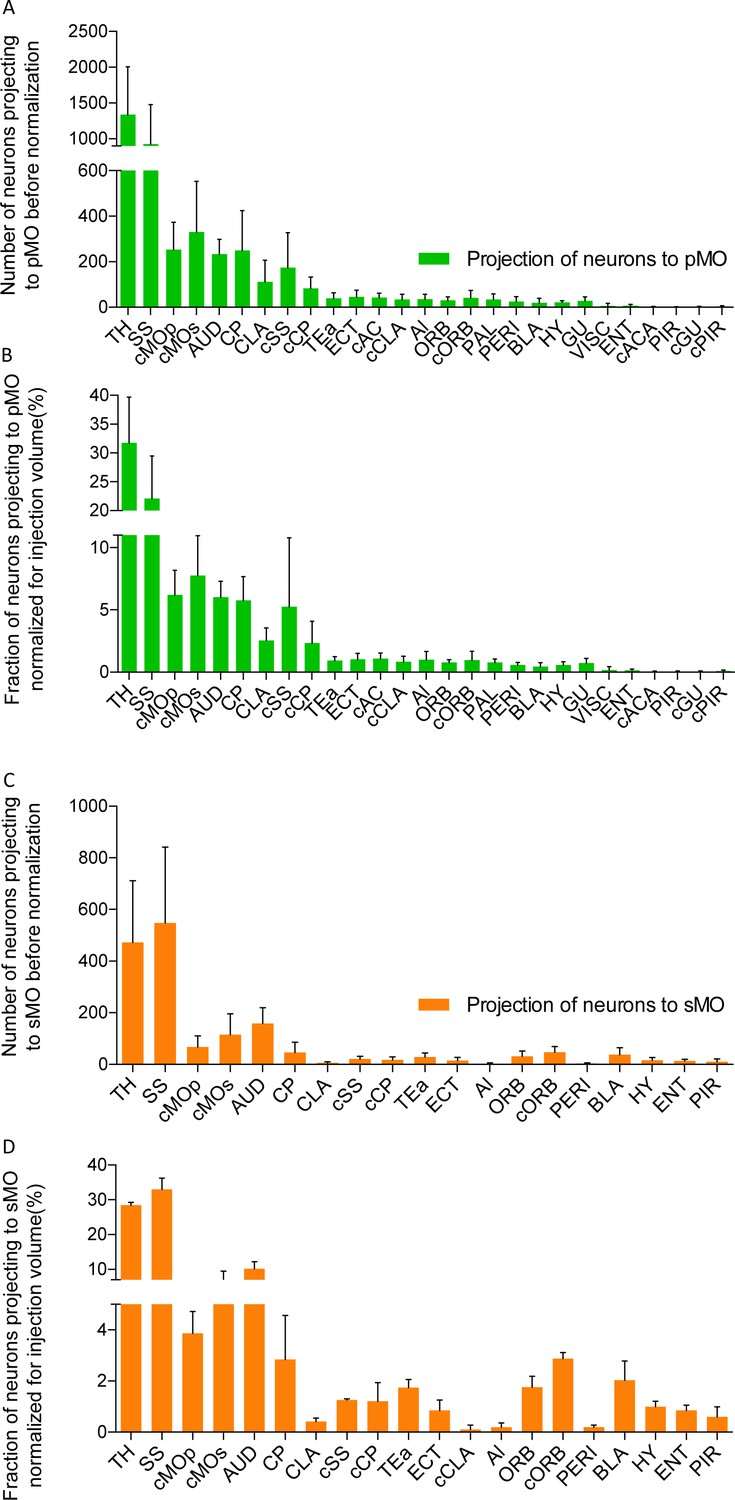
Projections to primary and secondary motor cortex in P20 wild-type.
(A) Bar chart listing the number of neurons for each region projecting to primary motor cortex (pMO) identified by injection of AAV9-SLR in pMO of WT mice. Values are expressed in term of total neuronal count (before normalization for injection volume). (B) Bar chart listing the number of neurons (after normalization for injection volume) for each region projecting to primary motor cortex (pMO) identified by injection of AAV9-SLR in sMO of WT mice. Total neuronal count was normalized for the volume of the injection site and values are expressed in terms of percentage over the total pool of positive neurons. (C) Bar chart listing the number of neurons for each region projecting to secondary motor cortex (sMO) identified by injection of AAV9-SLR in pMO of WT mice. Values are expressed in term of total neuronal count (before normalization for injection volume). (D) Bar chart listing the number of neurons (after normalization for injection volume) for each region projecting to secondary motor cortex (sMO) identified by injection of AAV9-SLR in sMO of WT mice. Total neuronal count was normalized for the volume of the injection site and values are expressed in terms of percentage over the total pool of positive neurons. Abbreviations: Thalamus (TH), homolateral somatosensory cortex (SS), contralateral secondary motor cortex (cMOs), contralateral primary motor cortex (cMOp), auditory cortex (AUD), caudoputamen (CP), contralateral somatosensory cortex (cSS), claustrum (CLA), contralateral caudoputamen (cCP), temporary association area (TEa), ectorinal cortex (ECT), contralateral anterior cingulate (cAC), contralateral claustrum (cCLA), agranular insular area (AI), orbital cortex (ORB), contralateral orbital cortex (cORB), paraventricular hypothalamic area (PAL), perirhinal area (PERI), basolateral amygdala (BLA), hypothalamus (HY), gustatory area (GU), visceral area (VISC), entorhinal area (ENT), contralateral anterior part of anterior commissure (cACA), endopiriform nucleus (EP), piriform area (PIR), contralateral gustatory area (cGU), contralateral piriform area (cPIR).
-
Figure 2—figure supplement 1—source data 1
Detailed statistic concerning projecting neurons to primary motor cortex (pMO) and secondary motor cortex (sMO) in WT animals (P20) traced via AAV9-SLR injection.
Total count was normalized for the volume of the injection site and contribution from each brain region is reported in term of percentage.
- https://doi.org/10.7554/eLife.36892.006
Figure 2—figure supplement 2
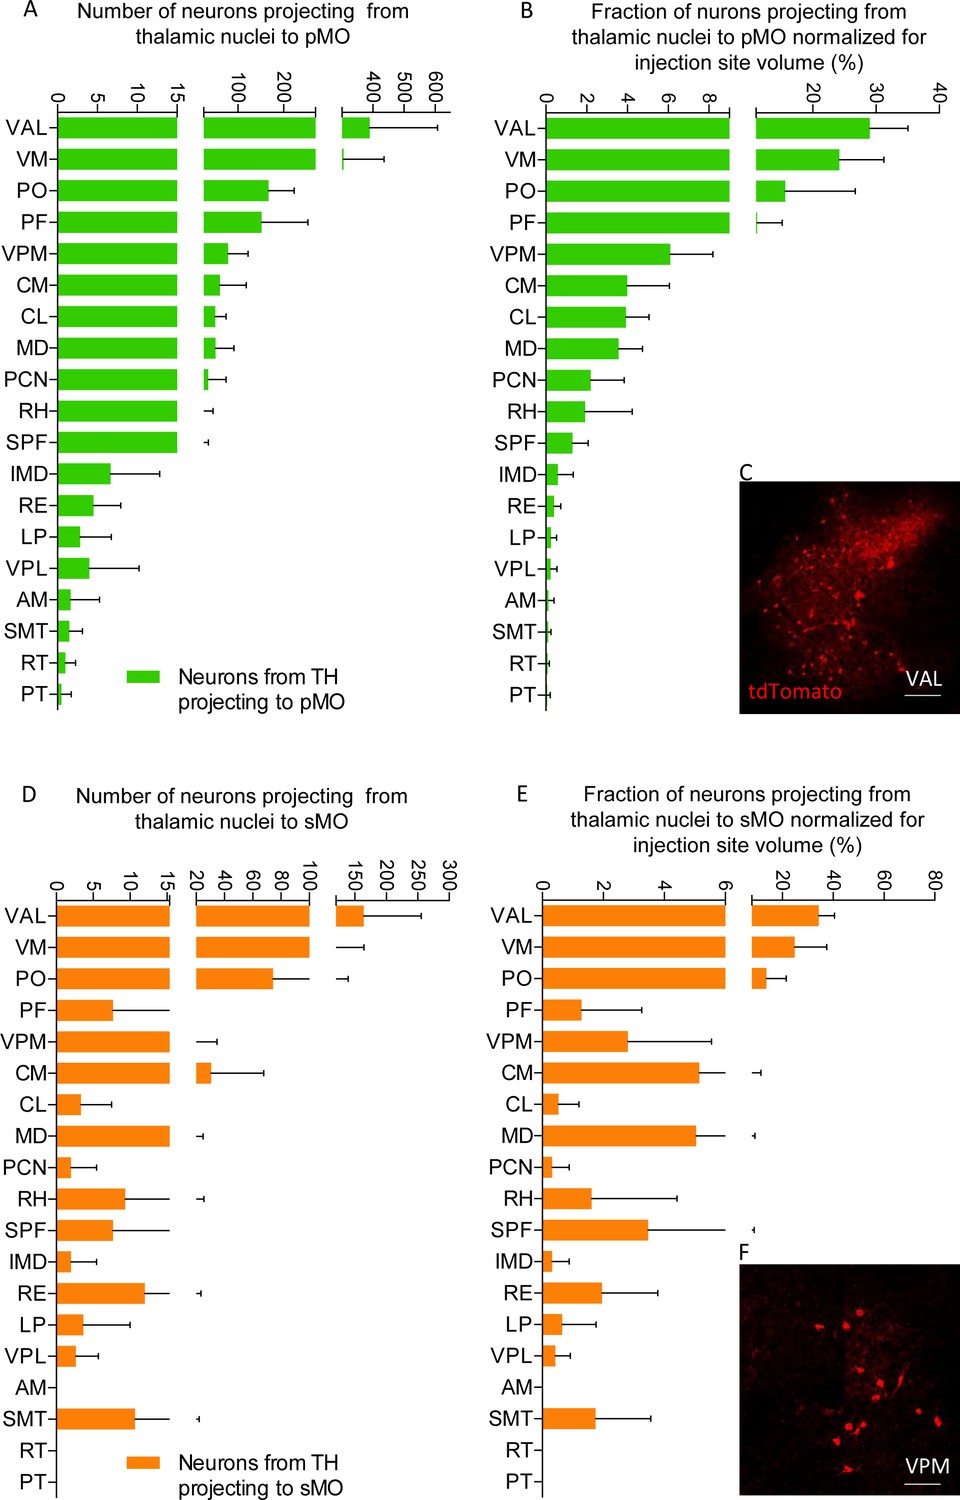
Projection from thalamic nuclei to primary and secondary motor cortex in WT at P20.
(A) Distribution of neurons projecting to primary motor cortex from individual thalamic nuclei with values expressed in terms of total numbers. Detailed statistic provided in Supplementary file 1h. (B) Distribution of neurons projecting to primary motor cortex (pMO) from individual thalamic nuclei with values expressed in terms of percentage over the total pool of positive neurons after normalization for injection volume. Detailed statistic provided in Supplementary file 1i-1j. (C) Projecting neurons to pMO from Ventral anterior- lateral nucleus (VAL). Scale bar 200 µm. (D) Distribution of neurons projecting to secondary motor cortex from individual thalamic nuclei with values expressed in terms of total numbers. Detailed statistic in Supplementary file 1h. (E) Distribution of neurons projecting to secondary motor cortex (sMO) from individual thalamic nuclei with values expressed in terms of percentage over the total pool of positive neurons after normalization for injection volume. Detailed statistic in Supplementary file 1i-1j. (F) Projecting neurons to sMO from Ventral medial nucleus (VM). Scale bar 100 µm. Ventral nuclei (VAL and VM) provide the largest input to both structures, followed by posterior complex (PO). In total, 19 thalamic nuclei projected to motor cortex. Abbreviations: parafascicular nucleus (PF), ventral posteromedial nucleus (VPM), central medial nucleus (CM), central lateral nucleus (CL), mediodorsal nucleus (MD), paracentral nucleus (PCN), rhomboid nucleus (RH), subparafascicular nucleus (SPF), intermediodorsal nucleus (IMD), reuniens nucleus (RE), lateral posterior nucleus (LP), ventral posterolateral nucleus (VPL), anteromedial nucleus (AM), submedial nucleus (SMT), reticular nucleus (RT), parataenial nucleus.
-
Figure 2—figure supplement 2—source data 1
Detailed statistic concerning input from thalamic nuclei to primary motor cortex (pMO) and secondary motor cortex (sMO) in WT animals(P20) traced via AAV9-SLR injection.
Numbers are reported in term of total neuronal count, normalized neuronal count for the volume of the injection site and contribution from each nucleus reported in term of percentage.
- https://doi.org/10.7554/eLife.36892.008
Figure 3 with 1 supplement
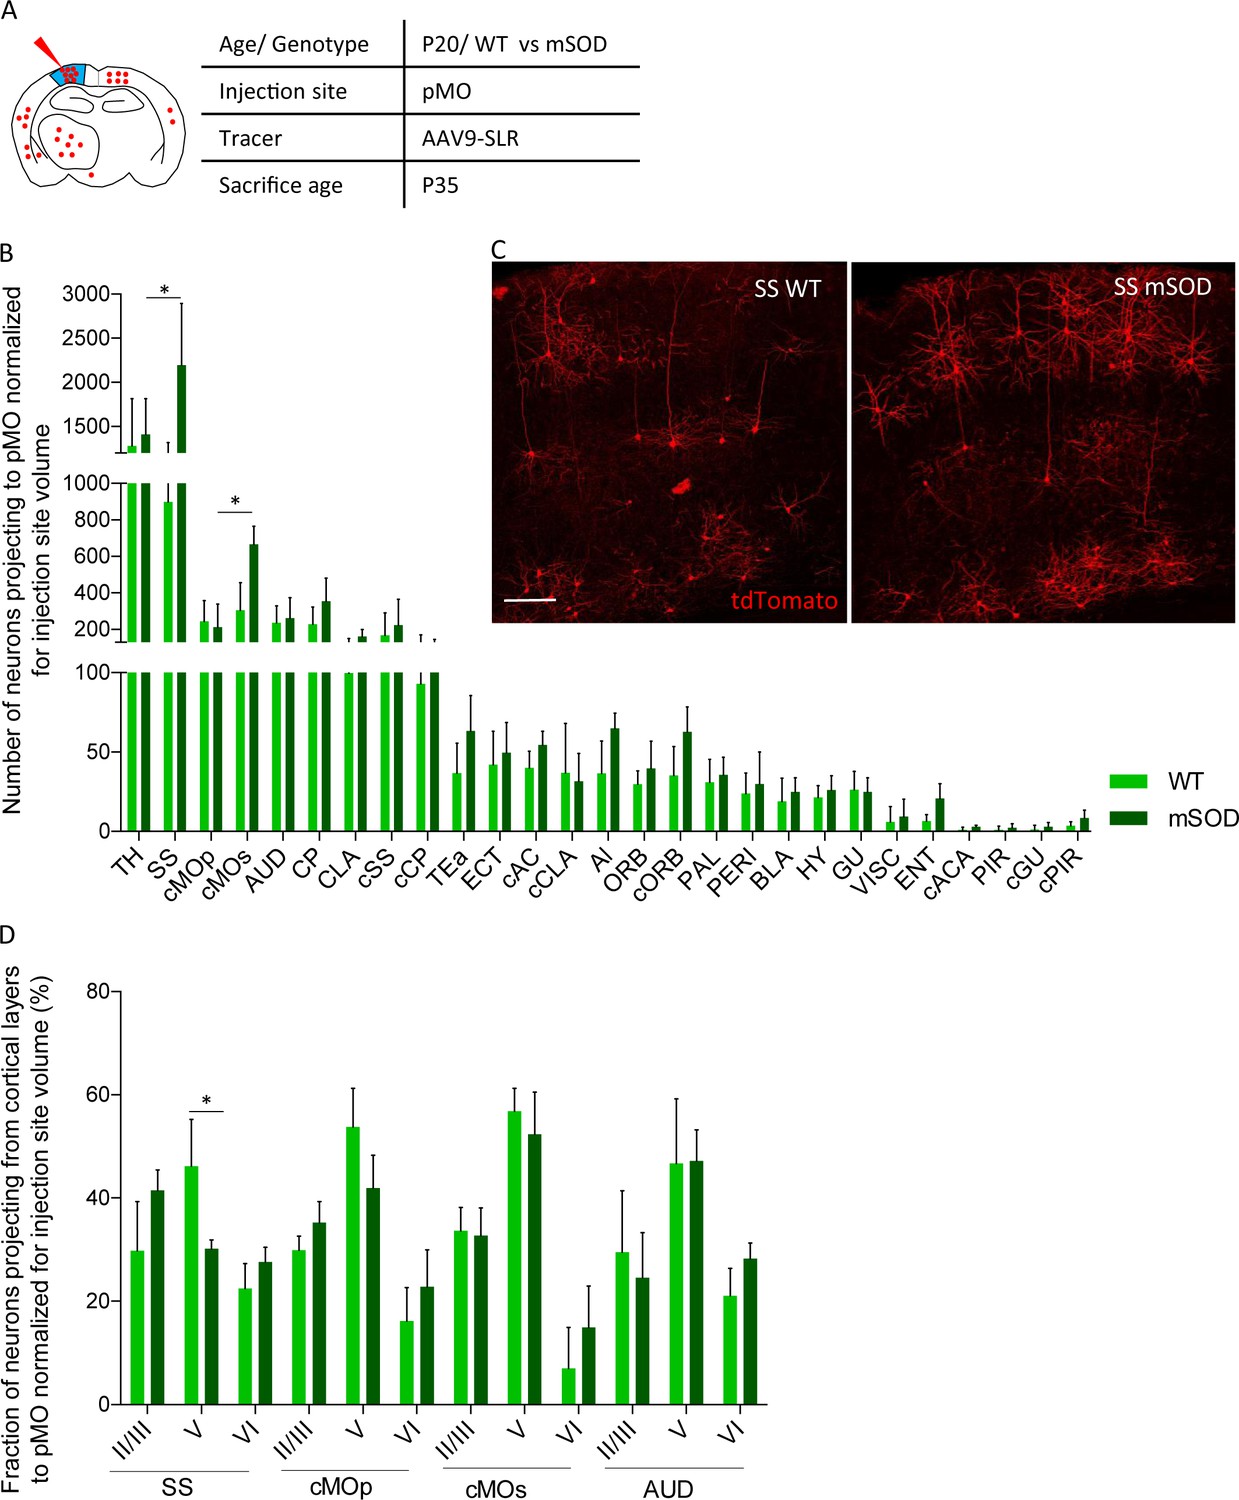
Increased projections to primary motor cortex in mSOD at pre-symptomatic stage (P20) from ipsilateral SS and contralateral sMO.
(A) Experimental design depicting injection site in pMO and relative projecting neurons. (B) Number of neurons, normalized for injection site volume, projecting to primary motor cortex in WT (N = 6) and mSOD (N = 3). Significant increase in the number of neurons projecting to pMO from SS (WT vs mSOD, p<0.0001) and from cMOs (WT vs mSOD, p=0.0189). No other statistical significant differences between WT and mSOD among the 28 identified structures. Detailed statistic provided in Supplementary file 2b. Input to pMO expressed in terms of total neuronal count in Figure 3—figure supplement 1A, detailed statistic provided in Supplementary file 2a. (C) Representative images of neurons labeled by retrograde tracing from SS, in WT and mSOD, respectively. Scale bar 150 µm. (D) Cortical layer allocation of neurons projecting to primary motor cortex from SS, cMOp, cMOs and AUD out of AAV9-SLR injection. Despite the overall increase in projection from SS to pMO in mSOD mice, a significant loss of projections from layer V of SS was detected (WT 46 ± 9% vs mSOD 30 ± 2%, p=0.0324). Detailed statistic provided in Supplementary file 2c. Values are expressed in term of percentage over the total number of neurons for each structure. Bar chart displaying cortical projections in terms of total neuron in Figure 3—figure supplement 1B, detailed statistic is provided in Supplementary file 2c and 2d. Two-way ANOVA with Sidak correction for multiple comparison.
-
Figure 3—source data 1
Detailed statistic concerning projecting neurons to primary motor cortex (pMO) in WT vs mSOD animals(P20) traced via AAV9-SLR injection.
Total count was normalized for the volume of the injection site. Discrimination for each cortical layer is reported in term of percentage.
- https://doi.org/10.7554/eLife.36892.013
Figure 3—figure supplement 1

Increased projections to primary motor cortex in mSOD at pre-symptomatic stage (P20) from ipsilateral SS and contralateral sMO.
(A) Number of neurons projecting to primary motor cortex in WT (N = 6) and mSOD (N = 3). Significant increase in the number of neurons projecting to pMO from SS. No other structure, among the 28 identified, displayed a statistically significant change between WT and mSOD. Detailed statistic in Supplementary file 2a. (B) Cortical layer allocation of neurons projecting to primary motor cortex from SS, cMOp, cMOs and AUD out of AAV9-SLR injection. A significant increase of projections from layer II/III and layer VI of SS was detected. Values are expressed in term of total number. Statistic in Supplementary file 2c. Two-way ANOVA with Sidak correction for multiple comparison.
-
Figure 3—figure supplement 1—source data 1
Detailed statistic concerning projecting neurons to primary motor cortex (pMO) in WT vs mSOD animals (P20) traced via AAV9-SLR injection.
Discrimination for each cortical layer is reported. Numbers are expressed in term of total neuronal count.
- https://doi.org/10.7554/eLife.36892.012
Figure 4 with 1 supplement
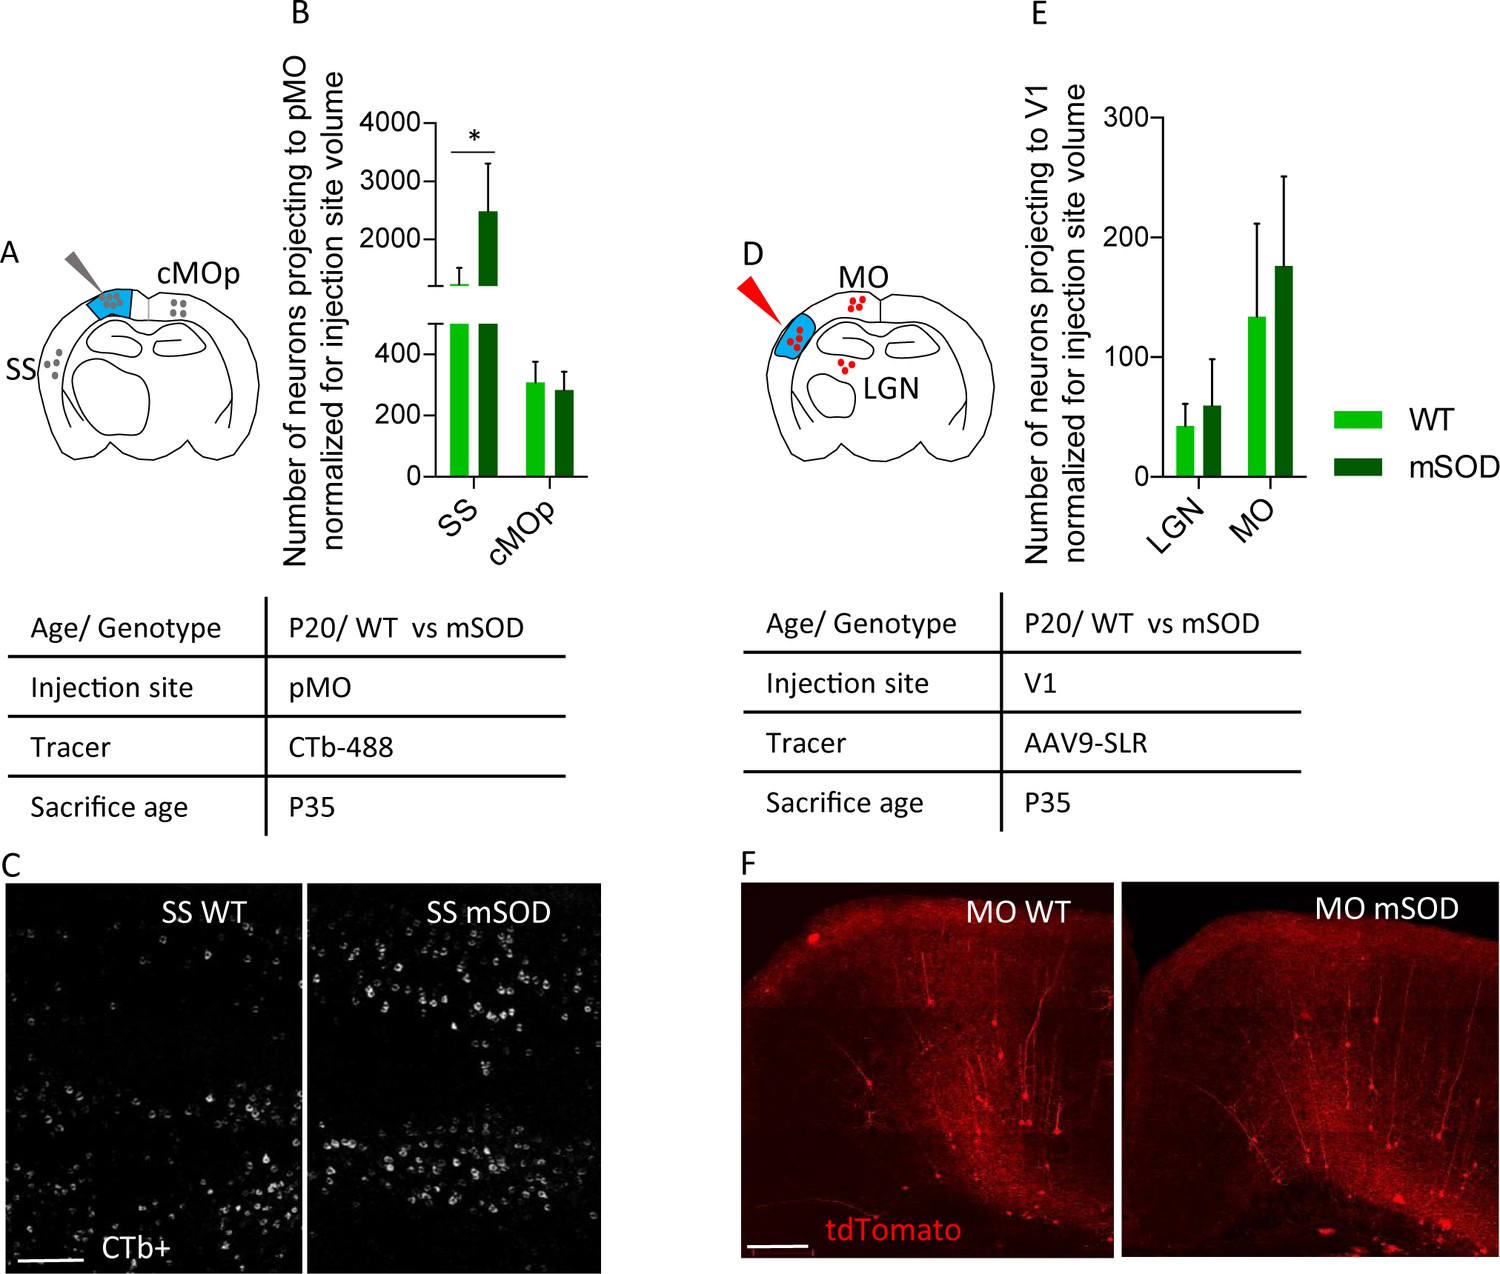
Increased projections to primary motor cortex in mSOD at pre-symptomatic stage (P20) is specific for motor network and is confirmed via the retrograde tracer choleratoxin.
(A) Experimental design depicting injection site in pMO via choleratoxin (CTb) with two regions that have been investigated for retrograde infection (SS and cMOp). (B) Normalized (for injection site volume) number of neurons projecting to primary motor cortex, WT (N = 3) vs mSOD (N = 3), via Choleratoxin-b injection. CTb + retrogradely labeled projections from SS and cMOp to pMO. Increased projections from SS to pMO was again detected in mSOD (WT 1235 ± 280; mSOD 2487 ± 819, p=0.0156); projections from cMOp were comparable (WT 308 ± 67, mSOD 283 ± 59, p=0.9971), as in the virus tracing experiment. Detailed statistic provided in Supplementary file 2g. Display of total neuronal count in Figure 4—figure supplement 1A, detailed statistic for total neuronal count in Supplementary file 2f. (C) Representative images of SS from WT and mSOD, respectively, displaying CTb + neurons, scale bar 200 μm. (D) Experimental design depicting injection site in in primary visual cortex (V1) via AAV9-SLR with two regions that have been investigated for retrograde infection (LGN and MO). (E) Normalized (for injection site volume) number of neurons projecting to visual network (V1) from LGN (WT 42 ± 18 vs mSOD 60 ± 38; p=0.9263) and MO (WT 134 ± 77 vs SOD 176 ± 74, p=0.6360) in WT (N = 3) and mSOD (N = 3). No difference in projections from the two areas to V1 was found between WT vs mSOD. Detailed statistic provided in Supplementary file 2i. Display of total neuronal count in Figure 4—figure supplement 1B, detailed statistic in Supplementary file 2h. (F) Representative images of MO projection neurons to V1 in WT vs mSOD; scale bar 150 μm. Ordinary one-way ANOVA with Dunnett multiple comparison test.
-
Figure 4—source data 1
Total number of neurons projecting to primary motor cortex, WT vs mSOD via Choleratoxin-b injection.
CTb + retrogradely labeled projections from SS and cMOp to pMO. Total number of neurons projecting to visual network (V1) from LGN and MO in WT and mSOD. Numbers expressed as total neuronal count and as normalized neuronal count for the volume of the injection site.
- https://doi.org/10.7554/eLife.36892.016
Figure 4—figure supplement 1
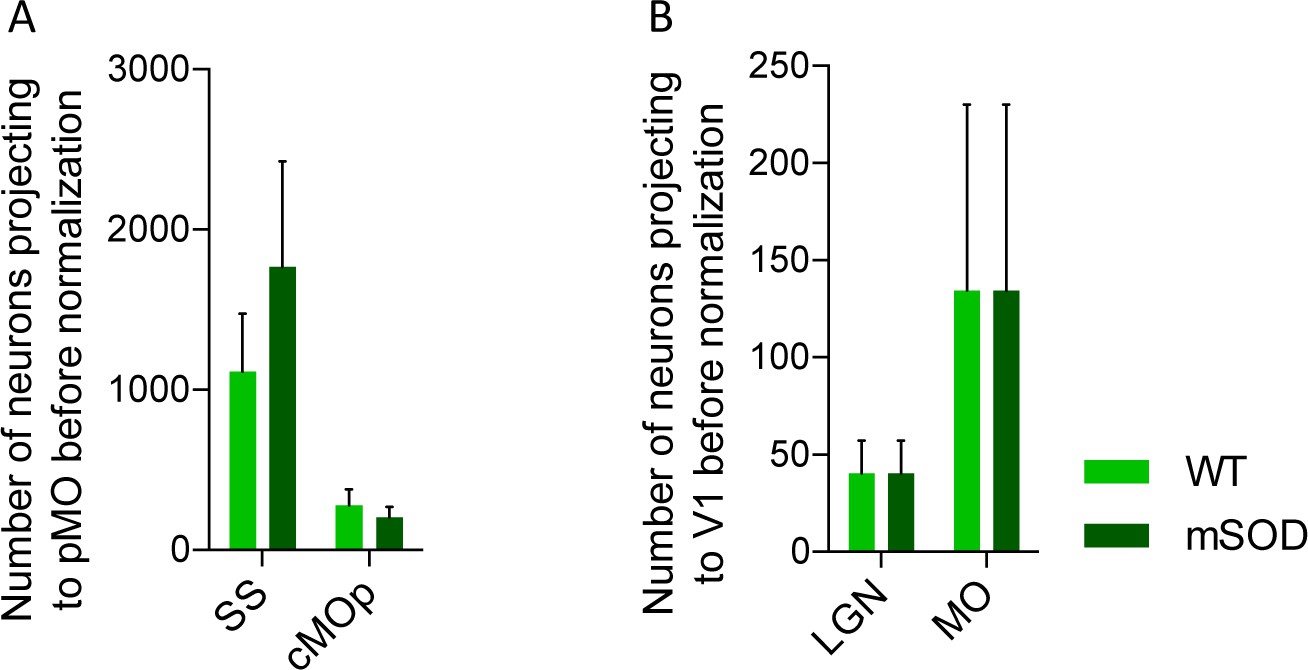
Increased projections to primary motor cortex in mSOD at pre-symptomatic stage (P20) is specific for motor network and is confirmed via the retrograde tracer choleratoxin.
(A) Total number of neurons projecting to primary motor cortex, WT (N = 3) vs mSOD (N = 3), via Choleratoxin-b injection. CTb + retrogradely labelled projections from SS and cMOp to pMO. Increased projections from SS to pMO was again detected in mSOD even though not statistically significant (ordinary one-way ANOVA with Dunnett multiple comparison test). Statistic Supplementary file 2h. (B) Total number of neurons projecting to visual network (V1) from LGN and MO in WT (N = 3) and mSOD (N = 3). No difference in projections from the two areas to V1 was found between WT vs mSOD (ordinary one-way ANOVA with Dunnett multiple comparison test). Statistic in Supplementary file 2h.
Figure 5
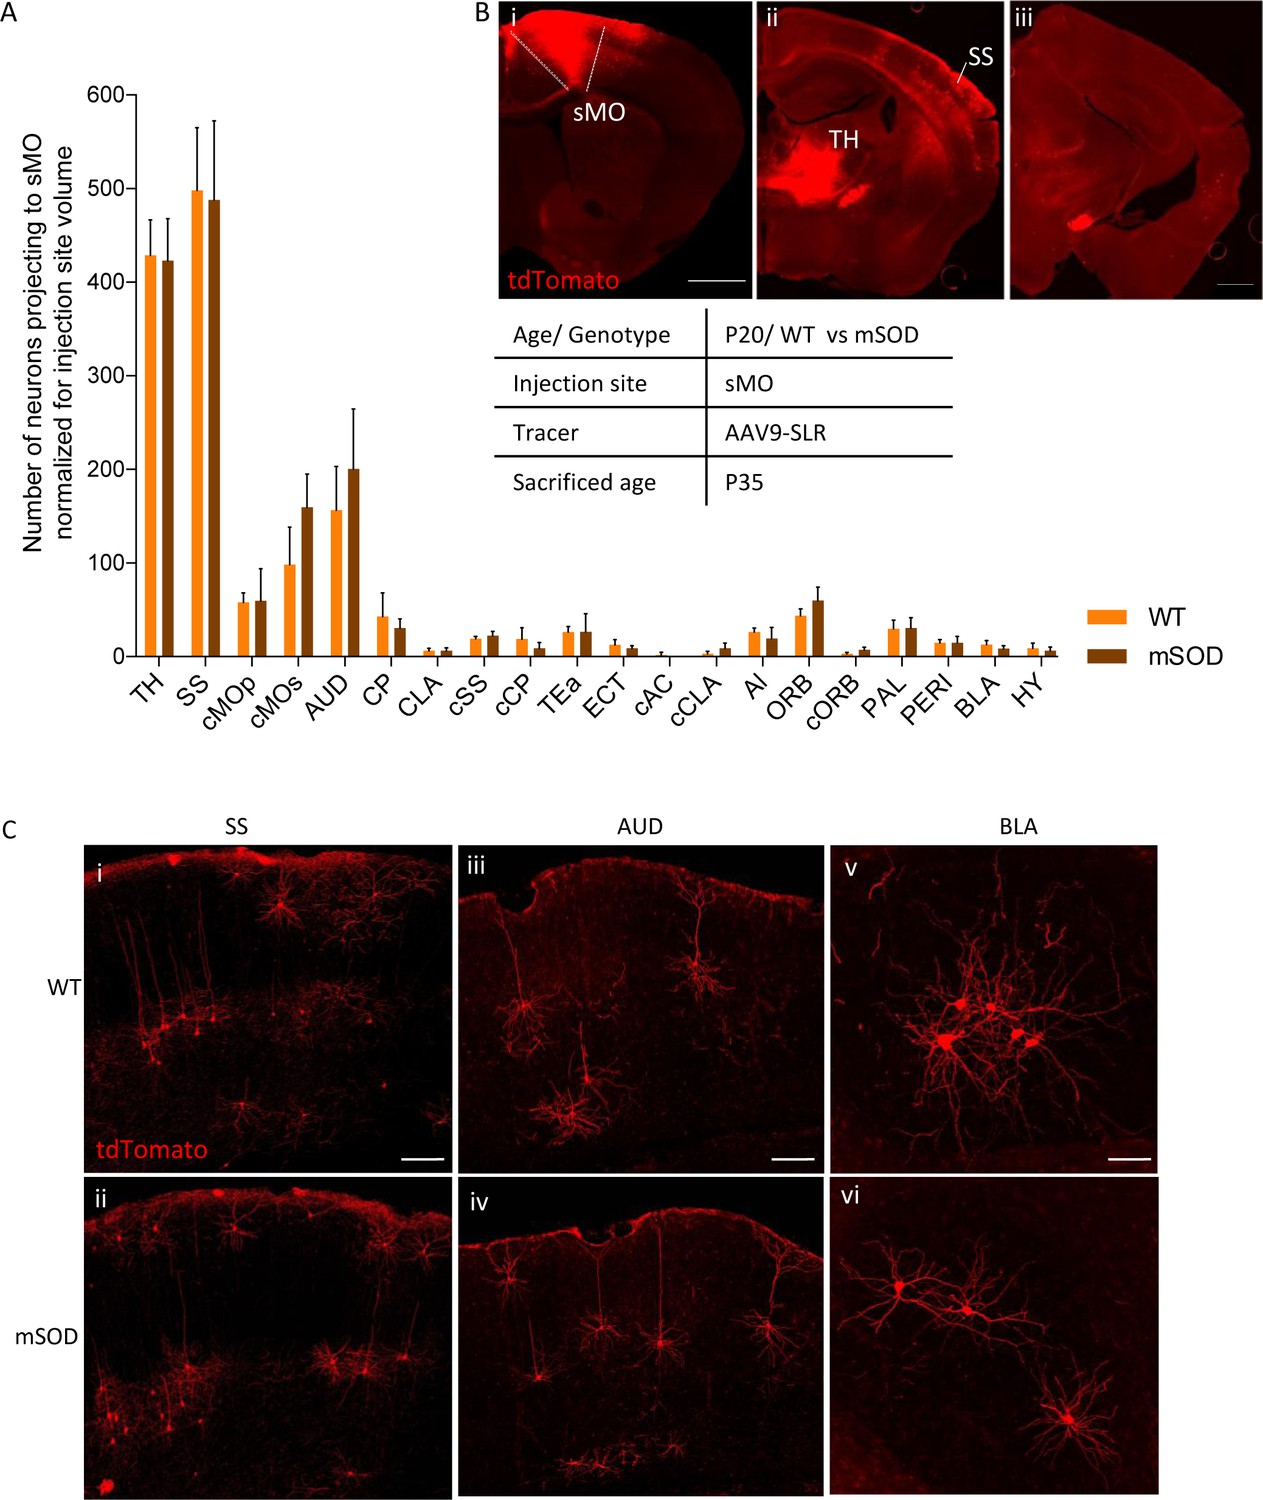
No change in projections to secondary motor cortex, at pre-symptomatic stage (P20).
(A) Number of neurons, normalized for injection site volume, projecting to secondary motor cortex (sMO) in WT (N = 3) and mSOD (N = 3). No statistically significant differences in input to sMO were identified between mSOD and WT mice, although a trend toward increased projection in mSOD was found in contralateral sMO and AUD (two-way ANOVA with Sidak correction for multiple comparison). Detailed statistic in Supplementary file 2k. Total neuronal count has been reported in Supplementary file 2j. (B i-ii-iii) Representative brain sections displaying main regions targeting secondary motor cortex, scale bar 500 μm. (C) Representative images of neurons labeled by retrograde tracing from SS (i–ii), cAUD (iii-iv) and BLA (v–vi). Scale bar 150 μm. Analysis for total neuronal count is provided in Supplementary file 2h.
-
Figure 5—source data 1
Detailed statistic concerning projecting neurons to secondary motor cortex (sMO) in WT vs mSOD animals (P20) traced via AAV9-SLR injection.
Total neuronal count count is reported, together with its normalization for the volume of the injection site.
- https://doi.org/10.7554/eLife.36892.018
Figure 6 with 1 supplement

Progressive changes in projections to pMO in disease progression.
(A) Projection neurons were mapped at P20, P60 and P90 timepoints; fold change of normalized total number of projecting neurons of mSOD vs WT was plotted for the three stages of disease progression. Values were expressed in terms of fold change over the corresponding WT for each time point. At P60 (WT N = 3, mSOD N = 4), increased connectivity persisted from SS (2.3 ± 0.5 in mSOD vs WT littermates, p=0.0108) and cMOs (2.0 ± 0.3 in mSOD vs WT littermates, p=0.0381), but, in addition, cMOp showed an increased projection to pMO (2.2 ± 0.8, p=0.0323 in mSOD vs WT littermates). At P90 (WT N = 5, mSOD N = 5), further significant increase in projection to pMO was found in: TH (2.4 ± 0.6 in mSOD vs WT littermates, p=0.0002), SS (2.2 ± 0.4 in mSOD vs WT littermates), cMOp (3.4 ± 1.0 in mSOD vs WT littermates, p<0.0001), cMOs (2.8 ± 1.3 in mSOD vs WT littermates, p<0.0001), AUD (4.0 ± 1.6 in mSOD vs WT littermates, p<0.0001) and CP (2.9 ± 0.7 in mSOD vs WT littermates, p<0.0001). (B) Representative images, for P90 stage, of neurons labeled by retrograde tracing from TH (i–ii), cMOp (iii-iv) and HY (v–vi). Scale bar 150 μm. Two-way ANOVA with Sidak correction for multiple comparison. Detailed statistic provided in Supplementary file 3a. Analysis of number of neurons in pMO for later stage (P90) mSOD animals provided in Figure 6—figure supplement 1A–B.
-
Figure 6—source data 1
Detailed statistic concerning projecting neurons to primary motor cortex (pMO) in WT vs mSOD animals, traced via AAV9-SLR injection, during disease progression.
Three time points have been investigated: P20, P60 and P90. Total neuronal count is reported together with its normalization for the volume of the injection site. Moreover fold change for each time-point normalized over respective WT is provided.
- https://doi.org/10.7554/eLife.36892.022
Figure 6—figure supplement 1
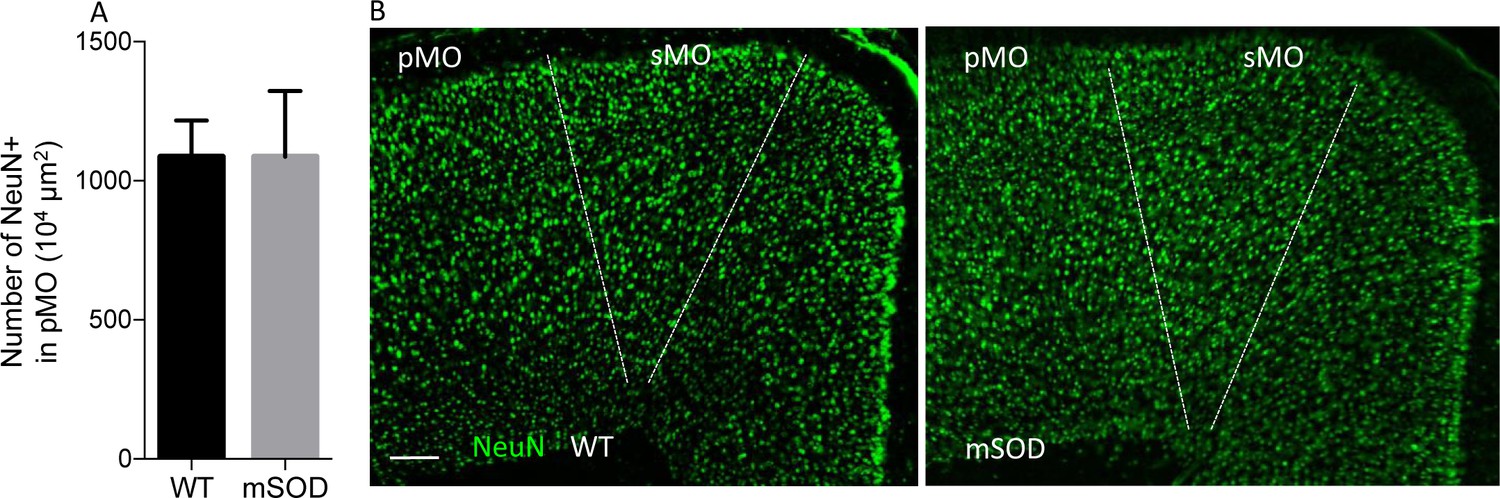
No neuronal loss in pMO of mSOD animal (P90).
(A) Bar chart comparing NeuN+ neurons in primary motor cortex of adult mSOD animals (P90). No difference has been detected (WT: 1087 ± 128 vs mSOD 1087 ± 236), proving that changes in number of neurons projecting to primary motor cortex is not due to a loss of neurons in the injection area during disease progression. (B) Representative images of NeuN+ neurons in motor cortex (pMO and sMO) from WT and mSOD. Scale bar 200 µm.
-
Figure 6—figure supplement 1—source data 1
Detailed statistic concerning the number of NeuN +neurons in the motor cortex of adult mSOD animals (P90).
- https://doi.org/10.7554/eLife.36892.021
Figure 7
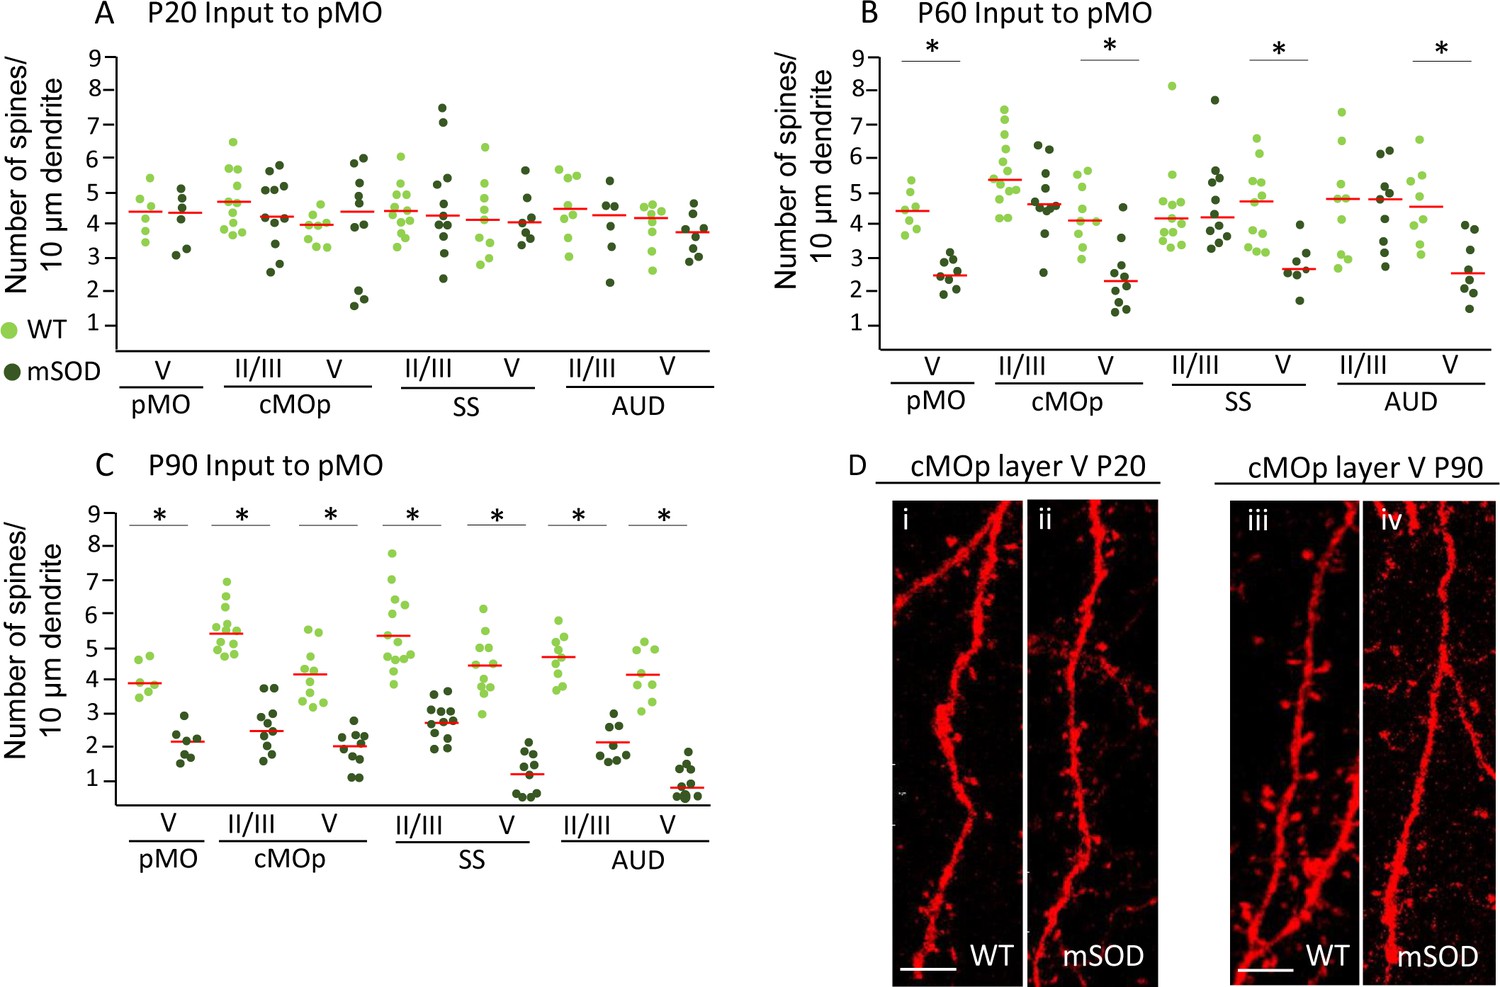
Pyramidal neurons projecting to pMO display simultaneous spines loss on basal dendrites during disease progression independently of misfolded SOD accumulation.
(A) Spine density on pyramidal neurons projecting to primary at P20; each dot representing average spine density for one single neuron. Spine density was comparable in pyramidal neurons projecting to pMO in WT and mSOD mice. Detailed statistic provided in Supplementary file 3b. (B) Neurons projecting to primary motor cortex started to display spine loss at P60. Pyramidal neurons in layer V belonging to cMOp (4 ± 1 spines/10 μm in WT vs 2 ± 1 spines/10 μm in mSOD; p=0.0030), SS (4 ± 1 spines/10 μm in WT vs 3 ± 1 spines/10 μm in mSOD; p=0.0047) and AUD (5 ± 1 spines/10 μm in WT vs 3 ± 1 spines/10 μm in mSOD; p=0.0034) of mSOD mice displayed a significant decrease in spine density compared to their WT counterpart animals. Projecting neurons in layer II/III displayed a spine density comparable to WT. Detailed statistic provided in Supplementary file 3c. (C) Significant decrease in spine density affected the whole cortex when the latest stage was reached, at age of P90: cMOp layer II/III (WT 6 ± 1 spines/10 μm in WT vs 2 ± 1 spines/10 μm in mSOD, p=0.0001), layer V (4 ± 1 spines/10 μm in WT vs 2 ± 0.5 spines/10 μm in mSOD, p<0.0001); SS layer II/III (6 ± 1 spines/10 μm in WT vs 3 ± 1 spines/10 μm in mSOD, p<0.0001), layer V (4 ± 0.6 spines/10 μm in WT vs 1 ± 0.6 spines/10 μm in mSOD, p<0.0001); AUD layer II/III (5 ± 1 spines/10 μm in WT vs 2 ± 0.6 spines/10 μm in mSOD, p<0.0001), layer V (4 ± 1 spines/10 μm in WT vs 1 ± 0.5 spines/10 μm in mSOD, p<0.0001). Detailed statistic in Supplementary file 3d. (D i-ii) comparison of basal dendrite stretched between WT and mSOD at P20 in contralateral pMO layer V, scale bar 5 μm. D iii-iv: comparison of basal dendrite stretched between WT and mSOD at P90 in contralateral pMO layer V. Scale bar 5 μm. One-way ANOVA with Sidak correction.
-
Figure 7—source data 1
Detailed statistic concerning spine density on pyramidal neurons projecting to primary motor cortex during disease progression (P20, P60, P90).
- https://doi.org/10.7554/eLife.36892.024
Figure 8
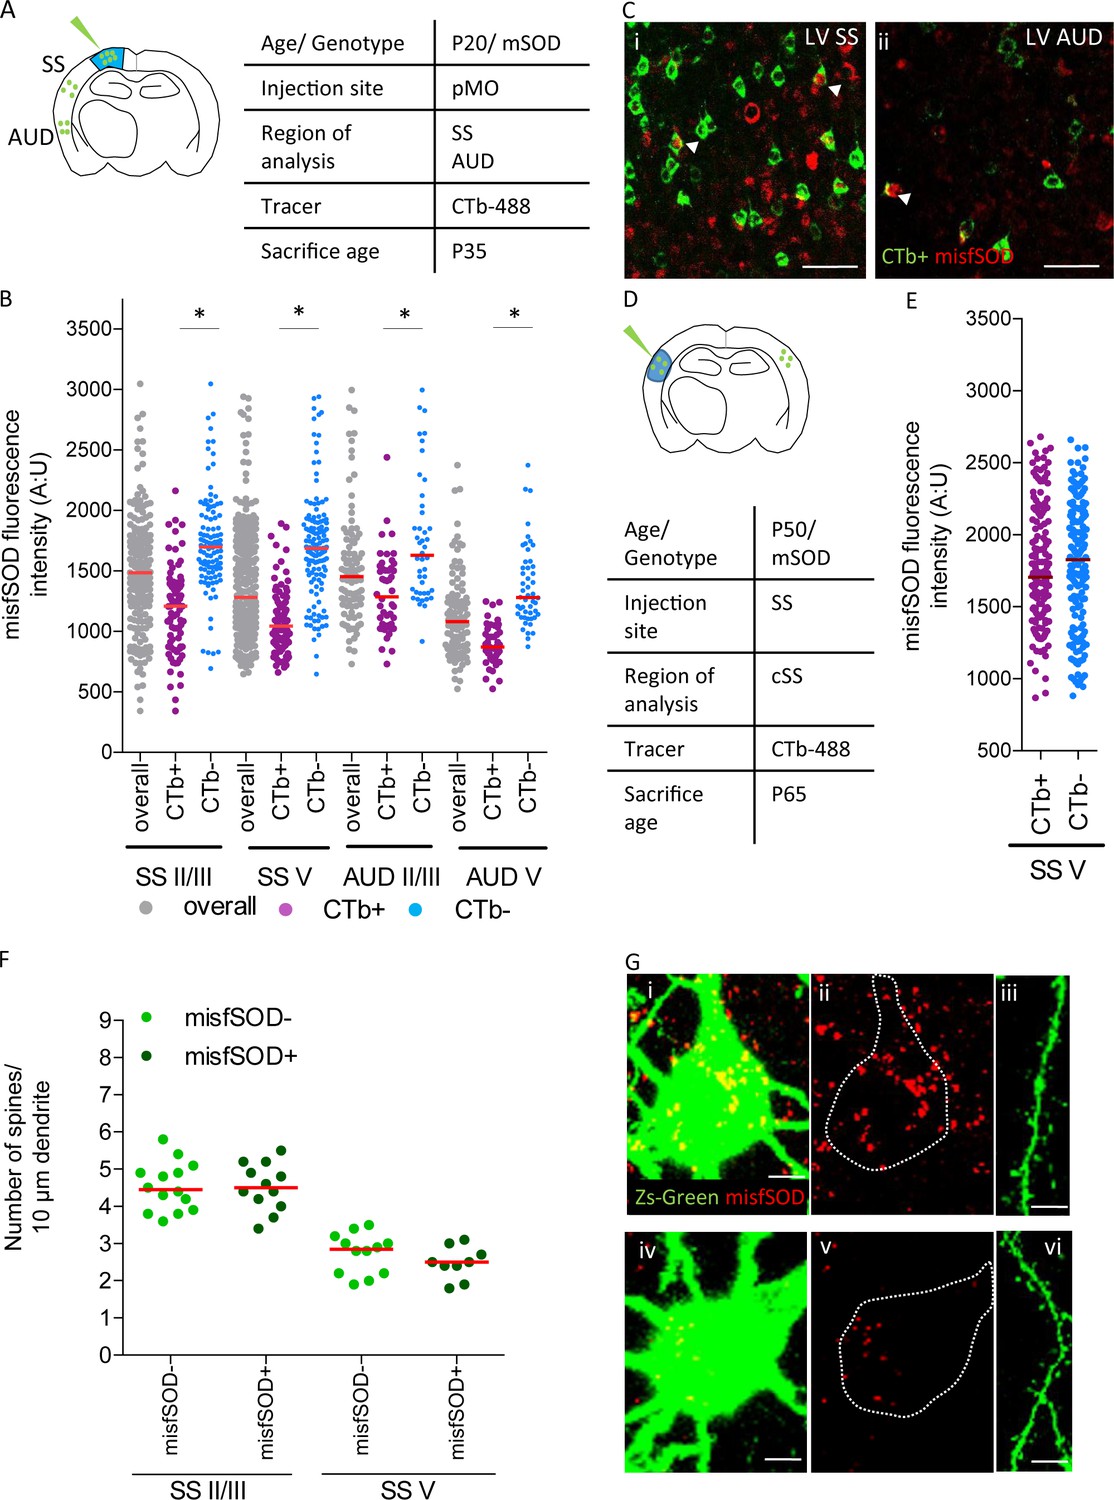
misfSOD expression does not trigger network remodeling nor loss of spines in basal dendrites of connected pyramidal neurons.
(A) Experimental design depicting injection site in pMO via choleratoxin (CTb) with two regions that have been investigated for misfSOD immunostaining intensity (SS and AUD). (B) Comparison of misfSOD expression between neurons CTb + and CTb- in layer II/III and layer V of SS and AUD in mSOD. In both areas, a subset of neurons in layer II/III and layer V displayed misfSOD accumulation at P20. Compared to the overall population of neurons in layer II/III and V (CTb-), the populations of neurons projecting to pMO (CTb+) displayed a lower burden of misfSOD: SS layer II/III CTb + 1179 ± 350, CTb- 1730±418, p<0.0001; SS layer V CTb + 1073 ± 238, CTb- 1706±445, p<0.0001; AUD II/III CTb + 1318 ± 325, CTb- 1755±518, p<0.0001; AUD layer V CTb + 888 ± 164, CTb- 1372 ± 329, p<0.0001. One-way ANOVA with Sidak correction, detailed statistic reported in Supplementary file 3e. (C i-ii) Magnification of SS and AUD layer V respectively, red stains misfSOD antibody, green stains for CTb+, scale bar 50 μm. (D) Experimental design depicting injection site in SS via CTb with contralateral SS investigated for misfSOD immunostaining intensity. (E) comparison of misfSOD expression between neurons CTb + and CTb- in layer V of contralateral SS in mSOD. Injection of CTb was performed in SS. The populations of neurons projecting to SS display the same burden of misfSOD: CTb + 1770 ± 400, CTb- 1782±442, (t Test p=0.2696). Detailed statistic is reported in Supplementary file 3f. (F) Spine density analysis on two differential neuronal populations, misfSOD- and misfSOD+, projecting from SS to primary motor cortex at P60; each dot representing average spine density for one single neuron. No difference has been detected (one-way ANOVA with Sidak correction, SS layer II/III p>0.9999, SS layer V p>0.9999), detailed statistic reported in Supplementary file 3g. (G) Representative images of misfSOD – and misfSOD+ neuron in SS layer V. i-ii-iii: misfSOD+ neuron displaying ZsGreen (green) and misfSOD (red, scale bar 20 µm) together with a stretch of its basal dendrite (scale bar 5 µm). iv-v-vi: misfSOD- neuron displaying ZsGreen (green) and misfSOD (red, scale bar 20 µm) together with a stretch of its basal dendrite (scale bar 5 µm).
-
Figure 8—source data 1
Detailed statistic concerning comparison of misfSOD expression between neurons CTb + and CTb- in layer II/III and layer V of SS and AUD in mSOD.
Comparison of misfSOD expression between neurons CTb + and CTb- in layer V of contralateral SS in mSOD. Spine density analysis on two differential neuronal populations, misfSOD- and misfSOD+, projecting from SS to primary motor cortex at P60.
- https://doi.org/10.7554/eLife.36892.026
Figure 9
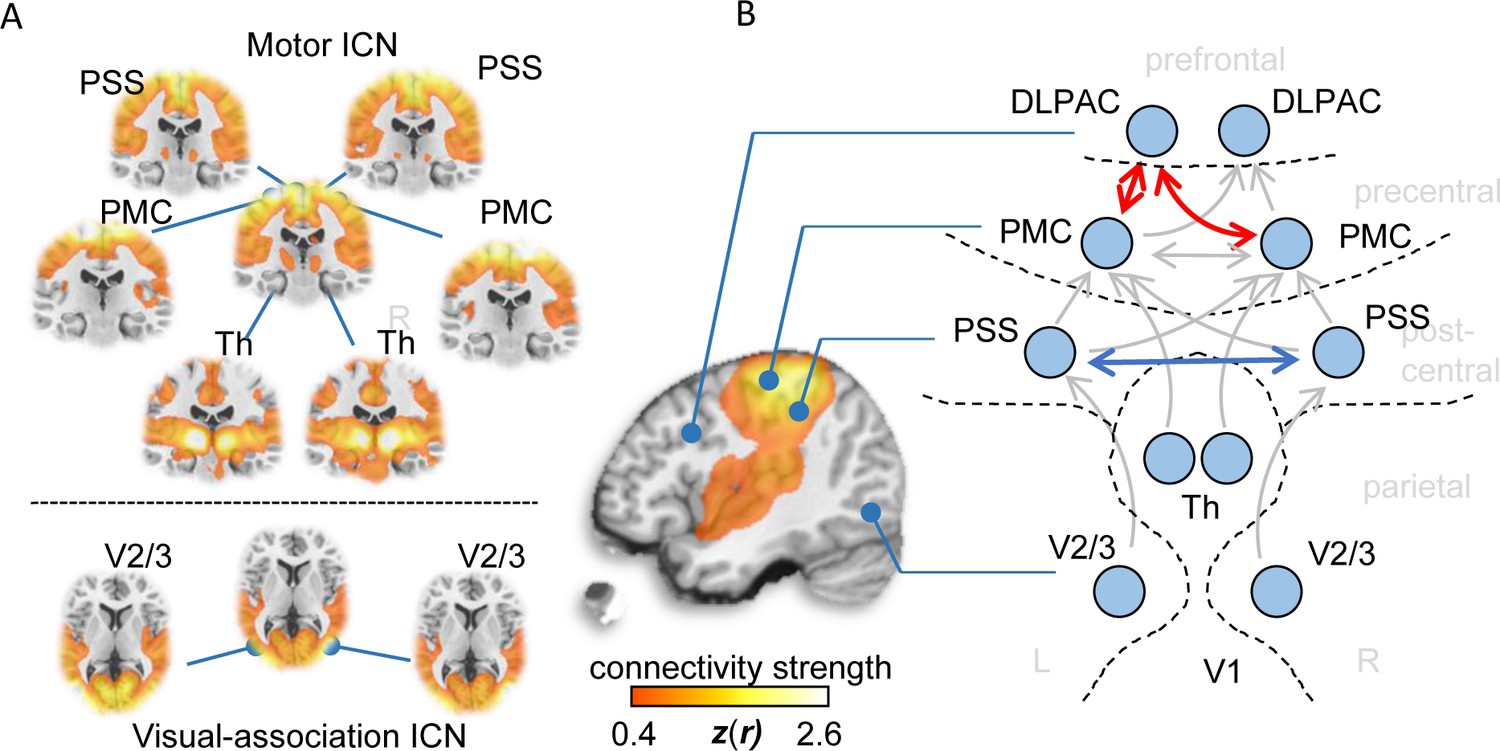
Functional connectivity alterations in human ALS.
(A) BOLD synchronization illustrated as coronal (upper panel) and axial connectivity (lower) heat maps showing voxel-wise Fisher’s r-to-z transformed correlation coefficients (thresholded for |z(r)|≥0.4) for which the fMRI BOLD signal was correlated with the respective seed-voxel forming the motor system (upper panel) and the visual association system (lower panel) in healthy elderly human subjects (N = 28). (B) Pairwise region-to-region functional connectivity strength analysis between schematically illustrated regions (blue circles) corresponding to seed voxels (as shown in A) revealed significantly altered functional motor system connectivity (red arrows) in ALS patients (N = 71) compared to matched healthy controls (N = 28). PMC = Primary motor cortex, PSS = Primary somatosensory cortex, DLPAC = Dorsolateral prefrontal association cortex, V2/3 = Visual association area V2/V3, Th = thalamus.
Tables
Key resources table
| Reagent type (species) or resource | Designation | Source of reference | Identifiers/RRIDS | Additional information |
|---|---|---|---|---|
| Antibody | Anti-Red Fluorescece Protein (RFP) | Rockland | 600-401-379/ RRID: AB_828390 | (1:1000) |
| Antibody | DAPI | Invitrogen | D1306 | (1:1000) |
| Antibody | Anti-Tyrosin- Hydroxilase | Sigma | T2928/ RRID: AB_477569 | (1:4000) |
| Antibody | Anti-misfolded SOD1 (B8H10) | MediMabs | MM-0070/ RRID:AB_10015296 | (1:1000) |
| Antibody | Donkey anti rabbit Alexa-568 | Life Technologies | A10042 | (1:500) |
| Antibody | Anti NeuN | Millipore | MAB377/ RRID:AB_2298772 | (1:100) |
| Antibody | Donkey anti-mouse Alexa-488 | Life Technologies | A21202 | (1:500) |
| Strain, strain background (Mus musculus) | B6SJL-Tg(SOD1 *G93A)1Gur/J | Jackson Laboratories | RRID:IMSR_JAX:002726 | high-copy, henceforth mSOD |
| Strain, strain background (Mus musculus) | B6.Cg-Gt(ROSA) 26Sortm6/ (CAG-ZsGreen)Hze/J | Jackson Laboratories | 007906 | henceforth ZsGreen-ROSA26 |
| Strain, strain background (Mus musculus) | B6.Cg-Gt(ROSA) 26Sortm6/(CAG-Td Tomato)Hze/J | Jackson Laboratories | 007914 | henceforth tdTomato-ROSA26 |
| Chemical compound, drug | Phenol Red Solution | Sigma‐Aldrich | P0290 | |
| Chemical compound, drug | Protease inhibitor mix | Serva | 39101.03 | |
| Chemical compound, drug | Polyethylenimine (PEI) | Polysciences | 23966 | |
| Chemical compound, drug | Optiprep | Progen | 1114542 | |
| Chemical compound, drug | Buprenorphine | Reckitt Benckiser | ||
| Chemical compound, drug | Meloxicam | Böhringer Ingelheim | ||
| Chemical compound, drug | Ketamine 10% | WDT | ||
| Chemical compound, drug | Rompun 2% (Xylazin) | Bayer | ||
| Recombinant DNA reagent | AAV9-RGDLRVS -CMV-Cre | Varadi et al., 2012 | ||
| Recombinant DNA reagent | AAV9-SLRSPPS -CMV-Cre | Varadi et al., 2012 | ||
| Recombinant DNA reagent | AAV9-NSSRFTP -CMV-Cre | Varadi et al., 2012 | ||
| Recombinant DNA reagent | WT-AAV2- CMV-Cre | Werfel et al., 2014 | ||
| Recombinant DNA reagent | WT-AAV9-CMV-Cre | Werfel et al., 2014 | ||
| Peptide, recombinant protein | Alexa-488-conjugated cholera toxin B | Invitrogen | C34775 | |
| Peptide, recombinant protein | Alexa-647-conjugated cholera toxin B | Invitrogen | C34778 |
Table 1
Subject demographics and clinical characterization.
https://doi.org/10.7554/eLife.36892.028| Healthy controls | ALS, all, T0 | p-value | |
|---|---|---|---|
| Subjects (number) | 28 | 71 | NA |
| Gender (male:female) | 15:13 | 39:32 | 1.000* |
| Age (years) | 54.8 (±12.9), 22.4—75.7 | 58.4 (±13.7), 19.7—85.1 | 0.228† |
| Duration of disease (month) | NA | 19.2 (±17.6), 2.6—84.7 | NA |
| Age of onset (years) | NA | 56.8 (±13.9), 19.2—84.6 | NA |
| ALSFRS-R‡ | NA | 40 (±5), 24—48 | NA |
| Rate of disease progression§ (1/month) | NA | 0.8 (±1.2), 0.0—7.8 | NA |
-
Data are shown as mean (±std), min—max. All values were computed using the MATLAB (The Mathworks Inc, Natick, MA) based ‘Statistics Toolbox’.
*Fisher’s exact test refers to comparison between all ALS patients and healthy controls.
-
†Two-sample unpaired t-test assuming unequal variances refers to comparison between all ALS patients and healthy controls.
‡ALSFRS-R, revised ALS Functional Rating Scale (maximum score 48, falling with increasing physical impairment).
-
§Rate of disease progression computed as (48 - ALSFRS-R)/(disease duration)(Menke et al., 2014). NA, not applicable.
Additional files
-
Supplementary file 1
(a) AAV variants injected in dorsal striatum (DS) and analyzed for their local infectivity ability. Number of neurons are normalized over AAV9- WT and expressed in terms of percentage. (b) AAV variants injected in dorsal striatum (DS) and analyzed for their retrograde infection ability to substantia nigra (SNr). Number of neurons are normalized over AAV9- WT and expressed in terms of percentage. (c) AAV variants injected in dorsal striatum (DS) and analyzed for their retrograde infection ability to motor cortex (MO). Number of neurons are normalized over AAV9- WT and expressed in terms of percentage. (d) AAV variants injected in primary visual cortex (V1) and analyzed for their retrograde infection ability to lateral geniculate nucleus (LGN). Number of neurons are normalized over AAV9- WT and expressed in terms of percentage. (e) Input to primary motor cortex (pMO) and secondary motor cortex (sMO) in WT animals (P20) traced via AAV9-SLR injection. Numbers are expressed in term of total neuronal count. (f) Input to primary motor cortex (pMO) and secondary motor cortex (sMO) in WT animals(P20) traced via AAV9-SLR injection. Neuronal count normalized for the volume of the injection site. (g) Input to primary motor cortex (pMO) and secondary motor cortex (sMO) in WT animals (P20) traced via AAV9-SLR injection. Total count was normalized for the volume of the injection site and contribution from each brain region is reported in term of percentage. (i) Input from thalamic nuclei to primary motor cortex (pMO) and secondary motor cortex (sMO) in WT animals(P20) traced via AAV9-SLR injection. Neuronal count normalized for the volume of the injection site. (j) Input from thalamic nuclei to primary motor cortex (pMO) and secondary motor cortex (sMO) in WT animals(P20) traced via AAV9-SLR injection. Total count was normalized for the volume of the injection site and contribution from each nucleus is reported in term of percentage.
- https://doi.org/10.7554/eLife.36892.029
-
Supplementary file 2
(a) Input to primary motor cortex in WT and mSOD animals (P20) traced via AAV9-SLR injection.Analysis of total number of neurons is reported. Numbers are expressed in term of total neuronal count. (b) Input to primary motor cortex in WT and mSOD animals (P20) traced via AAV9-SLR injection. Neuronal count normalized for the volume of the injection site. (c) Input from cortical layers (ipsilateral SS and ipsilateral AUD) to primary motor cortex in WT and mSOD animals(P20) traced via AAV9-SLR injection. Numbers are expressed in term of total neuronal count. (c) Input from cortical layers (ipsilateral SS and ipsilateral AUD) to primary motor cortex in WT and mSOD animals (P20) traced via AAV9-SLR injection. Neuronal count normalized for the volume of the injection site. (e) Input from cortical layers (ipsilateral SS and ipsilateral AUD) to primary motor cortex in WT and mSOD animals (P20) traced via AAV9-SLR injection. Total neuronal count was normalized for the volume of the injection site, values are expressed in terms of percentage. (f) Input to primary motor cortex in WT and mSOD animals (P20) traced via choleratoxin (CTb) injection. Numbers are expressed in term of total neuronal count. (g) Input to primary motor cortex in WT and mSOD animals (P20) traced via choleratoxin (CTb) injection. Neuronal count normalized for the volume of the injection site. (h) Input to primary visual cortex (V1) in WT and mSOD animals (P20) traced via AAV9-SLR injection. Numbers are expressed in term of total neuronal count. (i) Input to primary visual cortex (V1) in WT and mSOD animals (P20) traced via AAV9-SLR injection. Neuronal count normalized for the volume of the injection site. (j) Input to secondary motor cortex in WT and mSOD animals (P20) traced via AAV9-SLR injection. Analysis of total number of neurons is reported. Numbers are expressed in term of total neuronal count. (k) Input to secondary motor cortex in WT and mSOD animals (P20) traced via AAV9-SLR injection. Neuronal count normalized for the volume of the injection site.
- https://doi.org/10.7554/eLife.36892.030
-
Supplementary file 3
(a) Input to primary motor cortex in mSOD animals traced via AAV9-SLR injection during disease progression: early pre- symptomatic(P20), intermediate (P60) and later stage (P90). Total neuronal count was normalized for the volume of injections ite, numbers expressed in term of fold change over the relative WT. (b) Spine density analysis on basal dendrites (10 µm stretch) of cortical pyramidal neurons projecting to pMO. Comparison between WT and earlypre-symptomatic mice (P20). Tracing via AAV9-SLR injected in pMO. (c) Spine density analysis on basal dendrites (10 µm stretch) of cortical pyramidal neurons projecting to pMO. Comparison between WT and intermediate stage mice (P60). Tracing via AAV9-SLR injected in pMO. (d) Spine density analysis on basal dendrites (10 µm stretch) of cortical pyramidal neurons projecting to pMO. Comparison between WT and later stage mice (P90). Tracing via AAV9-SLR injected in pMO. (e) Analysis for misfSOD intensity in cortical projecting neurons to primary motor cortex in mSOD pre-symptomatic mice (P20). Tracing via choleratoxin (CTb). (f) Analysis for misfSOD intensity in projecting neurons to SS in mSOD mice (P50). Tracing via choleratoxin (CTb). (g) Spine density analysis on basal dendrites (10 µm stretch) of cortical pyramidal neurons projecting to primary motor cortex. Comparison between misfSOD- and misfSOD +neurons of mSOD mice (P60). Tracing via AAV9-SLR injected in pMO.
- https://doi.org/10.7554/eLife.36892.031
-
Transparent reporting form
- https://doi.org/10.7554/eLife.36892.032
Download links
A two-part list of links to download the article, or parts of the article, in various formats.
Downloads (link to download the article as PDF)
Open citations (links to open the citations from this article in various online reference manager services)
Cite this article (links to download the citations from this article in formats compatible with various reference manager tools)
Stage-dependent remodeling of projections to motor cortex in ALS mouse model revealed by a new variant retrograde-AAV9
eLife 7:e36892.
https://doi.org/10.7554/eLife.36892


