Wnt/PCP controls spreading of Wnt/β-catenin signals by cytonemes in vertebrates
- University of Exeter, United Kingdom
- Karlsruhe Institute of Technology, Germany
- Duke-NUS Medical School, Singapore
- University Hospital Heidelberg, Germany
- Jülich Supercomputing Centre, Germany
- RWTH Aachen University, Germany
- University of Heidelberg, Germany
- University of Illinois at Urbana-Champaign, United States
Figures
Figure 1 with 1 supplement
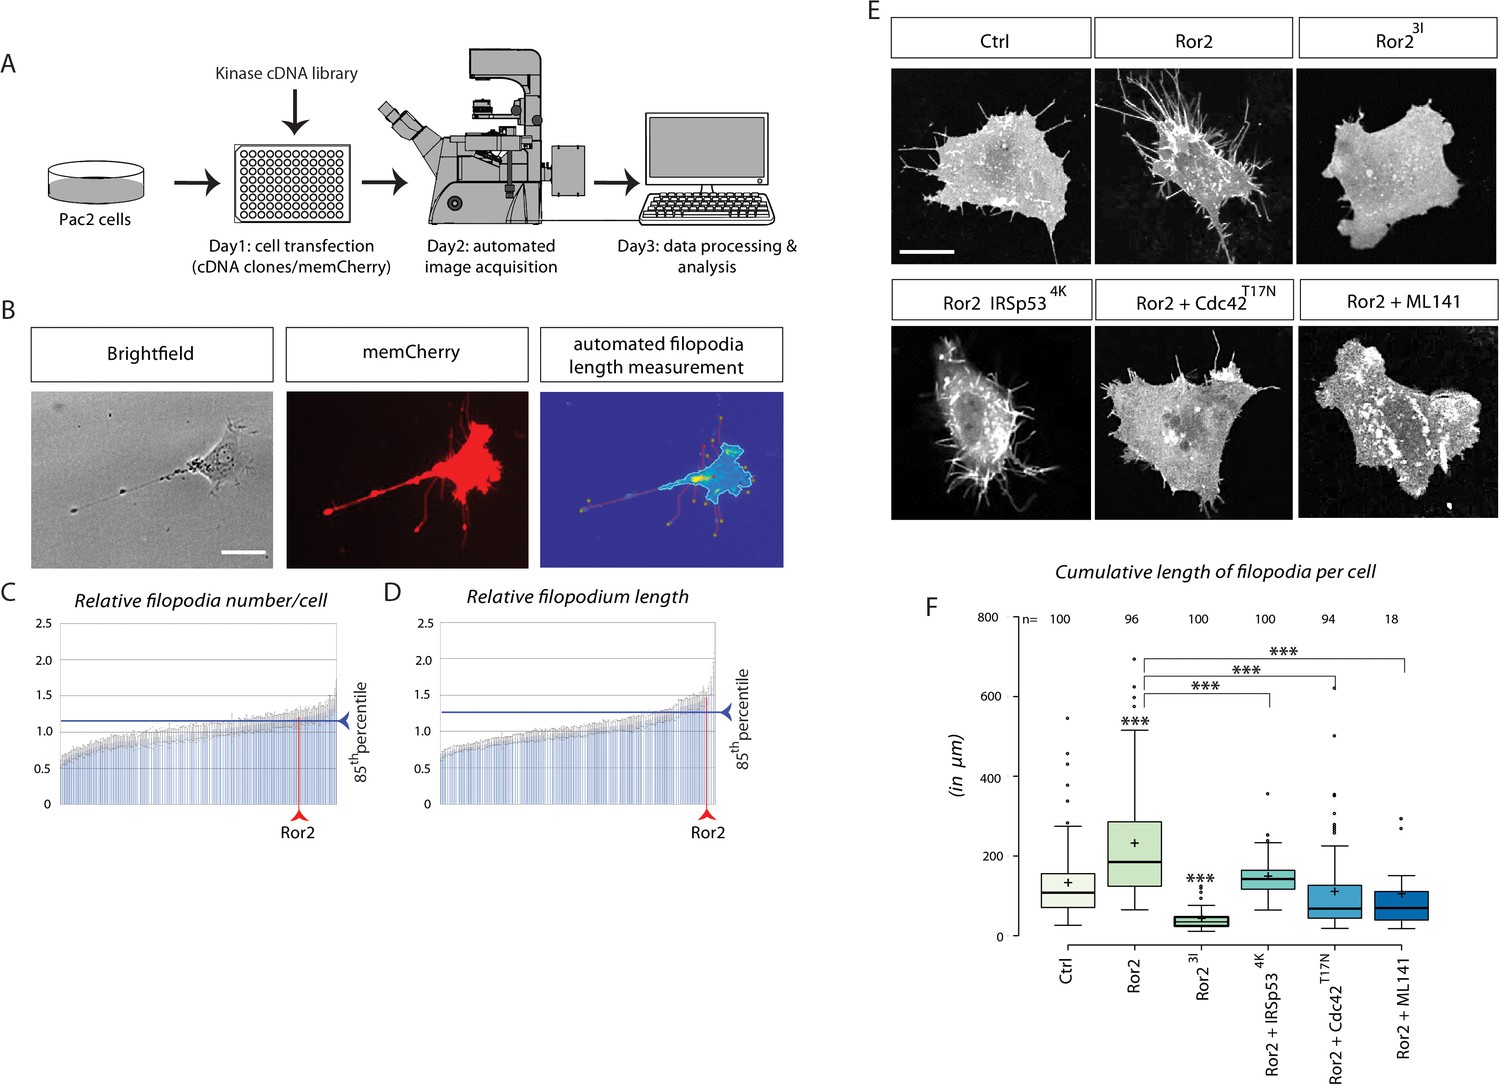
Kinase screen and automated image-analysis identifies the receptor tyrosine kinase Ror2 as a potential cytoneme regulator upstream of Cdc42.
(A) Schematic workflow of the cDNA kinase screen. Wnt8a-GFP and a membrane bound mCherry was co-transfected with kinase library genes in a 96-well plate. Images were acquired automatically and analyzed for filopodia length and numbers using filopodia-detection software. (B) Automated image analysis software detects and counts the filopodia of single cells using the memCherry signal and quantifies their length by automatically tracing the tips back to the cell body. Scale bar represents 15 µm. (C, D) Diagrams illustrating transfected kinase genes on the x-axes and their relative filopodia number/cell (C) and length (D). Each bar represents one of 229 kinases, sorted ascending by their values. The blue line indicates the 85th percentile (relative number: 1.20, relative length: 1.25). The position of Ror2 in the diagram is highlighted by the red line (relative number: 1.20, relative length: 1.47). (E) Quantification of filopodia in PAC2 cells 24 hr after transfection or inhibitor treatment. memCherry was transfected together with the indicated constructs. Scale bar represents 10 µm. (F) Boxplot of cumulative filopodia length of cells transfected with the indicated constructs as measured by ImageJ. Centre lines show the median values; box limits indicate the 25th and 75th percentiles as determined by R software; whiskers extend 1.5 times the interquartile range from the 25th and 75th percentiles, outliers are represented by dots. Significance level as indicated: ***=P<0.001, **=P<0.01, =P<0.05. Data meet the assumption that the length of the filopodia is significantly different in the analyzed groups as determined by one-way ANOVA with a p=5.79*10−99, confidence interval 95%, F value=118, and df=1,047.
Figure 1—figure supplement 1
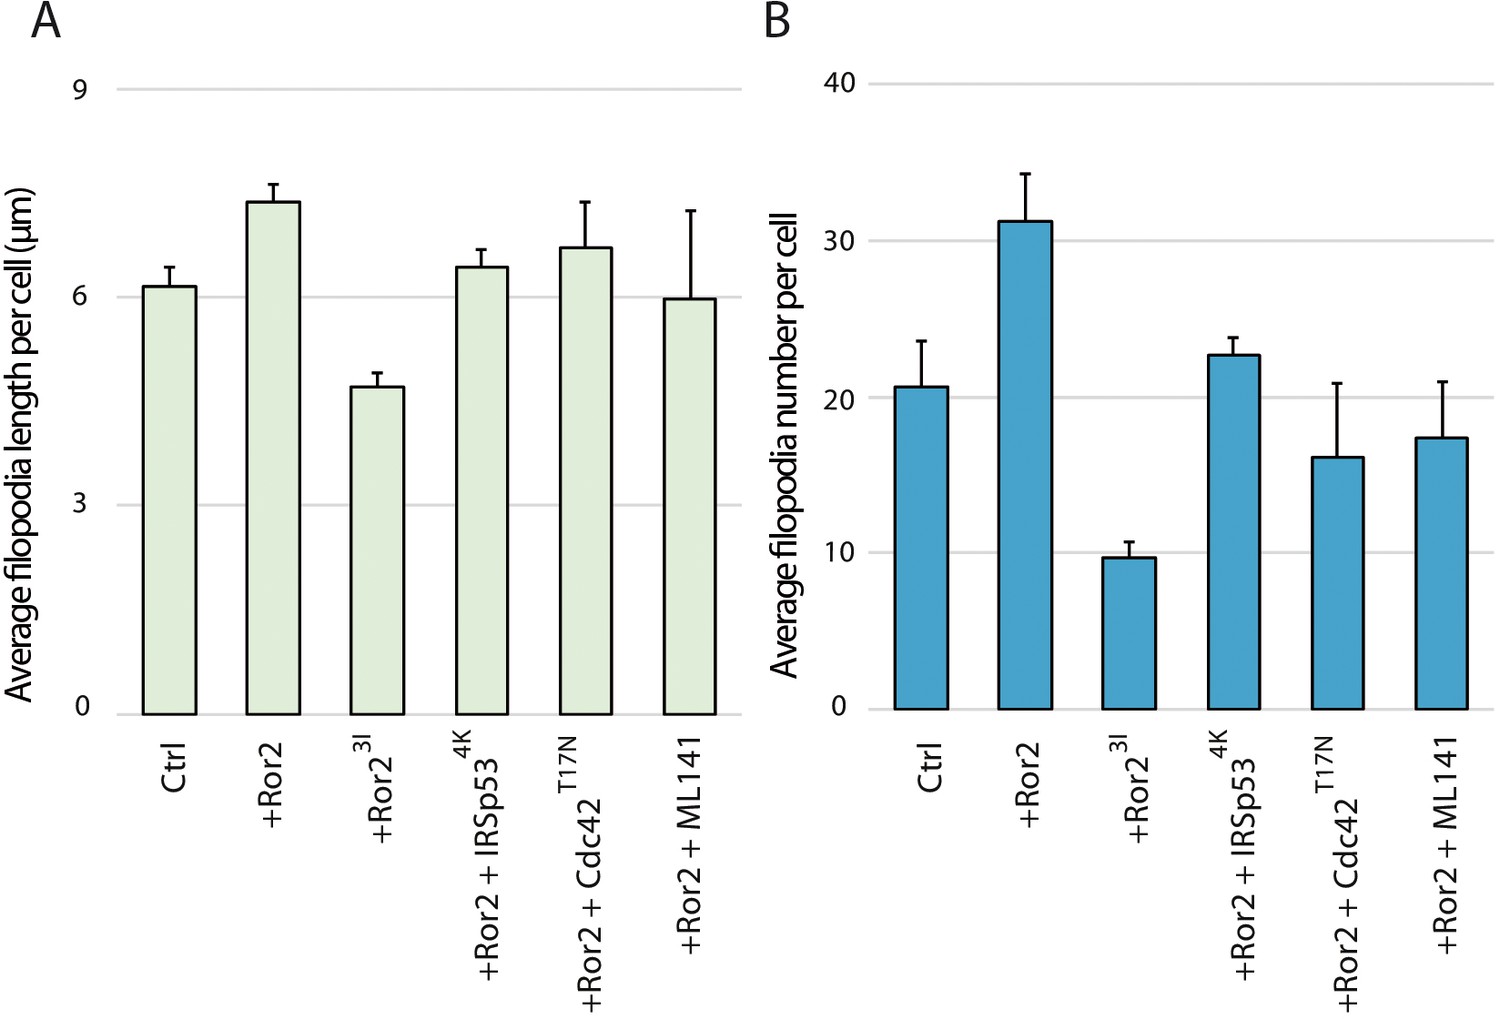
Quantification of cytoneme parameters.
(A–B) Bar diagram showing the average lengths (A) or numbers (B) of filopodia per PAC2 cell. Error bars represents the SEMs.
Figure 2 with 2 supplements
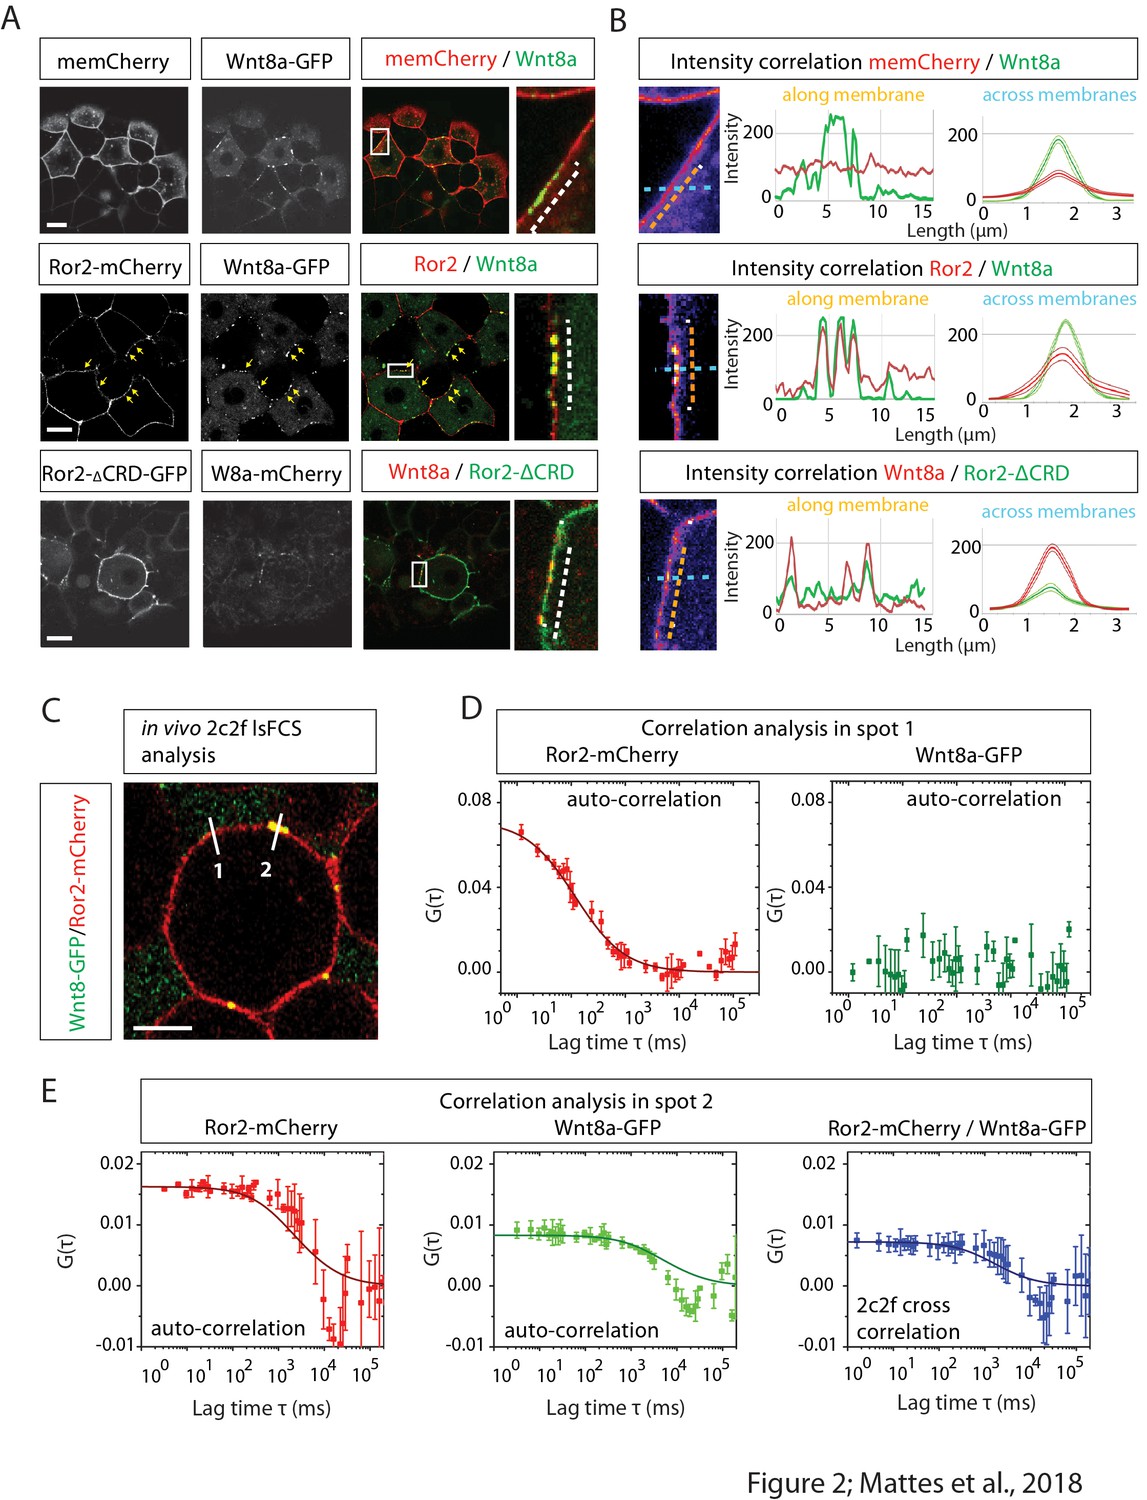
Image-based protein interaction analysis highlights Ror2s involvement in Wnt8a binding and cluster formation.
(A) At the 8–16 cell stage, single blastomeres of zebrafish embryos were microinjected with 25 ng/µl mRNA of the indicated constructs to generate cell clones at 50% epiboly for confocal microscopy analysis. The imaging visualizes the co-localization of proteins in a single confocal plane including high-magnification of clusters. (B) A co-localization channel, obtained using fire LUT, and the intensity plot profile were generated in ImageJ. The intensity plots show one individual measurement along the membrane (left plot, orange arrows) and the average of measurements across the membrane including the SEM (right plot, light blue arrows). The graphs represents 10 membrane clusters acquired from five different cells of two different embryos per treatment. (C) Close-up of a 6–8 hpf live zebrafish embryos showing schematically how two-color two-foci line-scanning fluorescence correlation spectroscopy (2c2f lsFCS) data were collected by laser scanning perpendicular to the membrane (white lines) to collect data in the absence (spot 1) or presence (spot 2) of Wnt8a-GFP. Embryos were mounted in agarose and injected with Wnt8a-GFP and Ror2-mCherry. (D) Autocorrelation functions of Ror2-mCherry (red) and Wnt8a-GFP (green) (symbols) and model fit (line) measured in spot 1. The total time of the measurements was 390 s. Importantly, there is no Wnt8a-GFP at this position, as shown by the lacking autocorrelation in the green channel. Error bars represent standard deviations from two measurements. (E) Autocorrelation functions of Ror2-mCherry (red) and Wnt8a-GFP (green) and the dual-color cross-correlation (blue) (symbols) and model fits (lines) measured in spot 2. Here, Wnt8a-GFP is present, and a high cross-correlation amplitude indicates co-diffusion of bound Ror2-mCherry and Wnt8a-GFP. Error bars indicate standard deviations from two measurements.
Figure 2—figure supplement 1
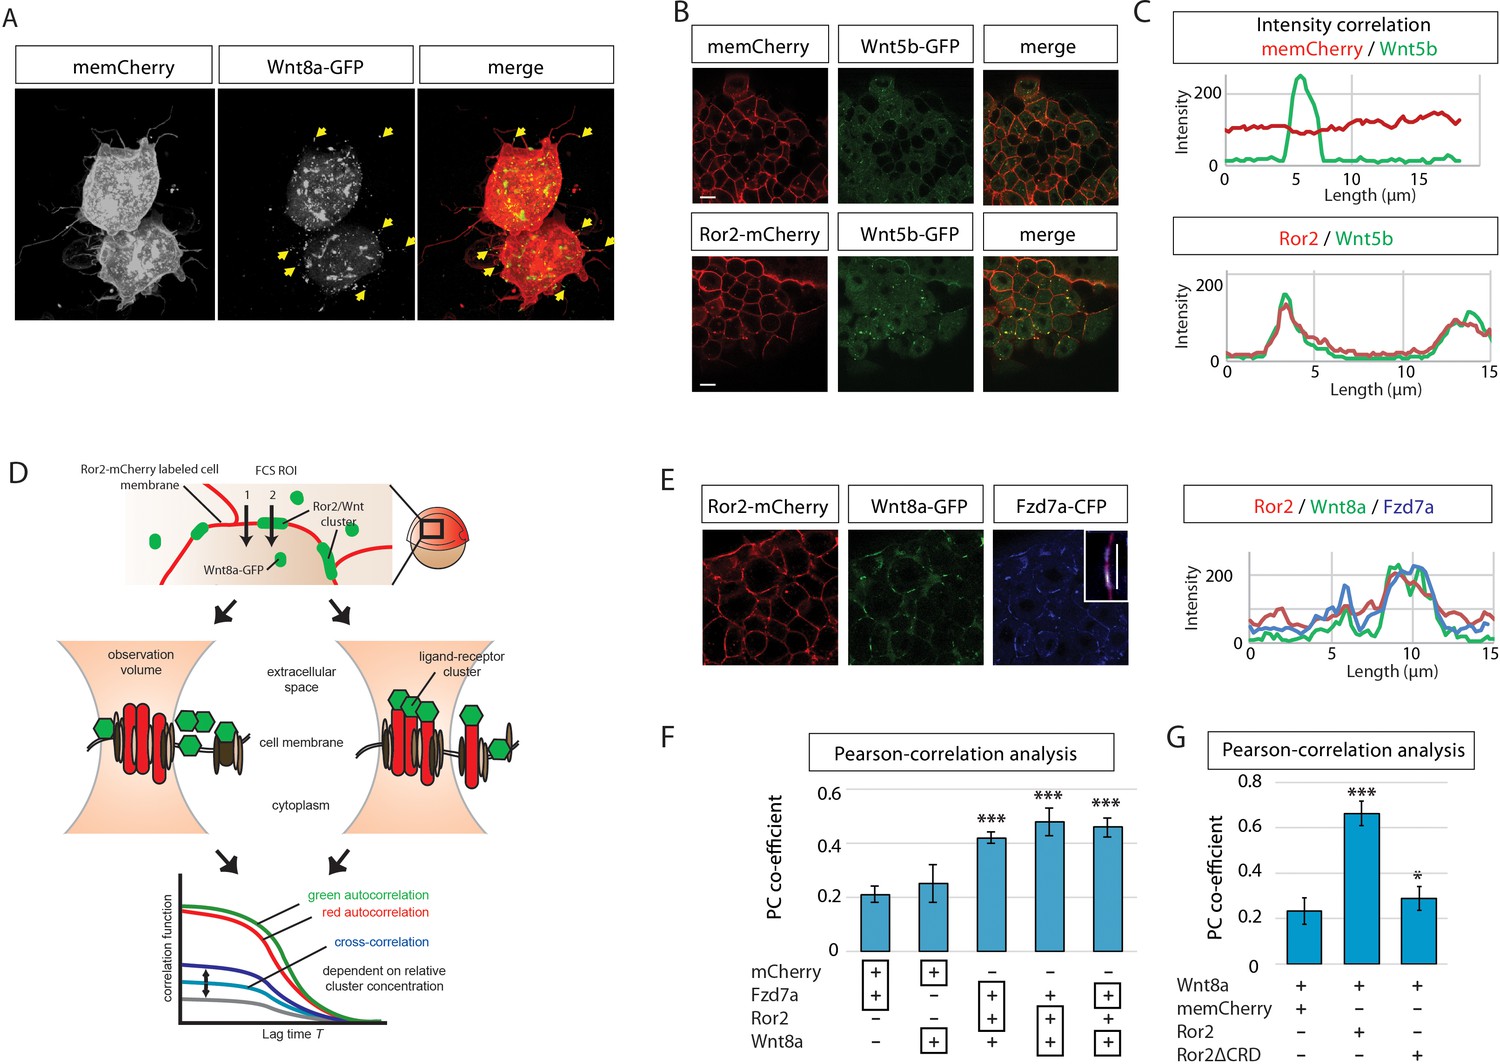
Ror2 binds to Wnt8a and Frizzled7a.
(A) 3D confocal image of a cell clone at 50% epiboly. The embryo was injected with memCherry and Wnt8a-GFP. Cytonemes feature Wnt8a-GFP clusters at their tip (arrows). (B) Single confocal planes of embryos injected with Wnt5b-GFP and memCherry or Ror2-mCherry. (C) Intensity profiles along 15 µm of cell membrane containing Wnt5b-GFP spots, showing spatial intensity correlations with Ror2-mCherry. (D) Schematic depiction of the principle of line scanning fluorescence correlation spectroscopy (FCS) measurements, which allows us to remove fluorescence fluctuations that result from membrane motion. Red and green emitting laser foci are scanned perpendicularly through the plasma membrane. The emission is recorded as a function of time and corrected for membrane fluctuations. The autocorrelation functions of Ror2-mCherry (red excitation) and Wnt8a-GFP (green excitation) are computed from the intensity time traces and yield local concentrations (i.e., area densities) and diffusional correlation times. The cross-correlation between red and green is a measure of joint intensity fluctuations in the two channels caused by Wnt8a-GFP bound to Ror2-mCherry diffusing together through the excitation focus. (E) Diagram of confocal planes of embryos injected with Wnt8a-GFP, Ror2-mCherry and Fzd7a-CFP and the corresponding intensity correlation. (F, G) Pearson correlation coefficients of pairs of fluorescent proteins in a dual-color image (as indicated by the black boxes below the bar graph). The result is +1 for perfect correlation, 0 for no correlation. (F) Analysis of confocal images of embryos at 50% epiboly injected with the indicated constructs, as determined by Imaris software. (G) A Pearson co-localization analysis of the indicated fluorescent constructs in a tissue volume of 40 × 40 × 60 µm3 of eight different embryos. ***=P<0.001.
Figure 2—video 1
Time-lapse movie of localization of Ror2-mCherry and Wnt8a-GFP in a developing zebrafish embryo in the gastrulation stages.
The movie illustrates the co-localization of Ror2-mCherry and Wnt8a-GFP in clusters and their dynamics over time. A single confocal plane was imaged at 6 hpf for 20 min with a frame rate of 15 s. Still pictures from the movie are presented in Figure 2A.
Figure 3 with 1 supplement

Synergistic Wnt PCP activation by Wnt8a and Ror2 in zebrafish and Xenopus embryos.
(A) Embryos at 11 hpf were fixed and subjected to in situ hybridization against hgg/ntl. Scale bar represents 200 µm. (B) Embryos were sorted into groups according to their phenotypes (see Figure 3—figure supplement 1 for details). (C) gsc:memGFP embryos were microinjected with the indicated constructs, fixed at 11 hpf and a defined z-stack was imaged by confocal microscopy. The confocal stack shows the notochord marked by gsc:memGFP from a dorsal view with the animal site to the top. Magnified insets highlight the shape of the notochord cells. Scale bar represents 20 µm. (D) Analysis of cell roundness. The boxplot shows the width/length ratio of 25 notochordal cells. Circularity ranges from 0 (infinitely elongated polygon) to 1 (perfect circle). ANOVA confirmed that cell roundness is significantly different in the analyzed groups with p=2.91*10−24, confidence interval 95%, F value=37, and df=149. (E) ATF luciferase reporter assay of pooled Xenopus gastrulae injected with the indicated constructs and the ATF2 firefly and Renilla luciferase reporter. Data shown are the mean with SD of three independent experiments. ***=P<0.001, **=P<0.01, *=P<0.05, ns, not significant.
Figure 3—figure supplement 1
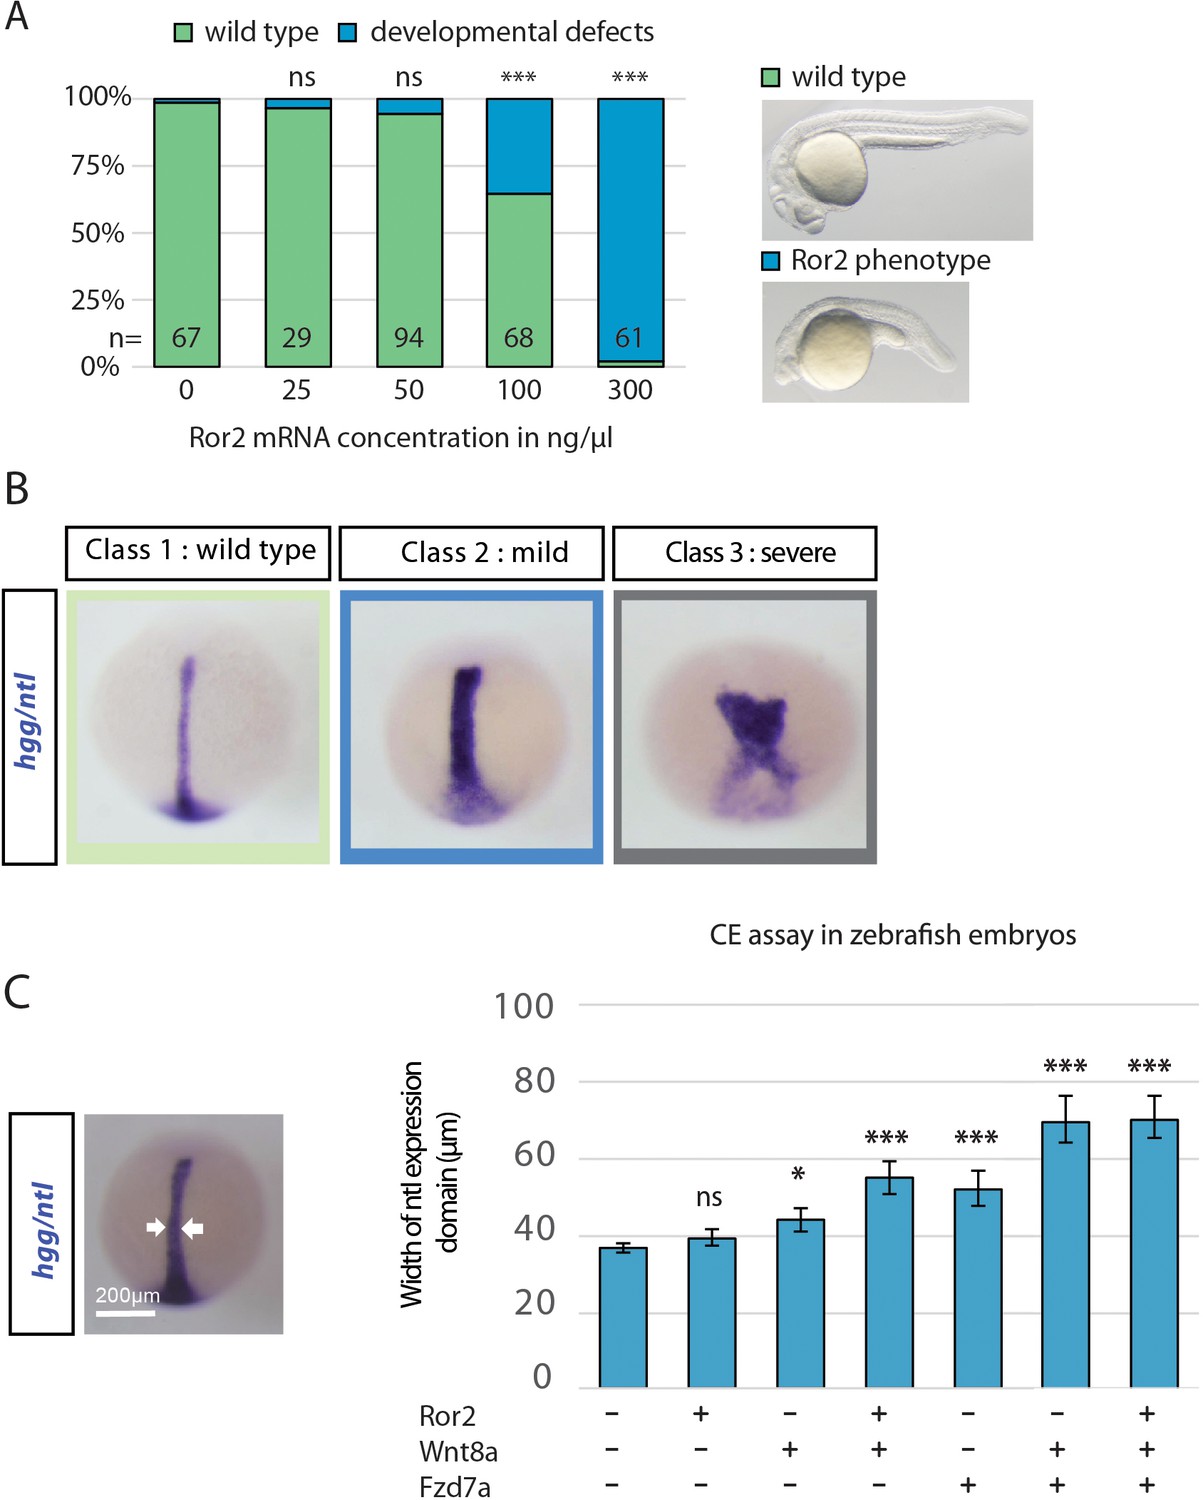
Analysis of convergent extension phenotype in zebrafish development
(A) Microinjection of Ror2-mCherry mRNA in rising concentrations and classification of phenotypes into groups showing developmental alterations at 24 hpf. A Chi-squared test was performed to determine the p values. (B) Classification of embryos into three groups of phenotypes depending on their ntl expression. (C) Quantification of the ntl expression width. Location of the measurement is shown in the left image (dorsal view, animal to the top) and the bar diagram represents average width with SEM. ***=P<0.001, *=P<0.05.
Figure 4 with 2 supplements
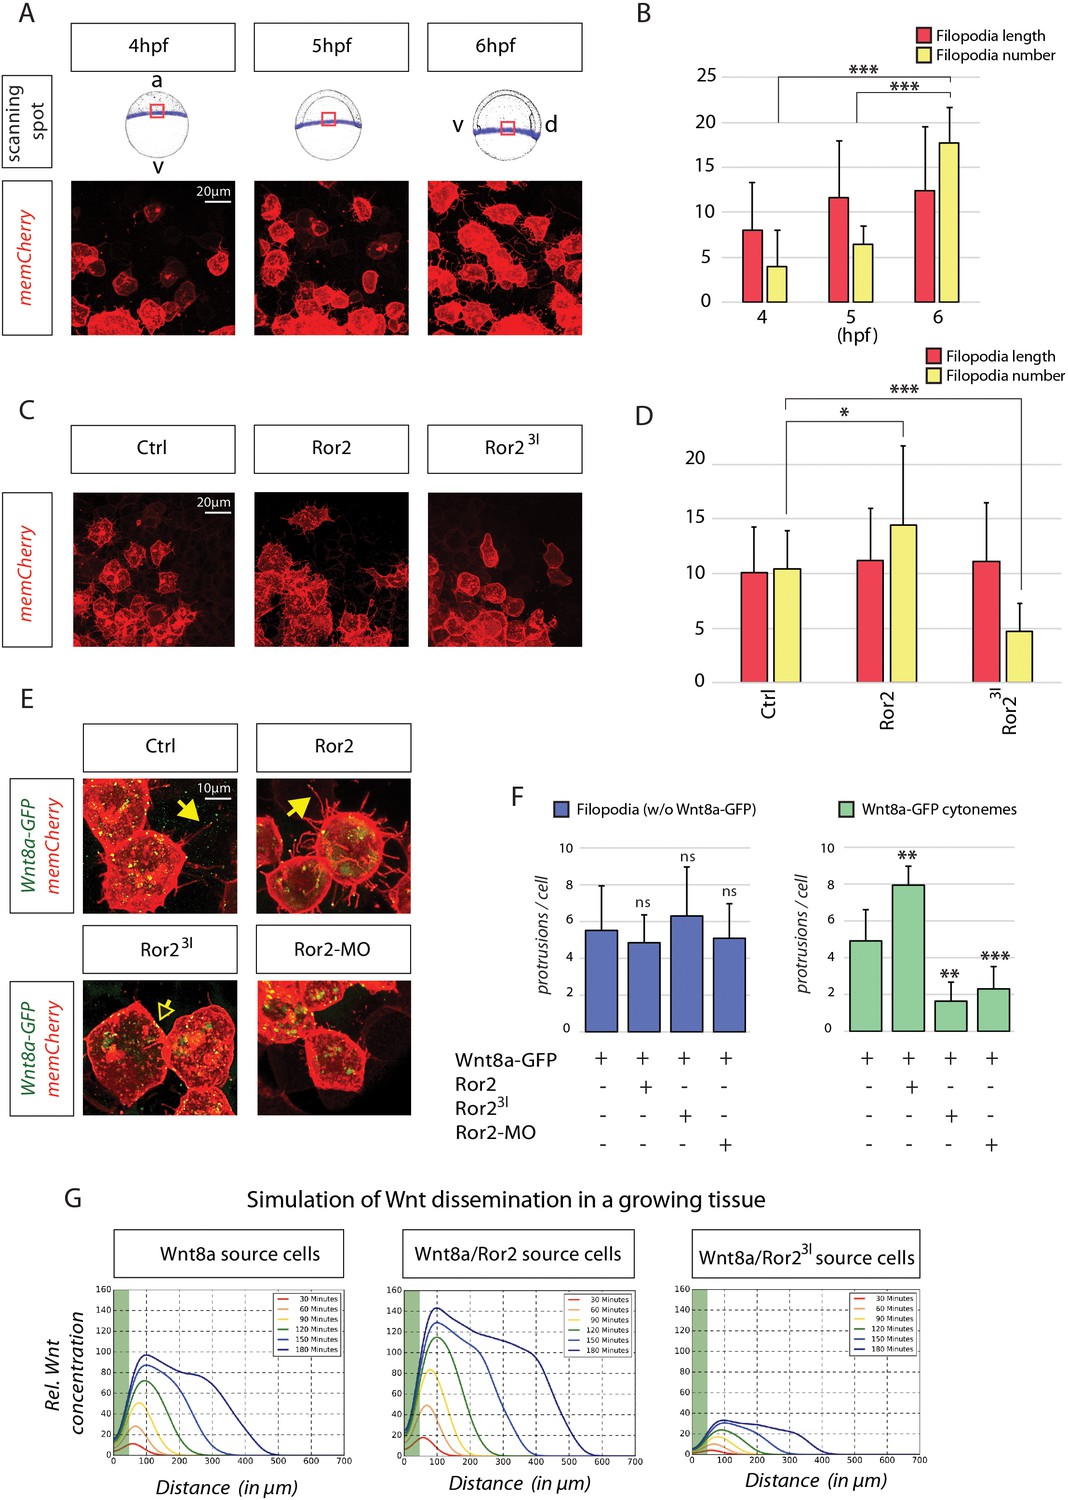
In-depth analysis and simulation of Wnt-positive cytonemes in zebrafish embryos in vivo.
(A) Live confocal microscopy analysis of filopodia dynamics over time. Mosaic expression of memCherry was utilized to quantify the protrusions of single cells at the indicated positions. The image shows the same cells at different times during zebrafish gastrulation. (B) Filopodia of cells in (A) were measured using semi-quantitative segmentation software (see Figure 4—figure supplement 1 for details). Quantification illustrates the mean filopodia length and the number of filopodia per cell with SEM at different time points. (C) Effect of Ror2 on filopodia length and number. Live confocal microscopy analysis of the filopodia of embryos injected with Ror2 or Ror23I mRNA at the one-cell stage. (D) Diagram of mean filopodia length and number per cell with SEM. (E) Analysis of Wnt cytonemes during live imaging. Embryos were microinjected at the 16-cell stage to generate a cell clone expressing Wnt8a-GFP and memCherry to visualize cytonemes and the Ror2, Ror23I or Ror2-MO oligomer. Confocal images of single cells were taken and subjected to filopodia length/number measurement. See Figure 4—figure supplement 1 for stacked diagrams with chi-squared test analysis. (F) Bar diagram showing the number of filopodia without Wnt8a-GFP (i.e. GFP signal below detection limit) or filopodia carrying Wnt8a-GFP (cytonemes) (i.e. GFP signal above detection limit) per cell. Statistical analysis ***=P<0.001, **=P<0.01, *P<0.05. Data meet the assumptions illustrated in (B) that filopodia length and number are significantly different at the analyzed time-points (One-way ANOVA, p=1.35*10−9, confidence interval 95%, F value=27.6, and df=73) and in (D) that the filopodia number and length are significantly different across treatments (p=1.61542*10−7, confidence interval 95%, F value=24.6, and df=39). (G) Simulation of Wnt dissemination in a growing tissue over 180 min. Wnt8a is distributed in a graded manner in the target tissue. Modeling the dynamically expanding tissue with single-cell resolution and discrete implementation of cytoneme-based transport establishes a morphogen gradient over the length of the developing tissue. On the basis of the cytoneme appearance measured in (D) and (F), Ror2 activity in the Wnt-producing cells alters the input of Wnt in the target field, which is directly incorporated into the simulation by altering the formation frequency of cytonemes and thus ligand concentration in the neighboring tissue. Simulated time in minutes after the onset of Wnt production at 4 hpf.
Figure 4—figure supplement 1
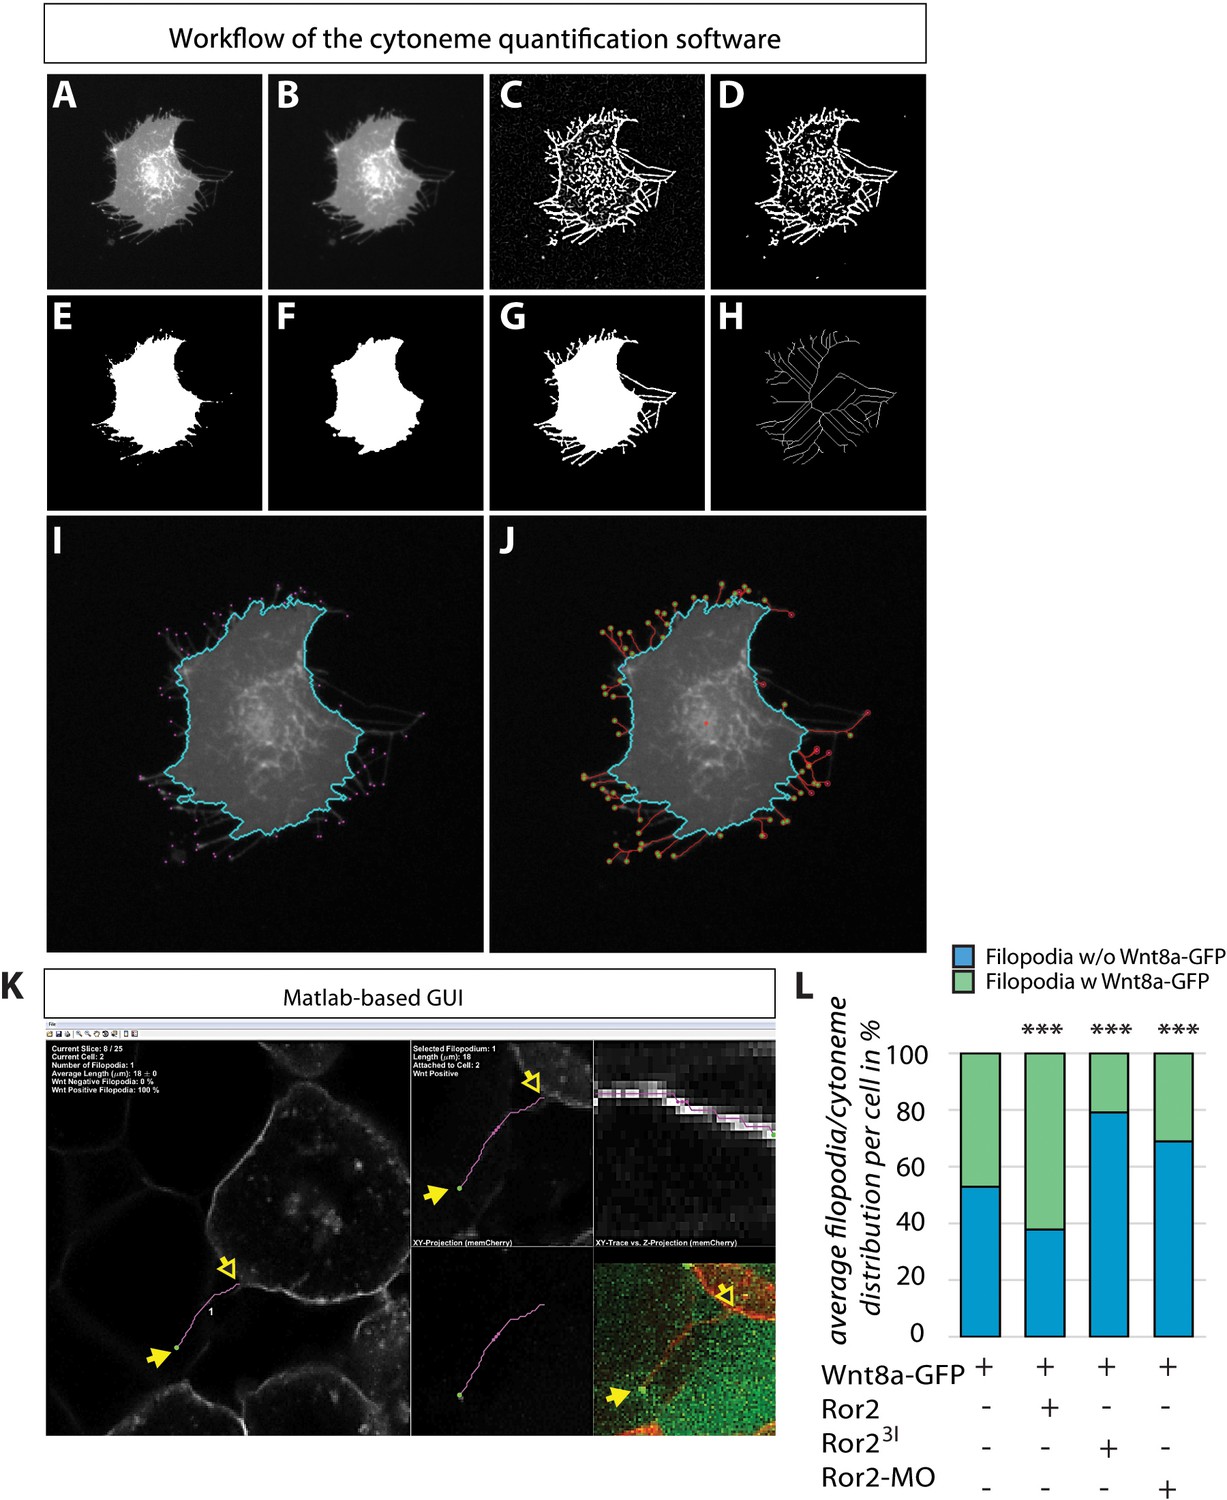
Cytoneme quantification software toextract filopodia automatically using the memCherry channel of the acquired images.
The raw image (A) was initially smoothed with a Gaussian low-pass filter (B) to reduce image noise for facilitated processing. To emphasize the filopodia in the image, we used an objectness filter that emphasizes line-like structures based on the eigenvalues of the Hessian matrix (C) and that binarized the resulting edge image (D) using local adaptive thresholding. For the detection of the cell body, we applied a local adaptive threshold to the Gaussian smoothed raw image (E) and performed a morphological opening operation to remove filopodia remains from the cell body (F). The two binarized images (D) and (F) were then combined to yield the final segmentation mask including cell body and filopodia (G). Finally, the combined binary image (G) was used to obtain a skeleton image (H), which in turn allows the extraction of potential filopodia tips at the end points of the skeleton. The identified cell body (cyan outline) and the potential filopodia tips (magenta dots) are shown in (I). A livewire approach was then used to automatically trace filopodia from the tips to the cell body (J, red lines). (K) To measure and analyse filopodia in acquired 3D images, we developed a custom-made MATLAB graphical user interface (GUI) that allowed us to scroll through the slices of the stack and to trace filopodia semi-automatically on the basis of the manually provided start and end points of a filopodium of interest (yellow arrows). The software automatically traces the filopodium in 3D using a livewire approach to obtain accurate length quantifications. The software also keeps track of all segmented filopodia, provides filopodia counts and length measurements, and provides average quantifications of all identified filopodia. In addition, in a window of the GFP channel, we were able to distinguish between Wnt-positive and Wnt-negative filopodia for embryos expressing Wnt8a-GFP.
Figure 4—video 1
Time-lapse movie of clonal cells forming cytonemes in a developing zebrafish embryo during gastrulation.
Z-projection of a clone of Wnt8a-GFP- and Ror2-mCherry positive cells imaged at 8 hpf for 20 min with a frame rate of 15 s.
Figure 5 with 2 supplements

Visualization of Ror2-Wnt8a cytonemal transport and Lrp6 receptor clustering in the living zebrafish.
(A) Illustration of the injection procedure to generate single cell clones. (B–C) Time series of a single confocal plane of Ror2-mCherry/Wnt8a-GFP-expressing cells to (B) observe Wnt8a recruitment to the membrane and cytoneme initiation and (C) cytonemal target finding and Ror2/Wnt8a cluster endocytosis into the receiving cell. Optimal microscopical settings were used to allow an improved axial resolution of ca. 250 nm. Single channels in Figure 5—figure supplement 1A,B and Figure 5—video 1. Yellow arrows indicate the Wnt8a/Ror2 cluster and highlights pruning of the cytoneme tip after successful cytonemal delivery. Yellow arrows mark the Wnt8a/Ror2 cluster. (D–F) Wnt8a-mCherry cytoneme leads to Lrp6-GFP accumulation and co-localization at the receiving cell. (D) Illustration of the injection procedure used to generate clones to visualize paracrine signal transport. (E) 3D-stack of a Wnt8a-mCherry cytoneme leading to Lrp6-GFP accumulation and co-localization at the receiving cell. The close-up shows a single plane including orthogonal YZ and XZ views of the cytoneme contact point. (F) Single-plane image of a Ror2-mCherry/Wnt8a cell leading to Lrp6-GFP clustering on the cytoneme contact site. Scale bars = 10 µm; in E = 20 µm.
Figure 5—figure supplement 1
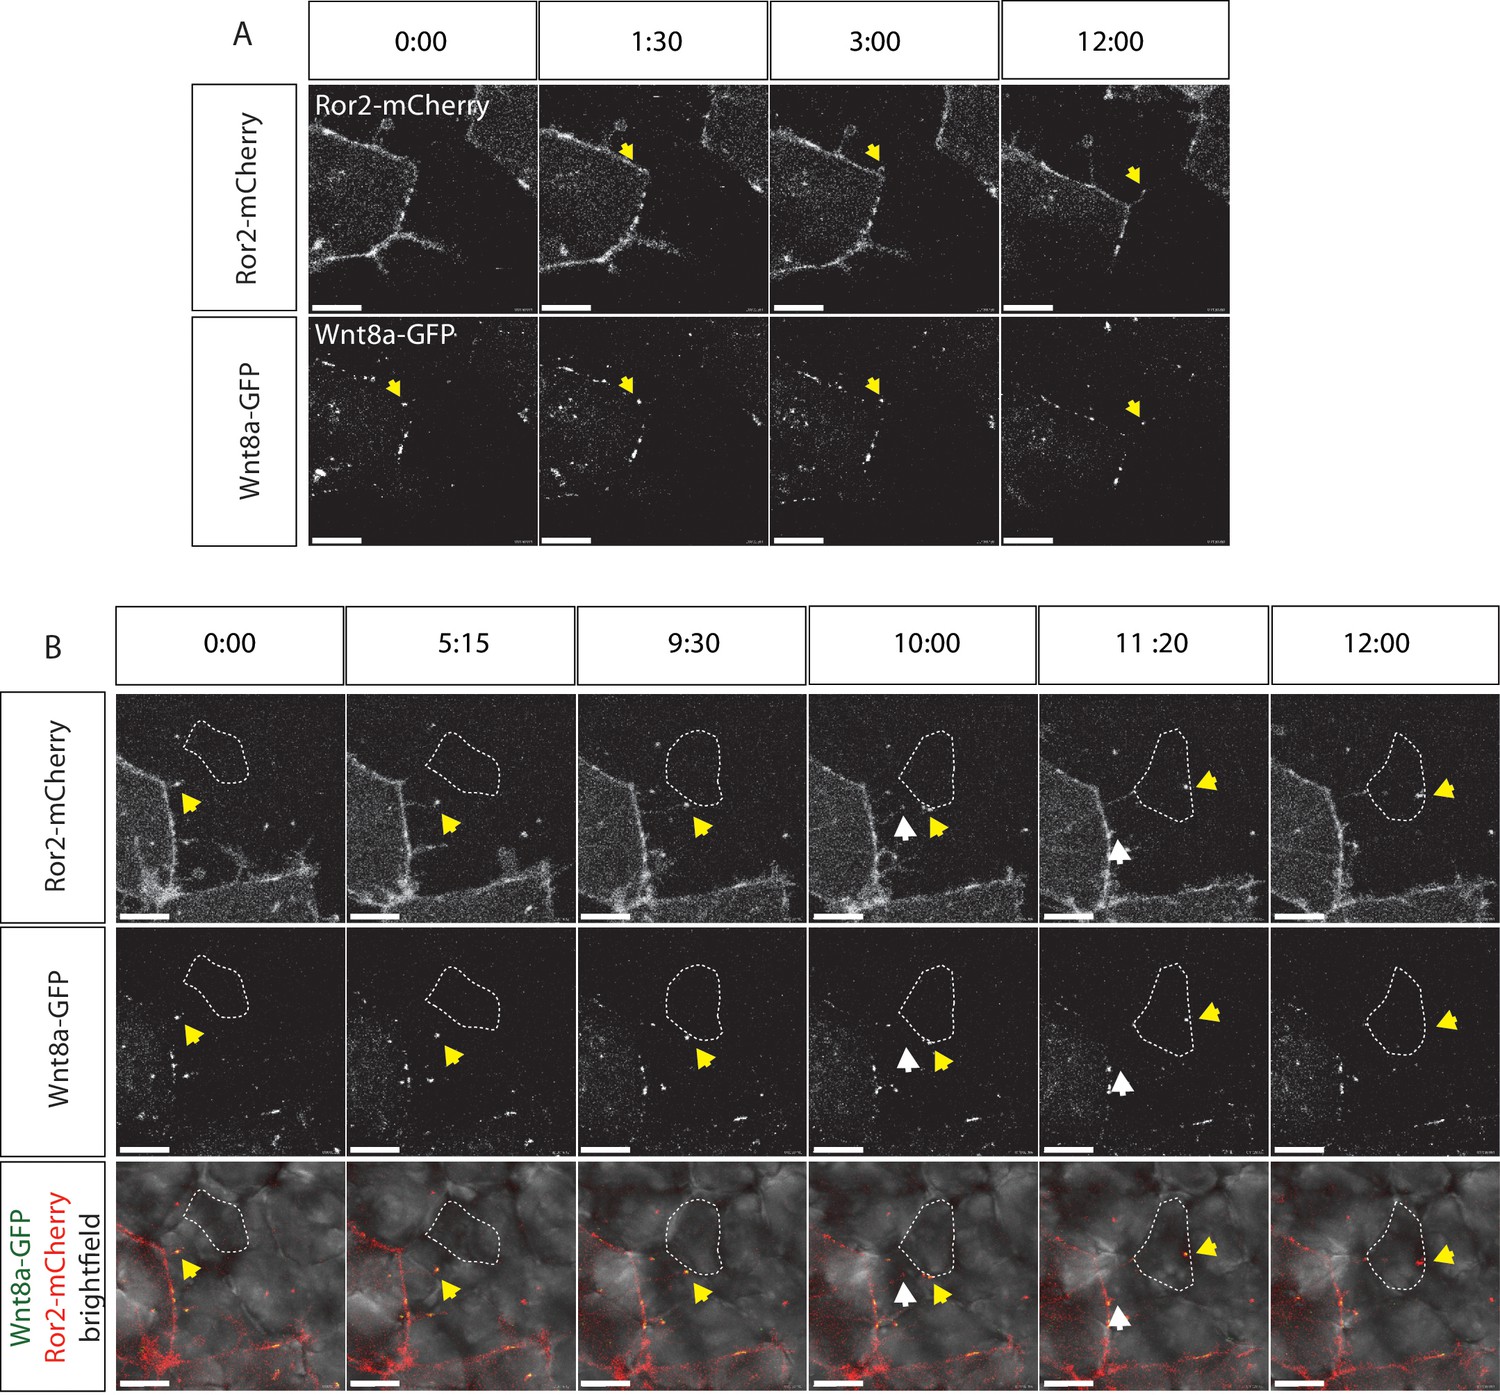
Visualization of Ror2-Wnt8a cytonemal transport in the living zebrafish.
Time series of still pictures of single channels of Ror2-mCherry/Wnt8a-GFP-expressing cells to observe (A) Wnt8a recruitment to the membrane and cytoneme initiation and (B) cytonemal target finding and Ror2/Wnt8a cluster endocytosis into the receiving cell. White arrows indicate the Wnt8a/Ror2 cluster whereas the yellow arrows highlight pruning of the cytoneme tip after successful cytonemal delivery. (B) A series of merged pictures with the bright field channel are included in this panel. Scale bars = 10 µm; in (E) = 20 µm.
Figure 5—video 1
Time-lapse movie of clonal cells forming cytonemes in a developing zebrafish embryo during gastrulation.
Single confocal plane of a clone of Wnt8a-GFP- and Ror2-mCherry-positive cells showing cytonemal target finding and subsequent Ror2/Wnt8a cluster endocytosis of the receiving cell. This movie was imaged at 8 hpf for 20 min with a frame rate of 15 s. Still pictures from the movie are shown in Figure 5C and single channels are presented in Figure 5—figure supplement 1B.
Figure 6 with 1 supplement
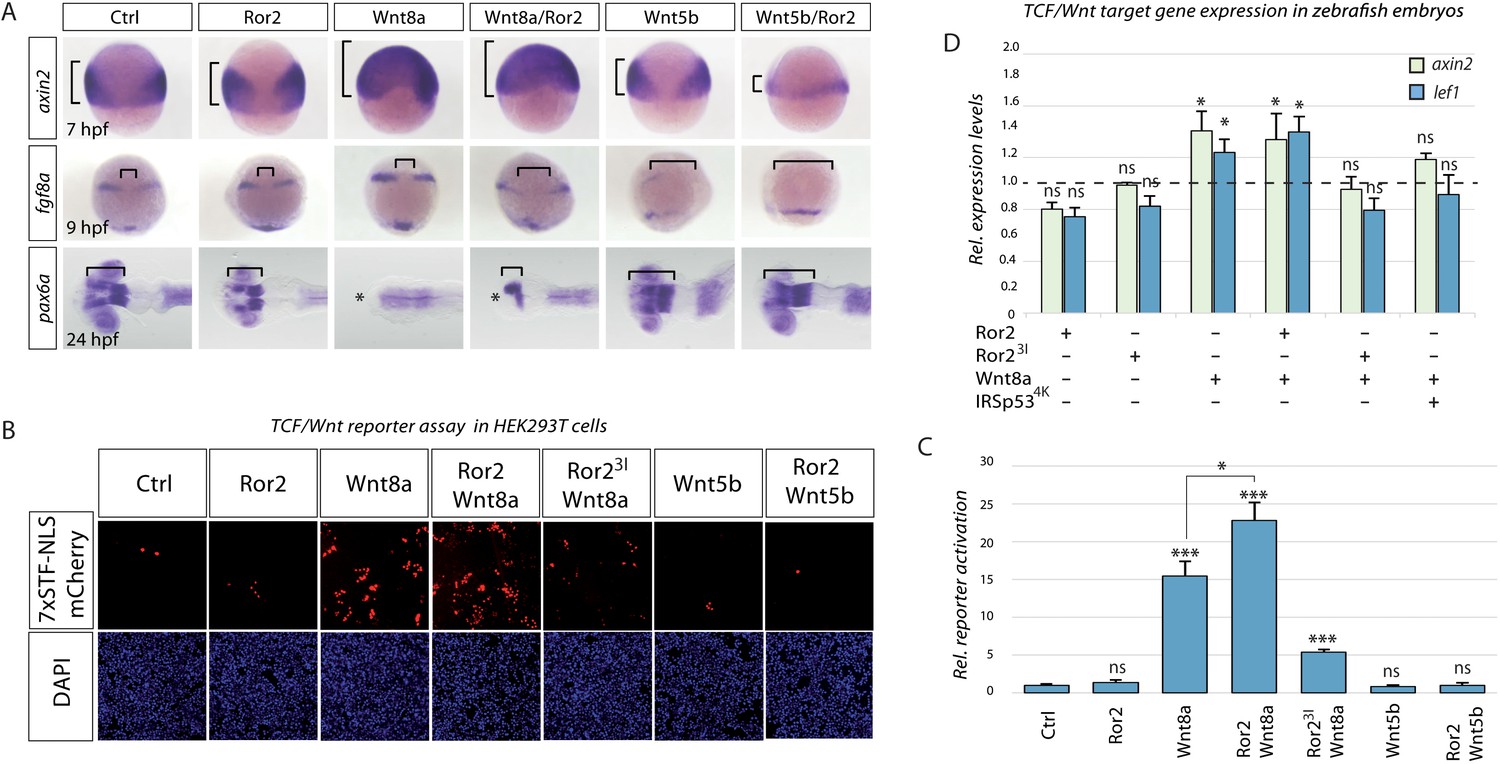
Ror2 enhances paracrine Wnt/β-catenin signaling in zebrafish embryos and HEK293T co-culture.
(A) Microinjected embryos at the indicated stages were fixed and subjected to in situ hybridization against the Wnt target gene (axin2) or against markers for brain patterning (fgf8a, pax6a). Brackets indicate the expansion of Wnt target gene expression (axin2), distance of fgf8 expression domains or forebrain territory (pax6a), while asterisks indicates a lack of forebrain tissue. (B) Co-culture reporter gene assay in HEK293T cells. The TCF/Wnt reporter population was transfected with 7xTRE Super TOPFlash-NLS-mCherry and Lrp6 and co-cultured with a second population as indicated. The co-culture principle is illustrated in Figure 6—figure supplement 1. (C) Relative reporter activation by measuring the mCherry signal. The bar chart shows the mean value with SEM of three independent experiments. Scale bar represents 200 µm. (D) RT-qPCR-based expression assay in zebrafish embryos. Embryos were injected at the 16-cell stage to generate a distinct signaling center at 75% epiboly (see Figure 6—figure supplement 1 for details) and were subjected to RTqPCR. Relative ΔΔCt expression values of Wnt-β-catenin target genes axin2 and lef1 are acquired by normalization to actb1 and in comparison to a control-injected sample (relative ctrl expression level shown as a dotted line). Each condition represents the mean Rt-qPCR result of 4 × 50 embryos acquired from two independent experiments. *** P < 0.001, * P < 0.05. ANOVA confirmed the hypothesis that expression levels are different between treatments with a p=0.00025, confidence interval 95%, F value=33.9, df=11.
Figure 6—figure supplement 1
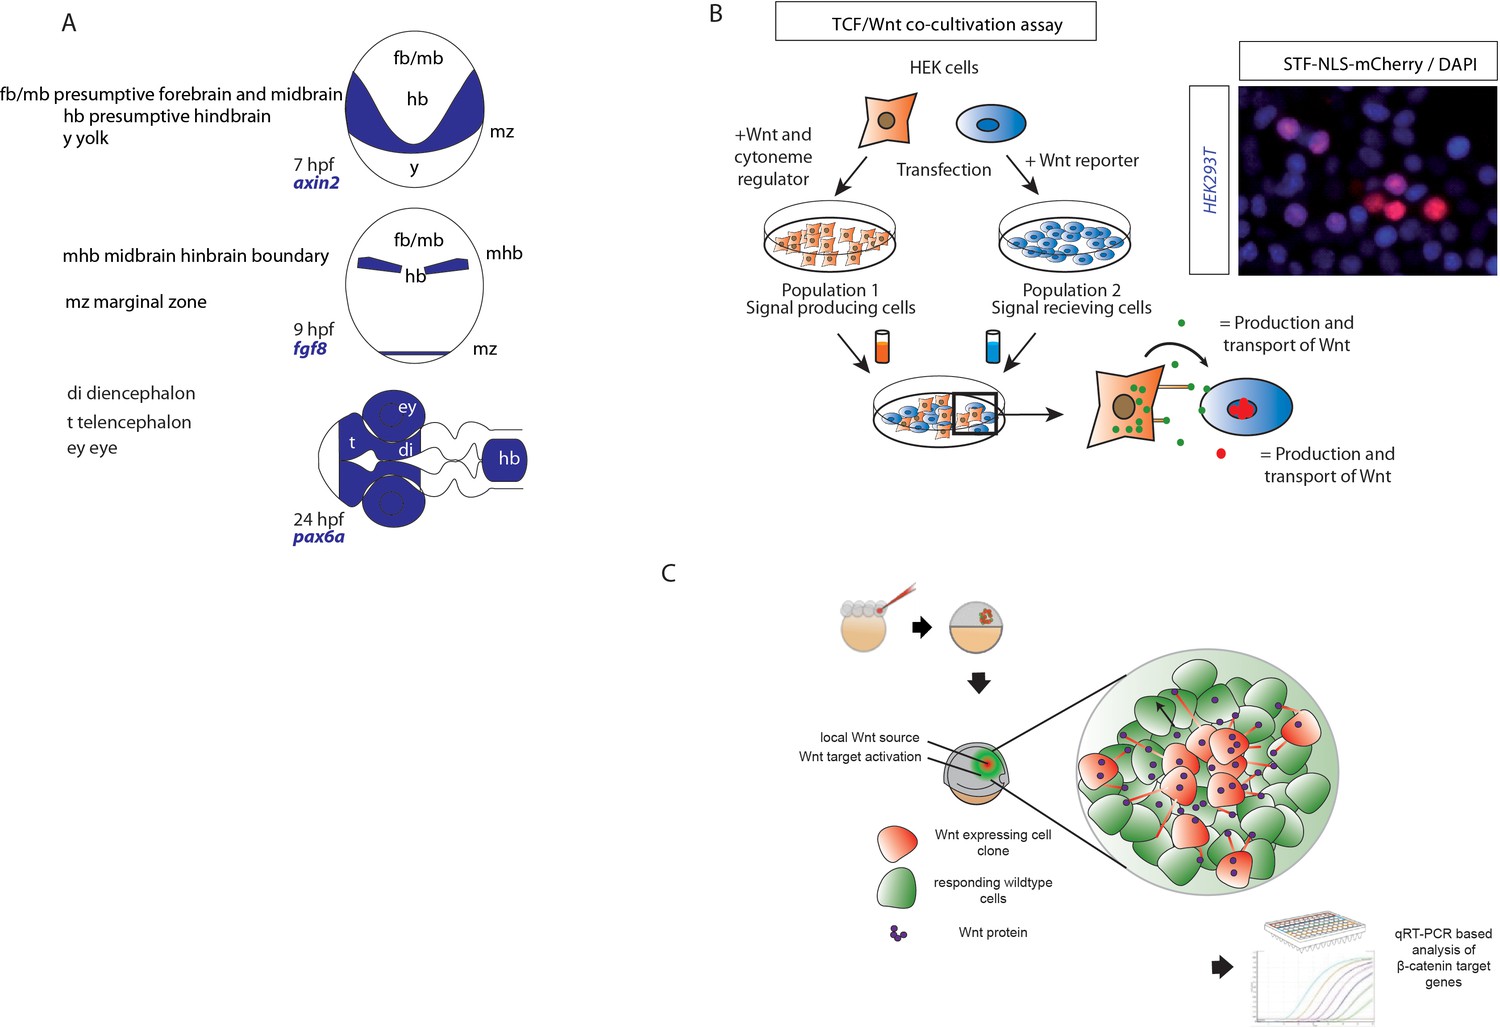
Methodolocical illustration for AP patterning and co-cultivation assay.
(A) Illustration of the expression domains of landmark genes, for example axin2, fgf8 or pax6a. (B) Illustration of the experimental procedure for in vitro co-cultivation assays with HEK293T cells expressing cytoneme regulators and the TCF/Wnt reporter 7xTRE SuperTOPFlash-NLS-mCherry. Fluorescence image shows some activated cells expressing nuclear mCherry. All cells were fixed and stained with DAPI. (C) Workflow of clonal injection to induce a local Wnt source with following RTqPCR analysis of target genes in responding cells.
Figure 7 with 1 supplement
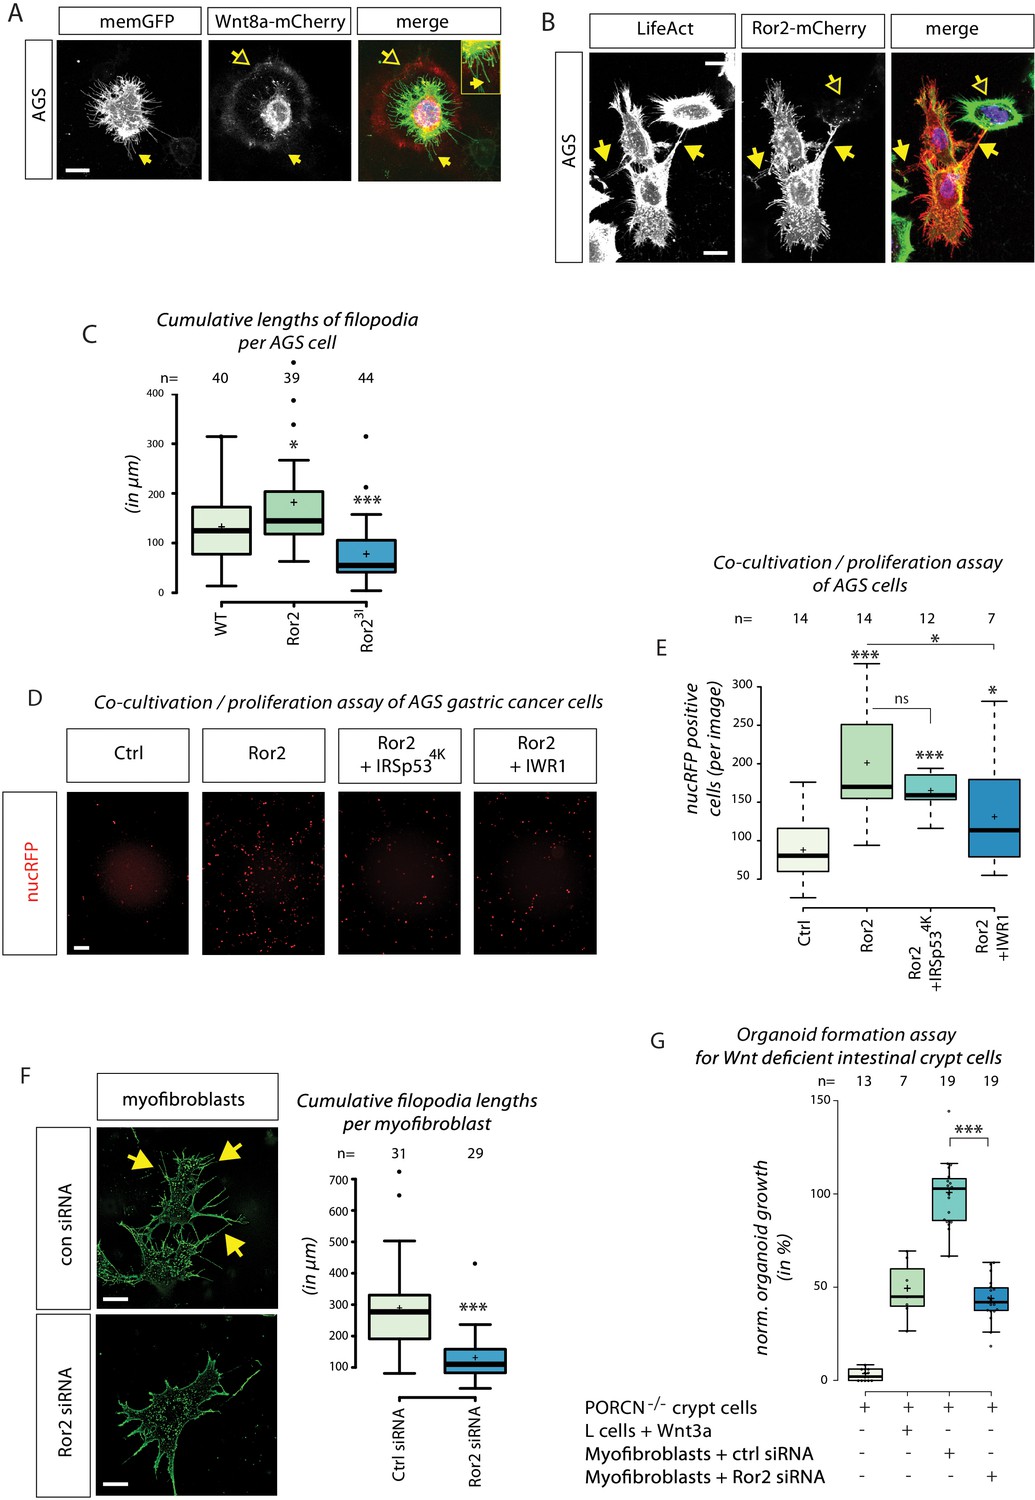
Importance of ror2-dependent cytonemes in gastric cancer cell proliferation and formation of intestinal crypt cell organoids.
(A) Confocal Z-projection of live AGS cells transfected with memGFP and Wnt8a-mCherry. Yellow arrows mark a cytoneme and yellow outlined arrows highlight circular Wnt8a-mCherry spots around the source cell. (B) Confocal Z-projection of fixed AGS cells transfected with Ror2-mCherry and stained with LifeAct. Yellow arrows mark filopodia connections to adjacent cells and yellow outlined arrows highlight Ror2-mCherry clusters in a non-transfected adjacent cell. (C) Boxplot of cumulative filopodia lengths for AGS cells transfected with an empty plasmid, Ror2 or Ror23I. (D, E) Proliferation assay of nucRFP transfected AGS cells after a 48 hr co-cultivation with cells transfected with indicated constructs. (D) Fluorescent images that were subjected for cell counting. (E) Average nucRFP cells per image. (F) Fluorescent images of purified intestinal myofibroblasts transfected with control siRNA (n=31) or Ror2 siRNA (n=29) were quantified for cumulative filopodia length per cell. (G) Boxplot of the number of formed organoids of PORCN-deficient intestinal crypt cells co-cultured with the indicated cell population for 3–4 days. Organoid numbers were normalized to crypt cells transfected with ctrl siRNA. *** P < 0.001, ** P < 0.01, * P < 0.05. One-way ANOVA confirmed significant differences between treatments with a 95% confidence interval of (C) p=3.6151*10−7, F value=16.8, df=122; (D) p=6.67274*10−5, F value=9.4, df=46; (F) p=3.32078 10−06, F value=26.5, df=59; and (G) p=1.42034*10−18, F value=106.9, df=41.
Figure 7—figure supplement 1
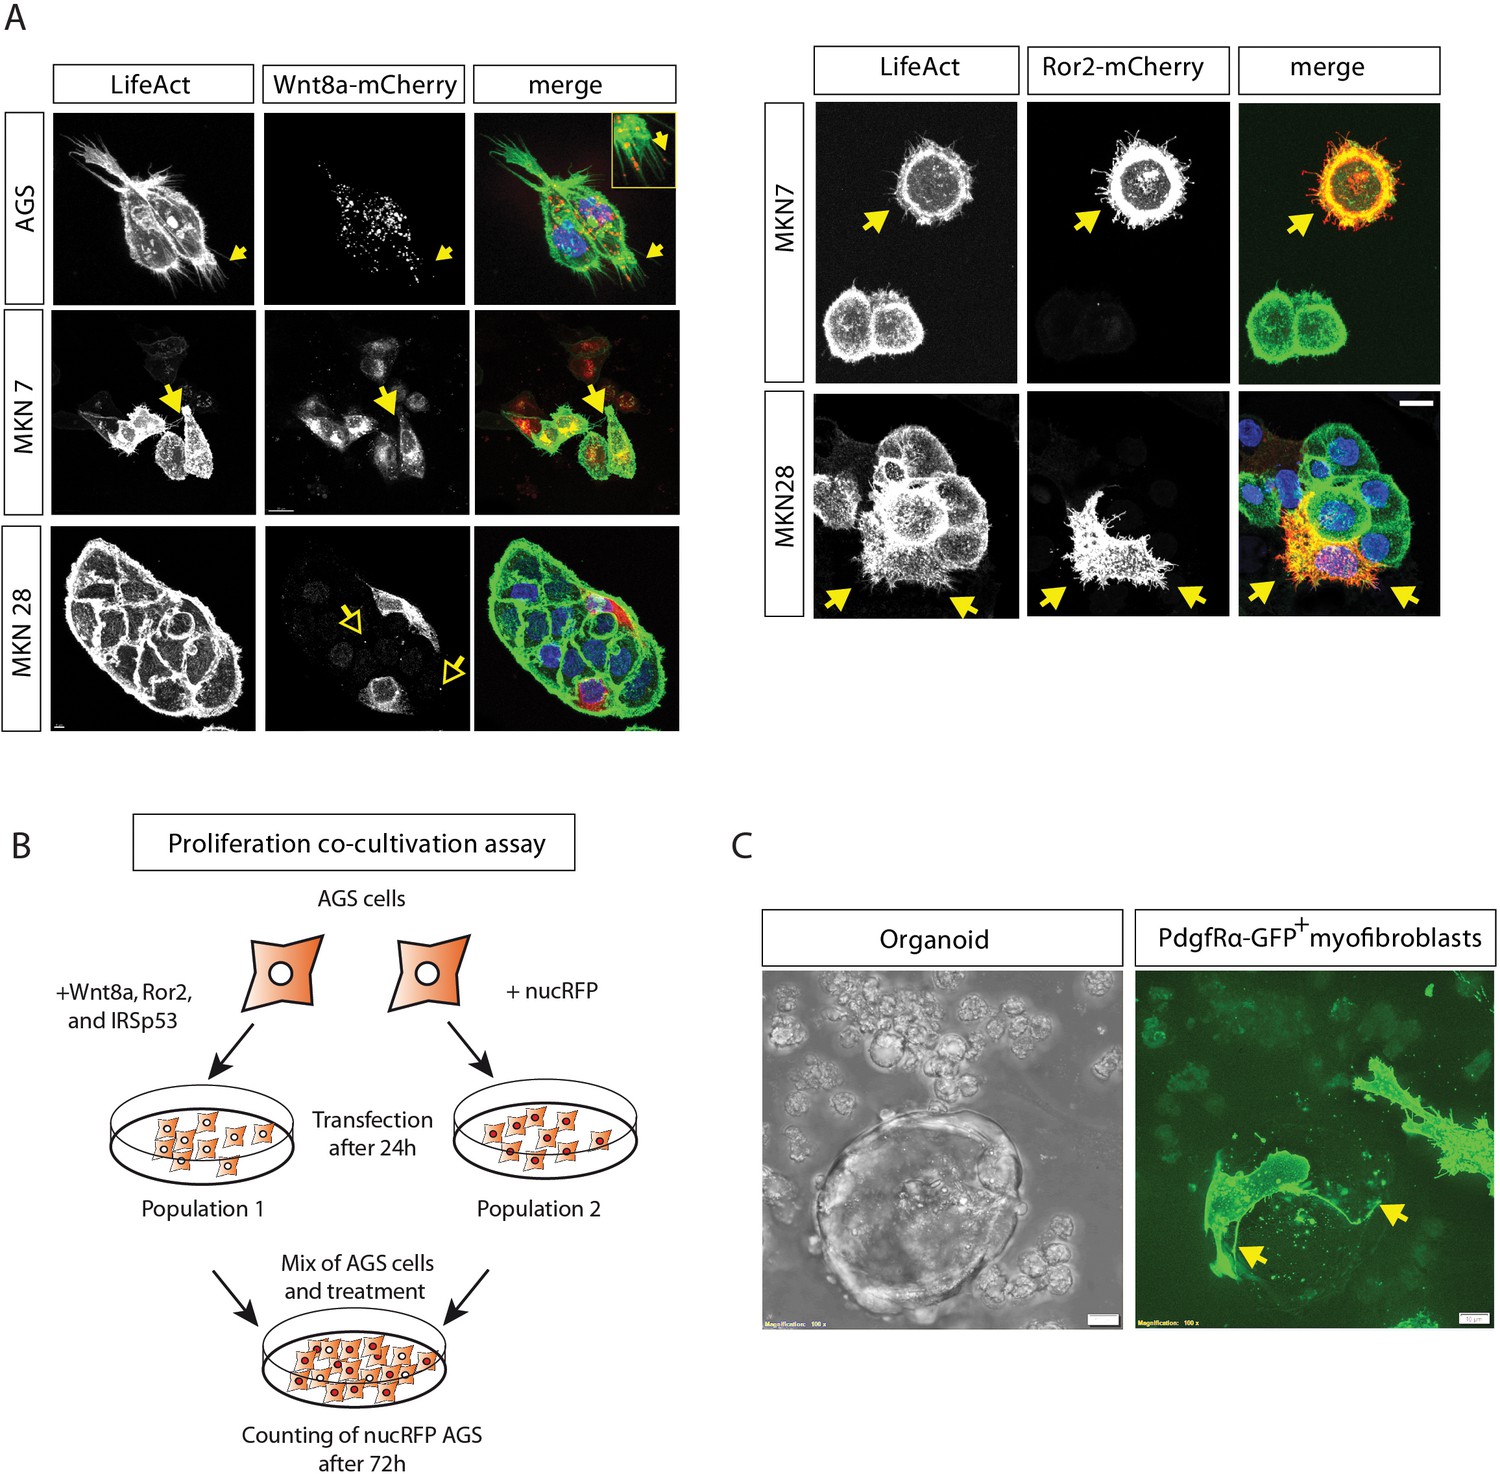
Gastric cancer cells and murine myofibroblasts use cytonemes to transport Wnt protein.
(A) Confocal images of gastric cancer cells AGS, MKN7 and MKN28. Cells were transfected with Wnt8a-mCherry (left) or Ror2mCherry (right), fixed and stained with LifeAct. Yellow arrows highlight Wnt8a-mCherry cytonemes or Ror2-induced protrusions, while yellow outlined arrows visualize the dissemination of Wnt8a-mCherry clusters to untransfected adjacent cells. (B) Illustration of the experimental procedure used in co-cultivation assays to determine the proliferation of a second cell population. (C) Mouse crypt organoid supported by purified intestinal myofibroblasts derived from a PdgfRα-Cre driven GFP reporter mouse. The image was taken 3 days after the co-culture of myofibroblasts with Porcn-deficient intestinal epithelial cells. Long cell protrusions surrounding the organoid are highlighted by yellow arrows.
Additional files
-
Transparent reporting form
- https://doi.org/10.7554/eLife.36953.020
Download links
A two-part list of links to download the article, or parts of the article, in various formats.
Downloads (link to download the article as PDF)
Open citations (links to open the citations from this article in various online reference manager services)
Cite this article (links to download the citations from this article in formats compatible with various reference manager tools)
Wnt/PCP controls spreading of Wnt/β-catenin signals by cytonemes in vertebrates
eLife 7:e36953.
https://doi.org/10.7554/eLife.36953


