Wnt/β-catenin regulates an ancient signaling network during zebrafish scale development
- University of Virginia, United States
Figures
Figure 1 with 2 supplements
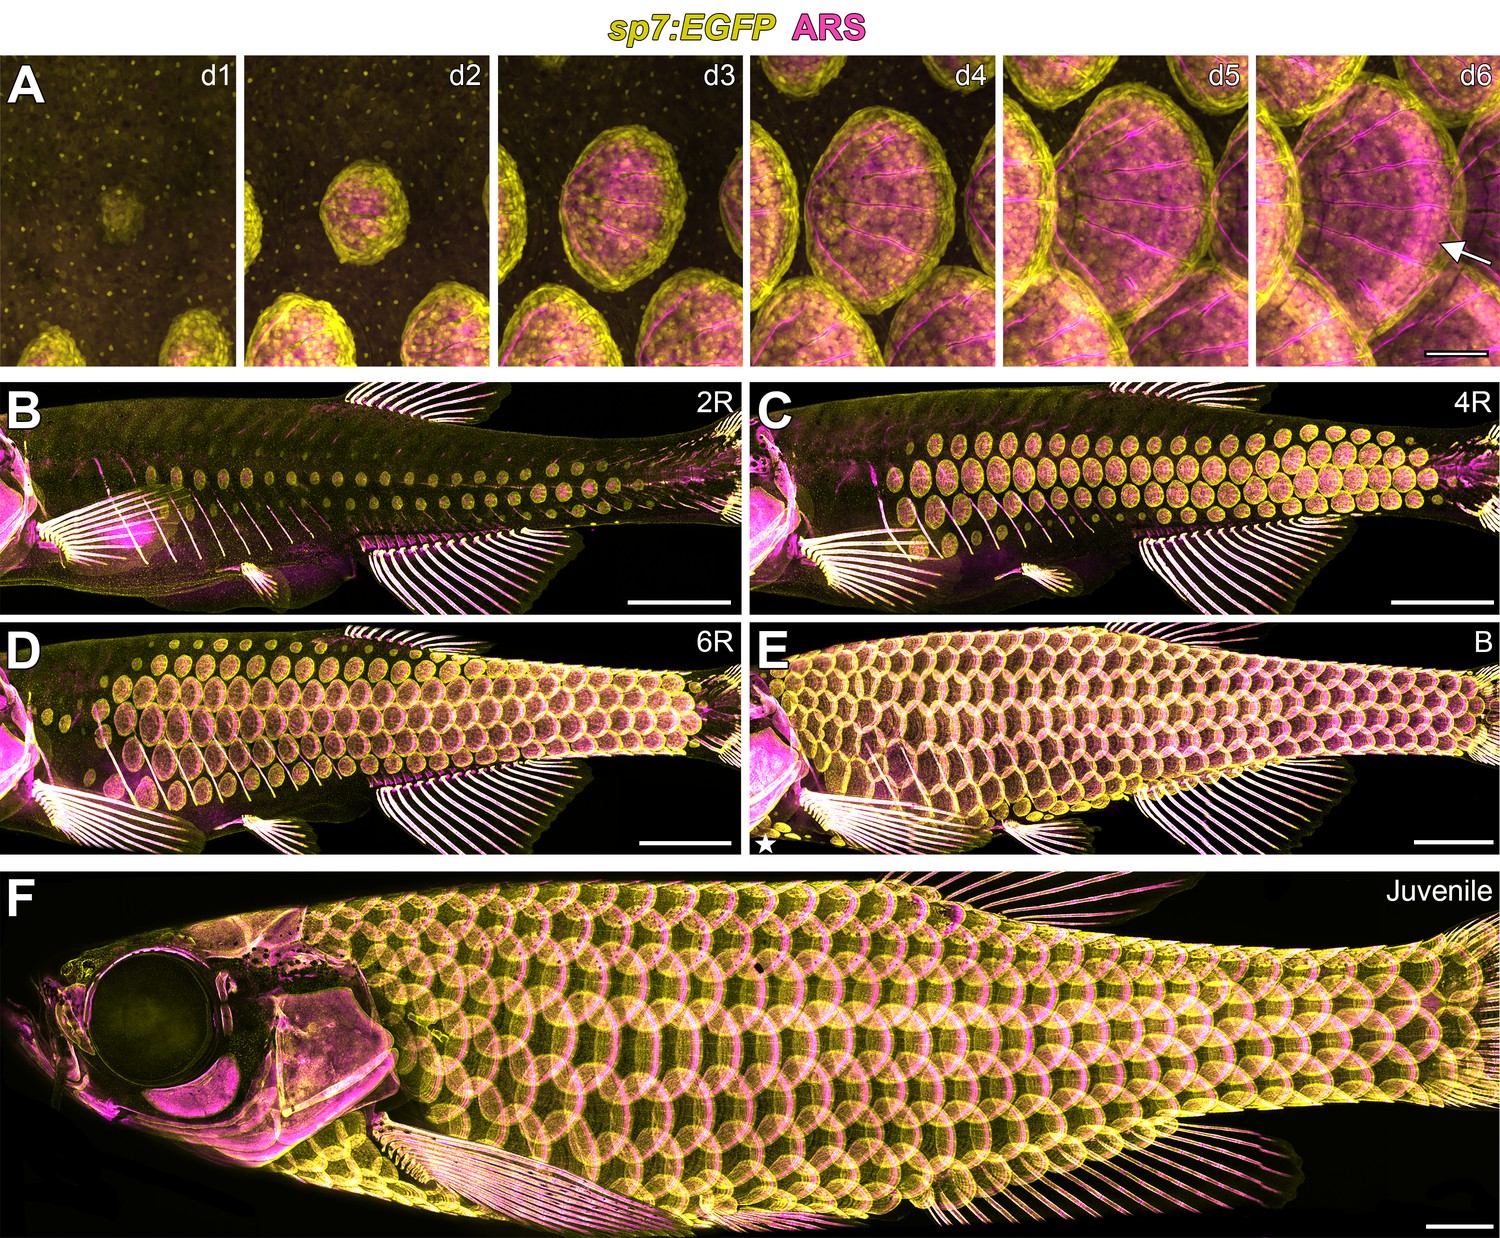
Zebrafish scale development.
All images from a single representative individual labelled with sp7:EGFP (yellow, to visualize osteoblast-like scale forming cells) incubated with Alizarin Red-S vital dye (ARS, magenta, to visualize calcified matrix). (A) Development of a single, representative scale. A small cluster of dSFCs (d1) polarizes and grows posteriorly (d2–d5) until it imbricates with its neighbors and forms an intensely calcified limiting layer (arrow in d6). (B–E) Scales are added sequentially across the skin of larval fish. (B) Initially, two rows of scales form near the horizontal myoseptum, defined here as the 2R (two row) stage. (C) Additional dorsal and ventral rows arise, defining the 4R (four row) stage. (D) Row addition continues while columns of scales appear anterior and posterior, leading to the 6R (six row) stage. (E) In the B (beard) stage, a cluster of scales arises ventral–posterior to the head (star) and spreads along the ventrum. (F) Final squamation pattern in a juvenile. Scale bars, 200 µm (A); 1 mm (B–F).
Figure 1—figure supplement 1
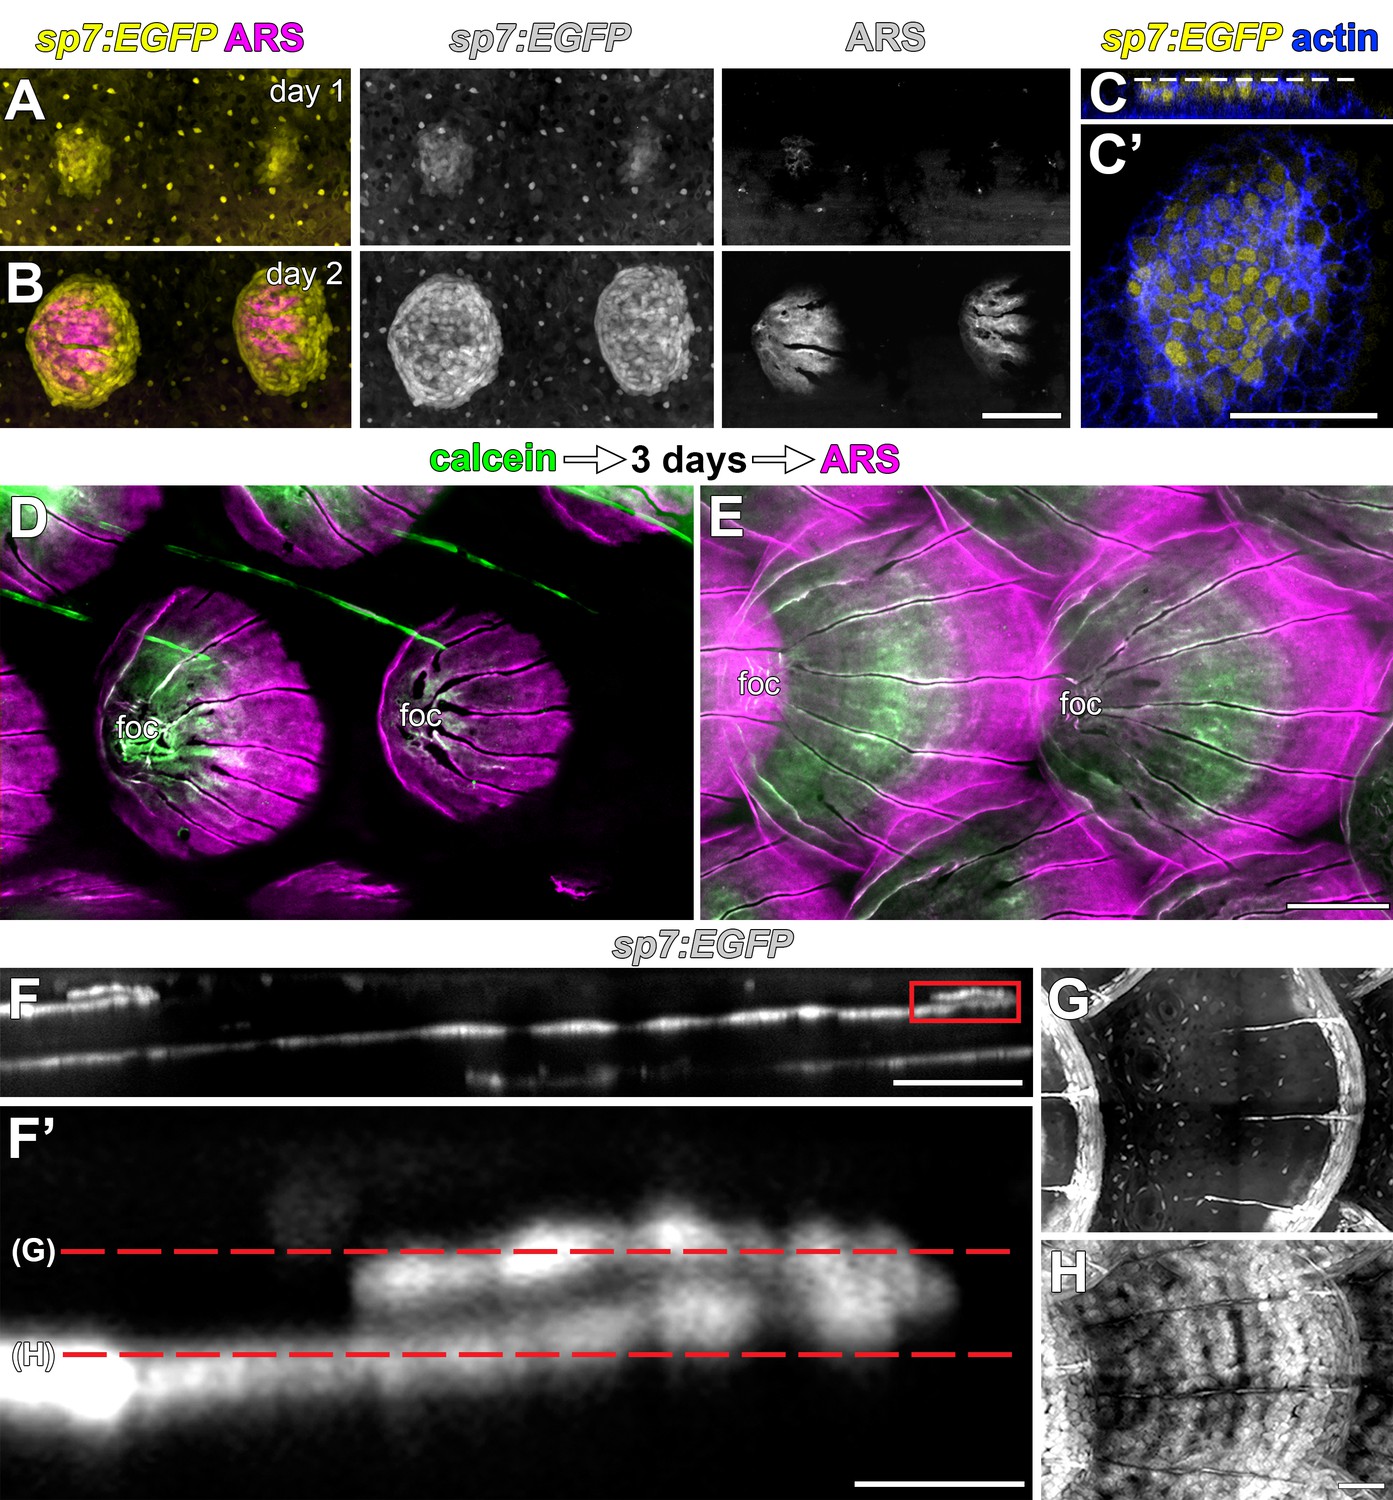
Scales are deposited by sp7:EGFP+ osteoblast like cells.
(A,B) Repeated live imaging of individual larvae revealed that calcified matrix, detected by Alizarin Red S (ARS) labeling (magenta) follows appearance of sp7:EGFP+ osteoblast like cells (yellow). (C,C’) Prior to initial ARS detection, sp7:EGFP+ scale forming cells were arranged in a bi-layered papilla. Phalloidin counter stain (blue) shows cell outlines. (D,E) Sequential labelling with calcein (green) and ARS (magenta) show that scales grow posteriorly from the initial center of calcification, which is retained as the scale-focus (foc). (D) Calcein labelling from initial scale formation. (E) Extending scales. (E–H) Osteoblast like cells are arranged in a monolayer along the deep aspect of the mature scale and loop around to cover the superficial aspect of growing posterior margin (boxed area in E). Scale bars, 100 µm (A, B, D, E); 50 µm (C, C’, F, G, H); 10 µm (F’).
Figure 1—figure supplement 2
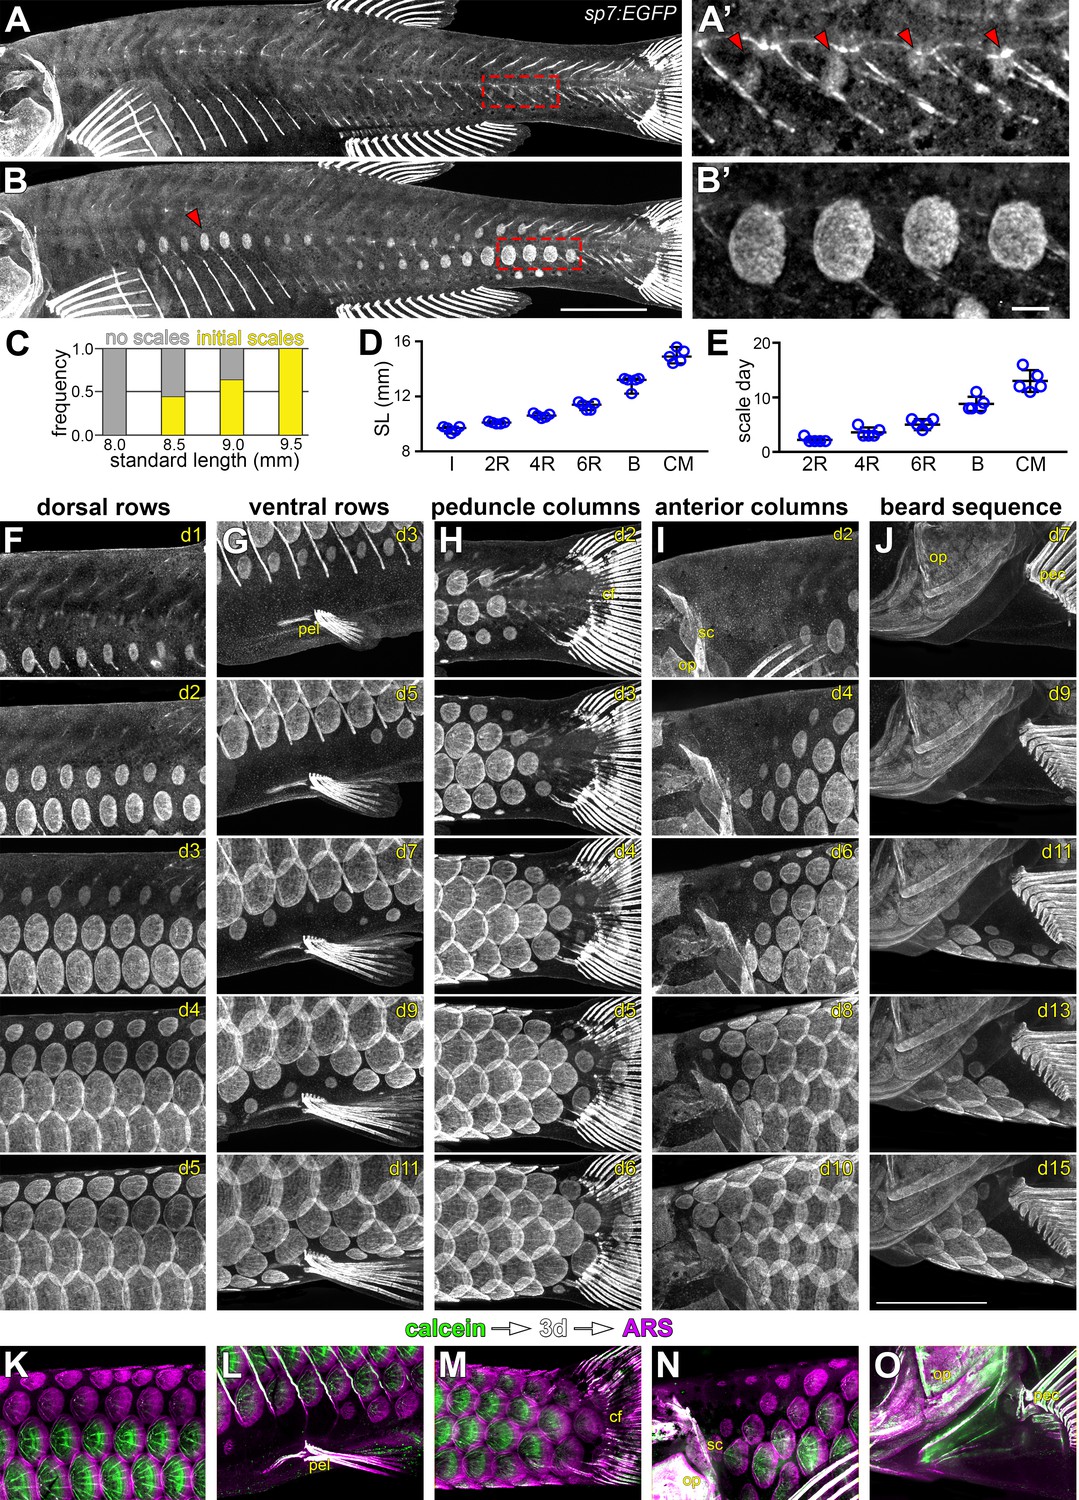
Squamation details revealed by repeated live imaging of individual fish.
(A,B) Squamation initiated from two foci, on the caudal peduncle (boxed in a), and on the flank above the ribs (red arrowhead in B). (A’,B’) Closer view of boxed areas in (a) and (b). (C) Squamation initiated in larvae between 8.5 mm and 9.5 mm standard length (SL; n = 131). (D,E) Squamation was completed over 13 ± 2 days during a period of rapid somatic growth. Measurements shown are from five representative individuals housed individually, fed ad libitum and imaged daily throughout squamation. (F,G) Addition of scale rows and columns in a single representative individual. (K–O) Sequential calcein, ARS labelling confirms squamation sequence revealed by daily live imaging. pel = pelvic fin; cf = caudal fin; op = opercle; so = superopercule bone; pec = pectoral fin. Scale bars, 1 mm (A, B, F–O); 100 µm (A’, B’).
Figure 2 with 1 supplement
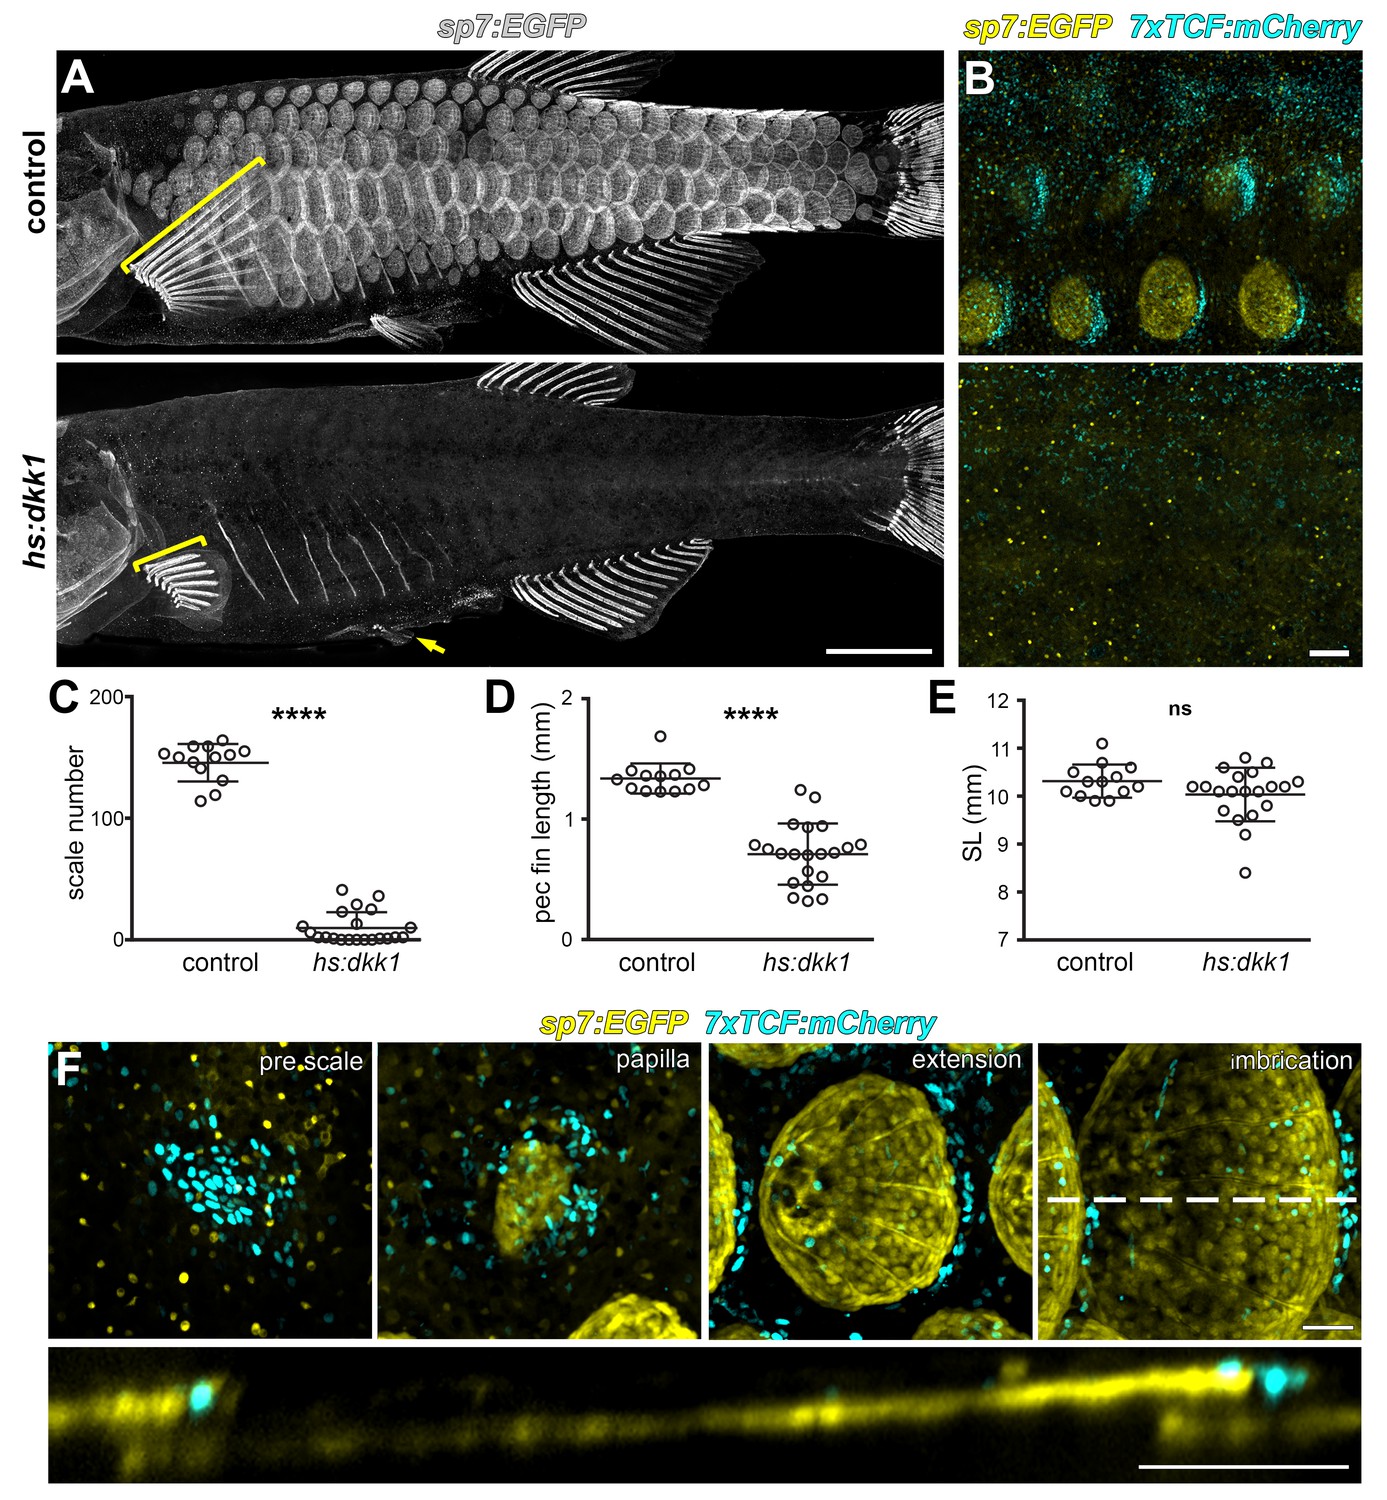
Wnt/β-catenin signaling is necessary for scale development.
(A) Wnt repression by heat-shock induction of hs:dkk1 transgene blocked scale formation, arrested fin outgrowth (yellow brackets) and prevented pelvic fin ray development (yellow arrow). (B) hs:dkk1 induction abrogated patterned expression of the Wnt/β-catenin reporter transgene 7x:TCF:mCherry (cyan). (C) hs:dkk1 larvae developed significantly fewer scales (n = 21) then heat-shocked controls (n = 13; p<0.0001). (D) Pectoral fins were significantly shorter in hs:dkk1 larvae (n = 21) than in heat-shocked controls (n = 13; p<0.0001). (E) hs:dkk1 larvae achieved a similar standard length (n = 21) to heat-shocked controls (n = 13; p=0.1). Plots indicate means ± SD. (F) Live image series of Wnt/β-catenin activity revealed by expression of 7xTCF:mCherry reporter transgene (cyan). Wnt/β-catenin reporter expression was first detected in a patch of epidermal cells in prospective scale regions (pre scale). Subsequently, sp7:EGFP+ dSFCs appeared underneath the 7xTCF:mCherry expressing cells (papilla). During later scale extension and imbrication, 7xTCF:mCherry expression persisted at the posterior margin in cells superficial and posterior to the scale forming cells. Scale bars, 1 mm (A); 100 µm (B,F).
Figure 2—figure supplement 1
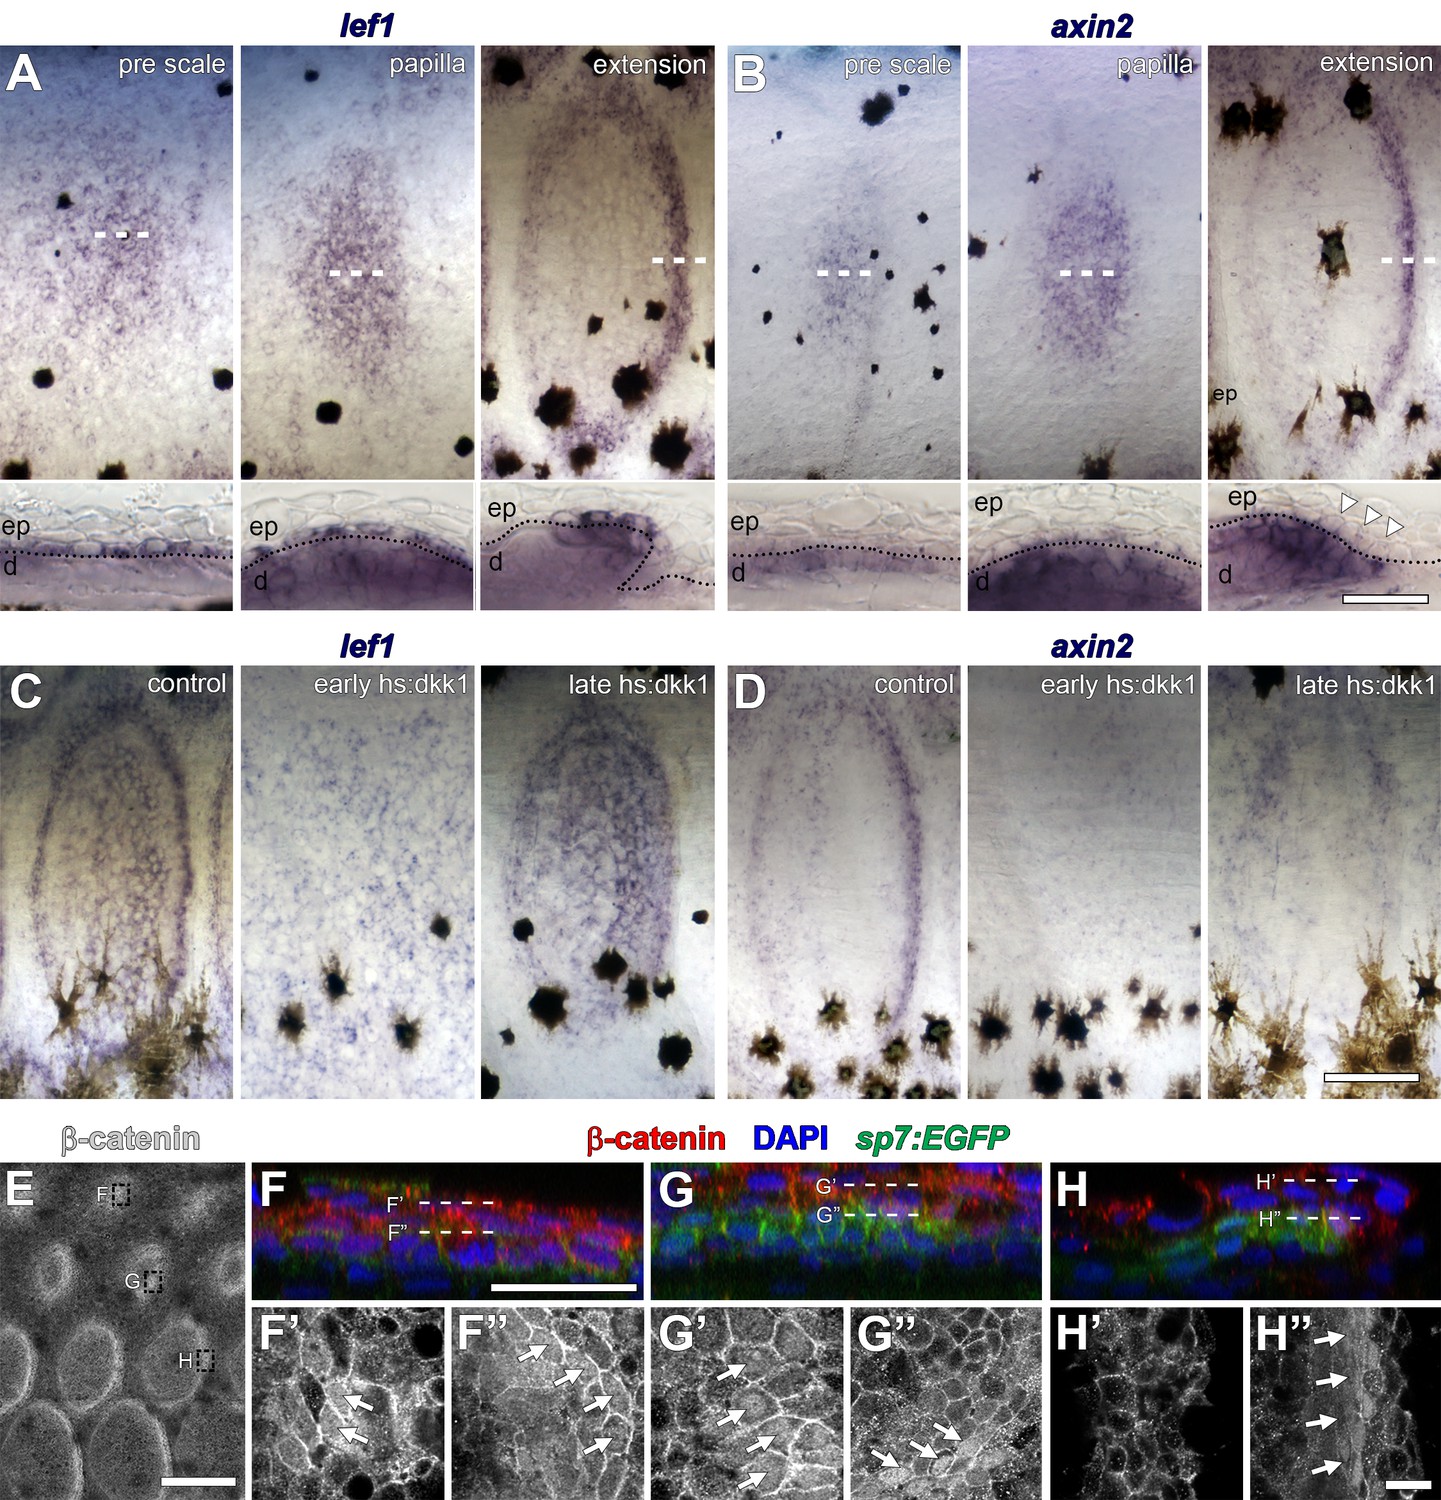
Distribution of Wnt/β-catenin signaling targets in developing scales.
(A) lef1 was initially broadly expressed in cuboidal, basal epidermal cells prior to overt scale morphogenesis (pre scale; n = 6). Subsequently, expression spread to dermal cells of the scale papilla (papilla; n = 6) before becoming restricted to epidermal and dermal cells at the posterior margin (extension; n = 6). Dotted lines in lower panels indicate epidermal–dermal boundary. (B) axin2 was expressed in the dermis prior to scale formation (pre scale; n = 6). Expression persisted throughout the dermal papilla and weak expression was detected in epidermal cells (papilla; n = 6). axin2 expression ultimately became restricted to dermal cells at the posterior margin (extension) and was absent in overlying epidermal cells (arrowheads; n = 6). (C) Induction of hs:dkk1 prior to initial squamation (early hs:dkk1) prevented patterned expression of lef1 (n = 8). hs:dkk1 induction did not affect lef1 expression in scales that had formed prior to induction (late hs:dkk1; n = 8). (D) axin2 expression was abolished from skin when hs:dkk1 was induced prior to squamation (early hs:dkk1; n = 8) and from scales that had already formed prior to induction (late hs:dkk1; n = 8). (E) Whole-mount antibody staining revealed intense accumulation of β-catenin protein in early (sp7:EGFP negative) pre-scale regions (top box); polarized sp7:EGFP+ scale papillae (mid box) and extending scales (bottom box). (F) In pre scale regions, nuclear β-catenin (red) was detected in superficial epidermis (F’) as well as deep dermis (F’’) (arrows). (G) In sp7:EGFP+ (green) scale papilla, nuclear β-catenin was present in epidermis (G’) and in dermal sp7:EGFP+ scale forming cells (G’’, arrows). (H) In extending scales, nuclear β-catenin was not detected in epidermis (H’) but only in one to two rows of sp7:EGFP+ dermal scale forming cells at the posterior margin (H’, arrows). Scale bars, 250 µm (A–D, surface view); 50 µm (A–D, sections); 250 µm (E); 25 µm (F–H); 10 µm (F’–H’, F’–H’).
Figure 3 with 2 supplements
Wnt/β-catenin and Eda signaling interact during scale development.
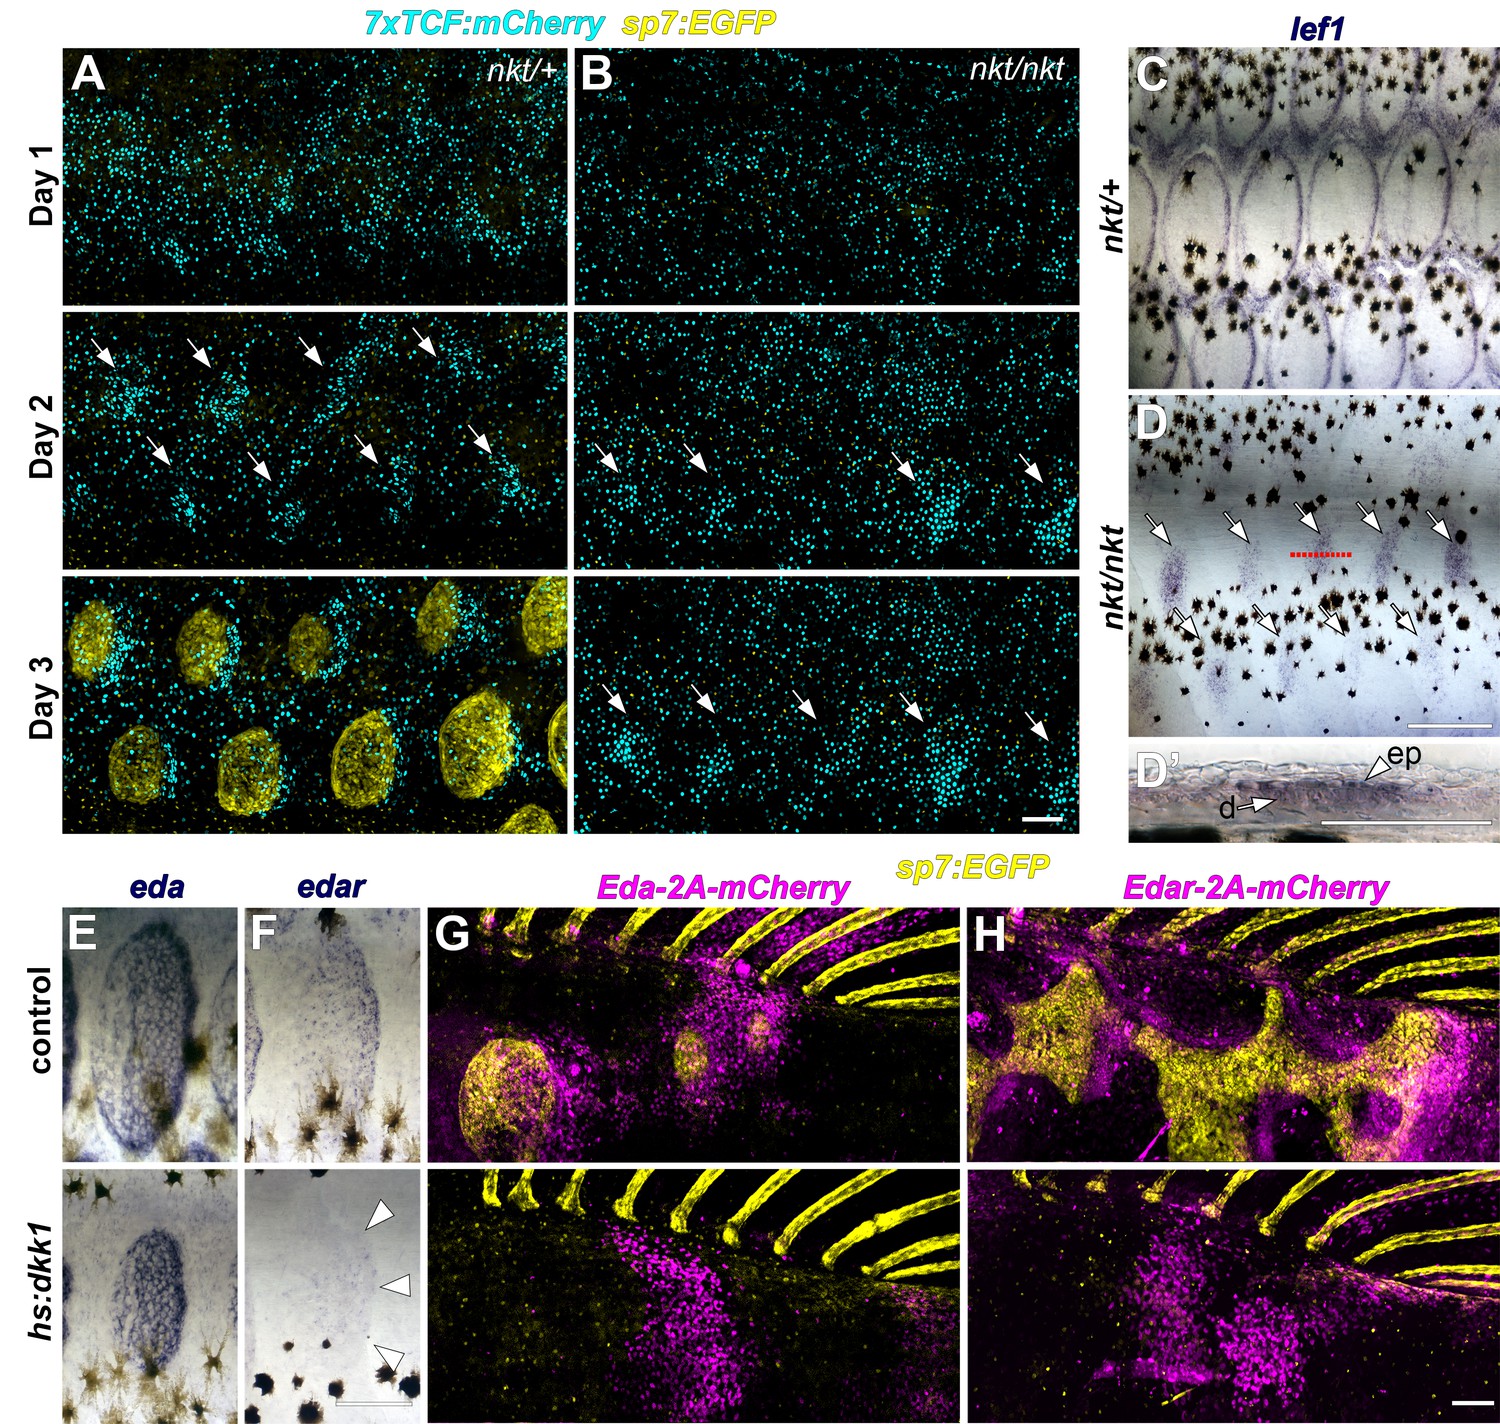
(A) In WT (nkt/+) larvae, Wnt/β-catenin activity revealed by expression of 7x:TCF:mCherry (cyan), was patterned into a series of half-offset spots (arrows) prior to appearance of sp7:EGFP+ dSFCs (yellow, n = 6). (B) In Eda mutant (nkt/nkt) larvae, 7x:TCF:mCherry expression was patterned into spots (arrows), although no dSFCs developed (n = 6). (C) WT (nkt/+) fish fixed at 10.0–10.5 mm had multiple rows of lef1+ scales (n = 6). (D,D’) Scale-less Eda mutant (nkt/nkt) larvae of similar size had patterned expression of lef1 (arrows) in basal epidermal (ep) and dermal (d) cells (n = 4 of 6). (E) hs:dkk1 had no effect on eda expression in scales that developed prior to induction. (F) hs:dkk1 attenuated edar expression in scales (arrowheads indicate position of scale margin). (G,H) Expression of ectopic Eda and Edar (both magenta) caused ectopic scale formation in heat-shocked controls (top: Eda, n = 10; Edar, n = 20) but not hs:dkk1 larvae (bottom: Eda, n = 16; Edar n = 18). Scale bars, 100 µm (A, E–H); 50 µm (C, D, D’).
Figure 3—figure supplement 1
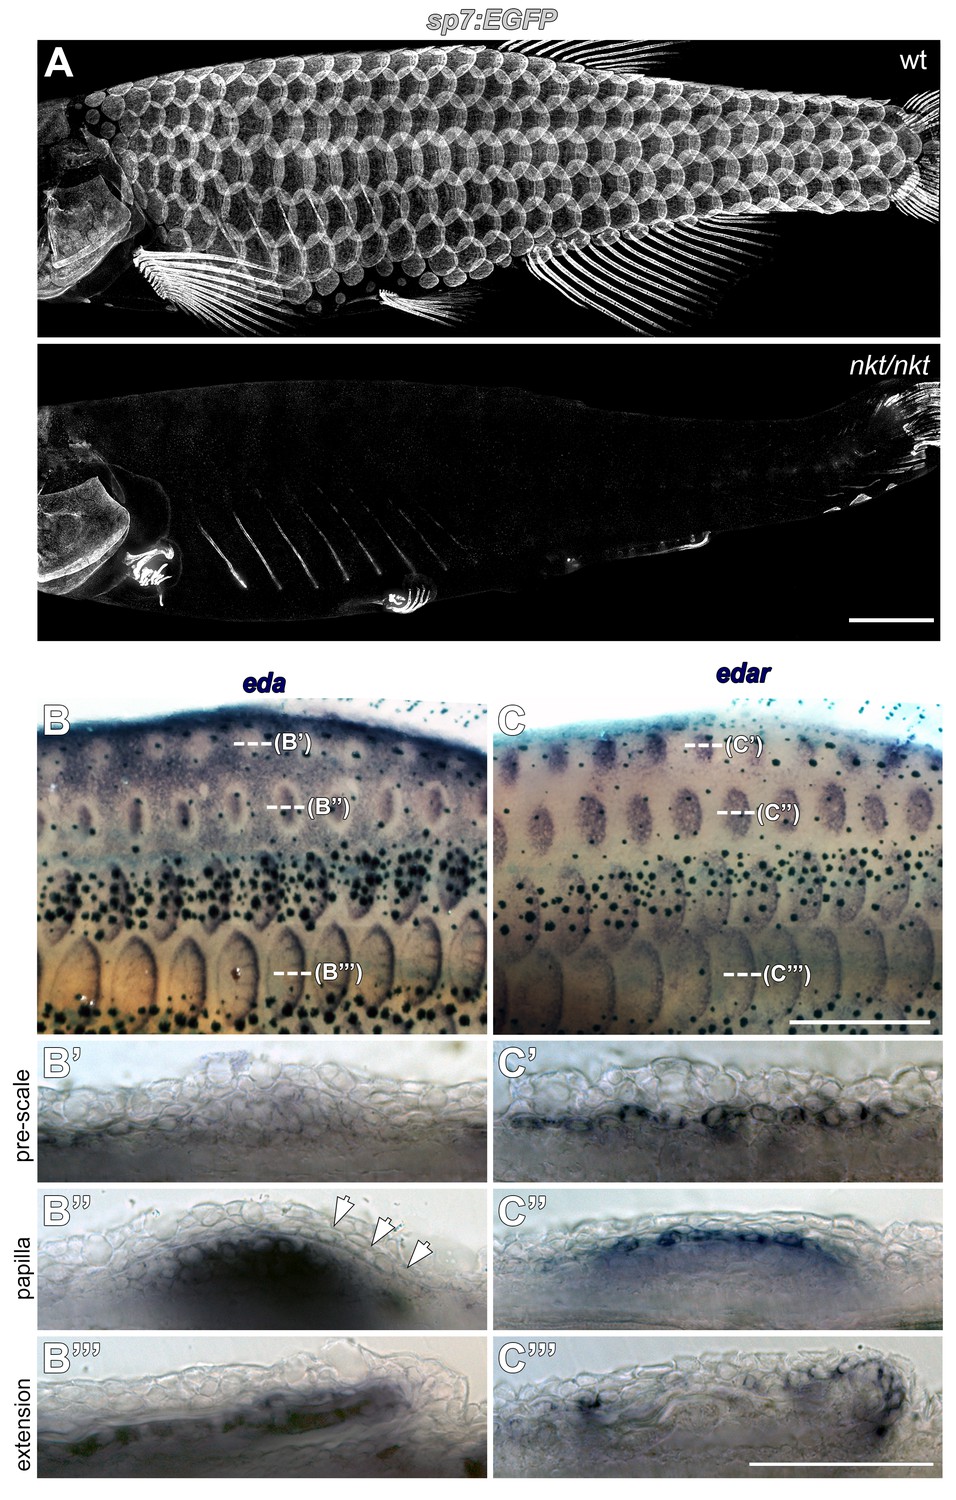
Eda signaling during zebrafish scale development.
(A) Eda mutant (nkt/nkt) larvae lacked scales and had profound fin growth defects (n = 6). (B) eda is downregulated in epidermis overlying nascent scale papillae (b’ pre scale, arrow). Subsequently, eda is strongly expressed in dermal scale forming cells where it persists throughout scale development (B’’ papilla; B’’’ extension). n = 6. (C) edar expression was complementary to eda. In (C’ pre scale) skin, edar expression appears in epidermis in the region where eda is downregulated. edar expression remains epidermal (c’’ papilla) before shifting to the epidermal posterior margin (C’’’ extension). n = 6. Scale bars, 1 mm (A); 100 µm (B–D); 50 µm (E,F).
Figure 3—figure supplement 2

Only epidermis is competent to respond to Eda signaling.
Scale forming cells labeled with sp7:EGFP (yellow). (A) Superficially located epidermal clones that misexpress Eda (magenta) were associated with ectopic scales (n = 10). (B) Deeper clones of Eda-misexpressing cells were associated with myotomes, co-expressed sp7:EGFP, or both, and were likely dermal. Such clones also triggered ectopic scale formation (n = 7). (C) Superficially located epidermal clones that expressed Edar (magenta) were associated with ectopic scale formation (n = 20). (D) Deeper, myotome-associated Edar-misexpressing clones did not trigger scale formation (n = 8). Scale bar, 100 µm.
Figure 4 with 1 supplement

An Fgf–Wnt/β-catenin signaling interaction is necessary for differentiation of scale forming cells.
(A,B) Imaging sp7:EGFP over a five day treatment with 1 µM BGJ398 to inhibit Fgf receptors revealed completely arrested squamation (n = 8), whereas DMSO-treated control fish developed normally (n = 8). (A’,B’) BGJ398 treatment also arrested growth of individual scales. (C) hag/+ mutants overexpress Fgf8a and had disorganized differentiation of sp7:EGFP+ dSFCs (n = 6). (D) dSFCs did not appear in hag/+ mutant skin with hs:dkk1 induction (n = 12). (E) Loss of Eda signaling in nkt/nkt mutants did not prevent differentiation of sp7:EGFP+ scale forming cells, likely owing to residual Wnt activity in the skin (n = 12). Scale bars, 1 mm (A–E); 100 µm (A’, B’).
Figure 4—figure supplement 1
Fgfr signaling blockade, expression and persistence after Wnt/β-catenin signaling inhibition.
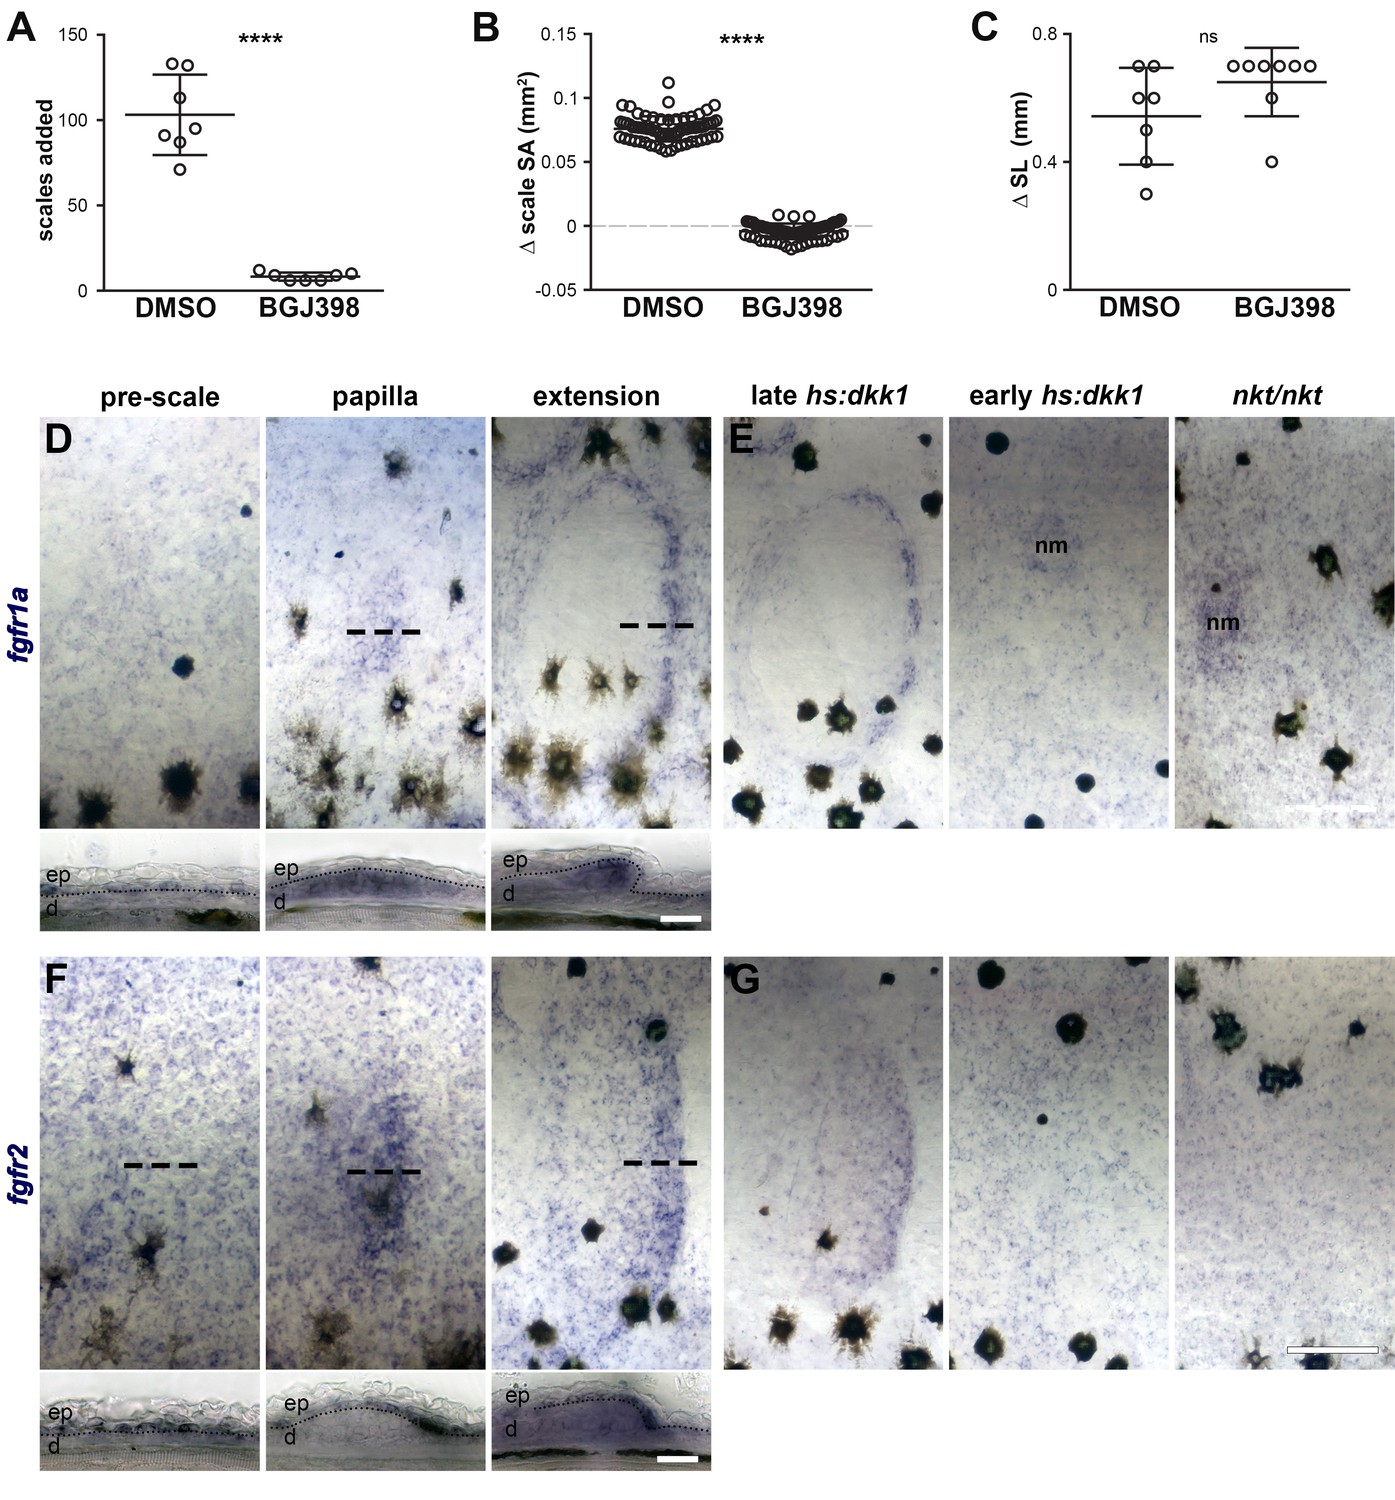
(A) Scales added over the course of a five day treatment with 0.1% DMSO or 1 µM BGJ398. DMSO-treated fish added more scales then BGJ398-treated fish (p=0.0001). (B) Scale surface area increased more in DMSO-treated controls than BGJ398-treated fish (p<0.0001). (C) Standard length increased similarly in DMSO treated fish and BGJ398-treated fish (p=0.15); n = 8 for all measurements. Plots indicate means ± SD. (D) fgfr1a was expressed broadly in epidermis prior to scale formation (pre-scale). Expression shifted to scale forming cells in the dermal papilla (papilla), and was maintained in scale forming cells at the posterior margin (extension). (E) Wnt repression following scale formation did not affect fgfr1a expression (late hs:dkk1), however, repression prior to scale formation prevented localized expression (early hs:dkk1). Eda mutants (nkt/nkt) did not show patterned fgfr1a expression. Expression was maintained in neuromasts (nm) of early hs:dkk1 and nkt/nkt. (F) fgfr2 was also detected broadly in the epidermis prior to scale formation (pre-scale), before become restricted to the epidermal posterior margin (papilla), where it was maintained throughout scale development (extension). (G) Similar to fgfr1a, fgfr2 expression was not affected by Wnt repression after scale formation (late hs:dkk1), although patterned expression was blocked by Wnt repression prior to scale formation (early hs:dkk1) and also by loss of Eda (nkt/nkt). n = 6 for all in situ hybridizations. ep = epidermis; d = dermis. Scale bars, 250 µm (D,F upper); (50 µm, D,F lower).
Figure 5 with 1 supplement
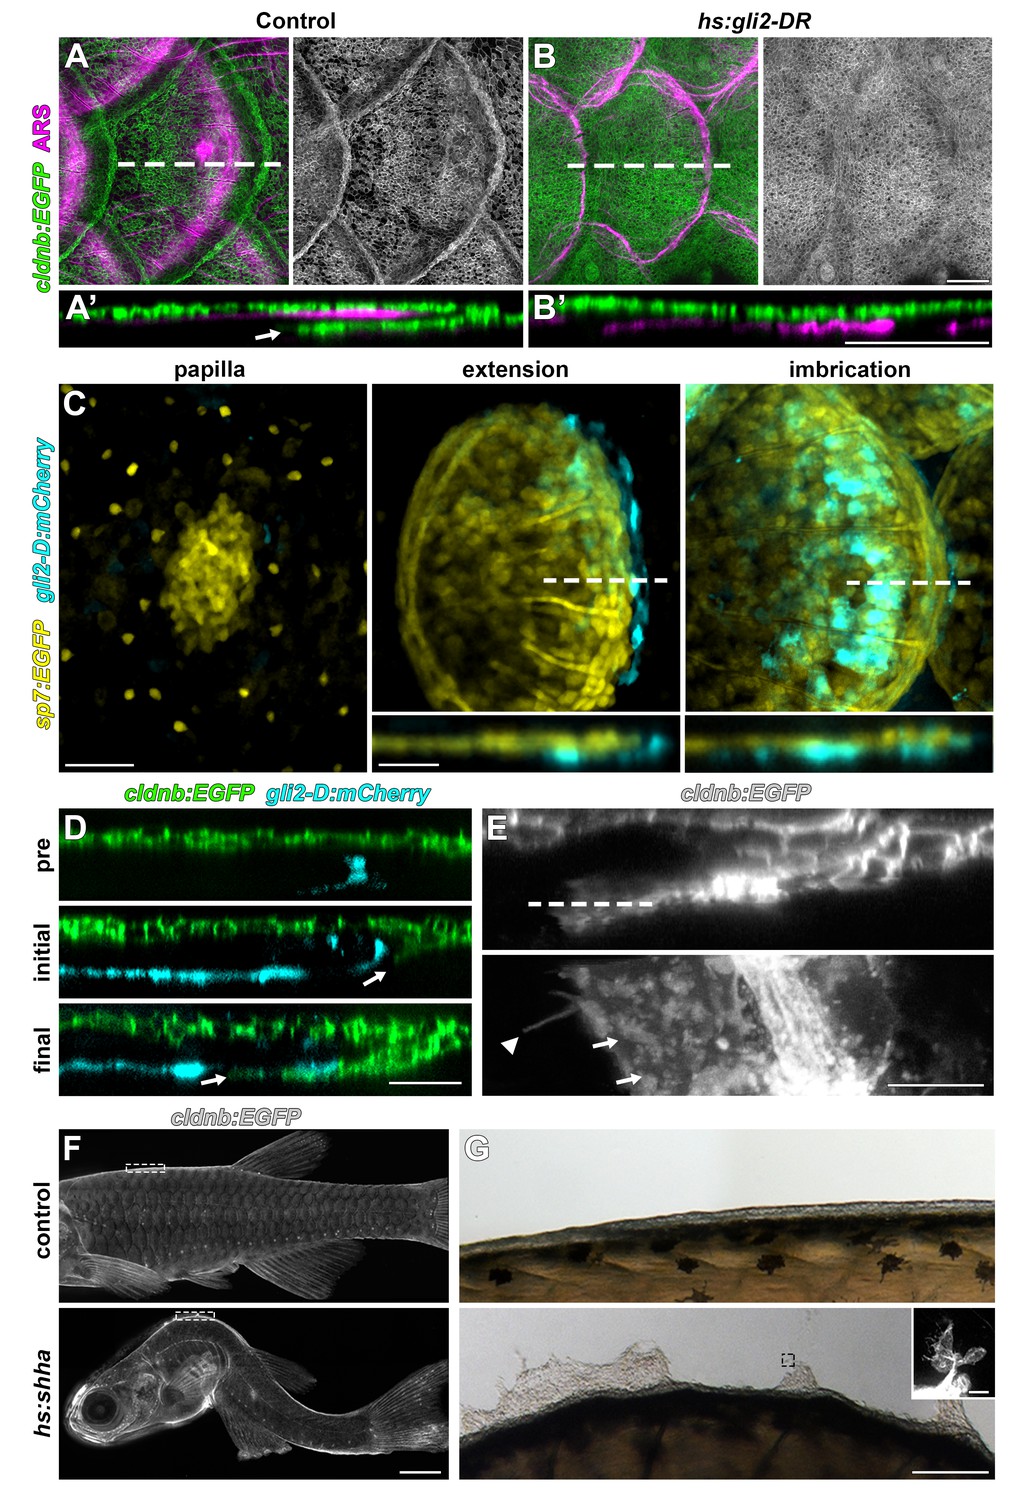
HH signaling is necessary for epidermal morphogenesis.
(A) In heat-shocked control fish the epidermis (labeled by cldnb:EGFP, green) was folded around the posterior margin of individual scales (marked by ARS, magenta). (A’) orthogonal projection, arrow indicates leading edge of epidermis; n = 8. (B) Heatshock induction of a dominant repressor Gli2 (hs:gli2-DR), completely blocked epidermal folding. (B’) Orthogonal view; n = 12. (C) HH-responding cells (cyan) were very few at early stages of scale development (papilla) labelled by sp7:EGFP (yellow). HH-responding cells were found posterior and deep to the extending scale (extension) and persisted throughout later scale growth (imbrication); n = 8. (D) HH-responding cells (cyan) appeared prior to epidermal invagination (pre). Initial invagination (arrow), followed the contour of the HH responding population (initial). Epidermal invagination continued in close association with HH responding cells (final); n = 8. (E) High resolution imaging of the leading row of invaginating epidermal cells revealed hallmarks of cell migration including membrane ruffles (arrows) and long cellular extensions (arrow head); n = 10. (F) Shha overexpression by heatshock induction of hs:shha lead to severe kyphosis; n = 48. (G) cldnb:EGFP+ epidermis in hs:shha larvae migrated from the animal onto the glass coverslip during image acquisition; n = 6. Scale bars, 100 µm (A,B); 50 µm (C); 25 µm (D); 10 µm (E); 1 mm (F); 100 µm (G); 20 µm (G, inset).
Figure 5—figure supplement 1

HH signaling during scale development.
(A) Epidermis (cldnb:EGFP, green) was folded around the bony scale plates (ARS, magenta) in larvae treated with 1% EtOH throughout squamation; n = 8. 40 µM cyclopamine treatment completely blocked epidermal folding, even when scale plates overlapped (arrow); n = 8. (B,C) Heatshock induction of dominant repressor Gli2 (hs:gli2-DR) strongly attenuated expression of the HH reporter transgene (gli2-D:mCherry; b) and the conserved HH target gene hhip (arrowheads in C). (D) shha expression was only detectable in the epidermis following formation of the scale papilla (papilla). Expression persisted in two to three rows of cells at the epidermal posterior margin in growing scales (extension). (E) The HH target gene, hhip, also initiated expression following papilla appearance (papilla) and persisted in a population of cells deep to the dermal scale forming cells (SFC). (F,G) shha and hhip expression was not detected in scales (arrowheads) following induction of hs:dkk1 (n = 8). Eda mutants (nkt/nkt) also lacked shha and hhip expression (n = 6). (H) hs:dkk1 induction attenuated expression of the HH reporter gli2-D:mCherry; n = 6. Scale bars, 100 µm (A, B, C, F, G); 50 µm (D, E, H).
Figure 6

Wnt/β-catenin and HH signaling are necessary for normal scale regeneration.
(A) Adult scales labelled with sp7:EGFP (yellow), were removed from the caudal peduncle (0 d post-pluck). One day following surgery (1 d post-pluck) patterned Wnt/β-catenin signaling activity was detected, as revealed by 7xTCF:mCherry (cyan, arrowheads). After two days (2 d post-pluck), all removed scales had started to regenerate; n = 8. (B) Scale regeneration occurred normally in heat-shocked controls (n = 7), whereas hs:dkk1 induction delayed scale regeneration (n = 10). Asterisks (*) mark ontogenic scales not plucked. (C) Heat-shocked controls regenerated a significantly higher proportion of scales two days after scale removal (2dpp) then hs:dkk1 fish (p=0.0004). Three days after scale removal (three dpp), all heat-shocked controls had regenerated their full complement of scales whereas hs:dkk1 fish regenerated significantly fewer scales (p=0.0007). (D) Regenerating scales grew more quickly in heat-shocked controls than in hs:dkk1 fish (p=0.003). Plots indicate means ± SD. (E) In heat-shocked controls, epidermis (cldnb:EGFP, green) folded around regenerated scale plates (ARS; magenta) within ten days of scale removal (n = 6), whereas HH repression (hs:gli2-DR) prevented epidermal folding (n = 8). Asterisks (*) mark ontogenic scales not plucked. Scale bars, 500 µm (A, B, E); 100 µm (E, orthogonal views).
Figure 7
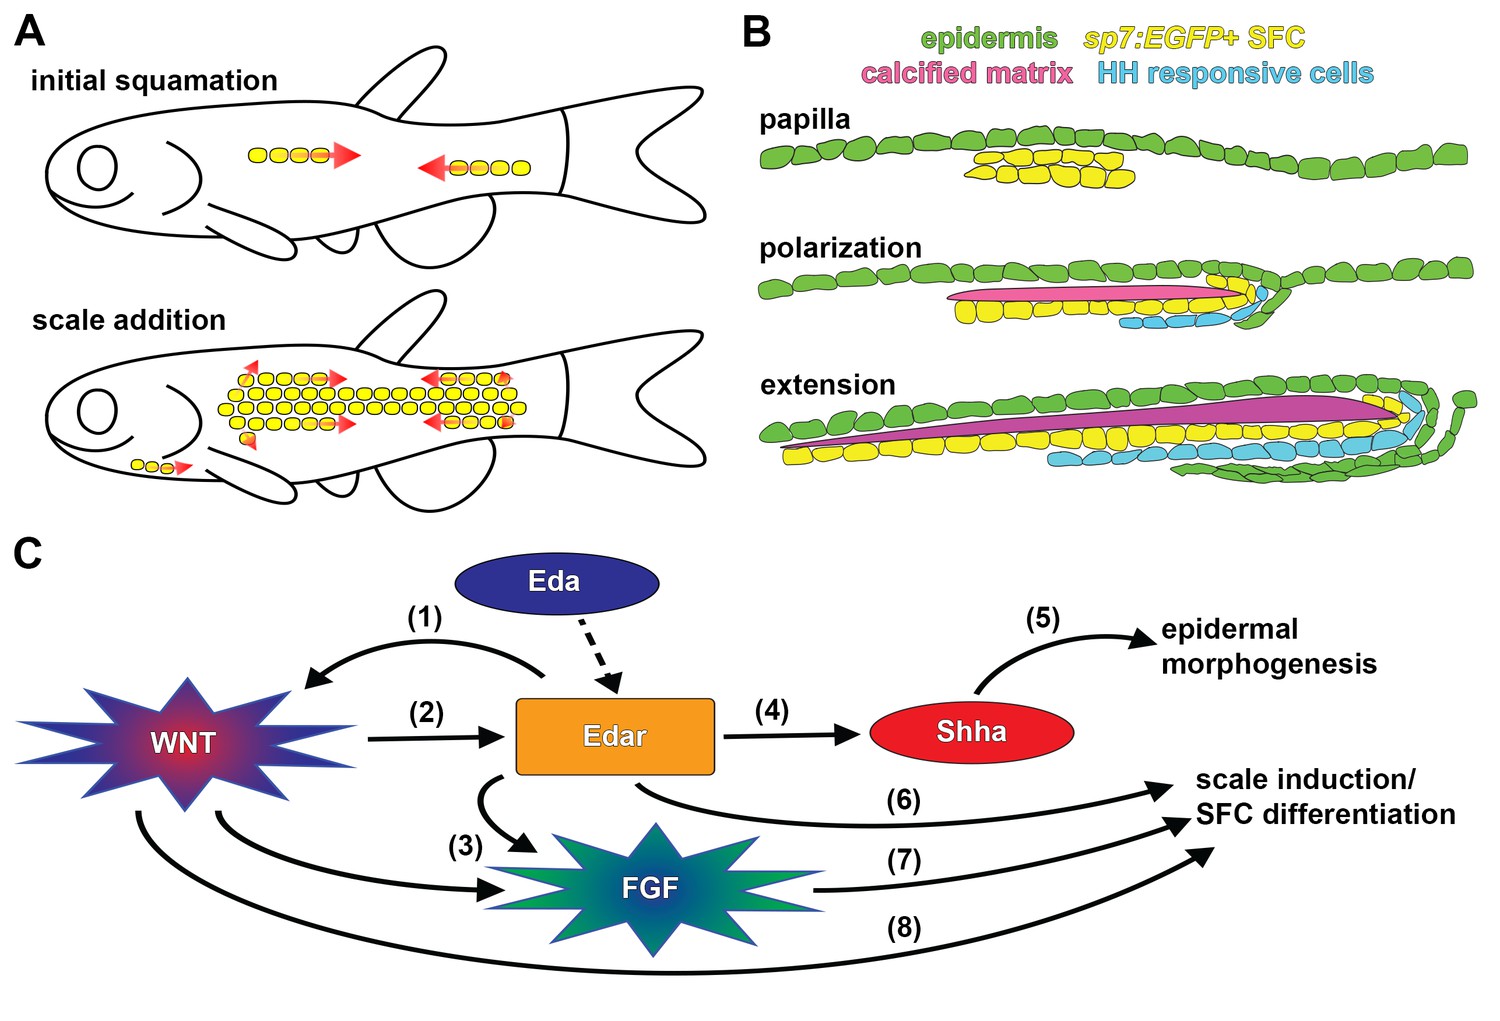
Summary of scale development and schematic of molecular interactions.
(A) Zebrafish squamation sequence showing the addition of scales (yellow) by addition of rows and column (arrows). (B) Scale morphogenesis is first recognized as at the papilla stage when sp7:EGFP+ dSFCs (yellow) differentiate beneath the epidermis (green). Following papilla formation polarized growth commences and scale forming cells line the posterior margin and deep aspect of the growing calcified plate (magenta). At this stage epidermal invagination begins. These processes (polarized growth of the calcified matrix and epidermal invagination) continue to generate the final morphology of the scale. (C) Schematic representation of molecular interactions leading to scale initiation and epidermal morphogenesis. (1) Refinement and reiteration of Wnt/β-catenin activity required Eda signaling (Figure 3A–D). (2) Wnt/β-catenin signaling was necessary for edar expression (Figure 3F). (3) Wnt/β-catenin and Eda signaling were necessary for patterned expression of Fgf receptors (Figure 4—figure supplement 1E,G). (4) Eda signaling was necessary for shha expression and HH pathway activity (Figure 5—figure supplement 1F–H). (5) HH signaling was necessary for epidermal morphogenesis (Figure 5A,B; Figure 5—figure supplement 1A). (6) Edar misexpression caused ectopic differentiation of dSFCs (Figure 3H, Figure 3—figure supplement 2C). (7) Broadly overexpressed Fgf8a caused broad, disorganized differentiation of dSFCs via a Wnt dependent mechanism (Figure 4C–E). (8) Neither Eda, nor Fgf signaling was sufficient to cause differentiation of dSFCs in the absence of Wnt signaling (Figure 3G,H; Figure 4D). Dashed line denotes activation of Edar by the Eda signaling ligand.
Videos
Video 1
Zebrafish squamation stages sp7:EGFP cells (yellow) and Alizarin Red-S labelled calcified matrix (magenta) serially imaged in live fish.
Two row (2R), four for (4R), six row (6R) and beard (B) stages are annotated. Scale bar = 1 mm.
Tables
Key resources table
| Reagent type (species) or resource | Designation | Source or reference | Identifiers | Additional information | |
|---|---|---|---|---|---|
| Gene (Danio rerio) | fgfr1a | This paper | NCBI_Reference_Sequence: NM_152962.3 | Amplified from cDNA | |
| Gene (Danio rerio) | fgfr2 | This paper | NCBI_Reference_Sequence: NM_001243004.1 | Amplified from cDNA | |
| Gene (Danio rerio) | shha | This paper | NCBI_Reference_Sequence: NM_131063.3 | Amplified from cDNA | |
| Gene (Danio rerio) | hhip | This paper | NCBI_Reference_Sequence: NM_001080012.1 | Amplified from cDNA | |
| Gene (Danio rerio) | lef1 | This paper | NCBI_Reference_Sequence: NM_131426.1 | Amplified from cDNA | |
| Gene (Danio rerio) | axin2 | This paper | NCBI_Reference_Sequence: NM_131561.1 | Amplified from cDNA | |
| Gene (Danio rerio) | eda | This paper | NCBI_Reference_Sequence: NM_001115065.1 | Amplified from cDNA | |
| Gene (Danio rerio) | edar | This paper | NCBI_Reference_Sequence: NM_001115064.2 | Amplified from cDNA | |
| Strain, strain background (Danio rerio) | gli2-D:mCherry; Tg(Mmu.Foxa2-cryaa :mCherry)nu15Tg | Gift. PMID:21203590 | RRID:ZDB-ALT-110310-6 | NA | |
| Strain, strain background (Danio rerio) | hs:gli2-DR; Tg(hsp70l:gli2aDR-EGFP)umz33Tg | Gift.PMID:23441066 | RRID:ZDB-TGCONSTRCT-130123-11 | NA | |
| Strain, strain background (Danio rerio) | hs:shha; Tg(hsp70l:shha-EGFP)umz30Tg | Gift.PMID:23441066 | RRID:ZDB-ALT-130123-8 | NA | |
| Strain, strain background (Danio rerio) | cldnb:EGFP; Tg(−8.0cldnb:LY-EGFP)zf106Tg | Gift.PMID:16678780 | RRID:ZDB-TGCONSTRCT-070117-15 | NA | |
| Strain, strain background (Danio rerio) | WT(ABb) | PMID:26701906 | RRID:ZDB-GENO-960809-7 | Parichy Lab derivative of AB, ABwp | |
| Strain, strain background (Danio rerio) | nkt; nacktdt1261 | Gift.PMID:18833299 | RRID:ZDB-ALT-090324-1 | NA | |
| Strain, strain background (Danio rerio) | hag; hagoromo | Gift.PMID:10801422 | RRID:ZDB-ALT-040217-6 | NA | |
| Strain, strain background (Danio rerio) | sp7:EGFP; Tg(sp7:EGFP)b1212 | Gift.PMID:20506187 | RRID:ZDB-ALT-100402-1 | NA | |
| Strain, strain background (Danio rerio) | hs:dkk1; Tg(hsp70l:dkk1b-GFP)w32T | Gift.PMID:17185322 | RRID:ZDB-ALT-131120-19 | NA | |
| Strain, strain background (Danio rerio) | 7xTCF:mCherry; Tg(7xTCF-Xla.Siam:nlsmCherry)ia5 | Gift.PMID:22546689 | RRID:ZDB-TGCONSTRCT-110113-2 | NA | |
| Recombinant DNA reagent | Eda-2A-mCherry; hsp70l:eda-2A-nls-mCherry | This paper | NA | Assembled using multisite gateway cloning | |
| Recombinant DNA reagent | Edar-2A-mCherry; hsp70l:edar-2A-nls-mCherry | This paper | NA | Assembled using multisite gateway cloning | |
| Antibody | anti-Dig-AP, Fab fragments | Millipore-Sigma | Roche Cat# 11093274910, RRID:AB_514497 | 1:5000 overnight at 4°C | |
| Antibody | rabbit anti-beta- catenin antibody | Millipore-Sigma | Millipore cat#PLA0230, RRID:AB_2732045 | 1:1000 overnight at 4°C | |
| Chemical compound, drug | Alizarin-Red-S; ARS | Millipore-Sigma | SKU_A5533 SIGMA- ALDRICH | NA | |
| Chemical compound, drug | Calcein | Millipore-Sigma | SKU_C0875 SIGMA | NA | |
| Chemical compound, drug | BGJ398 | Selleckchem | CatalogNo_Selleckchem: S2183 | NA | |
| Chemical compound, drug | cyclopamine | Selleckchem | CatalogNo_Selleckchem: S1146 | NA | |
| Software, algorithm | GraphPad Prism | GraphPad | NA | NA | |
Download links
A two-part list of links to download the article, or parts of the article, in various formats.
Downloads (link to download the article as PDF)
Open citations (links to open the citations from this article in various online reference manager services)
Cite this article (links to download the citations from this article in formats compatible with various reference manager tools)
Wnt/β-catenin regulates an ancient signaling network during zebrafish scale development
eLife 7:e37001.
https://doi.org/10.7554/eLife.37001


