Panproteome-wide analysis of antibody responses to whole cell pneumococcal vaccination
- Antigen Discovery Inc, United States
- University of Maryland, United States
- PATH, United States
- Harvard TH Chan School of Public Health, United States
- Boston Children’s Hospital and Harvard Medical School, United States
- Imperial College London, United Kingdom
Figures
Figure 1 with 1 supplement
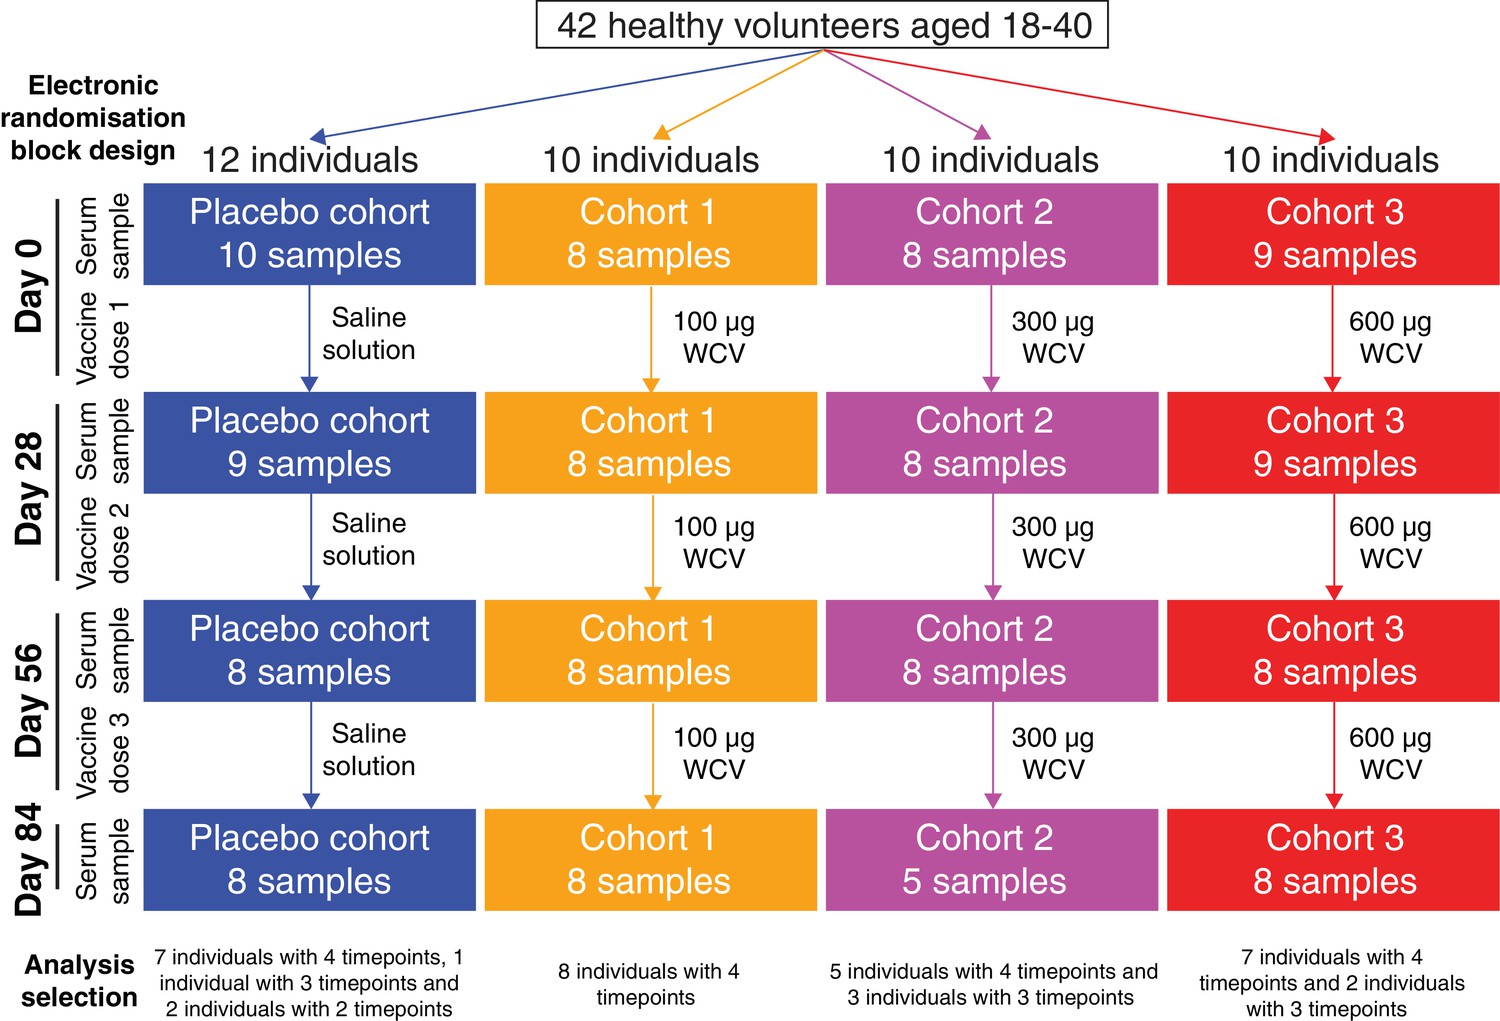
Flow chart describing the analysed samples.
Forty-two healthy adult volunteers were randomly assigned to either a placebo control group, or one of three cohorts receiving different doses of the WCV, in a double-blind phase I trial. Serum samples were planned to be taken prior to the first dose, and 28 days after each of the three doses. Not all participants completed the trial, and therefore the set of available samples was limited. Those analysed in this study came from 35 of the trial participants, and are broken down by cohort and timepoint in this chart.
-
Figure 1—source data 1
Sample collection data.
- https://doi.org/10.7554/eLife.37015.005
Figure 1—figure supplement 1
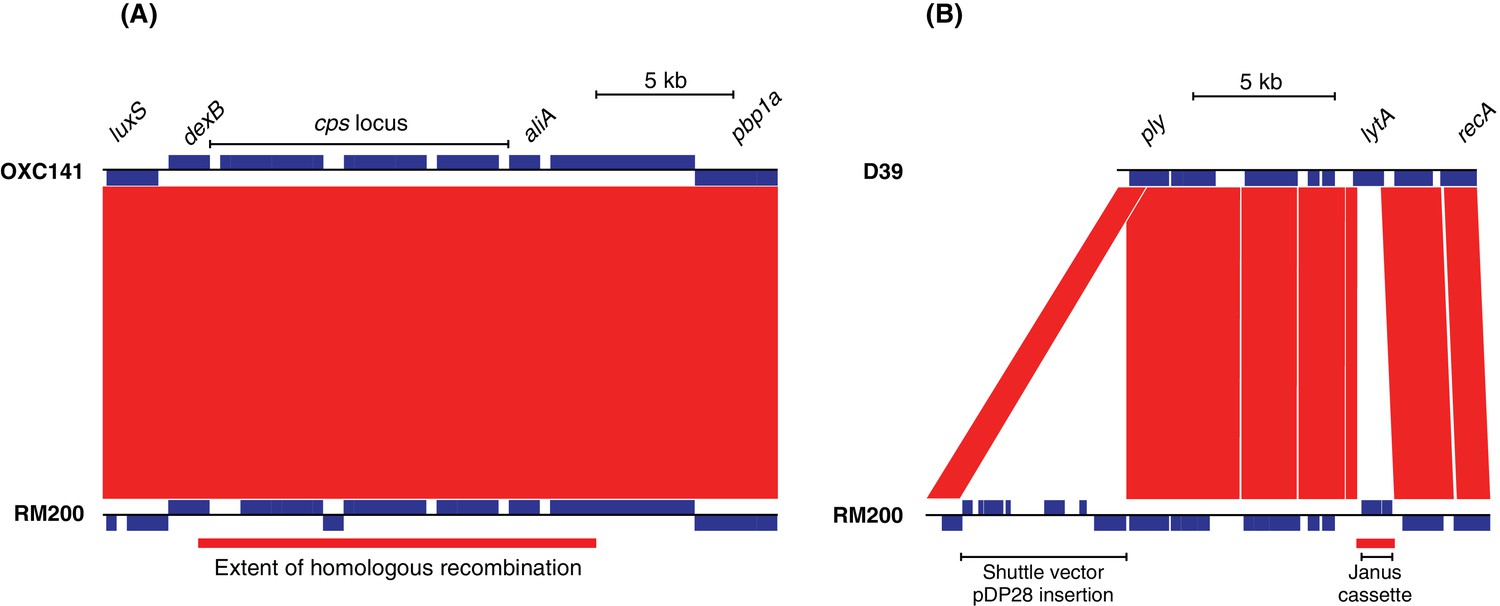
Construction of strain S. pneumoniae RM200.
In both panels, the RM200 contigs at the bottom are aligned to a reference genome at the top, with red bands between the two linking regions of sequence similarity identified by BLAST. The blue boxes marked in each sequence are predicted protein coding sequences. (A) Introduction of the serotype three capsule polysaccharide synthesis locus into the S. pneumoniae Rx1 background. The sequence of the serotype three strain S. pneumoniae OXC141 is shown at the top, with the extent of the cps gene cluster responsible for capsule synthesis marked. The alignment shows the entirety of this gene cluster is present in the unencapsulated RM200, which was derived from a serotype 3-expressing recombinant genotype. The indicated homologous recombination distinguished RM200 from its serotype two original progenitor, D39. This spanned the entire cps locus and likely indicates the import of DNA causing the switch in the expressed capsule type. (B) Alteration of the pneumolysin toxin-encoding gene ply and removal of the lytic amidase-encoding lytA. The ply sequence was modified though insertion-duplication mutagenesis using the E. coli-S. pneumoniae shuttle vector pDP28. This introduced three amino acid substitutions that eliminated the cytolytic activity of the protein. The lytA gene was replaced by the Janus cassette through allelic replacement. The homologous recombination distinguishing these two genomes through which this occurred is marked by the red bar underneath the RM200 sequence.
Figure 2 with 3 supplements

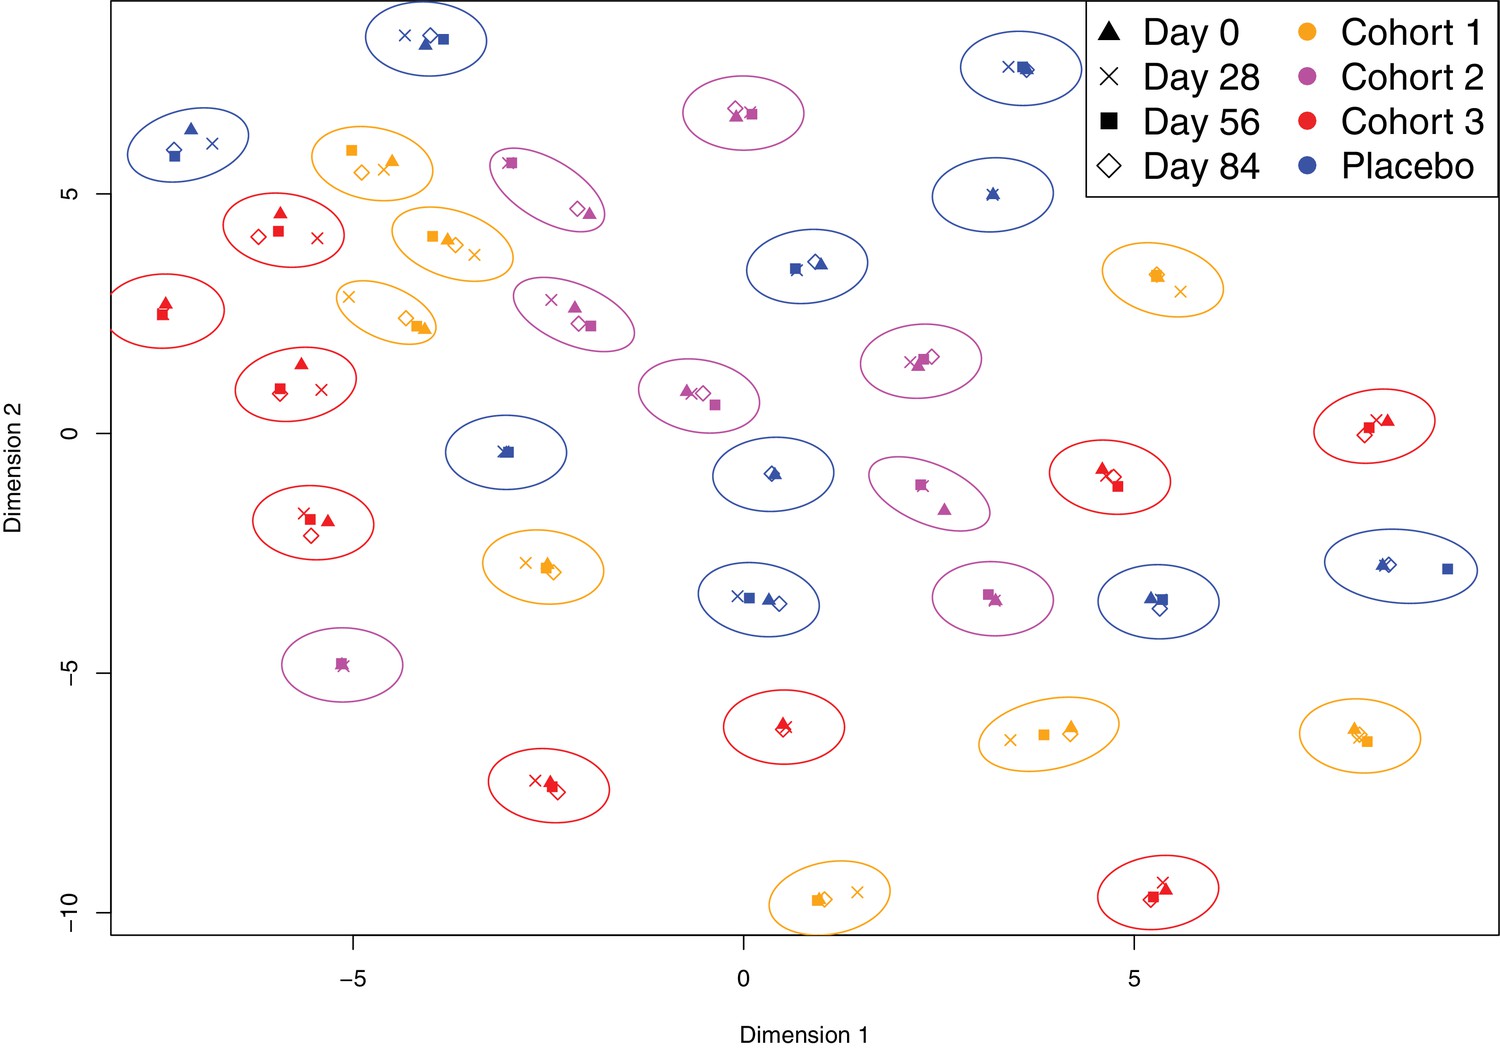
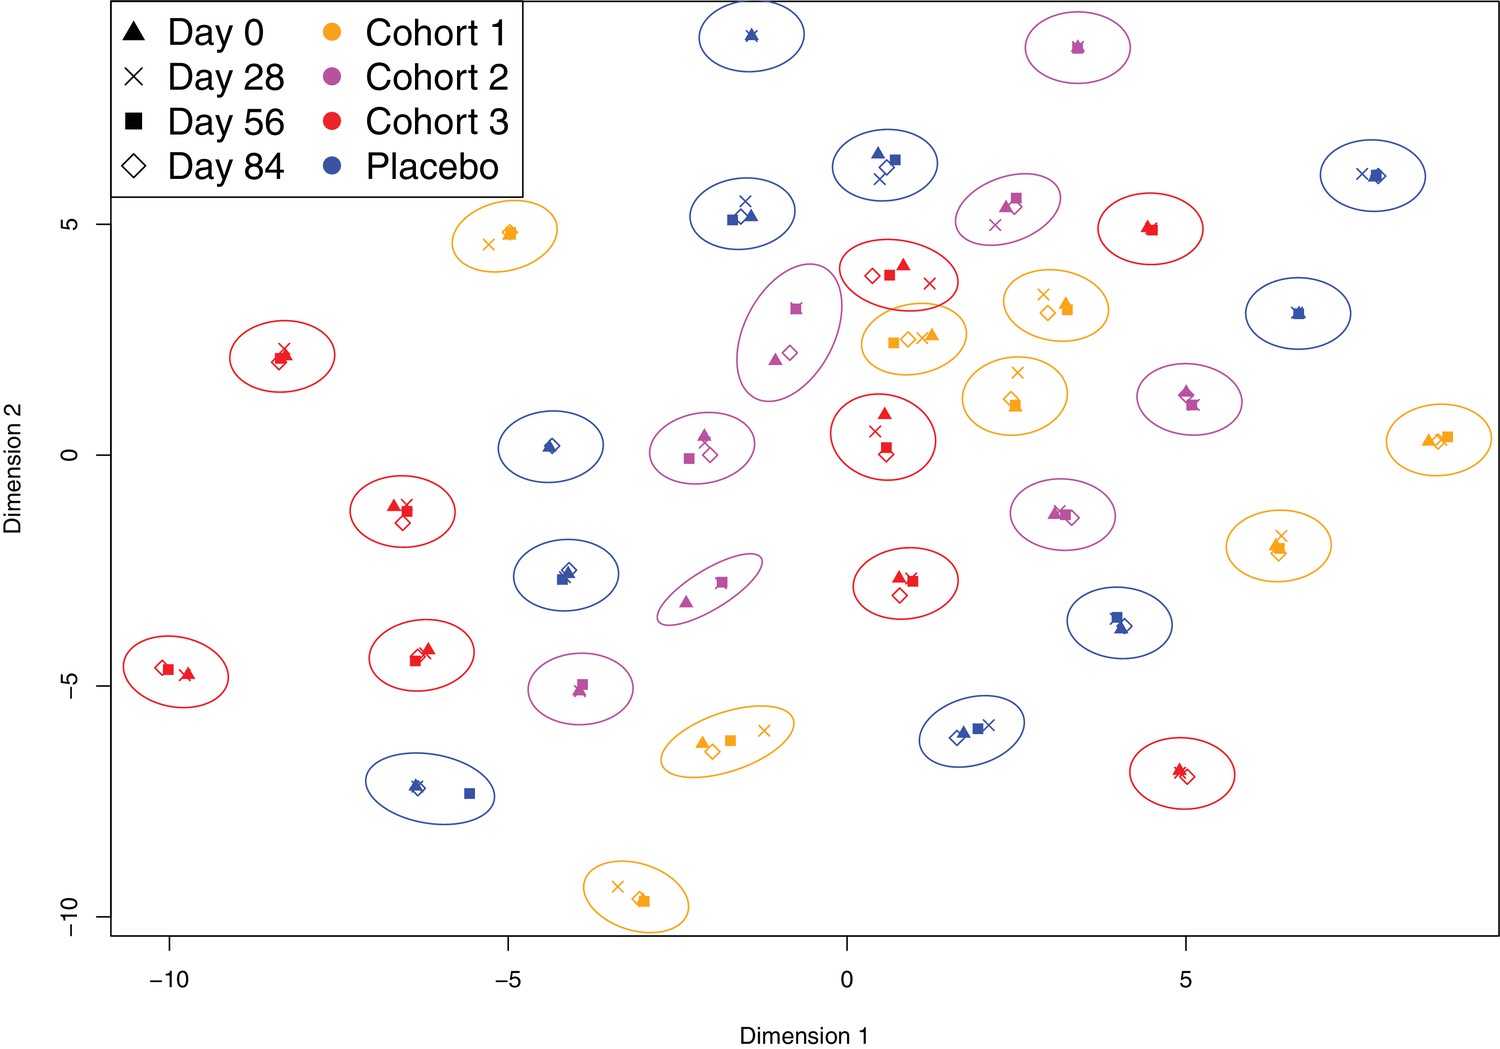
Variation in the immune profiles of trial participants.
The IgG-binding data for each sample were projected across two dimensions using t-distributed stochastic neighbour embedding. Points are coloured according to the cohort of the individual contributing the sample. The shape represents the day of the trial on which the sample was collected. Ellipses surround sets of samples taken from the same individual. The separation of each ellipse shows the distinctive immune ‘fingerprint’ of each individual, which is maintained over the course of the trial.
-
Figure 2—source data 1
Panproteome array IgG binding data.
- https://doi.org/10.7554/eLife.37015.010
Figure 2—figure supplement 1
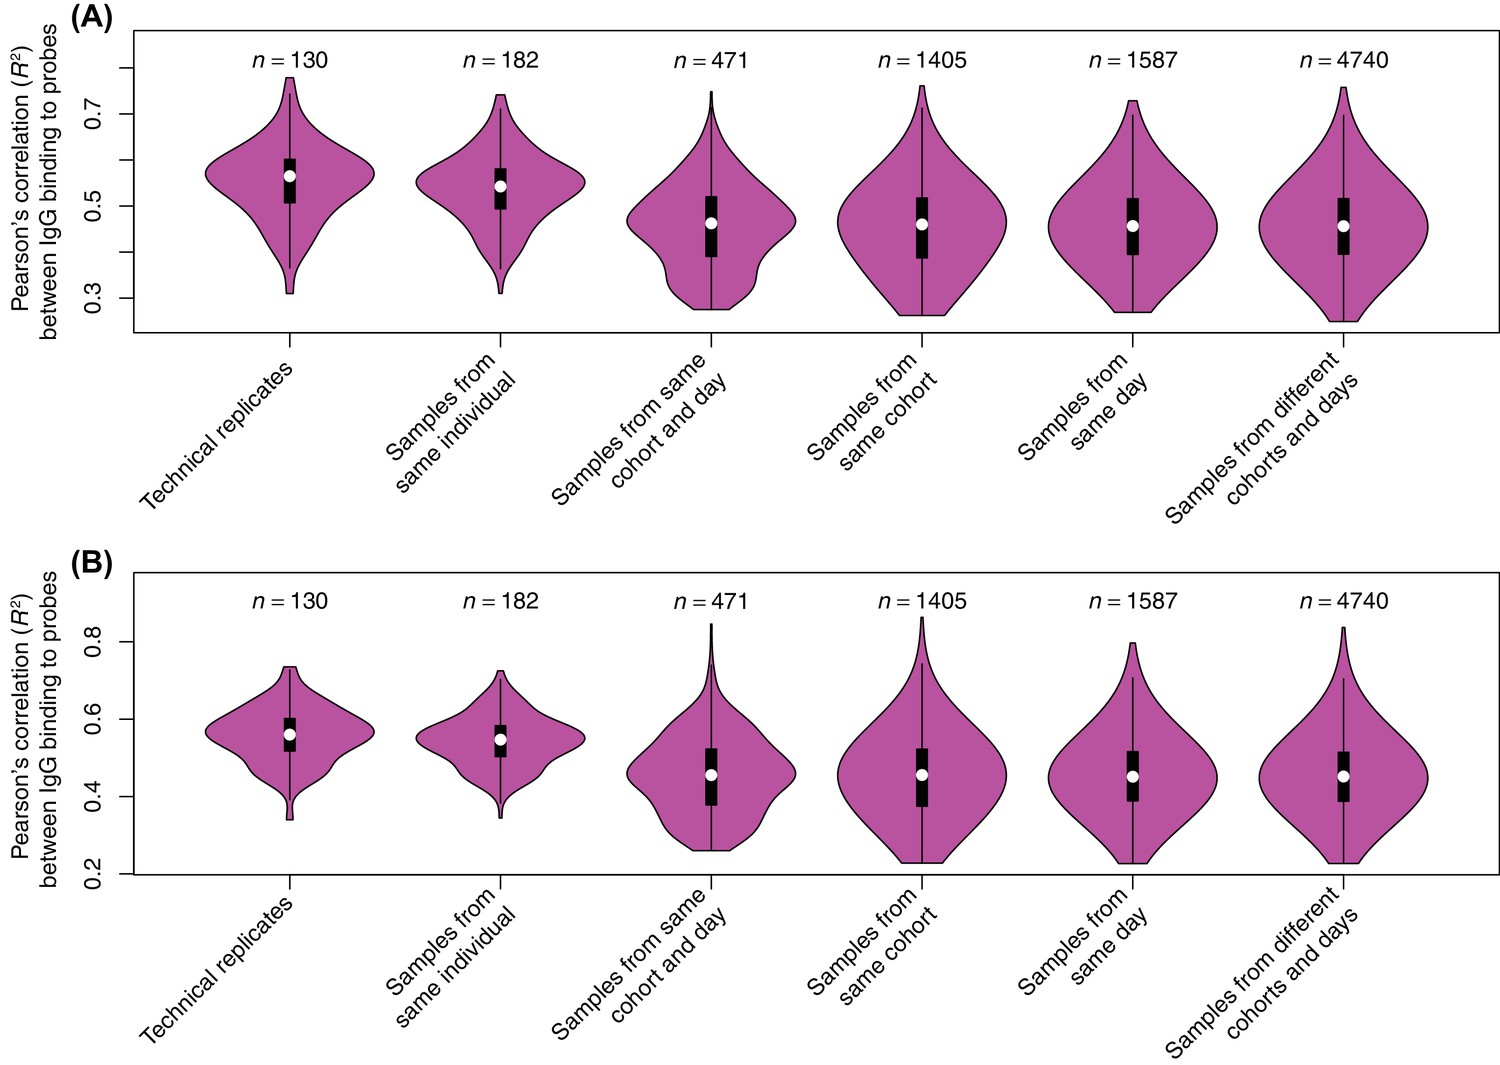
Reproducibility of probe signals.
In a pilot experiment, the serum samples were applied to an array consisting of probes representing the proteome of Streptococcus pneumoniae TIGR4. These were also present on the panproteome array, but they were not included in subsequent analyses. These two independent experiments provided an estimate of the variation between technical replicates, although the differences in the array designs means there is substantial systematic variation between them. The Pearson correlation (R2) was calculated between all pairwise comparisons from the two sets of replicates, and the overall distribution for different types of comparison shown as violin plots for (A) all probes and (B) the 1165 immunoreactive probes (a maximum IgG binding of at least one across the S. pneumoniae TIGR4 probes from the panproteome dataset). There was no significant difference between the correlations observed across all probes for technical replicates and other comparisons between samples from the same individual (Wilcoxon rank sum tests; N = 312, W = 13239, p = 0.073 for all probes). However, restricting the analysis to the immunoreactive probes found technical replicates to exhibit a significantly stronger correlation with one another, relative to samples from the same individual at other timepoints (N = 312, W = 13480, p = 0.036 for immunoreactive probes), consistent with the WCV-induced changes associated with antibody-binding target being reproducibly detectable. This high similarity between technical replicates and samples from the same individual is necessary for the persistence of an immune fingerprint in longitudinal samples (Figure 2). Comparisons between these two categories were significantly more correlated than comparisons with the next most similar category, different individuals in the same cohort at the same timepoint (Wilcoxon rank sum tests; N = 601, W = 48170, p < 10−16 for all probes; N = 601, W = 48738, p < 10−16 for immunoreactive probes). As there was relatively little variation between technical replicates, but reproducibly high variation between trial participants, biological replicates were prioritised over technical replicates in designing the study.
Figure 2—figure supplement 2
Evidence of distinct antibody fingerprints of trial participants from non-DCL probes.
The t-SNE analysis shown in Figure 2 was repeated, excluding the probes corresponding to the DCL. Longitudinal samples from the same individual again cluster together, demonstrating the distinctiveness of individuals’ antibody repertoires was apparent even when the allelic variation of PspA, PspC, ZmpA and ZmpB were excluded. The longer-range structure of the projection is stochastic, and these differences with Figure 2 are not biologically relevant.
Figure 2—figure supplement 3
Evidence of distinct antibody fingerprints of trial participants from proteins conserved across S. pneumoniae, S. pseudopneumoniae and S. mitis.
The t-SNE analysis shown in Figure 2 was repeated, but only using those probes corresponding to proteins on the array conserved with ≥90% sequence identity in S. mitis and S. pseudopneumoniae. Longitudinal samples from the same individual again cluster together, demonstrating the distinctiveness of individuals’ antibody repertoires was apparent even to proteins exhibiting little variation across S. pneumoniae isolates. The longer-range structure of the projection is stochastic, and these differences with Figure 2 are not biologically relevant.
Figure 3

Scatterplots showing the within-cohort median change in IgG binding to each probe over the course of the trial (Δ0→84) relative to the within-cohort median pre-vaccination IgG binding.
(A–D) This relationship is shown for each probe on the proteome array using data from the 29 individuals with samples taken at the start and end of the trial. These are split into (A) the placebo group, (B) cohort 1 (100 μg doses), (C) cohort 2 (300 μg doses), and (D) cohort 3 (600 μg doses). The horizontal dashed line indicates the empirically-determined threshold for defining probes having undergone a substantial change in IgG binding during the trial (Figure 4—figure supplement 2). The Pearson’s correlation statistics and gradient of the best-fitting linear model are annotated on each panel. (E–F) The relationship between the median Δ0→84 for each probe is shown for (E) a comparison of cohorts 1 and 3, and (F) a comparison of cohorts 2 and 3.
Figure 4 with 15 supplements
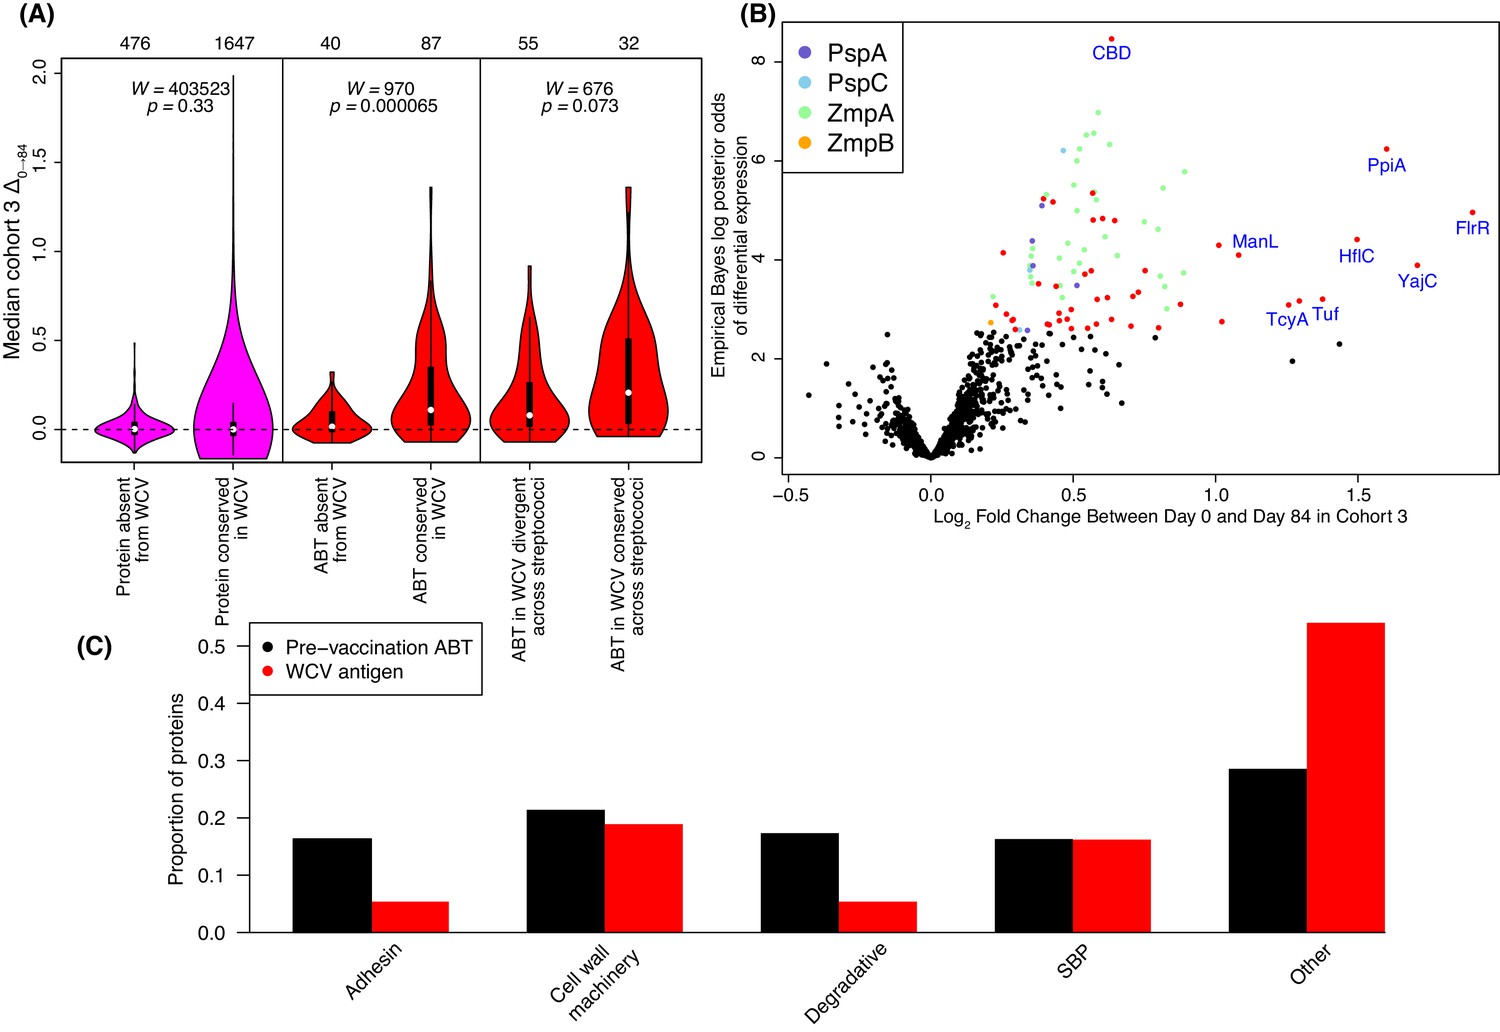
Identification of WCV antigens from changes in IgG binding.
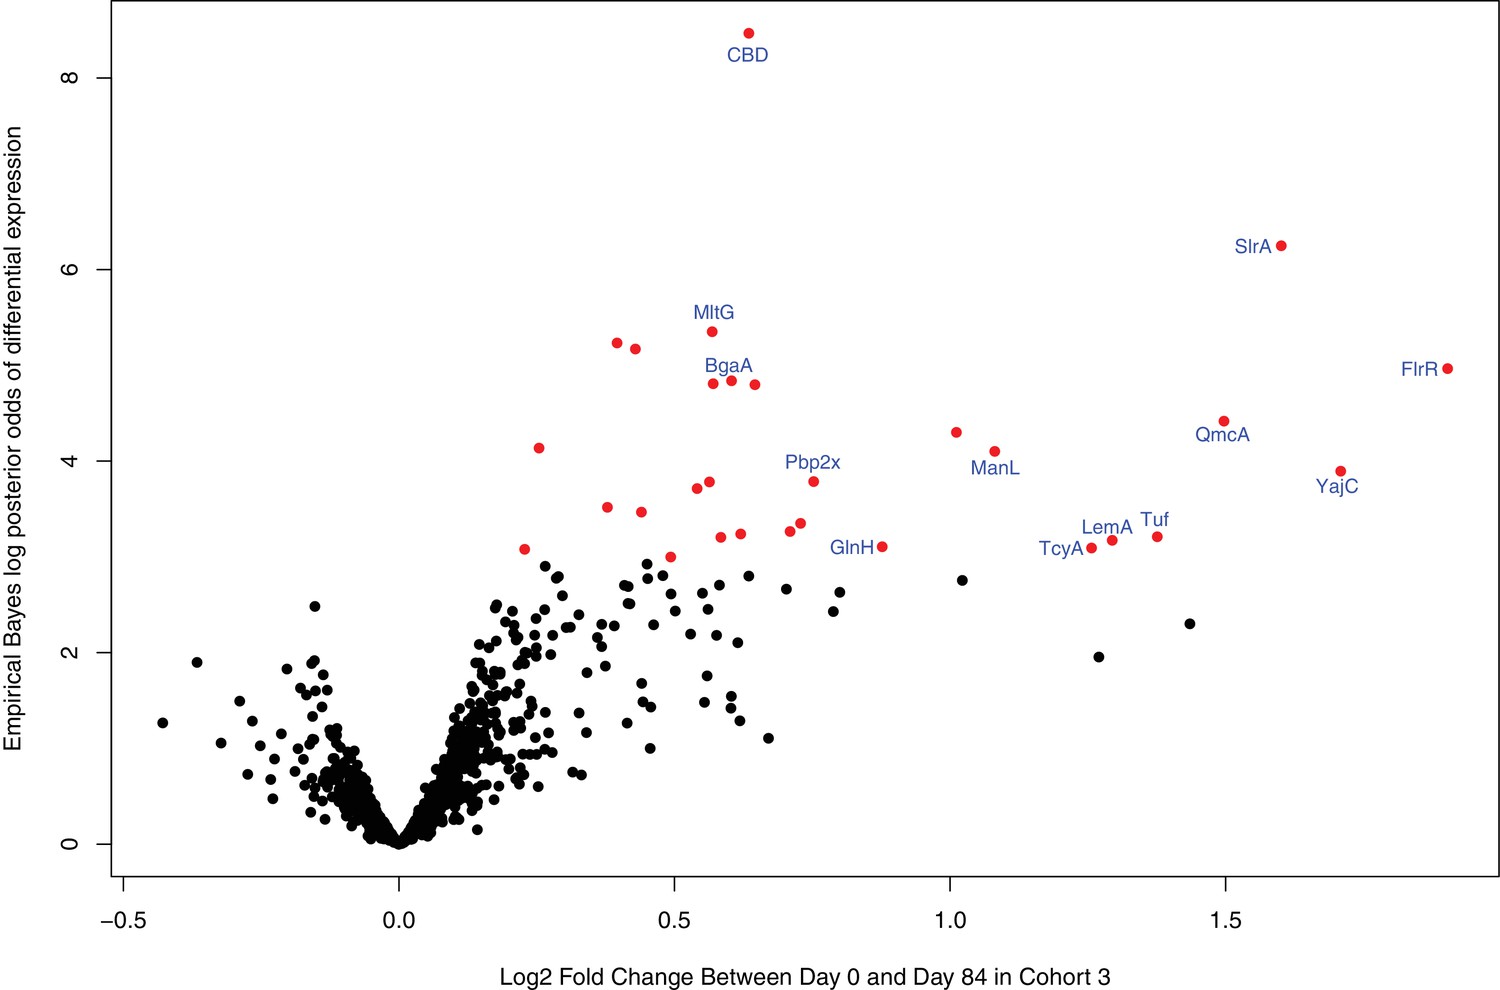
(A) Violin plots showing the median Δ0→84 within cohort three for non-DCL array probes, split by whether they represent proteins with close orthologues in the WCV strain RM200 (defined as ≥90% amino acid identity) or not. The central panel shows the same comparison, but further constraining the dataset to probes representing the proteins classified as ABTs based on high pre-vaccination IgG binding. The right panel stratifies the 87 probes corresponding to ABTs with close orthologues in RM200 by whether the protein on the array was also conserved with ≥90% sequence identity in S. mitis and S. pseudopneumoniae (Supplementary file 1). The number of probes in each category is shown at the top of the plot. The results of Wilcoxon rank sum tests (W) and significance (p) are annotated on each panel. (B) Volcano plot showing the statistical and biological significance of changes in IgG binding following WCV administration in cohort 3. The horizontal axis shows the fold change in IgG binding between the day zero and day 84 samples from cohort three on a base two logarithmic scale. The vertical axis shows the B statistic from the empirical Bayes analysis, representing the natural logarithm of the odds ratio of differential IgG binding between cohort three and the placebo group. Points corresponding to array probes with a Benjamini-Hochberg corrected p value below 0.05 are coloured red, unless they represent a variant of PspA, PspC, ZmpA, or ZmpB. (C) Functional categorisation of antigens. The distribution of ABTs, defined as eliciting high IgG in the pre-vaccination samples (Croucher et al., 2017), and the WCV antigens identified by either the eBayes or LMM analyses (Supplementary file 2) are compared across different functional categories.
Figure 4—figure supplement 1

Variation in IgG binding between individuals.
Each panel includes a violin plot for each of the 29 individuals sampled at the start and end of the trial. Each plot is coloured according to the cohort to which the individual belonged. (A) Violin plots showing the distribution of IgG-binding measurements at day zero. No significant heterogeneity between the median IgG values per individual was detected between cohorts (Kruskal-Wallis test, N = 29, χ2 = 0.20, df = 3, p = 0.98), or in a pairwise comparison of cohort three with the placebo group (Wilcoxon rank sum test, N = 16, W = 34, p = 0.88). (B) Violin plots showing Δ0→84 for all of the probes included in the analysis. No significant heterogeneity between the median IgG values per individual was detected between cohorts (Kruskal-Wallis test, N = 29, χ2 = 3.17, df = 3, p = 0.37), or in a pairwise comparison of cohort three with the placebo group (Wilcoxon rank sum test, N = 16, W = 20, p = 0.23). (C) Violin plots showing the same data as in panel (B), but only for the 325 probes from the antibody-binding targets (ABTs) defined by their high pre-vaccination IgG binding. No significant heterogeneity between the median IgG values per individual was detected between cohorts (Kruskal-Wallis test, N = 29, χ2 = 4.63, df = 3, p = 0.20), nor did a pairwise comparison of cohort three with the placebo group suggest vaccination caused a significant increase in overall IgG binding across all ABTs (Wilcoxon rank sum test, N = 16, W = 14, p = 0.065).
Figure 4—figure supplement 2
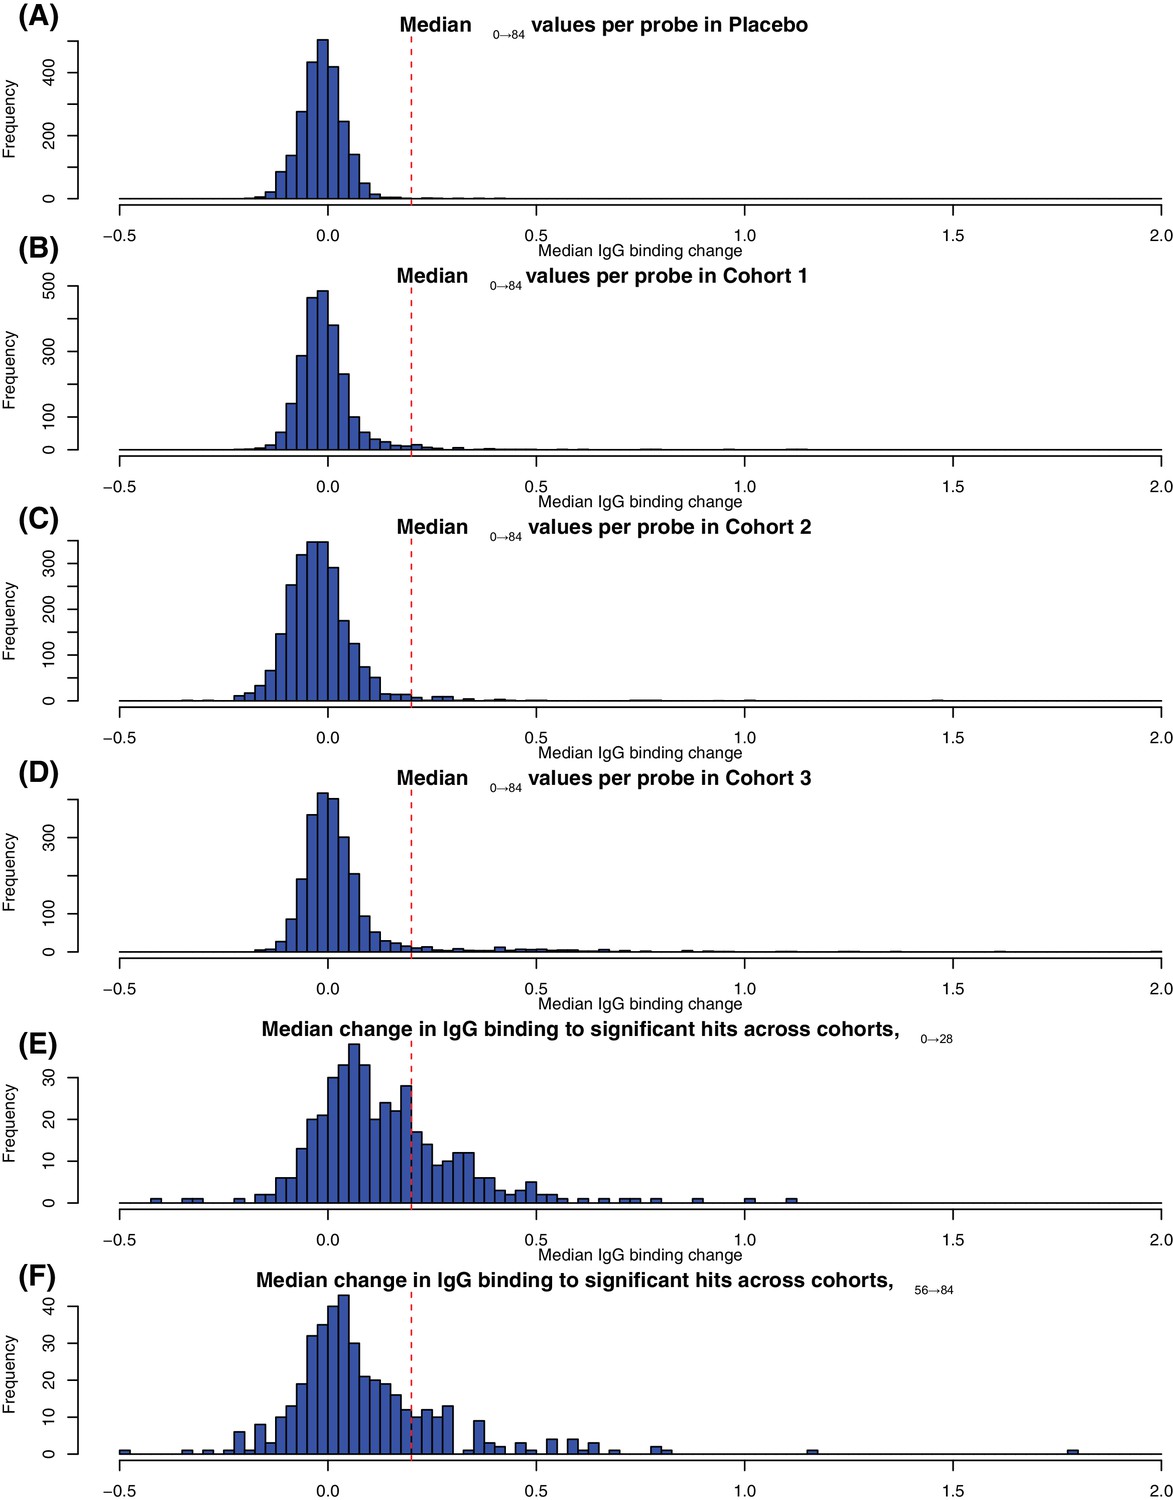
Determining the threshold for identifying substantial changes in IgG binding between timepoints.
The first four histograms in panels (A–D) show the distribution of Δ0→84 values across all probes for the four cohorts in the trial. The threshold of 0.2 separates the main distribution of small Δ0→84 values from the outliers associated with immunogenic proteins in the WCV. This threshold is marked on Figure 3. The last two histograms in panels (E-F) show the distribution of changes in IgG binding between the (E) first two (Δ0→28) and (F) last two (Δ56→84) timepoints for the individuals in the vaccinated cohorts in whom all four timepoints were sampled. Only probes identified as undergoing a significant change based on the eBayes or LMM analyses were included in the plots, resulting in an enrichment of larger changes in IgG binding. Based on these, the same threshold of 0.2 units was selected as distinguishing the set of probes detecting a change in the specified interval from those detecting changes over other time periods. This threshold is marked on Figure 7.
Figure 4—figure supplement 3
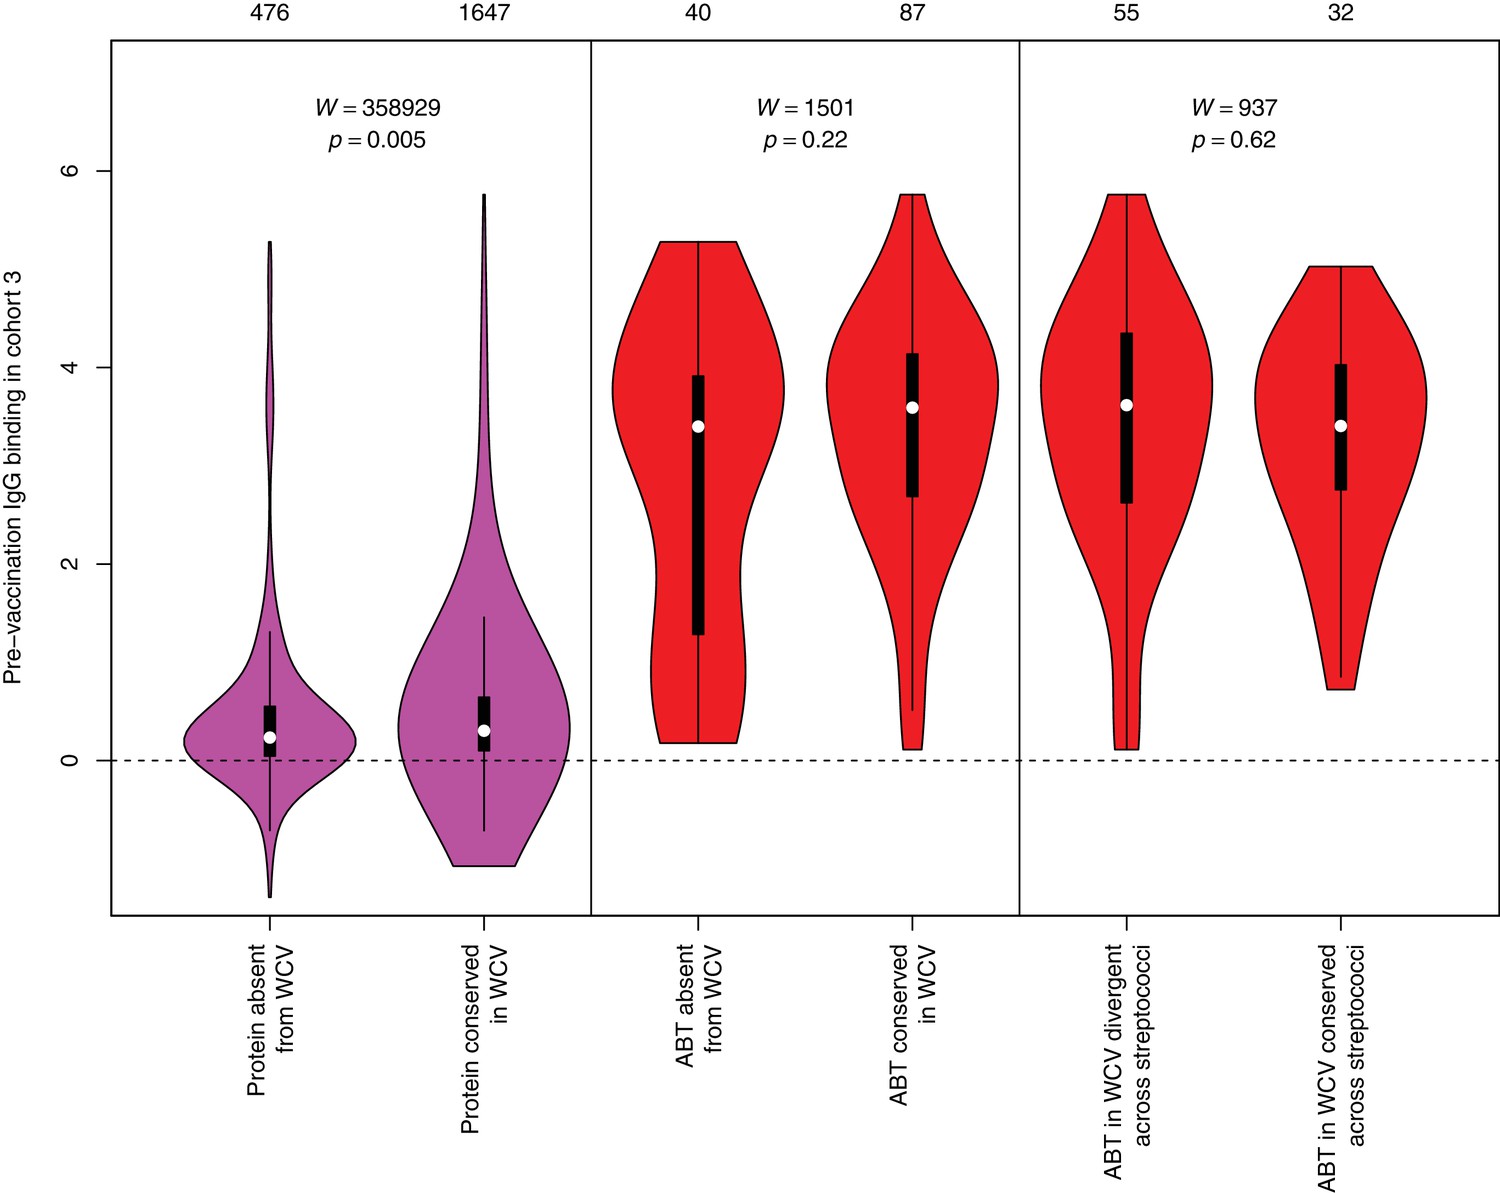
Pre-vaccination IgG binding in cohort three to protein categories defined in Figure 4.
The left violin plot shows the distribution of pre-WCV IgG binding in cohort three for non-DCL array probes, split by whether they represent proteins with close orthologues in the WCV strain RM200 (defined as ≥90% amino acid identity) or not. The responses to the proteins in the vaccine are slightly higher prior to administration, which may reflect the rarity of those proteins absent from RM200; such low frequency proteins are less likely to have triggered a recent immune response. The central panel shows the same comparison of pre-vaccination immune responses, but further constraining the dataset to probes representing the proteins classified as ABTs based on high pre-vaccination IgG binding. The right panel stratifies the 87 probes corresponding to ABTs with close orthologues in RM200 by whether protein on the array is also conserved with ≥90% sequence identity in S. mitis and S. pseudopneumoniae. The number of probes in each category is shown at the top of the plot. The results of Wilcoxon rank sum tests (W) and the associated statistical significance (p) are annotated on each panel.
Figure 4—figure supplement 4

Sequence identity between proteomes of different species.
Each histogram shows the pairwise protein sequence identity between the proteins on the array, and the closest orthologues in the corresponding genome. Data are shown for (A) S. pneumoniae RM200, the strain on which the vaccine is based; (B) S. pseudopneumoniae IS7493, a representative of the species most closely-related to S. pneumoniae; (C) S. mitis B6, a representative of the diverse species after which the mitis group streptococci (of which S. pneumoniae is one) is named; (D) S. mutans UA159, which was found to be too divergent for an informative analysis to be performed. The vertical red dashed line indicates the empirically-determined 90% sequence identity threshold for determining presence in, or absence from, RM200 in Figure 4A and Figure 4—figure supplement 3. Altering this threshold to 95% did not substantially alter the results presented in these figures.
Figure 4—figure supplement 5

Effect of divergence between array sequences and RM200 proteins on detected changes in IgG binding.
Each panel shows the divergence between the protein sequence on the array and the closest orthologue in the RM200 strain, on a logarithmic scale on the horizontal axis, and the within-cohort median Δ0→84, on the vertical axis. Two plots are shown for each cohort, focussing on different ranges of sequence similarity: between 0–100% divergence (A–D), and 0–10% divergence (E–H). No clear relationship between sequence divergence and change in IgG binding is evident, suggesting measurements from the array are not biased towards the probes sharing higher sequence identity with proteins in the WCV, despite being designed using a divergent set of strains.
Figure 4—figure supplement 6
Volcano plot showing the statistical and biological significance of changes in IgG binding following WCV administration in cohort 3, when the DCL probes are excluded from the eBayes analysis.
Data are presented as described for Figure 4B. Points corresponding to array probes with a Benjamini-Hochberg corrected p value below 0.05 are coloured red.
Figure 4—figure supplement 7
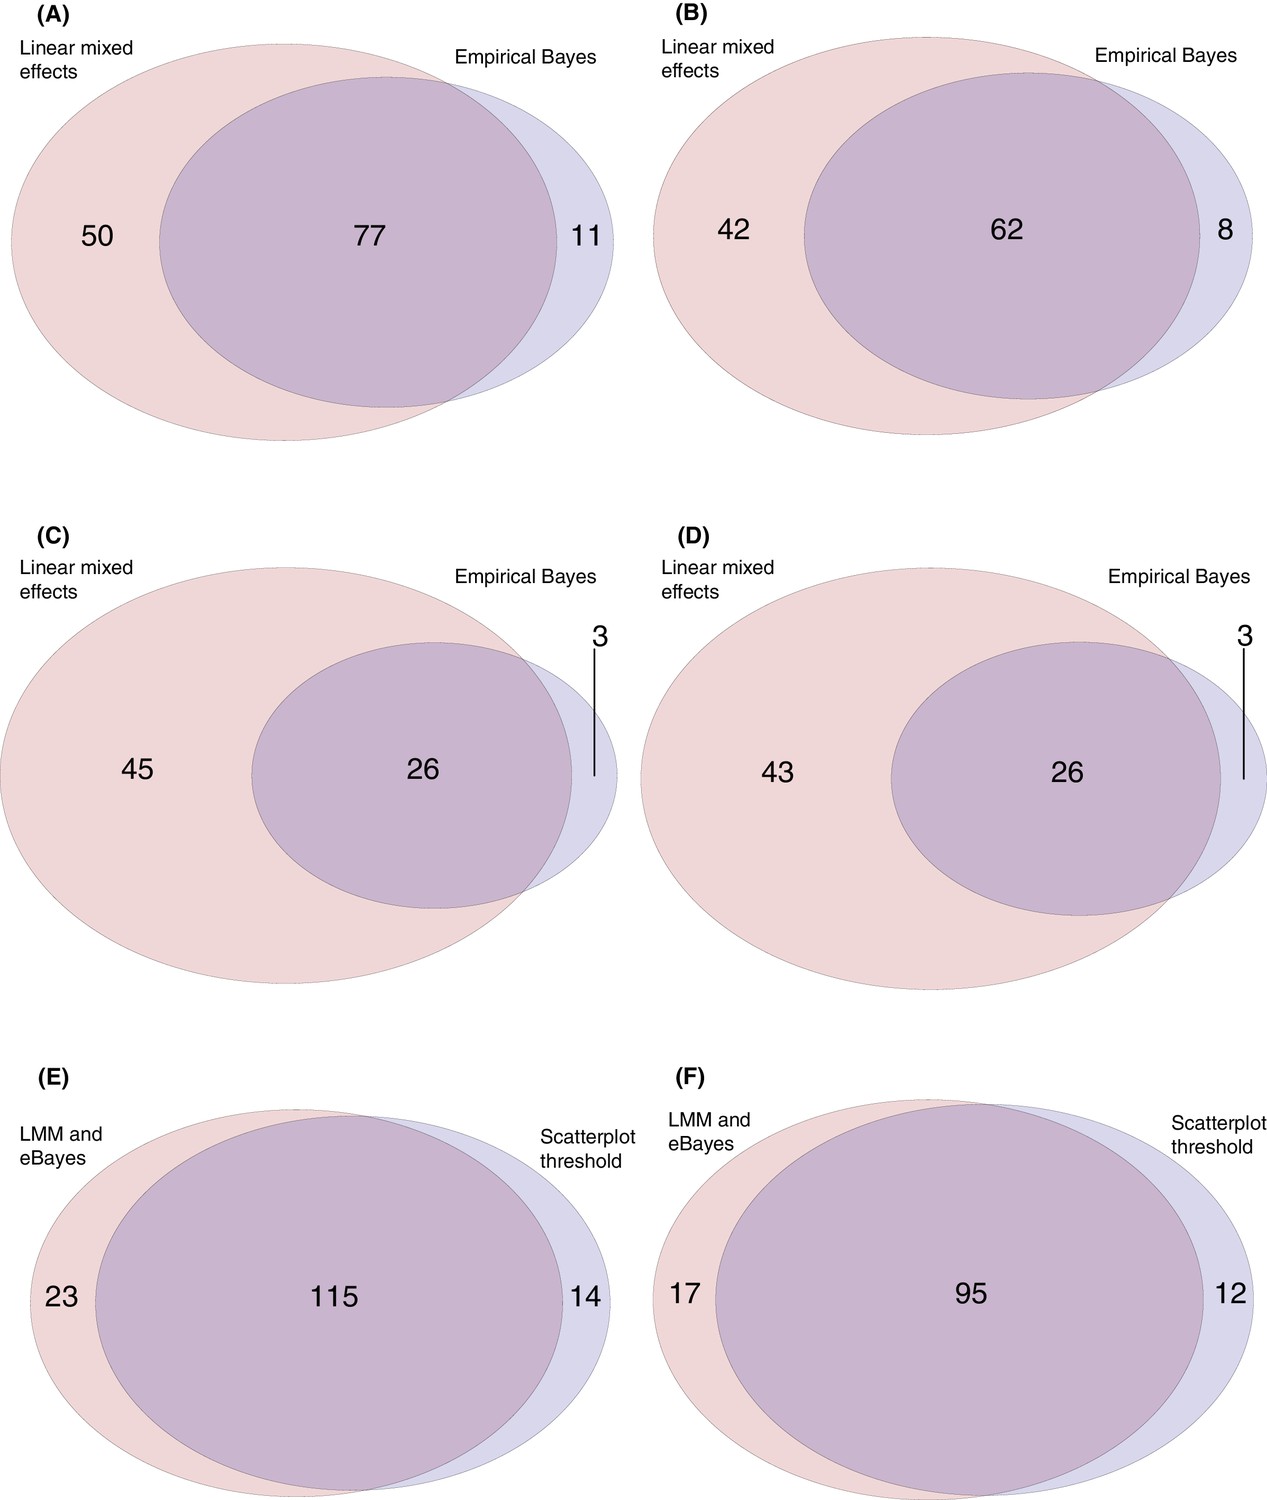
Venn diagrams comparing the results of the empirical Bayes analysis, linear mixed effects models, and empirically-derived threshold applied to theΔ0→84 values shown on the scatterplots in Figure 3.
The threshold approach, and empirical Bayes model, were applied to identify the array probes to which elevated IgG responses were evident between the first and final timepoints for the 29 individuals for whom these data were available. The linear mixed effects model was applied to identify the probes to which there was an increasing IgG response across the four timepoints for the 20 individuals in vaccinated cohorts for whom a complete set of longitudinal samples were available. (A) This Venn diagram shows the linear mixed effects model identified a greater number of probes (127) than the empirical Bayes analysis (88), but the majority of probes identified by either method were consistent with the other. (B) This Venn diagram combines probes corresponding to different parts of the same protein into single datapoints. This shows relatively few proteins were only supported by one of the two methods. Panels (C) and (D) show the same comparisons for the analyses excluding the DCL probes. For panels (E) and (F), the 138 probes identified by either the linear mixed effects models or empirical Bayes analyses were compared against the 129 probes identified as exceeding the threshold Δ0→84 value of 0.2 in cohort 3 (Figure 3D). (C) This Venn diagram shows the model fitting results are highly consistent with those from the threshold-based approach. (D) This Venn diagram combines probes corresponding to different parts of the same protein into single datapoints, showing the results are similar as to panel (C).
Figure 4—figure supplement 8
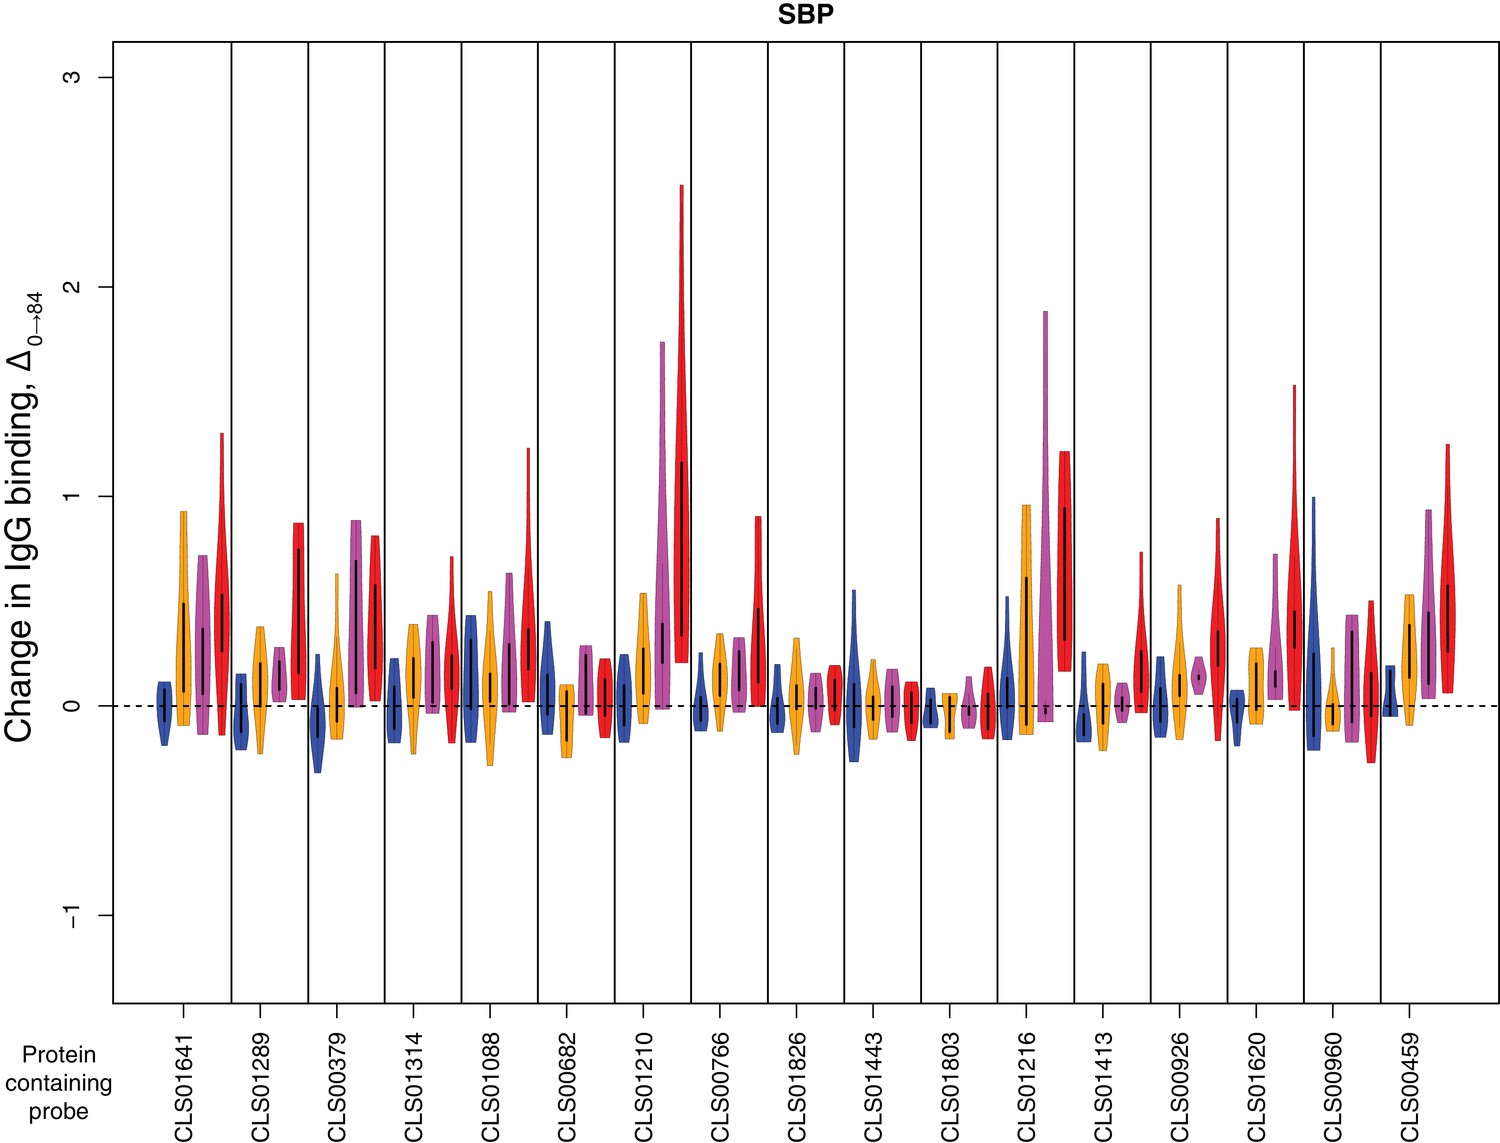
Change in IgG binding during the trial for solute- binding proteins defined as antibody-binding targets on the basis of high pre-vaccination IgG binding.
In each plot, vertical bars separate data for different probes. The protein to which the probe corresponds is labelled at the bottom of the graph. The four violin plots show Δ0→84 for each of the four cohorts: placebo in blue, cohort one in orange, cohort two in pink, and cohort three in red. Only data from the 29 individuals for whom samples were available from the start and end of the trial were used.
Figure 4—figure supplement 9
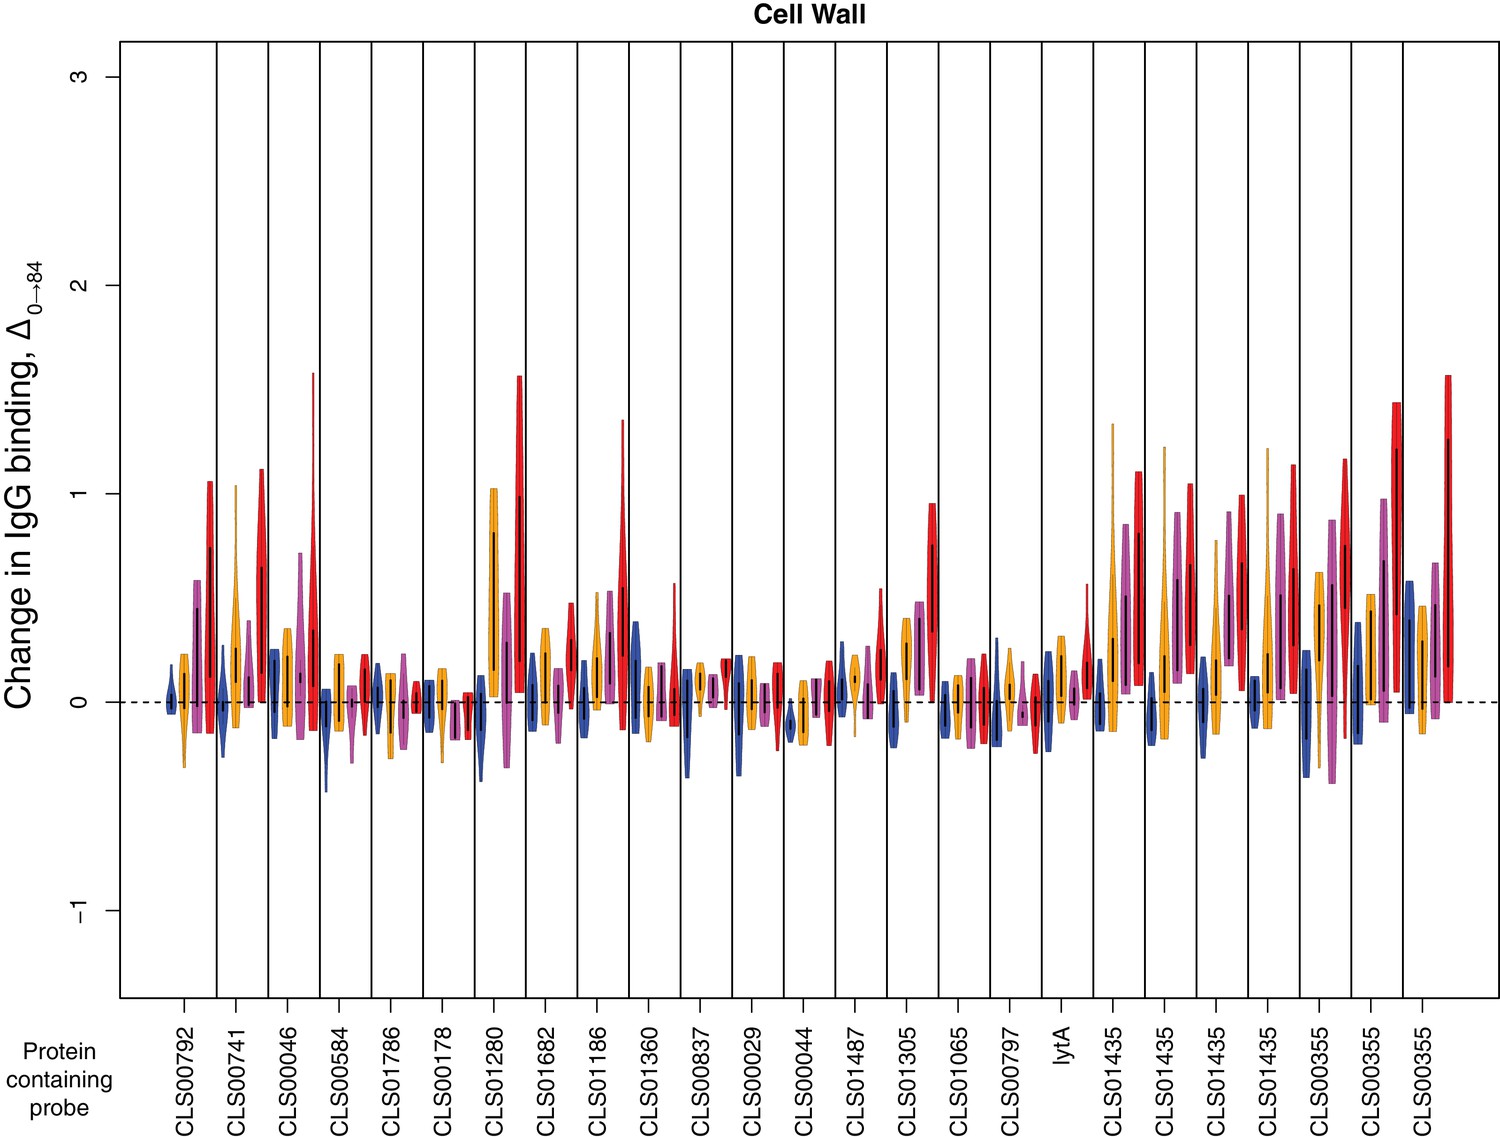
Change in IgG binding during the trial for cell wall synthesis and processing machinery proteins defined as antibody-binding targets on the basis of high pre-vaccination IgG binding.
Data are displayed as described in Figure 4—figure supplement 8.
Figure 4—figure supplement 10
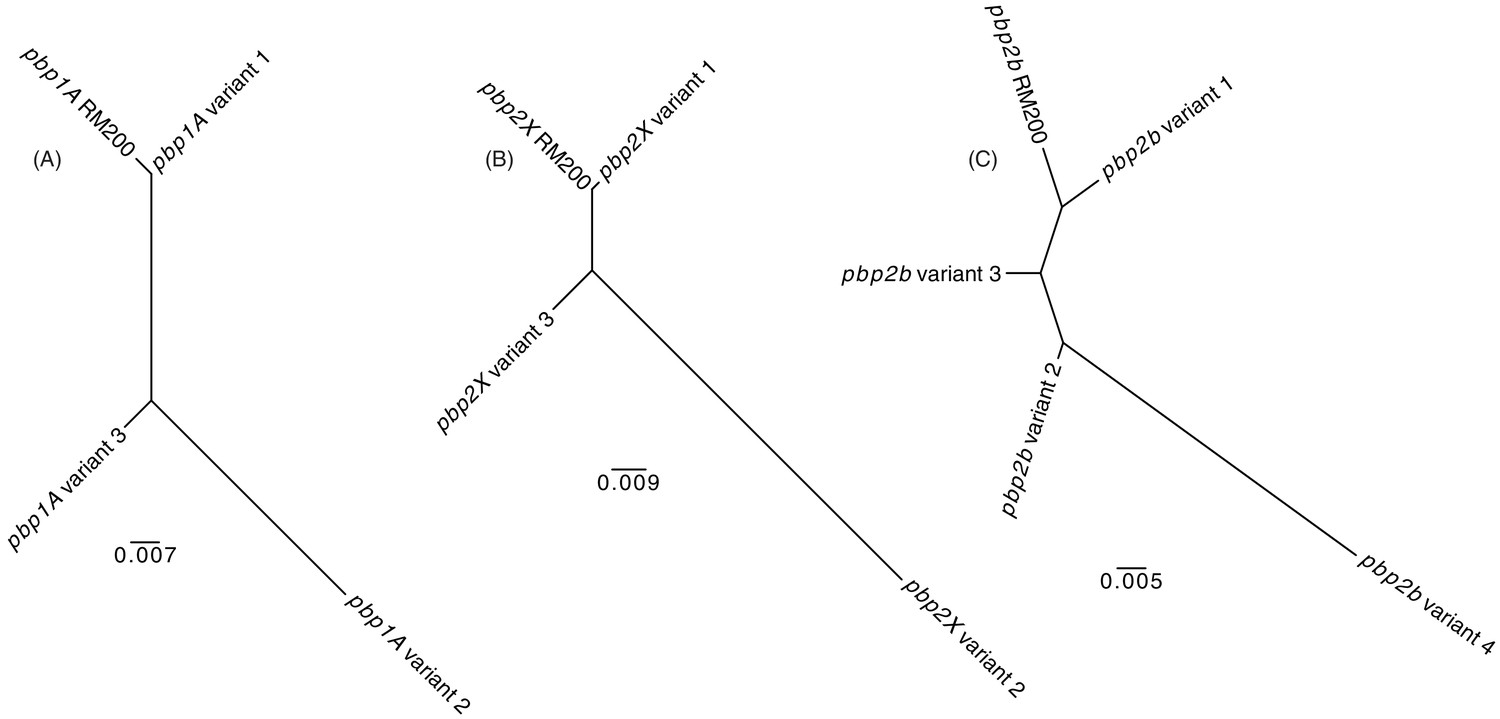
Maximum likelihood phylogenetic analysis of the S.
pneumoniae RM200 penicillin-binding proteins and orthologous variants on the proteome array. (A) Phylogeny demonstrating Pbp1A from RM200 is most similar to variant one on the array. (B) Phylogeny demonstrating Pbp2X from RM200 is most similar to variant one on the array. (C) Phylogeny demonstrating Pbp2B from RM200 is most similar to variant one on the array.
Figure 4—figure supplement 11

Changes in IgG binding to penicillin-binding protein variants.
Data are shown as described in Figure 4—figure supplement 8.
Figure 4—figure supplement 12
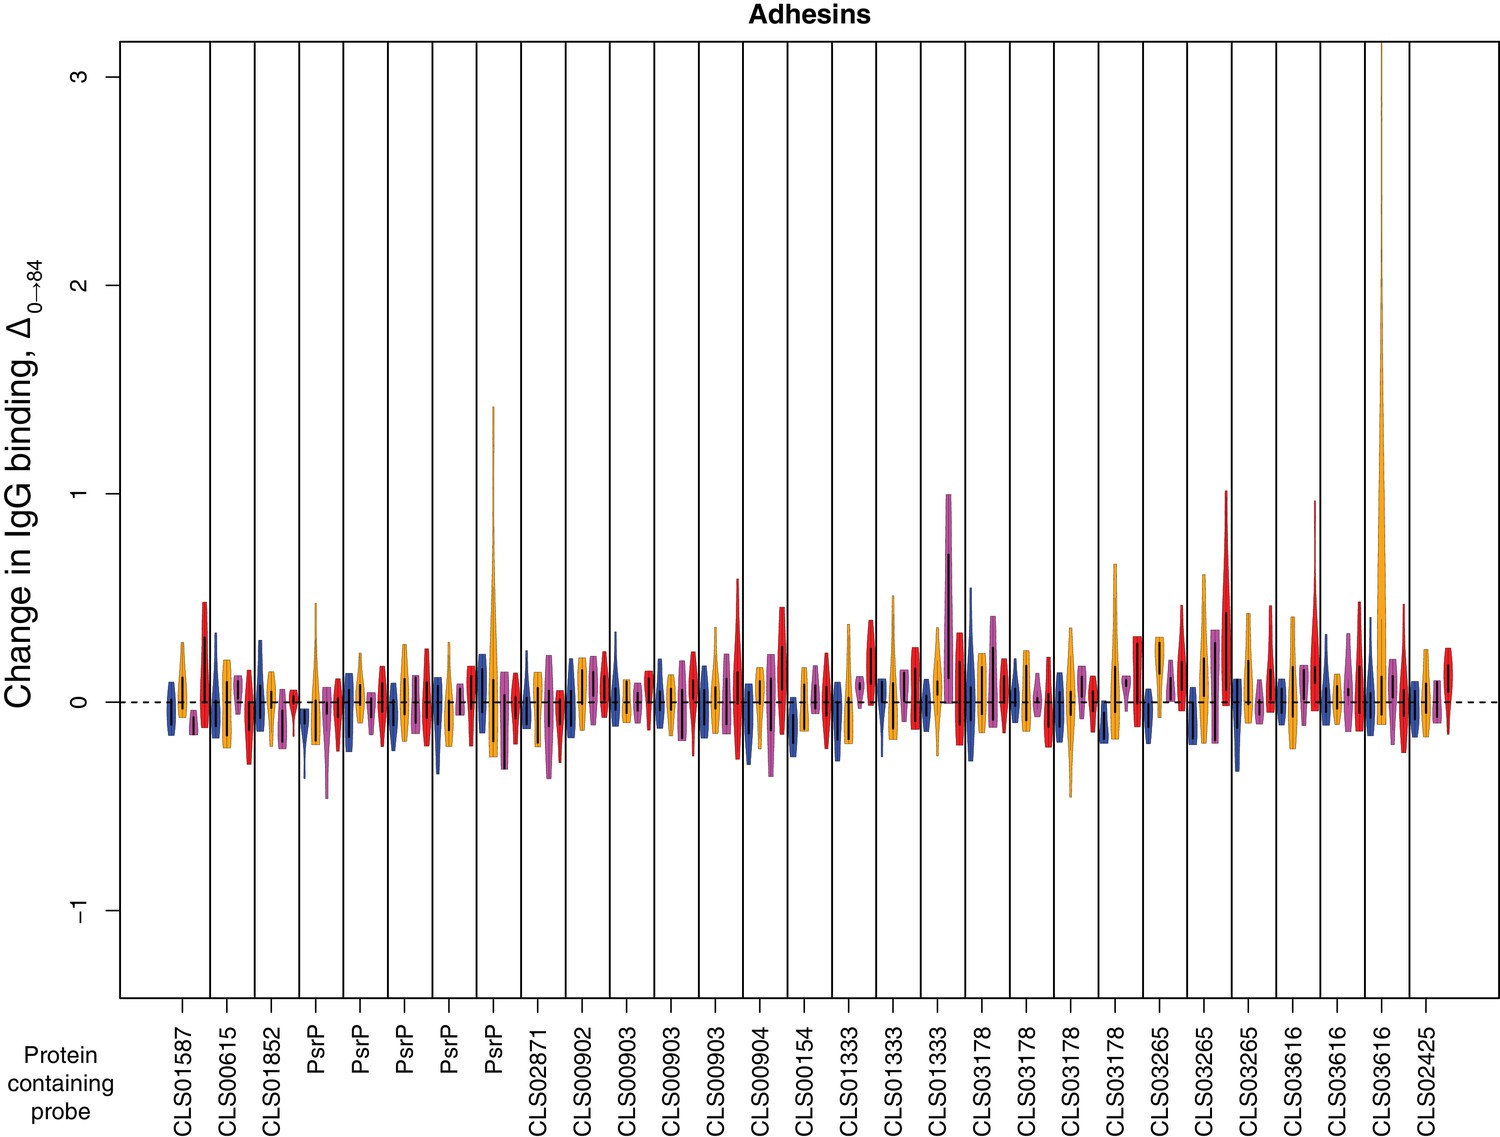
Change in IgG binding during the trial for adhesin proteins defined as antibody-binding targets on the basis of high pre-vaccination IgG binding.
Data are displayed as described in Figure 4—figure supplement 8.
Figure 4—figure supplement 13
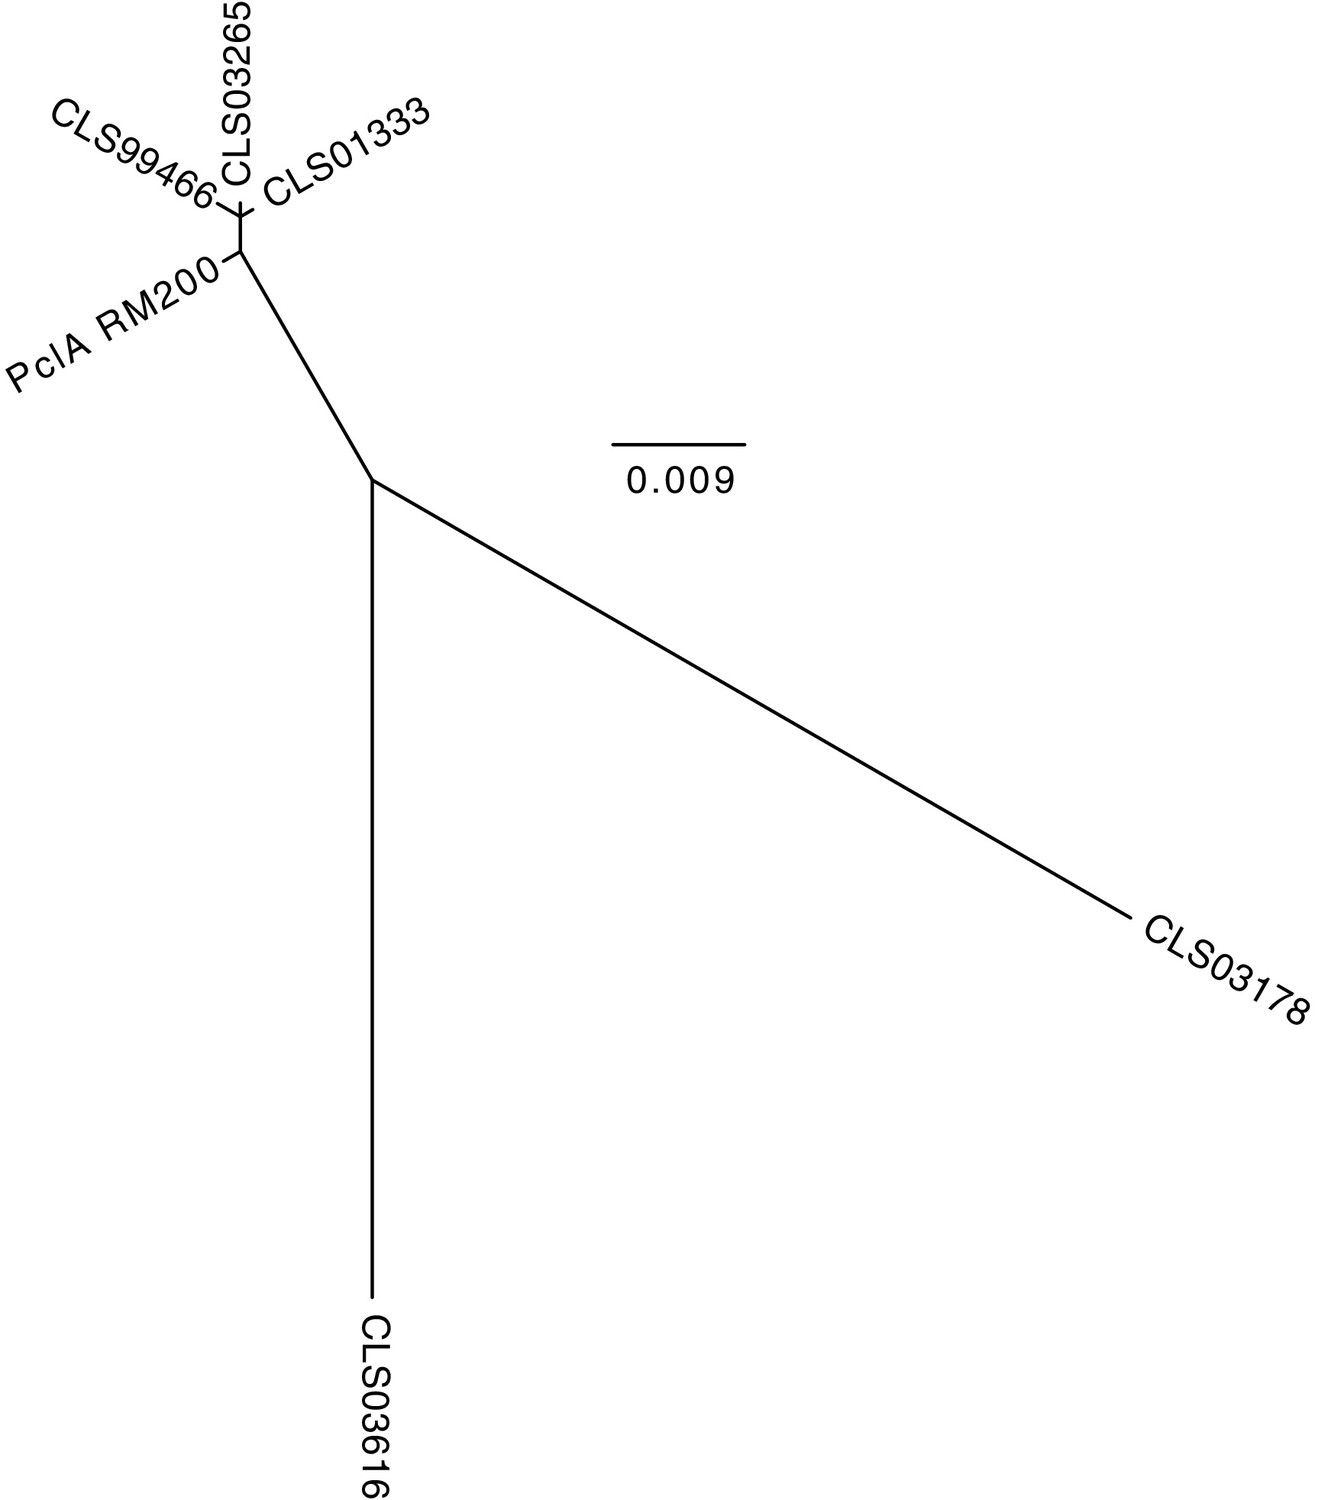
Maximum likelihood phylogenetic analysis of the S.
pneumoniae RM200 PclA sequence and the orthologous proteins on the proteome array. The tree shows that the RM200 protein is most similar to CLS01333 and CLS03265, as well as the truncated non-functional variant CLS99466. The CLS03616 and CLS03178 variants are highly diverged from the variant expressed by RM200.
Figure 4—figure supplement 14

Change in IgG binding to large antigenic structures.
Data are shown as in Figure 4—figure supplement 8. The type one and two pili, and the pneumococcal serine-rich repeat protein (PsrP), are all absent from S. pneumoniae RM200, and therefore WCV is not expected to trigger an elevated IgG response to these structures. The PclA variants CLS01333 and CLS03265 show some evidence of increased IgG binding, indicating the S. pneumoniae RM200 PclA protein is being recognised by WCV-induced antibodies.
Figure 4—figure supplement 15

Change in IgG binding during the trial for surface-associated degradative enzymes defined as antibody-binding targets on the basis of high pre-vaccination IgG binding.
Data are displayed as described in Figure 4—figure supplement 8.
Figure 5
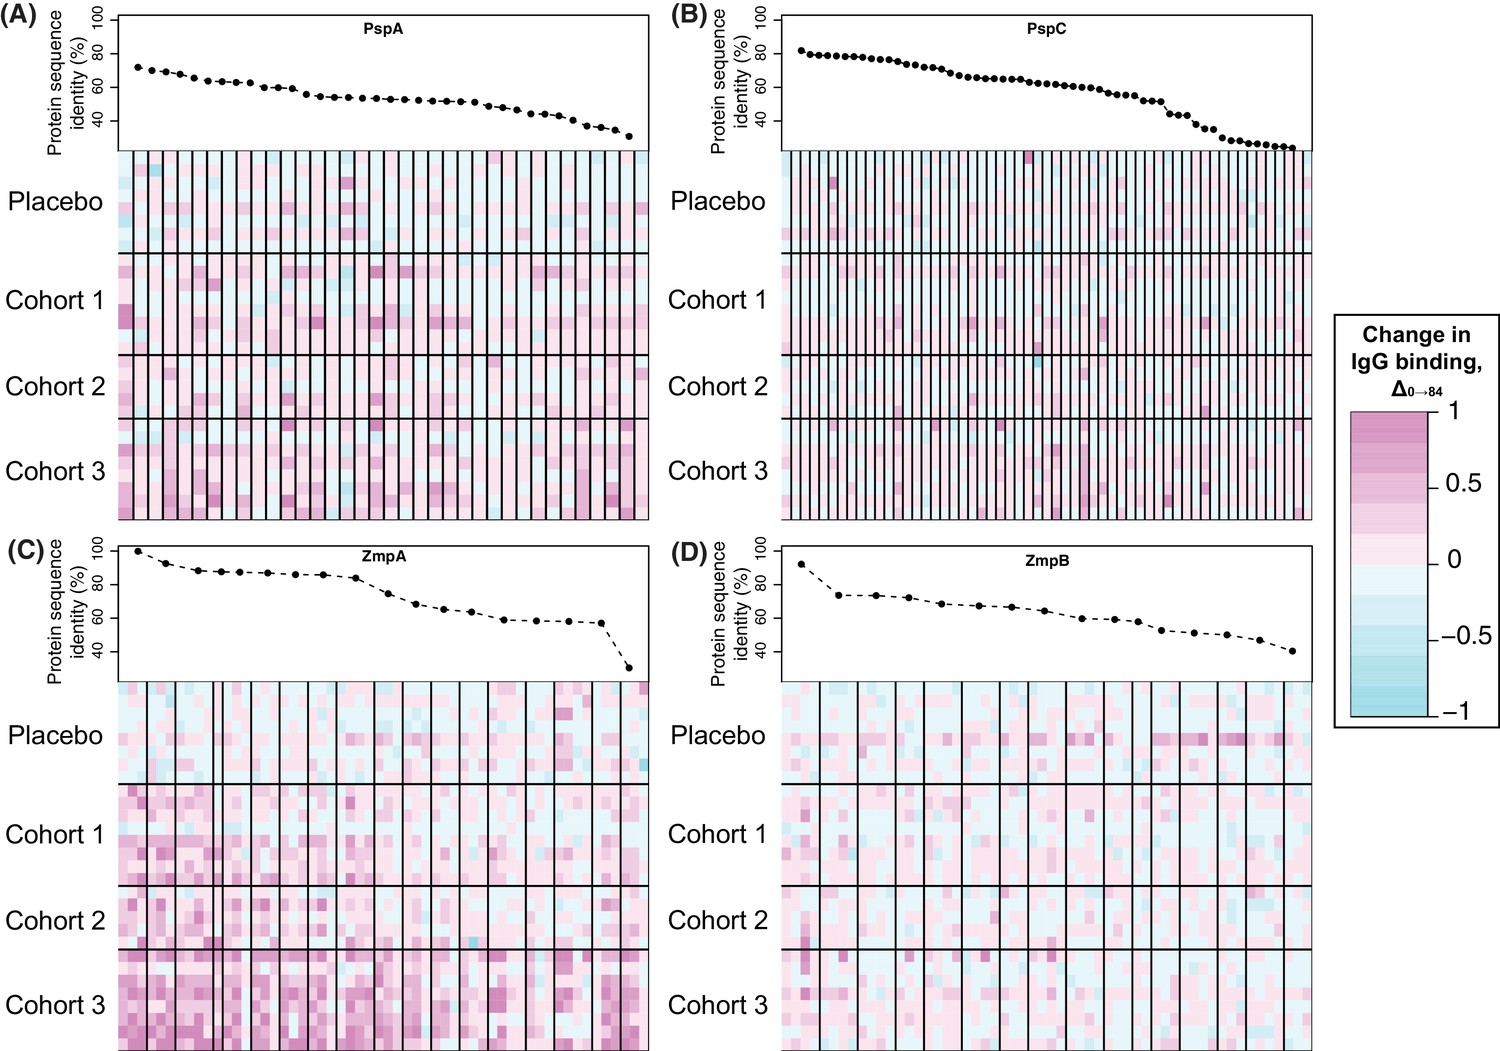
Changes in IgG binding to diverse core loci.
Each heatmap has a row for each of the 29 trial participants with samples at the start and end of the trial, ordered by cohort. Each column represents a probe on the proteome array, with vertical black bars separating the probes from different variants. The cells are coloured by the direction and magnitude of Δ0→84, with increasingly strong cyan representing reduced IgG binding over the duration of the trial, and increasingly strong magenta representing elevated IgG binding. The variants are ordered according to their similarity to the corresponding sequence in the WCV, with the most similar on the left, and least similar on the right. (A) Heatmap showing Δ0→84 for pneumococcal surface protein A (PspA) variants. (B) Heatmap showing Δ0→84 for pneumococcal surface protein C (PspC) variants. (C) Heatmap showing Δ0→84 for zinc metalloprotease A (ZmpA) variants. The large zinc metalloprotease proteins are typically represented by multiple probes. (D) Heatmap showing Δ0→84 for zinc metalloprotease B (ZmpB) variants.
Figure 6
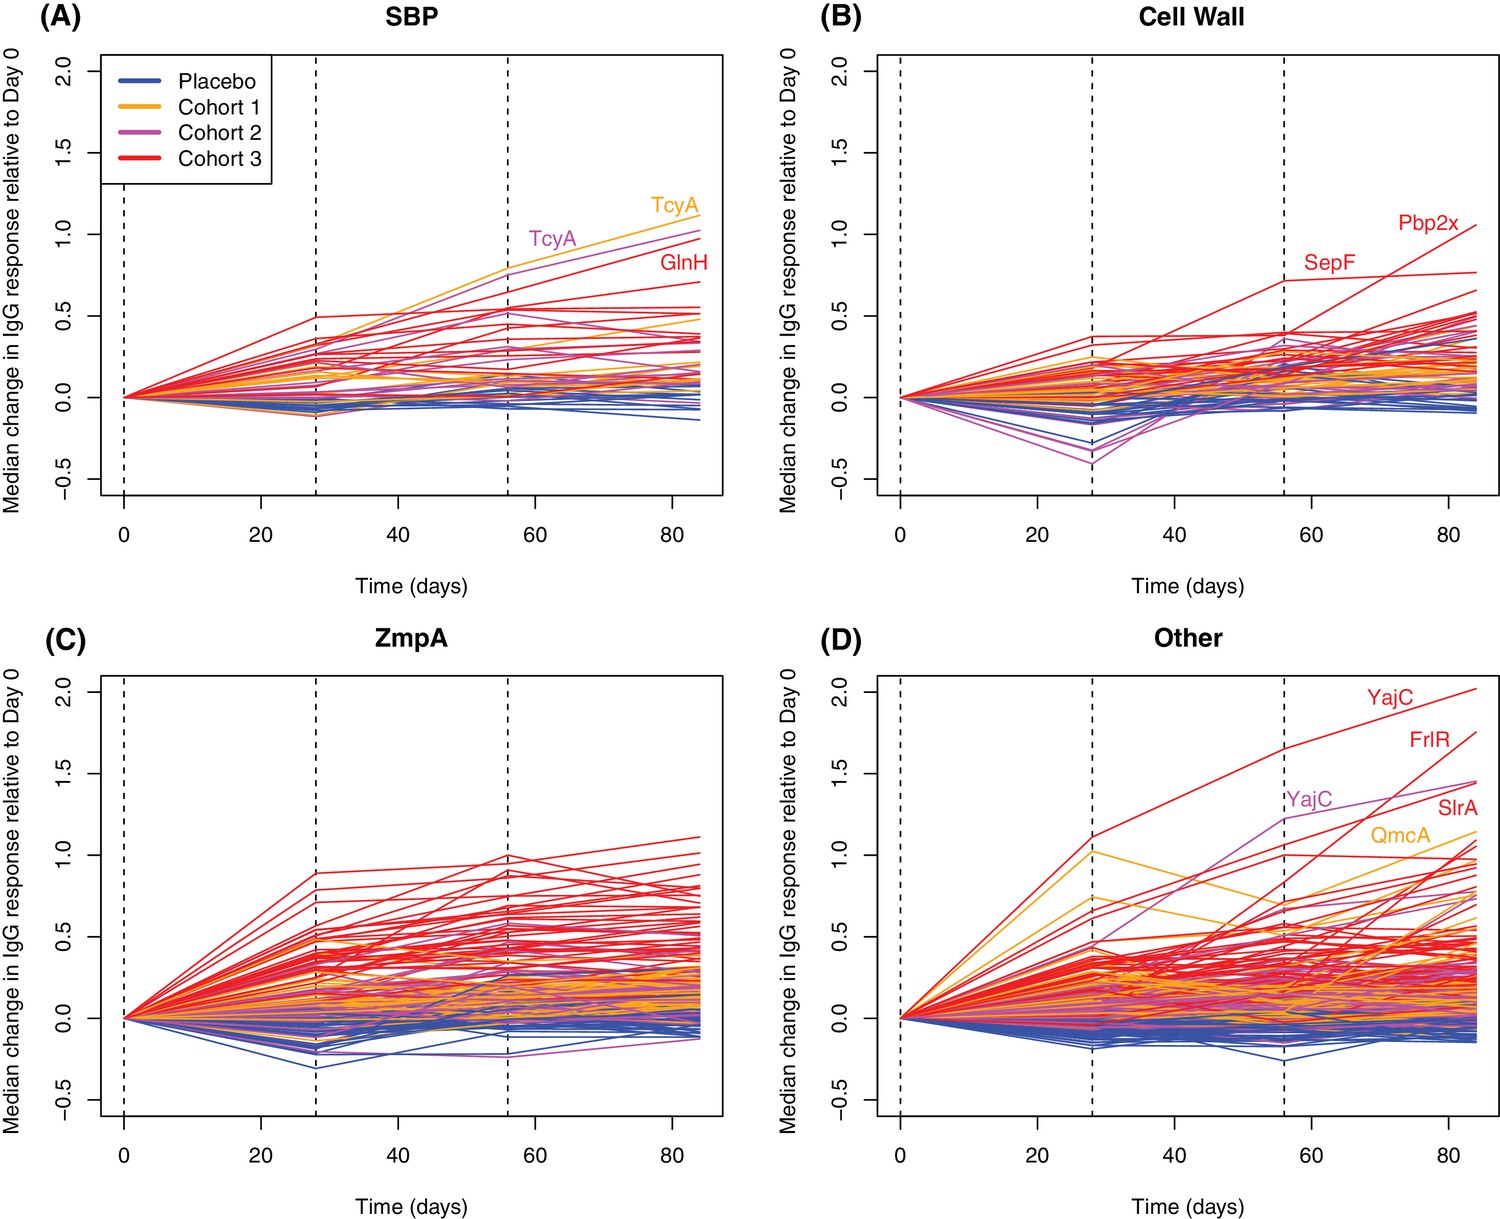
Longitudinal responses to successive WCV doses.
These plots show the within-cohort median change in IgG binding, relative to the level in the pre-vaccination sample, using data from the 27 individuals with samples taken at all four timepoints. The probes are functionally grouped as described in Supplementary file 2: (A) solute-binding proteins; (B) proteins involved in cell wall metabolism; (C) zinc metalloprotease A variants; and (D) other core proteins. Only probes found to have a significant increase in IgG binding after WCV administration by eBayes or LMM analyses are included. Between each sampled timepoint, the solid lines join the median IgG-binding values for the cohort indicated by their colour. Vertical dashed lines show times of WCV administration.
Figure 7
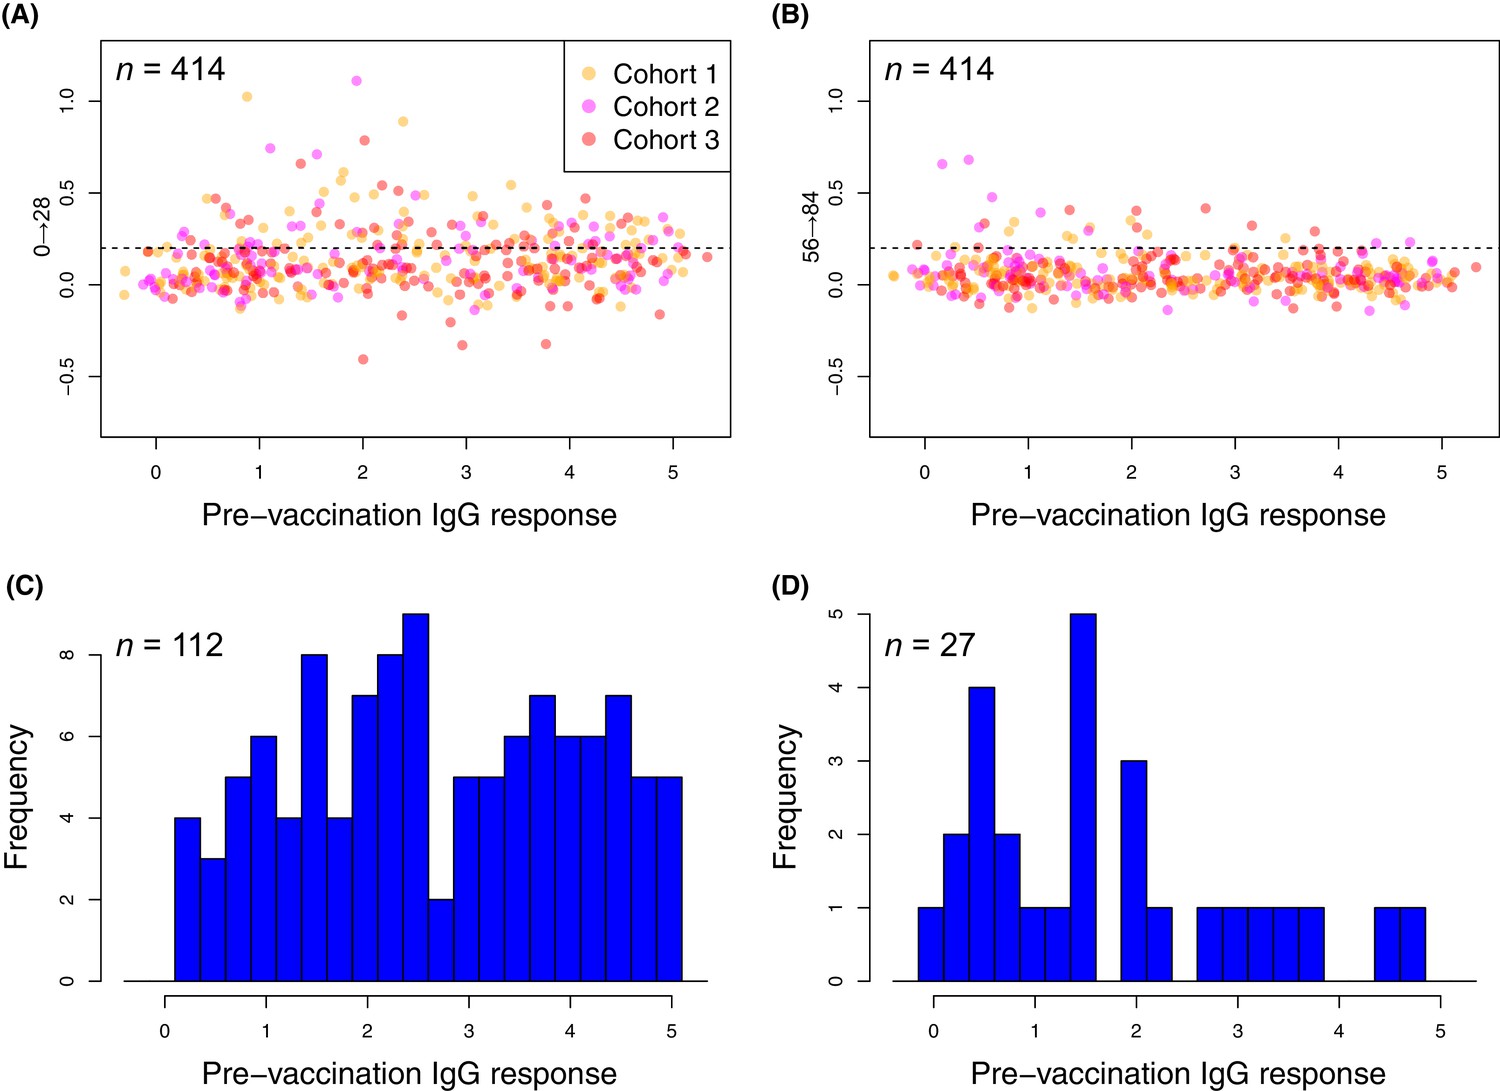
Changes in the within-cohort median IgG binding between consecutive timepoints.
(A and B) The scatterplots show 414 points, corresponding to the 138 probes found to have a significant increase in post-WCV IgG binding by the eBayes or LMM analyses in each of the three vaccinated cohorts, as no induced immunity is expected in the placebo group. The horizontal dashed line represents the empirically-determined threshold of 0.2 used for identifying those probes associated with an atypically large change in IgG binding between successive timepoints. Points are coloured according to the cohort from which they derive, as indicated by the key. Panel (A) shows the within-cohort median changes in IgG binding following the first inoculation (Δ0→28) relative to the within-cohort median pre-vaccination level of IgG binding. Panel (B) shows the equivalent plot following the third inoculation (Δ56→84). (C and D) For the responses (defined by probe and cohort) exceeding the specified threshold, the corresponding pre-vaccination IgG-binding values are shown by the histograms of within-cohort median IgG binding at day 0. Panel (C) shows the 112 high responses to the first WCV dose (Δ0→28 > 0.2) span the full range of pre-vaccine IgG-binding values, whereas panel (D) shows the 27 high responses to the third WCV dose (Δ56→84 > 0.2) are typically associated with low pre-vaccine IgG binding.
Tables
Table 1
Description of WCV antigenic proteins, represented by probes associated with significantly increased IgG binding following WCV administration by either the empirical Bayes or linear mixed effects analyses (Supplementary file 2).
Each protein is listed (either by common name, or COG assignation), alongside a functional annotation and the coding sequence for the orthologue in S. pneumoniae D39, where it could be identified. IgG-binding values were aggregated across all probes corresponding to the named protein that were associated with a significant change. Values are summarised as a median, with the interquartile range in parentheses. The columns show the median initial IgG binding to the probes across all cohorts, and the Δ0→84 values for each of the four cohorts separately. The final column identifies in which analyses the set of probes corresponding to the named protein were found to be associated with elevated IgG binding.
| Protein name | Functional annotation | S. pneumoniae D39 coding sequence | IgG binding at day 0 | Δ0->84 in placebo group | Δ0->84 in cohort 1 | Δ0->84 in cohort 2 | Δ0->84 in cohort 3 | Statistical analysis |
|---|---|---|---|---|---|---|---|---|
| AatB | Amino acid ABC transporter solute-binding protein AatB | SPD_1328 | 3.568 (2.920–4.247) | −0.078 (−0.126–0.105) | 0.105 (−0.004–0.204) | 0.096 (0.076–0.214) | 0.285 (0.155–0.747) | Both |
| AcoC | Dihydrolipoyllysine-residue acetyltransferase component of pyruvate dehydrogenase complex AcoC | SPD_1026 | 0.722 (0.381–1.346) | −0.149 (−0.180 - −0.053) | 0.021 (−0.049–0.475) | −0.003 (−0.062–0.019) | 0.463 (0.252–0.936) | Both |
| AliA | ABC oligopeptide transporter solute-binding protein AliA | SPD_0334 | 2.803 (2.141–3.679) | −0.085 (−0.149 - −0.008) | 0.042 (−0.076–0.086) | 0.203 (0.060–0.693) | 0.323 (0.179–0.576) | Both |
| AliB | Oligopeptide ABC transporter solute-binding protein AliB | SPD_1357 | 4.098 (3.457–4.553) | −0.018 (−0.111–0.094) | 0.142 (0.038–0.229) | 0.159 (0.015–0.305) | 0.159 (0.082–0.242) | Linear mixed effects |
| AmiA | Oligopeptide ABC transporter solute-binding protein AmiA | SPD_1671 | 3.680 (2.954–4.122) | −0.007 (−0.073–0.079) | 0.216 (0.068–0.489) | 0.343 (0.056–0.369) | 0.439 (0.259–0.532) | Linear mixed effects |
| BgaA | Beta-galactosidase BgaA | SPD_0562 | 3.583 (2.453–4.350) | −0.034 (−0.060–0.030) | 0.031 (−0.030–0.130) | 0.235 (0.069–0.328) | 0.399 (0.194–0.601) | Both |
| CBD | Choline-binding domain | - | 0.937 (0.579–1.498) | −0.106 (−0.118 - −0.027) | 0.086 (0.031–0.135) | 0.204 (0.157–0.215) | 0.589 (0.357–0.658) | Both |
| CibA | Competence-induced bacteriocin A | SPD_0133 | 0.678 (0.566–1.072) | 0.007 (−0.049–0.061) | 0.756 (0.173–1.957) | 0.755 (0.363–1.435) | 1.261 (0.228–2.579) | Linear mixed effects |
| CLS00168 | Uncharacterised membrane protein | SPD_0093 | 2.540 (1.470–3.075) | −0.069 (−0.116–0.040) | 0.238 (0.136–0.631) | 0.031 (0.005–0.039) | 0.422 (0.233–0.601) | Linear mixed effects |
| CLS00229 | Uncharacterised membrane protein | SPD_0174 | 0.204 (0.132–0.397) | 0.004 (−0.124–0.043) | 0.127 (0.021–0.291) | 0.032 (0.000–0.146) | 0.602 (0.263–1.727) | Both |
| CLS00234 | Uncharacterised lipoprotein | SPD_0179 | 3.575 (2.996–4.215) | −0.028 (−0.060–0.016) | 0.035 (0.004–0.114) | −0.033 (−0.066–0.145) | 0.522 (0.284–0.829) | Both |
| CLS00386 | Uncharacterised membrane protein | SPD_0342 | 3.870 (3.551–4.418) | −0.011 (−0.050–0.049) | 0.207 (0.148–0.301) | 0.160 (0.054–0.322) | 0.370 (0.180–0.517) | Both |
| CLS01171 | Conjugative element protein | - | 1.156 (0.968–1.327) | −0.049 (−0.139 - −0.016) | 0.020 (−0.048–0.108) | 0.042 (−0.050–0.058) | 0.146 (0.072–0.290) | Empirical Bayes |
| CLS01337 | Uncharacterised membrane protein | SPD_1380 | 1.123 (0.603–1.572) | −0.061 (−0.168–0.053) | 0.187 (0.007–0.987) | 0.132 (0.038–0.183) | 0.912 (0.708–1.116) | Both |
| CLS01383 | Uncharacterised membrane protein | SPD_1429 | 4.805 (3.976–5.309) | −0.015 (−0.058–0.006) | 0.190 (0.123–0.281) | 0.088 (0.043–0.340) | 0.226 (0.194–0.504) | Linear mixed effects |
| CLS01446 | Sialic acid and N-acetylmannosamine ABC transporter permease | SPD_1500 | 0.033 (−0.086–0.080) | −0.118 (−0.175 - −0.074) | 0.074 (−0.039–0.175) | 0.073 (0.062–0.126) | 0.187 (−0.004–0.259) | Linear mixed effects |
| CLS01563 | ROK-family transcriptional repressor protein | - | 1.502 (1.030–1.894) | −0.098 (−0.141 - −0.039) | 0.049 (−0.045–0.499) | 0.028 (−0.003–0.044) | 0.248 (0.172–0.653) | Linear mixed effects |
| CLS01820 | Uncharacterised exported protein | SPD_1928 | 0.118 (−0.012–0.276) | −0.045 (−0.064–0.075) | 0.092 (0.012–0.152) | 0.118 (0.048–0.123) | 0.261 (0.102–0.460) | Both |
| CLS02831 | Bacteriocin ABC processing efflux pump | SPD_1752 | 1.000 (0.685–1.397) | −0.013 (−0.124–0.038) | 0.135 (0.058–0.236) | 0.110 (0.074–0.178) | 0.375 (0.299–0.485) | Both |
| CLS02897 | Uncharacterised membrane protein (fragment) | - | 0.683 (0.469–0.887) | −0.066 (−0.198–0.131) | 0.085 (−0.003–0.136) | 0.120 (0.061–0.248) | 0.175 (0.075–0.243) | Linear mixed effects |
| DnaK | Chaperone protein DnaK | SPD_0460 | 0.275 (0.178–0.657) | −0.041 (−0.219–0.013) | 0.059 (−0.015–0.100) | 0.088 (0.001–0.236) | 0.375 (0.020–2.027) | Linear mixed effects |
| Dpr | DNA protection during starvation stress resistance protein Dpr | SPD_1402 | 0.988 (0.467–1.541) | 0.038 (−0.056–0.223) | 0.114 (0.034–0.219) | 0.192 (−0.031–0.462) | 0.149 (0.066–0.366) | Linear mixed effects |
| EzrA | Septation ring formation regulator EzrA | SPD_0710 | 2.400 (1.520–3.755) | −0.016 (−0.041–0.002) | 0.195 (0.096–0.258) | 0.100 (−0.014–0.120) | 0.560 (0.140–0.646) | Both |
| FabE | Biotin carboxyl carrier protein of acetyl-CoA carboxylase FabE | SPD_0386 | −0.206 (−0.459–0.513) | −0.021 (−0.119–0.031) | 0.187 (0.033–0.274) | 0.270 (0.100–0.295) | 0.408 (0.014–0.716) | Linear mixed effects |
| FrlR | HTH-type transcriptional repressor FrlR | SPD_0064 | 0.445 (0.205–0.942) | −0.039 (−0.085–0.071) | 0.615 (0.117–1.452) | 0.283 (0.231–0.730) | 1.986 (1.454–2.437) | Both |
| FruA | Fructose PTS transporter protein FruA | SPD_0773 | 1.044 (0.568–1.389) | −0.029 (−0.125 - −0.002) | 0.480 (0.118–0.817) | 0.335 (0.322–0.360) | 0.591 (0.406–0.770) | Linear mixed effects |
| GalT | Galactose-1-phosphate uridylyltransferase GalT | SPD_1633 | 0.295 (0.211–0.494) | −0.024 (−0.055–0.047) | −0.110 (−0.220 - −0.034) | −0.068 (−0.082–0.012) | −0.018 (−0.129 - −0.005) | Linear mixed effects |
| GlnH | ABC glutamine transporter solute-binding protein GlnH | SPD_1226 | 2.912 (1.858–4.006) | 0.047 (−0.094–0.099) | 0.192 (0.059–0.274) | 0.289 (0.204–0.393) | 0.770 (0.336–1.163) | Both |
| GlnPH1 | Glutamine ABC transporter permease GlnPH1 | SPD_0412 | 1.029 (0.573–1.920) | −0.026 (−0.046–0.169) | 0.178 (0.133–0.387) | 0.278 (0.105–0.447) | 0.495 (0.258–0.576) | Both |
| GlnPH4 | Amino acid ABC transporter permease GlnPH4 | SPD_1098 | 4.006 (3.344–4.515) | 0.083 (−0.016–0.317) | 0.089 (0.019–0.155) | 0.154 (0.006–0.296) | 0.269 (0.173–0.367) | Linear mixed effects |
| GroEL | Chaperonin GroEL | SPD_1709 | 2.252 (1.129–3.083) | −0.057 (−0.101–0.010) | 0.396 (0.194–0.571) | 0.068 (−0.033–0.856) | 0.426 (0.107–0.963) | Both |
| HtrA | Surface-associated serine protease HtrA | SPD_2068 | 2.617 (2.002–3.293) | 0.011 (−0.000–0.061) | 0.262 (0.102–0.578) | 0.052 (0.029–0.297) | 0.519 (0.220–0.816) | Both |
| HylD | Efflux pump protein HylD | SPD_0686 | 4.590 (4.065–4.848) | −0.045 (−0.091–0.011) | 0.177 (−0.027–0.295) | 0.259 (0.083–0.264) | 0.319 (0.178–0.489) | Linear mixed effects |
| LemA | Uncharacterised membrane protein LemA | SPD_1139 | 0.473 (0.151–1.041) | −0.003 (−0.103–0.103) | 0.170 (0.110–0.457) | 0.300 (0.004–0.392) | 0.855 (0.635–2.035) | Both |
| LytA | Lytic amidase A | SPD_1737 | 3.547 (2.672–3.735) | 0.032 (−0.094–0.103) | 0.098 (0.029–0.221) | 0.021 (−0.012–0.066) | 0.158 (0.067–0.190) | Linear mixed effects |
| LytR | Teichoic acid attachment protein LytR | SPD_1741 | 4.015 (3.488–4.455) | 0.022 (−0.087–0.084) | 0.149 (−0.003–0.235) | 0.074 (−0.052–0.080) | 0.217 (0.152–0.299) | Linear mixed effects |
| ManL | Glucose, mannose, galactose, fructose, N-acetylglucosamine and glucosamine ABC transporter ATPase ManL | SPD_0264 | 0.803 (0.374–1.553) | 0.000 (−0.104–0.059) | 0.460 (0.129–0.907) | 0.070 (0.052–0.469) | 1.083 (0.833–1.346) | Both |
| MltG | Endolytic murein transglycosylase MltG | SPD_1346 | 2.993 (2.330–3.371) | −0.087 (−0.119–0.055) | 0.249 (0.110–0.283) | 0.253 (0.060–0.401) | 0.491 (0.338–0.753) | Both |
| MreC | Peptidoglycan formation protein C MreC | SPD_2045 | 2.947 (1.440–4.467) | 0.133 (−0.048–0.199) | 0.092 (−0.021–0.219) | 0.123 (0.095–0.138) | 0.172 (0.076–0.344) | Linear mixed effects |
| Pbp1a | Penicillin-binding protein 1A | SPD_0336 | 1.543 (0.999–1.915) | −0.066 (−0.111–0.049) | 0.138 (0.016–0.256) | 0.082 (0.042–0.092) | 0.357 (0.192–0.734) | Both |
| Pbp1b | Penicillin-binding protein 1B | SPD_1925 | 0.615 (0.366–0.867) | −0.039 (−0.088–0.001) | 0.023 (−0.004–0.151) | 0.070 (−0.056–0.157) | 0.216 (0.108–0.412) | Empirical Bayes |
| Pbp2b | Penicillin-binding protein 2B | SPD_1486 | 4.348 (3.623–4.958) | −0.017 (−0.105–0.065) | 0.161 (0.037–0.293) | 0.426 (0.137–0.532) | 0.520 (0.189–0.770) | Both |
| Pbp2x | Penicillin-binding protein 2X | SPD_0306 | 2.934 (2.261–3.653) | 0.044 (−0.082–0.262) | 0.245 (0.012–0.426) | 0.174 (0.041–0.616) | 0.626 (0.315–1.174) | Both |
| Pbp3 | D-alanyl-D-alanine carboxypeptidase Pbp3 | SPD_0767 | 1.981 (1.253–3.408) | 0.006 (−0.031–0.036) | 0.053 (−0.030–0.137) | 0.042 (−0.020–0.448) | 0.209 (0.121–0.741) | Linear mixed effects |
| PclA | Pneumococcal collagen-like protein A | SPD_1376 | 0.638 (0.317–0.984) | −0.066 (−0.154 - −0.002) | 0.078 (−0.047–0.248) | 0.063 (0.007–0.163) | 0.177 (0.067–0.321) | Both |
| PgdA | Peptidoglycan-N-acetylglucosamine deacetylase PgdA | SPD_1309 | 2.407 (1.971–3.550) | −0.089 (−0.135–0.041) | 0.438 (0.154–0.812) | 0.111 (−0.004–0.286) | 0.511 (0.197–0.986) | Both |
| PiaA | Iron ABC transporter substrate-binding protein PiaA | SPD_0915 | 4.442 (4.142–4.795) | 0.001 (−0.076–0.086) | 0.086 (0.047–0.148) | 0.143 (0.127–0.145) | 0.287 (0.191–0.357) | Linear mixed effects |
| PiuA | Iron ABC transporter solute-binding protein PiuA | SPD_1652 | 3.593 (2.744–4.086) | 0.011 (−0.078–0.034) | 0.088 (−0.020–0.203) | 0.106 (0.091–0.167) | 0.410 (0.276–0.452) | Both |
| Ply | Pneumolysin | SPD_1726 | 1.306 (0.576–1.604) | −0.120 (−0.158 - −0.068) | 0.393 (0.205–0.428) | 0.338 (0.313–0.478) | 0.322 (0.162–0.799) | Both |
| PnrA | Ribonucleoside ABC transporter solute- binding protein | SPD_0739 | 4.634 (4.086–4.998) | −0.028 (−0.072–0.043) | 0.116 (0.047–0.203) | 0.084 (0.073–0.262) | 0.205 (0.112–0.464) | Linear mixed effects |
| PpmA | Foldase protein PpmA | SPD_0868 | 3.531 (2.883–4.059) | 0.079 (−0.078–0.112) | 0.412 (0.226–0.578) | 0.284 (0.264–0.825) | 0.594 (0.263–0.727) | Linear mixed effects |
| PppL | Protein phosphatase PhpP | SPD_1543 | 0.906 (0.711–1.867) | −0.066 (−0.253–0.005) | −0.066 (−0.195–0.189) | 0.021 (0.008–0.089) | 0.443 (0.055–0.630) | Empirical Bayes |
| PspA | Pneumococcal surface protein A | SPD_0126 | 3.616 (2.076–4.672) | −0.032 (−0.124–0.051) | 0.124 (0.023–0.241) | 0.144 (0.022–0.280) | 0.301 (0.103–0.484) | Both |
| PspC | Pneumococcal surface protein C | SPD_2017 | 2.810 (1.334–3.682) | −0.066 (−0.122–0.034) | 0.122 (−0.001–0.212) | 0.124 (0.060–0.188) | 0.285 (0.156–0.452) | Both |
| Psr | Teichoic acid attachment protein Psr | SPD_1202 | 2.198 (1.514–2.946) | −0.028 (−0.081–0.069) | 0.161 (0.023–0.212) | 0.120 (0.089–0.333) | 0.328 (0.222–0.548) | Linear mixed effects |
| PstS2 | Phosphate ABC transporter solute-binding protein PstS2 | SPD_1232 | 3.479 (1.676–4.508) | 0.021 (−0.010–0.134) | 0.203 (−0.091–0.613) | −0.034 (−0.037 - −0.012) | 0.603 (0.314–0.945) | Linear mixed effects |
| PyrK | Dihydroorotate dehydrogenase B (NAD(+)) electron transfer subunit PyrK | SPD_0851 | 0.809 (0.643–0.991) | −0.087 (−0.139 - −0.020) | 0.032 (−0.080–0.058) | 0.014 (0.002–0.018) | 0.182 (0.143–0.225) | Empirical Bayes |
| QmcA | Membrane-associated protease regulator QmcA | SPD_1984 | 1.297 (0.852–1.812) | −0.041 (−0.094–0.013) | 1.144 (0.435–1.718) | 0.776 (0.643–1.311) | 1.249 (0.857–2.103) | Both |
| RexA | ATP-dependent helicase/nuclease subunit RexA | SPD_1016 | 0.443 (0.110–1.147) | −0.047 (−0.159–0.058) | 0.052 (−0.010–0.167) | 0.068 (0.024–0.073) | 0.401 (0.183–0.547) | Empirical Bayes |
| RmuC | DNA recombination protein RmuC | SPD_1778 | 2.496 (2.268–3.737) | −0.042 (−0.091–0.065) | 0.197 (0.080–0.241) | −0.006 (−0.041–0.092) | 0.253 (0.129–0.385) | Both |
| SepF | Cell division protein SepF | SPD_1477 | 0.427 (−0.263–1.073) | 0.079 (0.018–0.177) | 0.182 (0.033–0.646) | 0.083 (0.056–0.332) | 0.766 (0.324–1.050) | Both |
| SlrA or PpiA | Peptidyl-prolyl cis-trans isomerase SlrA or PpiA | SPD_0672 | 1.920 (1.103–3.274) | −0.006 (−0.061–0.091) | 0.551 (0.297–0.988) | 0.732 (0.691–0.858) | 1.360 (1.190–2.095) | Both |
| StkP | Serine/threonine-protein kinase StkP | SPD_1542 | 3.847 (3.282–4.111) | 0.047 (0.013–0.110) | 0.112 (0.096–0.124) | −0.004 (−0.076–0.087) | 0.178 (0.107–0.252) | Linear mixed effects |
| TagB | Membrane-associated protein TagB | SPD_1197 | 0.956 (0.797–1.621) | −0.038 (−0.075–0.075) | 0.074 (0.029–0.130) | 0.162 (0.145–0.163) | 0.124 (0.083–0.212) | Linear mixed effects |
| TcyA | ABC amino acid transporter solute-binding protein TcyA | SPD_0150 | 1.815 (1.279–2.538) | −0.096 (−0.160–0.055) | 1.117 (0.849–1.319) | 1.025 (0.324–1.724) | 0.947 (0.477–2.225) | Both |
| TprA | Quorum-sensing PclR-type transcriptional regulator TprA | SPD_1745 | 1.008 (0.654–1.284) | −0.054 (−0.099 - −0.039) | 0.029 (−0.092–0.095) | 0.056 (0.010–0.205) | 0.394 (0.237–0.474) | Both |
| Tuf | Elongation factor Tu | SPD_1318 | 0.306 (−0.003–1.146) | −0.065 (−0.323–0.006) | 0.777 (0.246–1.589) | −0.003 (−0.189–0.001) | 1.107 (0.481–1.483) | Both |
| YajC | Preprotein translocase YajC subunit | SPD_1838 | 1.580 (1.060–2.363) | −0.051 (−0.133–0.021) | 0.967 (0.494–2.145) | 1.454 (0.740–1.689) | 1.610 (0.977–2.225) | Both |
| YbbR | Uncharacterised protein YbbR | SPD_1391 | 3.584 (2.730–4.405) | −0.015 (−0.094–0.146) | 0.021 (−0.057–0.131) | −0.021 (−0.034–0.110) | 0.199 (0.060–0.540) | Linear mixed effects |
| YneF | Uncharacterised protein YneF | SPD_1662 | 0.187 (0.042–0.419) | −0.060 (−0.090–0.015) | 0.047 (−0.083–0.266) | 0.263 (0.133–0.299) | 0.314 (0.209–0.544) | Linear mixed effects |
| YoxC | Uncharacterised membrane protein YoxC | SPD_1242 | 0.160 (0.083–0.368) | 0.093 (0.041–0.170) | 0.107 (0.018–0.251) | 0.183 (0.123–0.226) | 0.410 (0.123–1.580) | Linear mixed effects |
| ZmpA | Zinc metalloprotease A | SPD_1018 | 3.084 (1.841–4.307) | −0.031 (−0.110–0.085) | 0.161 (0.043–0.288) | 0.142 (0.016–0.279) | 0.479 (0.260–0.700) | Both |
| ZmpB | Zinc metalloprotease B | SPD_0577 | 1.149 (0.436–2.096) | −0.042 (−0.152–0.032) | 0.127 (−0.031–0.206) | 0.089 (−0.037–0.202) | 0.139 (0.069–0.264) | Both |
Key resources table
| Reagent type (species) or resource | Designation | Source or reference | Identifiers | Additional information |
|---|---|---|---|---|
| strain | Streptococcus pneumoniae RM200 | PMID:20427625 | ENA:SAMEA104558347 | Dr. Rick Malley (Boston Children’s Hospital) |
| commercial assay | Streptococcus pneumoniae Pan-Genome Microarray | Antigen Discovery Inc. | Dr. Joseph Campo (Antigen Discovery Inc.) | |
| software | R | https://www.r-project.org/ |
Additional files
-
Supplementary file 1
Relationship between sequences on the proteome array and those in RM200.
The 2190 proteins on the array selected based on the pneumococcal population in Massachusetts (Croucher et al., 2013b) are annotated and functionally classified in the first four columns, as described previously (Croucher et al., 2017). The four columns on the right show the distribution of these protein in S. pneumoniae RM200, the strain included in the WCV, as well as representatives of two closely-related species: S. mitis B6, and S. pseudopneumoniae IS7493. Where a protein is absent from a genome, there is a dash in the corresponding cell; otherwise, the sequence identity calculated from a pairwise alignment of protein sequences with MAFFT is shown.
- https://doi.org/10.7554/eLife.37015.032
-
Supplementary file 2
Significant changes in IgG binding identified by empirical Bayes and linear mixed effects model analyses.
Each row corresponds to a probe on the proteome array associated with a significant change in IgG binding following WCV administration. The first six columns describe the functional annotation and classification of the corresponding protein, as well as whether it was categorised as an antibody-binding target (ABT) on the basis of high IgG binding in the pre-vaccination sample (Croucher et al., 2017). The next six columns contain statistics from the empirical Bayes analysis, in cases where there was a significant difference in Δ0→84 between cohort three and the placebo group; otherwise, the cells contain ‘NA’. These numbers describe the comparison of Δ0→84 values between cohort three and the placebo group. The t statistic and B value, representing the log odds that the IgG binding differs between cohort three and the placebo group, are shown, along with the p values following individual tests, and after a Benjamini-Hochberg correction. The next four columns show the empirical Bayes statistics for an identical analysis in which all probes corresponding to the DCL were excluded. The next four columns show the output of the linear mixed effects model test for probes exhibiting a significantly increasing trend in IgG binding over the duration of the trial; otherwise, the cells contain ‘NA’. The time coefficient describes the change in IgG binding over the trial in the vaccinated cohorts; only one probe has a negative coefficient, indicating vaccine doses reduced IgG binding over time. The table also shows calculation of a χ2 statistic as part of a likelihood ratio test conducted against a linear mixed effects model with no time-dependent term, the resulting raw likelihood ratio, and the Benjamini-Hochberg corrected p value. The final two columns show the likelihood and adjusted p values for the same statistical test conducted with all DCL probes excluded; only the latter value differs between the two analyses.
- https://doi.org/10.7554/eLife.37015.033
-
Supplementary file 3
Protein features associated with elevated IgG responses following the administration of WCV.
This multivariable logistic binary regression analysis fitted a model combining the explanatory variables of different protein characteristics to the binary dependent variable of whether or not a protein provoked an elevated IgG response, based on the probes listed in Supplementary file 2. The analysis removed variables preventing a maximum likelihood estimate, and the fitted model was refined by stepwise model selection based on Akaike information criterion (AIC) values. The table lists the features found to significantly associate with being identified as inducing a WCV-induced response: the protein’s length, having a signal peptide for secretion, and possessing the listed functional motifs. The lipoprotein motif and SNP_bac_3 domains are associated with the solute-binding proteins of transporters, and the Transpeptidase domain is associated with cell wall metabolism proteins.
- https://doi.org/10.7554/eLife.37015.034
-
Transparent reporting form
- https://doi.org/10.7554/eLife.37015.035
Download links
A two-part list of links to download the article, or parts of the article, in various formats.
Downloads (link to download the article as PDF)
Open citations (links to open the citations from this article in various online reference manager services)
Cite this article (links to download the citations from this article in formats compatible with various reference manager tools)
Panproteome-wide analysis of antibody responses to whole cell pneumococcal vaccination
eLife 7:e37015.
https://doi.org/10.7554/eLife.37015


