Arabidopsis RNA processing factor SERRATE regulates the transcription of intronless genes
- University of Tuebingen, Germany
- Chemical Genomics Centre (CGC) of the Max Planck Society, Germany
- Max Planck Institute for Developmental Biology, Germany
- University of Oldenburg, Germany
- Umeå University, Sweden
Figures
Figure 1 with 1 supplement
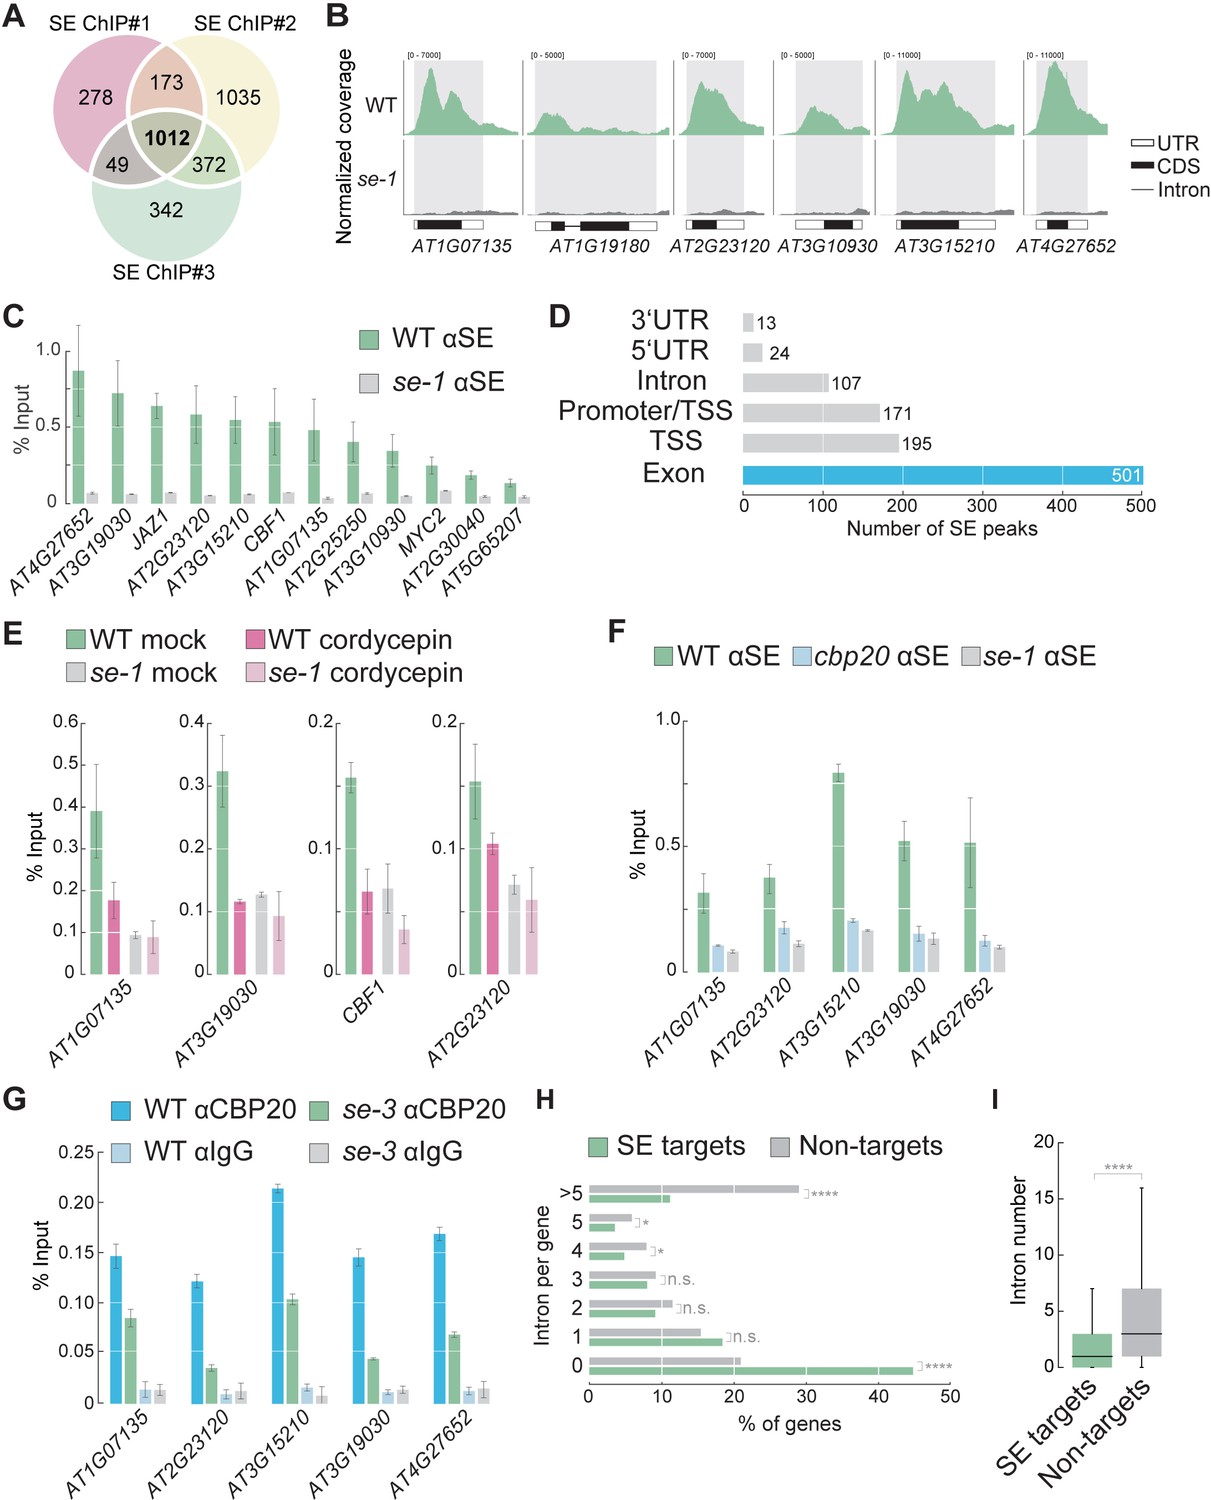
SE associates with intronless genes in a transcription dependent manner.
(A) Venn diagram showing the overlap of SE ChIP-seq targets in three independent biological replicates. (B) Visualization of SE ChIP-seq data in WT and se-1. Tracks showing counts of sequencing reads mapped to the depicted genomic loci. (C) Validation of SE targets by ChIP-qPCR using SE-specific antibodies in WT and se-1 mutants. Quantification of enriched DNA fragments was performed by qPCR. Error bars indicate the range of two independent biological experiments. (D) Annotation of the 1012 SE-ChIP targets sites. Peaks are categorized in six distinct classes: promoter-transcription start site (promoter-TSS), transcription start site (TSS), 5’-UTR, exon, intron, 3’-UTR. Y-axis denote the number SE peaks within each category. (E) Analysis of SE enrichment at selected targets by ChIP-qPCR in the presence and absence of the transcriptional inhibitor cordycepin. Error bars indicate mean ± SEM of three independent biological replicates. (F) Analysis of SE enrichment at SE target loci in WT, se-1 and cbp20 mutants by ChIP-qPCR. Error bars indicate mean ± SEM of three independent biological replicates. (G) Analysis of CBP20 enrichment at SE target loci in WT and se-3 mutants by ChIP-qPCR using a CBP20-specific antibody. Rabbit IgG served as a background control. Error bars indicate mean ± SEM of three biological replicates. (H) Classification of SE target genes and non-targets based on intron number. A Fisher’s exact test was performed to access whether differences between SE targets and non-targets were significant. *p<0.05; ****p<0.0001; n.s, not significant (I) Box blots comparing number of introns per gene in SE target genes and non-targets. SE targets are significantly enriched for low numbers of introns compared to non-SE targets (Wilcoxon-Mann-Whitney test). ****p<0.0001.
Figure 1—figure supplement 1
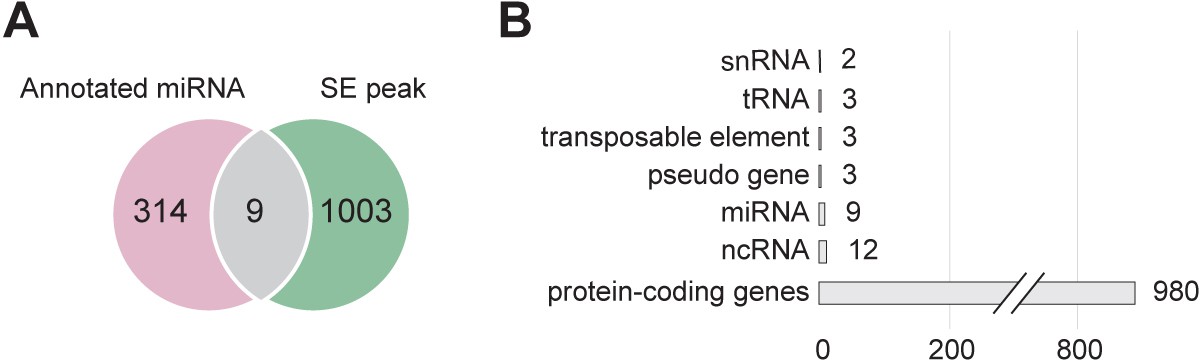
SE mainly binds to protein-coding genes.
(A) Venn diagram showing the overlap between SE-ChIP targets and annotated MIRNA genes. (B) Classification of SE target genes in protein-coding genes and various non-coding genes.
Figure 2 with 3 supplements
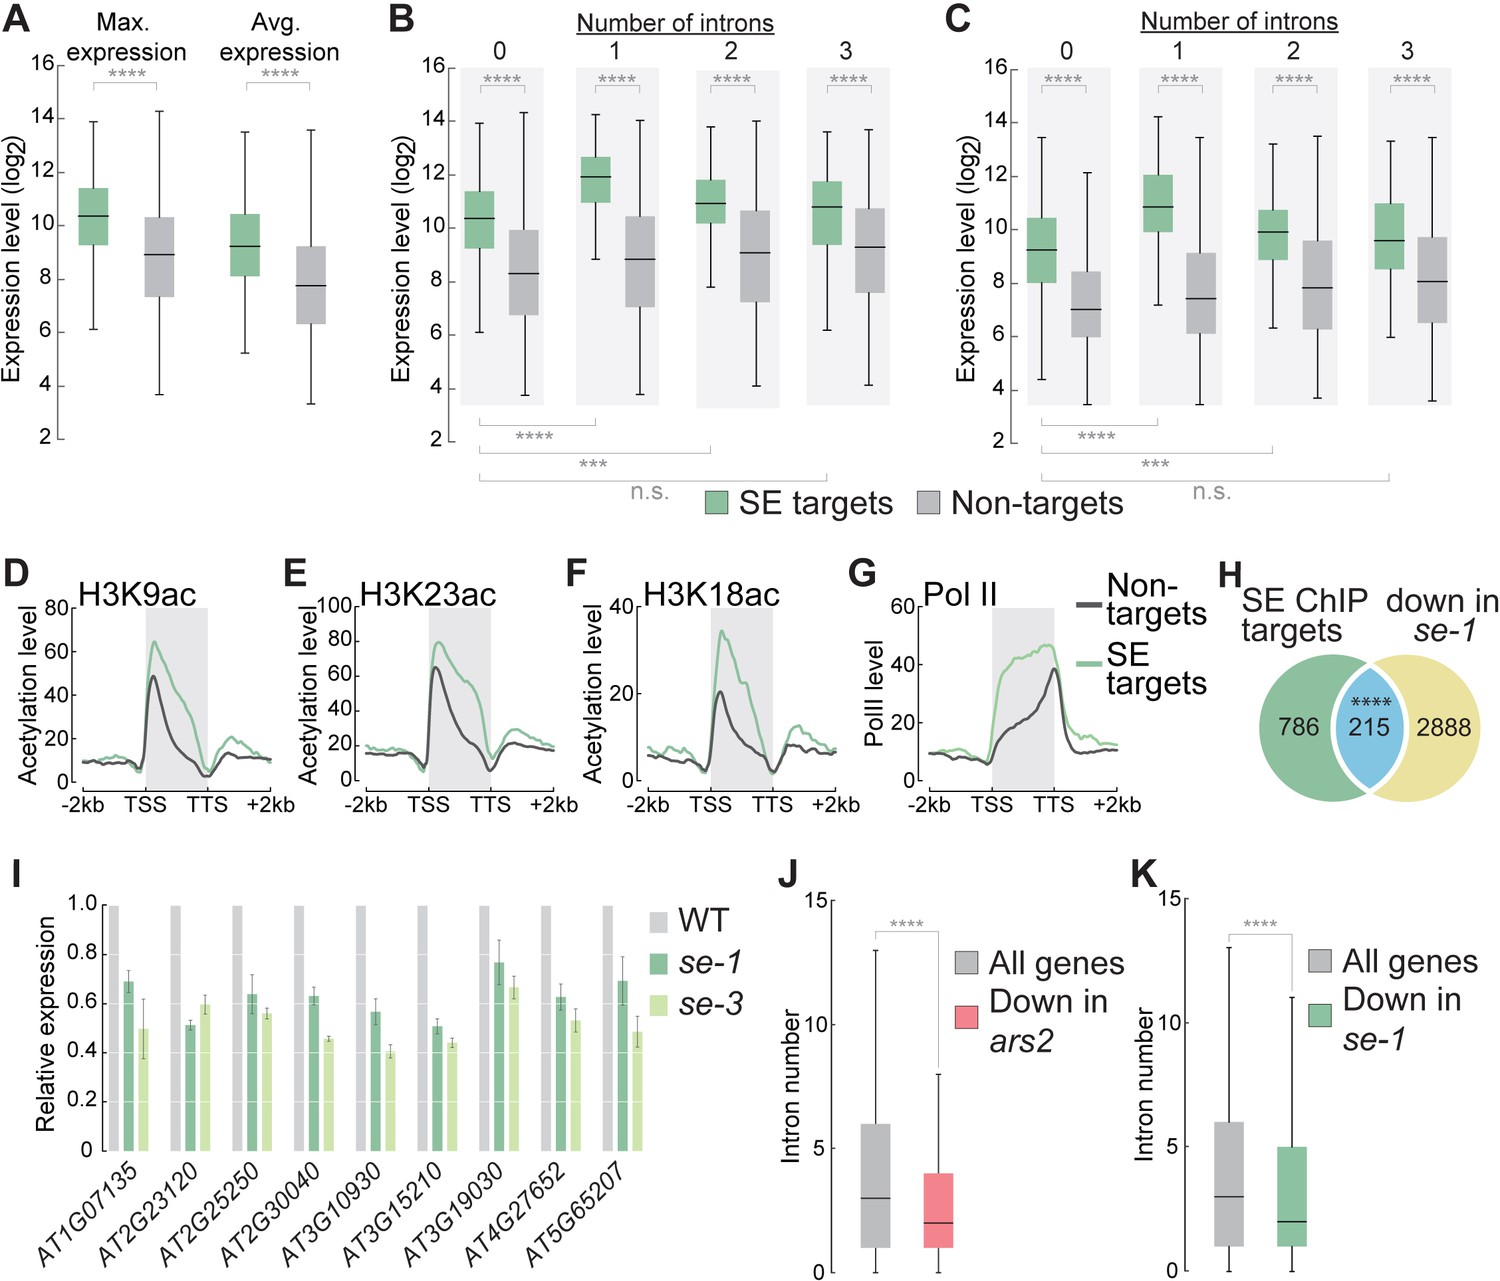
SE association to intronless genes indicates and maintains high gene expression levels.
(A) Box plots showing the maximum and average gene expression of SE targets and non-targets across different Arabidopsis tissues and developmental stages (described in Laubinger et al., 2008). (Wilcoxon-Mann-Whitney test, ****p<0.0001) (B,C) Box plots showing the maximum (B) and average (C) gene expression of intronless and intron-containing SE targets and non-targets across different Arabidopsis tissues and developmental stages (described in Laubinger et al., 2008). (Wilcoxon-Mann-Whitney test, ***p<0.001; ****p<0.0001; n.s., not significant) (D–G) Profiles of histone H3K9, (B) H3K18 (C) and H3K23 (D) acetylation and pol II (D) levels over SE target genes and non-target genes. (H) Venn diagram showing the overlap between SE-ChIP targets and genes that are significantly down-regulated in se-1 mutants (hypergeometric test, ****p<0.0001). (I) Quantification of indicated RNA transcript level determined by qPCR in WT, se-1 and se-3 mutants. Error bars indicate mean ± SEM of three biological replicates. (J,K) Box plots depicting the number introns of all Drosophila melanogaster (J) and Arabidopsis thaliana (K) genes and genes whose expression is significantly down-regulated (to < 50%) in ars2 (J) and se-1 (K) mutants. (Wilcoxon-Mann-Whitney test, ****p<0.0001).
Figure 2—figure supplement 1
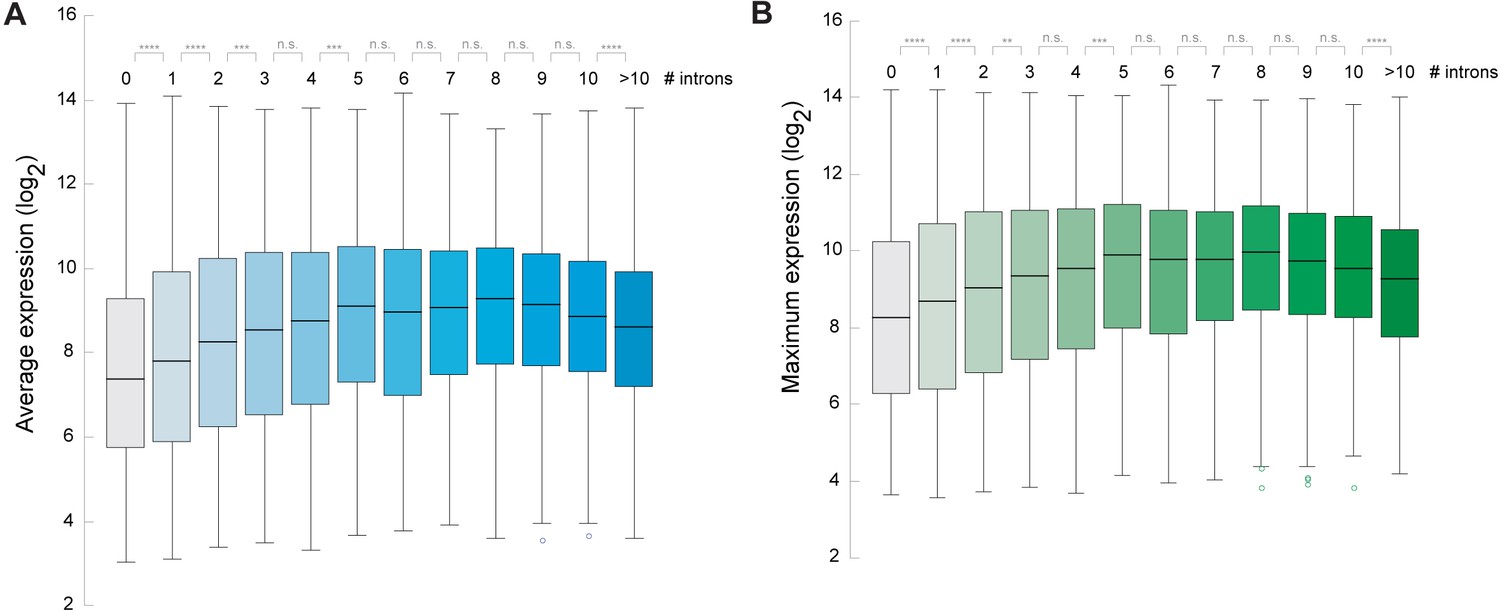
Arabidopsis genes containing introns are expressed at higher levels.
(A, B) Box blots showing the correlation between number of introns and the average gene expression level (A) or the maximum gene expression level (B) across a wide range of different growth stages and tissues of Arabidopsis. Gene expression data was obtained from Laubinger et al. (2008). A Wilcoxon-Mann-Whitney test was performed to test for difference between the different categories. *p<0.05; **p<0.01; ***p<0.001; ****p<0.0001; NS not significant.
Figure 2—figure supplement 2
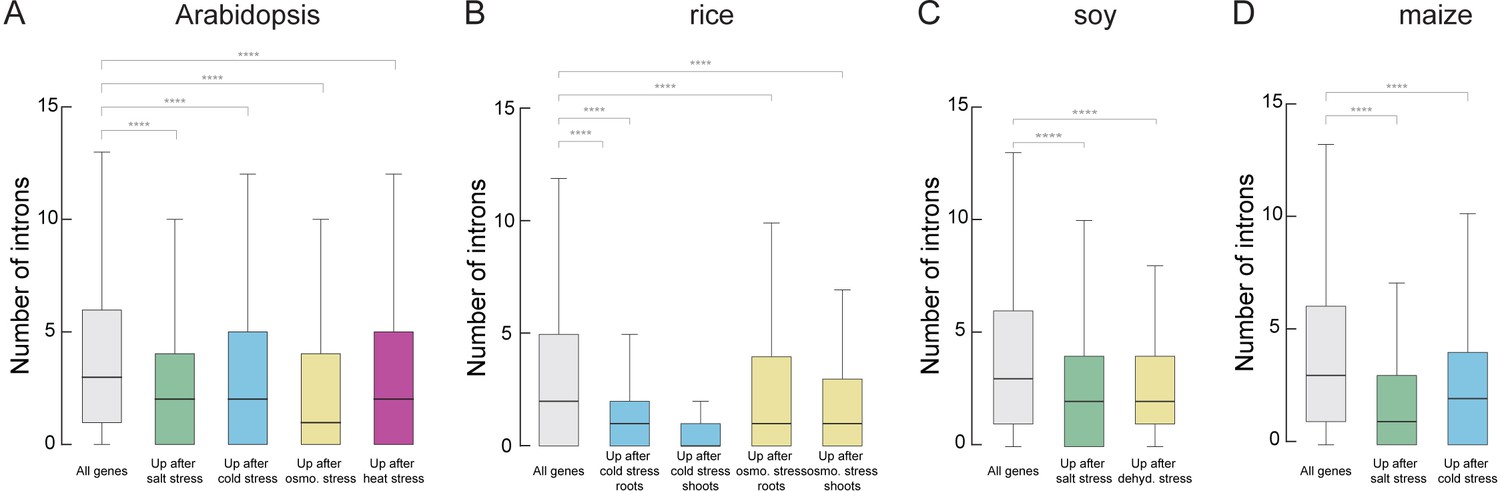
Stress-regulated genes contain fewer introns in diverse plant species.
(A–D) Box blots showing the number of introns per genes which are upregulated upon different kind of stress treatment in comparison to all genes. A) Arabidopsis plants were treated for 12 hr with salt, cold, osmotic or heat stress (B). Rice plants were treated for treated for 1 hr with cold or osmotic stress. (C) Soy plants were treated for treated for 1 hr with salt or dehydration stress. (D) Maize plants were treated for treated for 1 hr with salt or cold stress. Details on the used data sets are provided in ‘Material and methods’. Wilcoxon-Mann-Whitney test; *p<0.05; **p<0.01; ***p<0.001; ****p<0.0001; NS not significant.
Figure 2—figure supplement 3
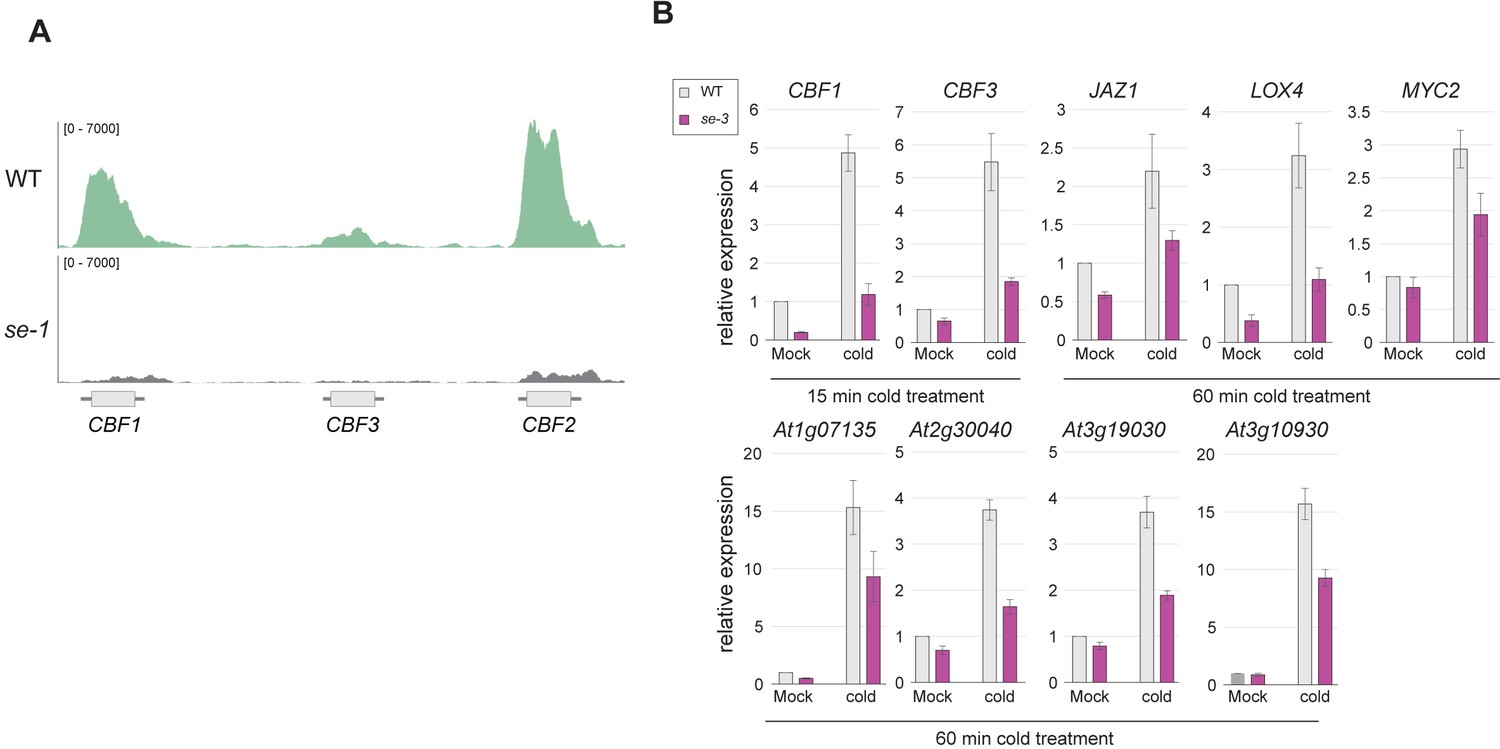
SE binds and affects the expression strength of CBF genes.
(A) Visualization of SE ChIP-seq data in WT and se-1. Tracks showing read counts of sequencing reads mapped to the CBF1/2/3 locus. (B) Quantification of indicated RNA transcript level by qPCR in WT and se-3 mutants after 15 or 60 min of cold stress or mock treatment treatment. Error bars denote the standard error of 3 biological replicates.
Figure 3 with 3 supplements
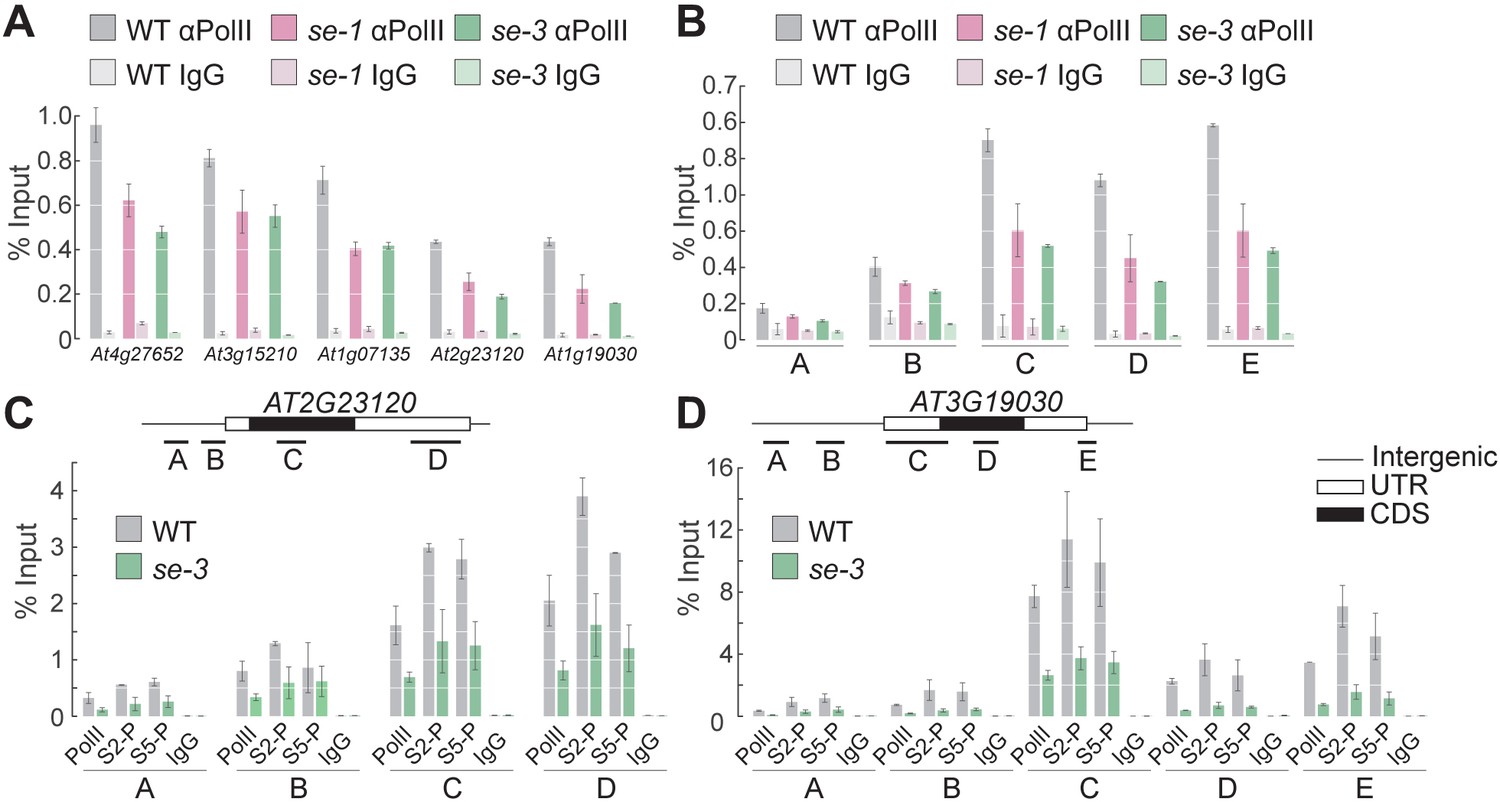
SE ensures efficient pol II association to intronless genes.
(A,B) Analysis of pol II occupancy at SE target loci by pol II-ChIP qPCR in WT, se-1 and se-3 in gene bodies of five different genes (A) or at various genomic regions at At3g19030 (B). Regions tested are depicted in panel D. A general pol II CTD antibody and mouse IgGs (as negative control) were used for immunoprecipitation. Additional gene loci were tested and are shown in Figure 3—figure supplement 1. Error bars indicate the range of two independent biological experiments. (C,D) Analysis of Ser5P and Ser2P pol II levels at SE target loci by ChIP qPCR in WT and se-3. General pol II CTD, pol II CTD Ser2P and pol II CTD Ser5P specific antibodies and mouse IgGs (as negative control) were used for immunoprecipitation. Additional gene loci were tested and are shown in Figure 3—figure supplement 3. Error bars indicate the range of two independent biological experiments.
Figure 3—figure supplement 1
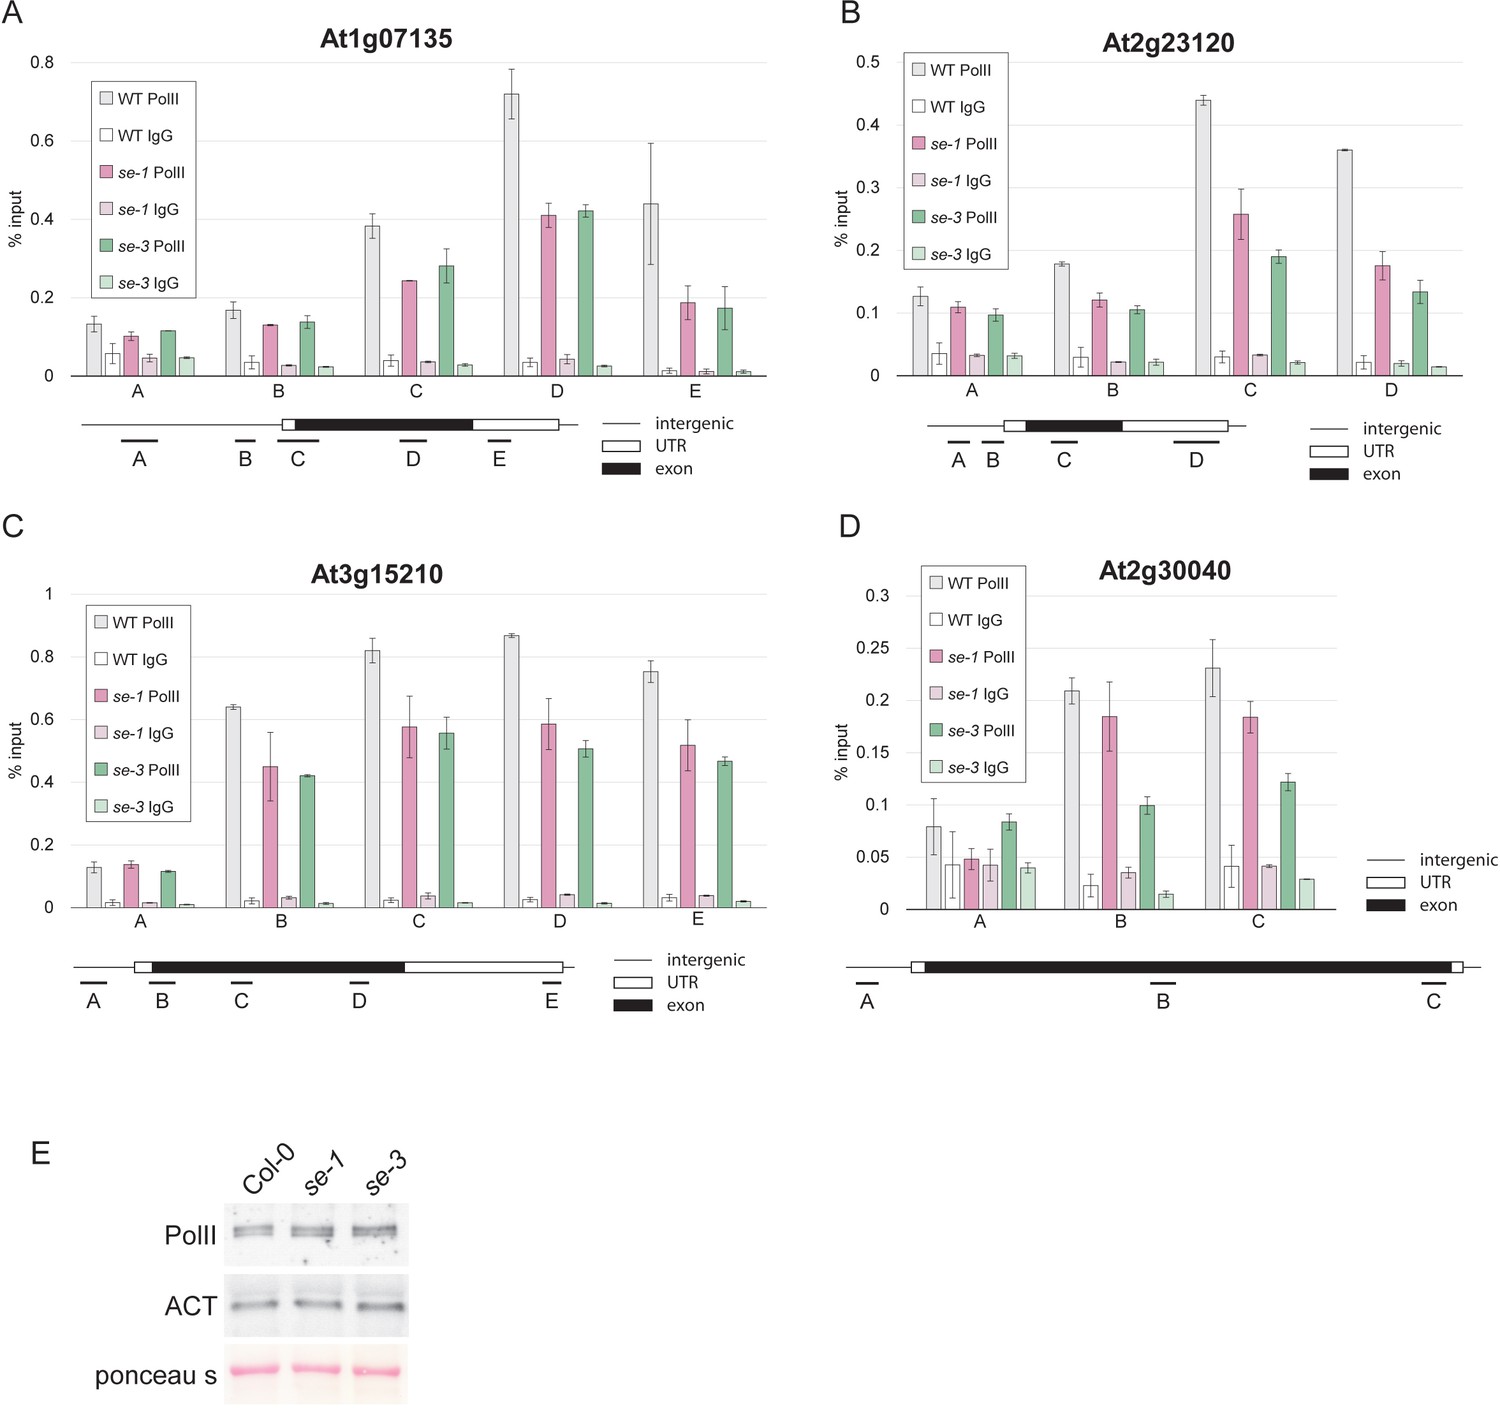
SE is important pol II association to its target genes, but does not affect pol II levels.
(A–D) Analysis of pol II occupancy at SE target loci by pol II-ChIP qPCR in WT, se-1 and se-3. A general pol II antibody and mouse IgGs (as negative control) were used for immunoprecipitation. Error bars denote the range of two biological replicates. (E) Protein blot analysis of pol II levels in WT, se-1 and se-3 using pol II antibodies. ACTIN (ACT) served as a loading control.
Figure 3—figure supplement 2
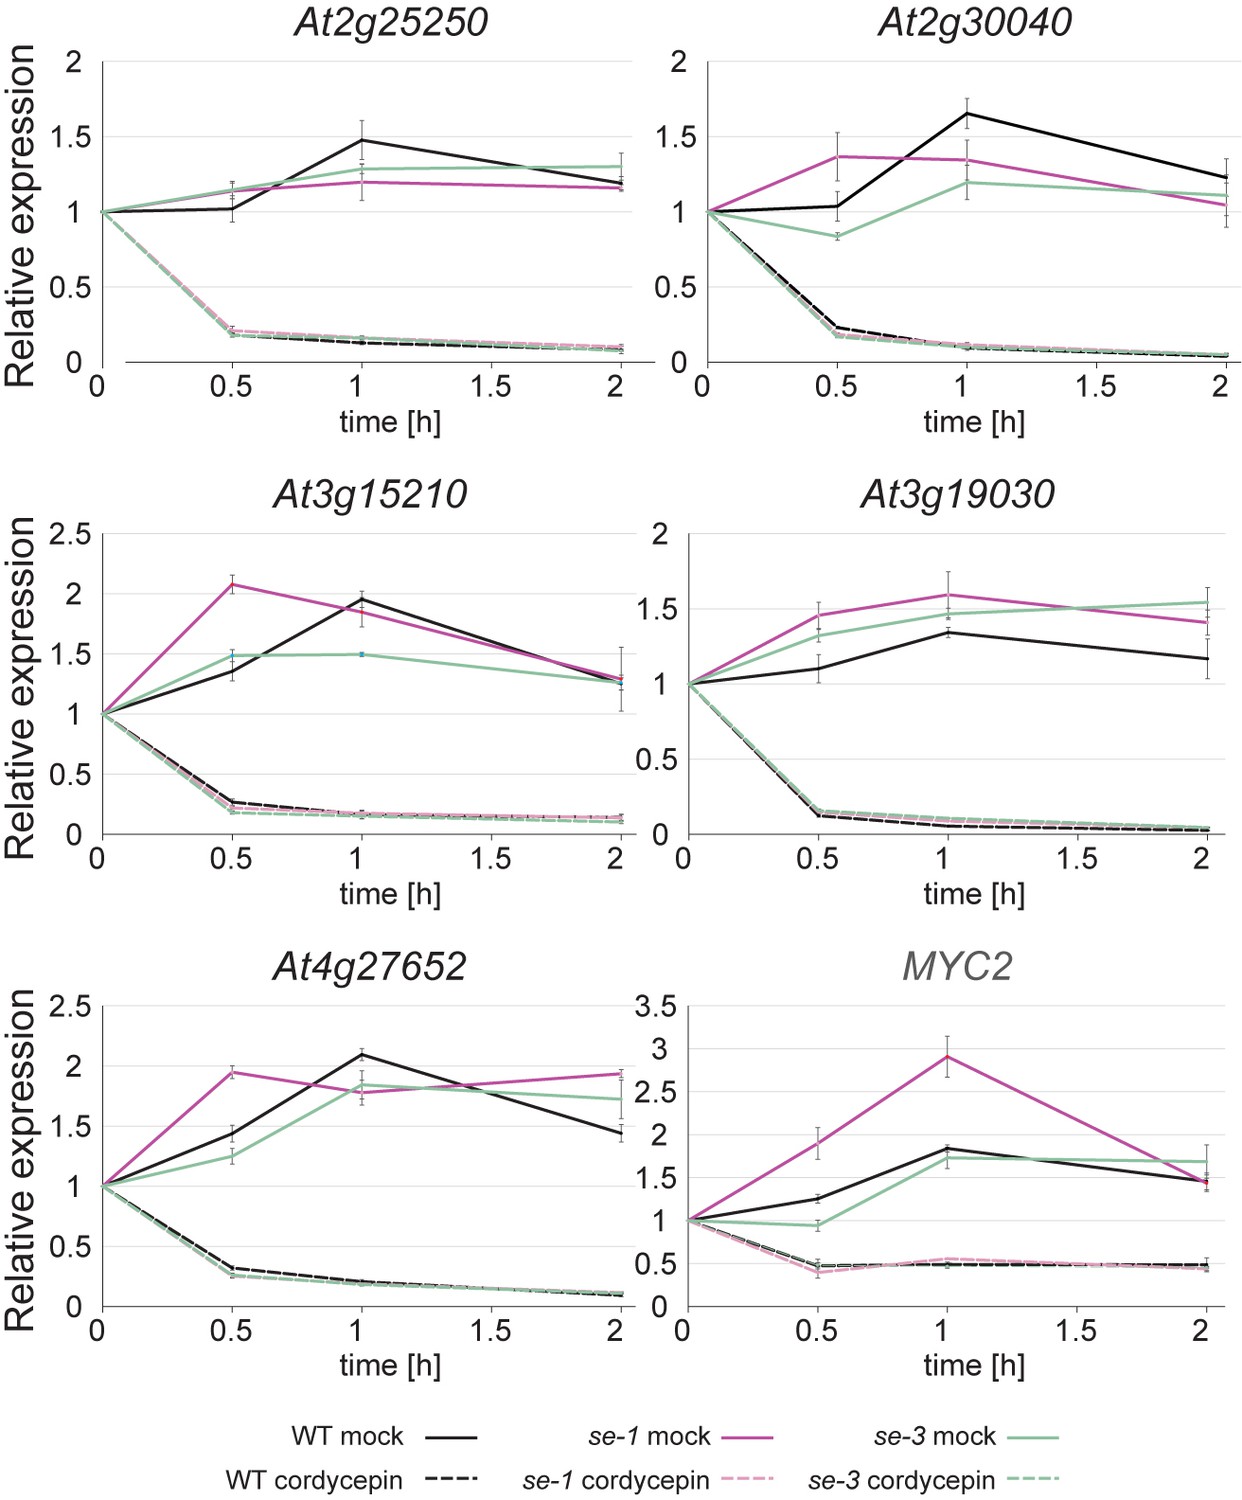
The stability of RNAs produced by SE target genes is not affected SE.
Analysis of RNA stability in WT, se-1 and se-3 mutants. Plants grown in liquid culture were treated with 200 µg/ml cordycepin for 0.5 hr, 1 hr and 2 hr to block transcription. Mock treatment served as a control. Quantification of indicated RNA transcript level was performed by qPCR. Error bars denote the standard error of 3 biological replicates.
Figure 3—figure supplement 3
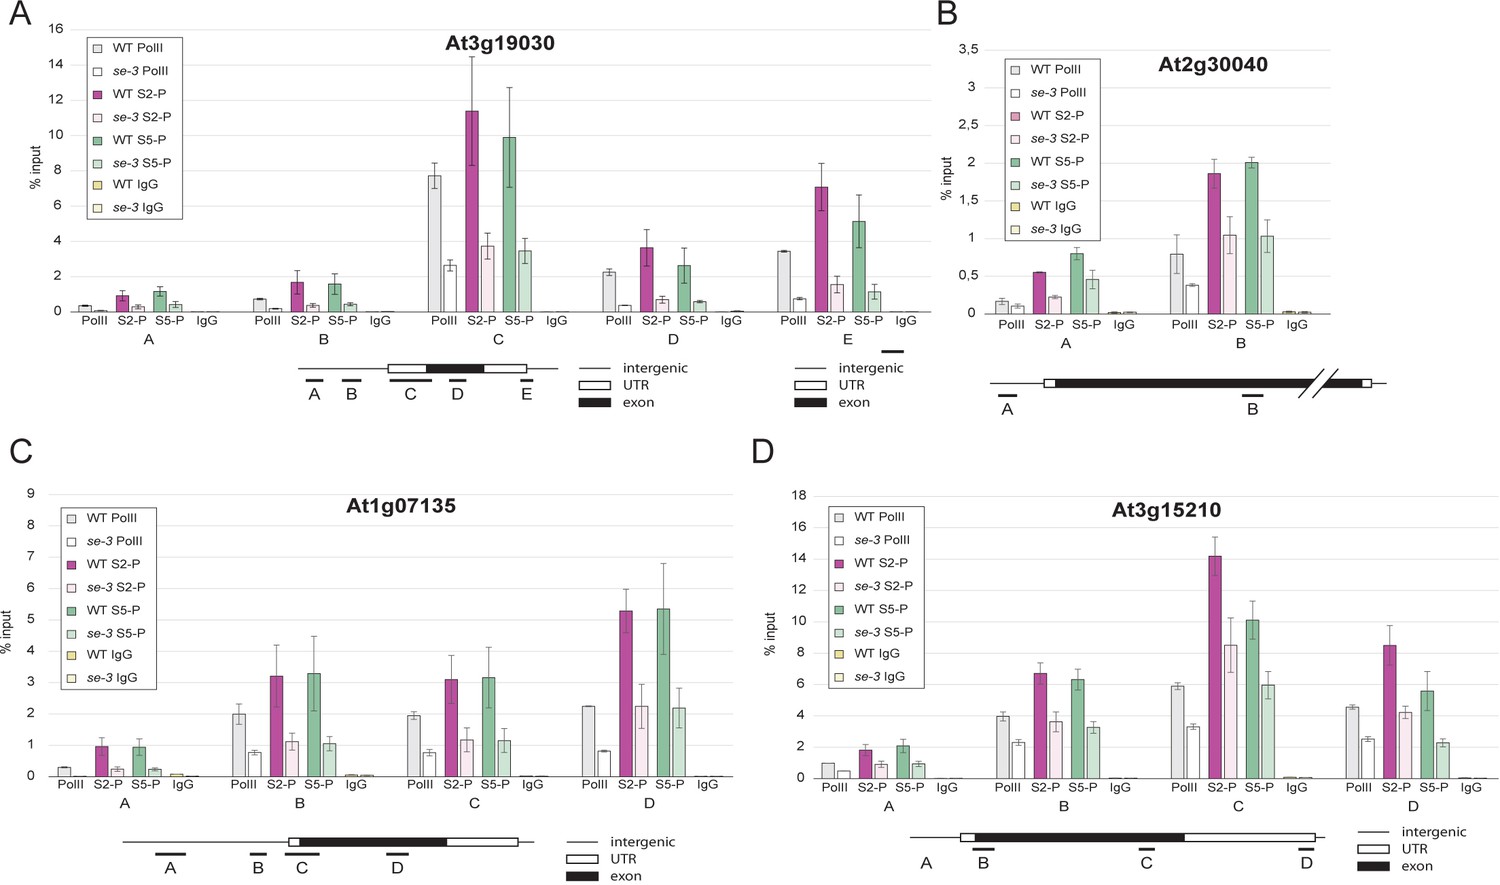
SE ensures efficient association of pol II CTD-Ser2P and pol II CTD-Ser5P to its target genes.
(A–D) Analysis of pol II occupancy at SE target loci by pol II-ChIP qPCR in WT and se-3. General pol II CTD, pol II CTD-Ser2P and pol II CTD-Ser5P specific antibodies and mouse IgGs (as negative control) were used for immunoprecipitation. Error bars denote the range of two biological replicates.
Figure 4 with 2 supplements
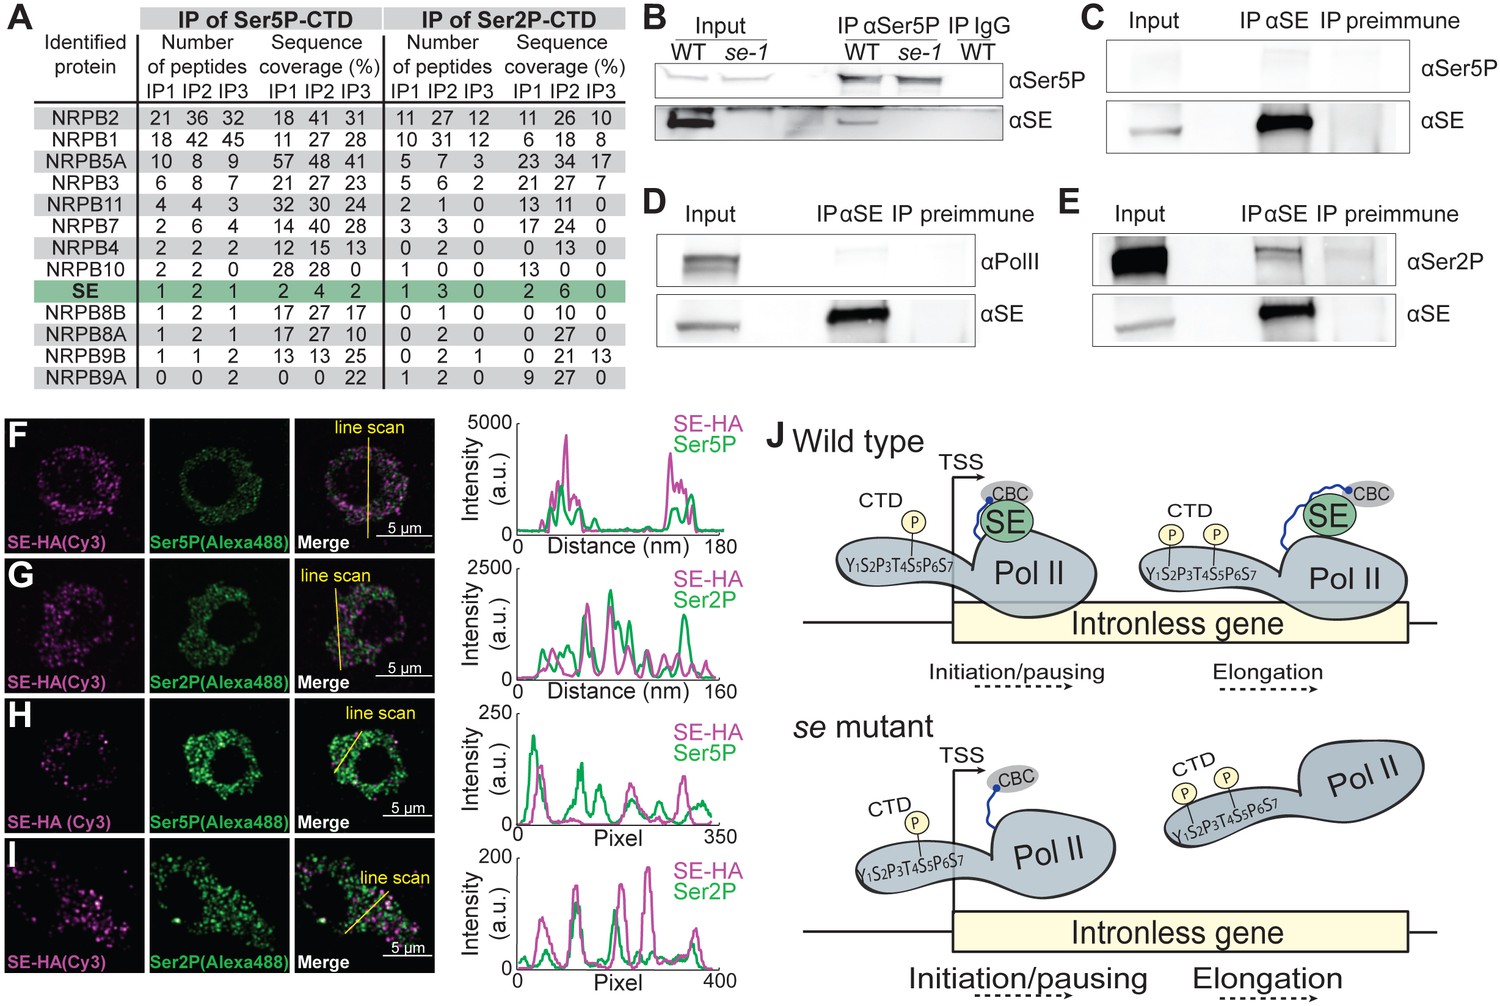
SE associates with Ser5P and Ser2P pol II complexes.
(A) Summary of mass spectrometry (MS) analysis of immunoprecipitation (IP) reactions using antibodies against RNA polymerase II phosphorylated at Serine 2 (Ser2P) and Serine 5 (Ser5P) of its C-Terminal domain (CTD) from Arabidopsis lysates. Protein coverage and peptide number are represented for known RNA polymerase subunits and SE in three independent biological replicates. (B–E) Co-immunoprecipitation experiments using SE and phosphorylation-specific pol II antibodies. Western blot analysis of pol II Ser5P and IgG (as a negative control) immunoprecipitation experiments from Arabidopsis (B). Immunoprecipitation of SE from B. oleracea using a SE-specific antibody followed by detection of unphosphorylated (D), Ser5P (C) and Ser2P (E) pol II. The images are representative of at least three independent biological replicates. (F–I) Immunolocalization of pol II Ser5P, pol II Ser2P and SE-HA on a 100 nm thin thawed cryosection analyzed by super-resolution microscopy (F,G: Airyscan; H,I: Super-resolution optical fluctuation (SOFI) microscopy). Lines depicte the position for line blot analysis. (J) Proposed mechanism for the function of SE at intronless genes.
Figure 4—figure supplement 1
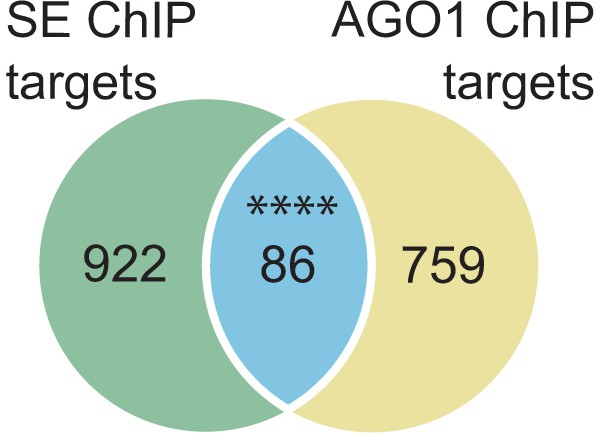
Analysis of SE and AGO1 targets.
Venn diagram showing the overlap between unique SE- and AGO1-ChIP targets (described in Liu et al., 2018) (hypergeometric test, ****p<0.0001).
Figure 4—figure supplement 2
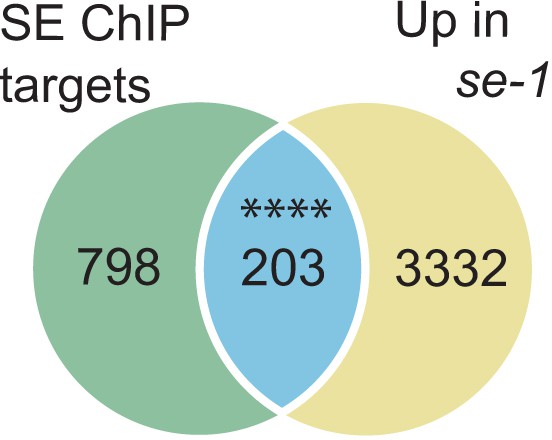
Analysis of SE target genes down-regulated in se mutants.
Venn diagram showing the overlap between SE-ChIP targets and gene that are up-regulated in se-1 mutants (hypergeometric test, ****p<0.0001).
Tables
Key resources table
| Reagent type (species) or resource | Designation | Source or reference | Identifiers | Additional information |
|---|---|---|---|---|
| Strain, strain background (A. thaliana) | se-1 mutant | Clarke et al. (1999) | NASC_ID:N3257 | |
| Strain, strain background (A. thaliana) | se-3 mutant | Grigg et al. (2005) | SALK_083196 | |
| Strain, strain background (A. thaliana) | cbp20-1 mutant | Papp et al. (2004) | ||
| Strain, strain background (A. thaliana) | SEPro:SE-3HA | This study | ||
| Antibody | αSE | This study | Raised against the peptide: QDLDAPEE EVTVIDYRSL, 10 µl/ChIP; 1:300 (IP); 1:2000 (WB) | |
| Antibody | αCDT | Abcam | ab817 | 10 µl/ChIP; 1:250 (IP); 1:1000 (WB) |
| Antibody | αCTDI-S2P | Abcam | ab5095 | 10 µl/ChIP; 1:250 (IP); 1:1000 (WB) |
| Antibody | αCTDI-S2P | Abcam | ab5131 | 1:200 (IF) |
| Antibody | αCTDI-S5P | Abcam | ab5408 | 10 µl/ChIP; 1:250 (IP); 1:2000 (WB); 1:200 (IF) |
| Antibody | rat monoclonal IgG1 3F10 anti-HA | Sigma | 000000011867423001 | 1:25 (IF) |
| Antibody | goat anti-rat IgG coupled to Cy3 | Dianova | 112-165-167 | 1:400 (IF) |
| Antibody | goat anti-rabbit antibody coupled to Alexa488 | Dianova | 111-546-047 | 1:400 (IF) |
| Commercial assay or kit | MinElute Reaction Cleanup Kit | Qiagen | 28204 | |
| Commercial assay or kit | QuantiNova SYBR Green PCR Kit | Qiagen | 208052 | |
| Commercial assay or kit | SYBR-Green Maxima | Thermo Fisher Scientific | K0251 | |
| Commercial assay or kit | RevertAid First Strand cDNA Synthesis Kit | Thermo Fisher Scientific | K1621 | |
| Commercial assay or kit | RNeasy Plant Mini Kit | Qiagen | 74904 | |
| Commercial assay or kit | TruSeq ChIP Library Preparation Kit | Illumina | IP-202–1012 | |
| Commercial assay or kit | NEBnext poly(A) mRNA Magnetic Isolation Module | New England Biolab | #7490 | |
| Commercial assay or kit | ScriptSeq v2 RNA-Seq Library Preparation Kit | Illumina, | SSV21124 | |
| Chemical compound, drug | mouse IgG | Santa Cruz | sc-2025 | |
| Chemical compound, drug | rabbit IgG | Santa Cruz, | sc-2027 | |
| Chemical compound, drug | Agarose A/G-Plus beads | Santa Cruz | sc-2003 | |
| Chemical compound, drug | protease inhibitor cocktail | SIGMA | P9599 | |
| Chemical compound, drug | Phosphatase Inhibitor Cocktail 2 | SIGMA | P5726 | |
| Chemical compound, drug | Phosphatase Inhibitor Cocktail 23 | SIGMA | P0044 | |
| Chemical compound, drug | protein A-Agarose | Roche | 11134515001 | |
| Chemical compound, drug | protein G-Agarose | Roche | 11243233001 | |
| Chemical compound, drug | cOmplete, EDTA-free | Sigma | 000000011873580001 |
Additional files
-
Supplementary file 1
Full list of SE binding sites in the Arabidopsis genome.
The table contains all binding sites with start and end coordinates, and annotations.
- https://doi.org/10.7554/eLife.37078.015
-
Supplementary file 2
List of conservative SE binding site identified by RSAT.
The table contains information about all significantly enriched sequences among the SE binding sites, and the distribution of the peaks among the SE binding sites.
- https://doi.org/10.7554/eLife.37078.016
-
Supplementary file 3
List of all oligonucleotides used in this study.
- https://doi.org/10.7554/eLife.37078.017
-
Supplementary file 4
List of identified proteins in mass spectrometry analysis.
Immunoprecipitation experiments were conducted with antibodies against CTD-Ser2P (POL_II_S2; replicate 1–3), CTD-Ser5P (POL_II_S5; replicate 1–3), unphophorylated CTD (CTD; replicate 2–3) and the corresponding IgG controls. The table shows all proteins identified as well as the corresponding number of peptides, sequence coverage and quality measures in all biological replicates.
- https://doi.org/10.7554/eLife.37078.018
-
Transparent reporting form
- https://doi.org/10.7554/eLife.37078.019
Download links
A two-part list of links to download the article, or parts of the article, in various formats.
Downloads (link to download the article as PDF)
Open citations (links to open the citations from this article in various online reference manager services)
Cite this article (links to download the citations from this article in formats compatible with various reference manager tools)
Arabidopsis RNA processing factor SERRATE regulates the transcription of intronless genes
eLife 7:e37078.
https://doi.org/10.7554/eLife.37078


