FBXL19 recruits CDK-Mediator to CpG islands of developmental genes priming them for activation during lineage commitment
- University of Oxford, United Kingdom
- RIKEN Center for Integrative Medical Sciences, Japan
- Kazusa DNA Research Institute, Japan
- TDI Mass Spectrometry Laboratory, Target Discovery Institute, University of Oxford, United Kingdom
- Japan Science and Technology Agency, Japan
Figures
Figure 1 with 1 supplement
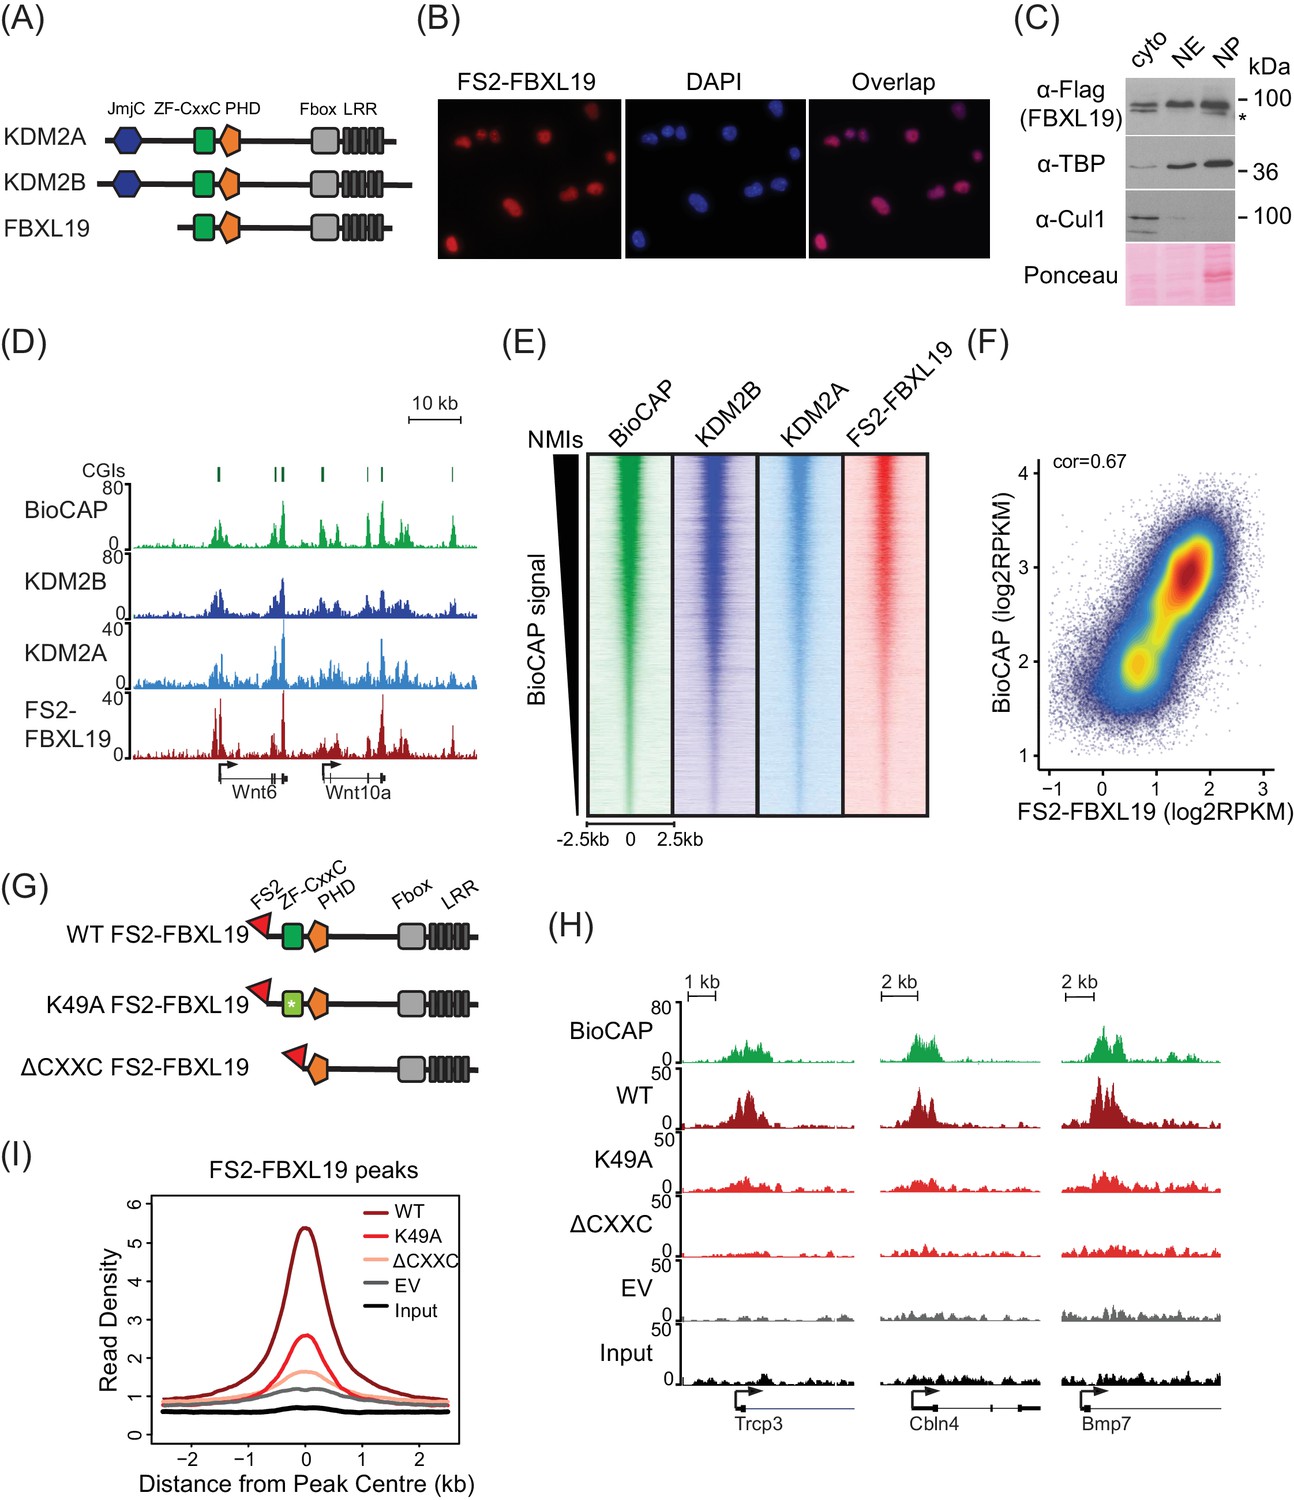
FBXL19 binds CpG islands genome-wide via its ZF-CxxC domain.
(A) A schematic illustrating KDM2 protein domain architecture. (B) Immuno-fluorescent staining for FS2-FBXL19 in ES cells. (C) ES cell fractionation and Western blot for factors enriched in the nucleus (TBP), the cytoplasm (CUL1), and FS2-FBXL19. Ponceau S staining indicates protein loading. Cyto – cytoplasmic fraction, NE – soluble nuclear extract, NP – insoluble nuclear pellet. The asterisk indicates a non-specific band. (D) Screen shots showing ChIP-seq traces for KDM2B, KDM2A and FS2-FBXL19. BioCAP is included to indicate the location of non-methylated DNA and computationally predicted CpG islands (CGIs) are illustrated above. (E) Heatmaps showing enrichment of KDM2 proteins over a 5 kb region centred on non-methylated islands identified by BioCAP (NMIs) (n = 27698), sorted by decreasing BioCAP signal. BioCAP is shown for comparison. (F) A scatter plot showing the Spearman correlation between FS2-FBXL19 ChIP-seq signal and BioCAP signal at NMIs. (G) A schematic illustrating the FS2-FBXL19 transgenes. (H) A screen shot showing ChIP-seq traces for WT FS2-FBXL19 and ZF-CxxC FS2-FBXL19 mutants as in G. EV indicates empty vector control. (I) A metaplot analysis of WT FS2-FBXL19 and ZF-CxxC FS2-FBXL19 mutants over FBXL19 peaks.
Figure 1—figure supplement 1
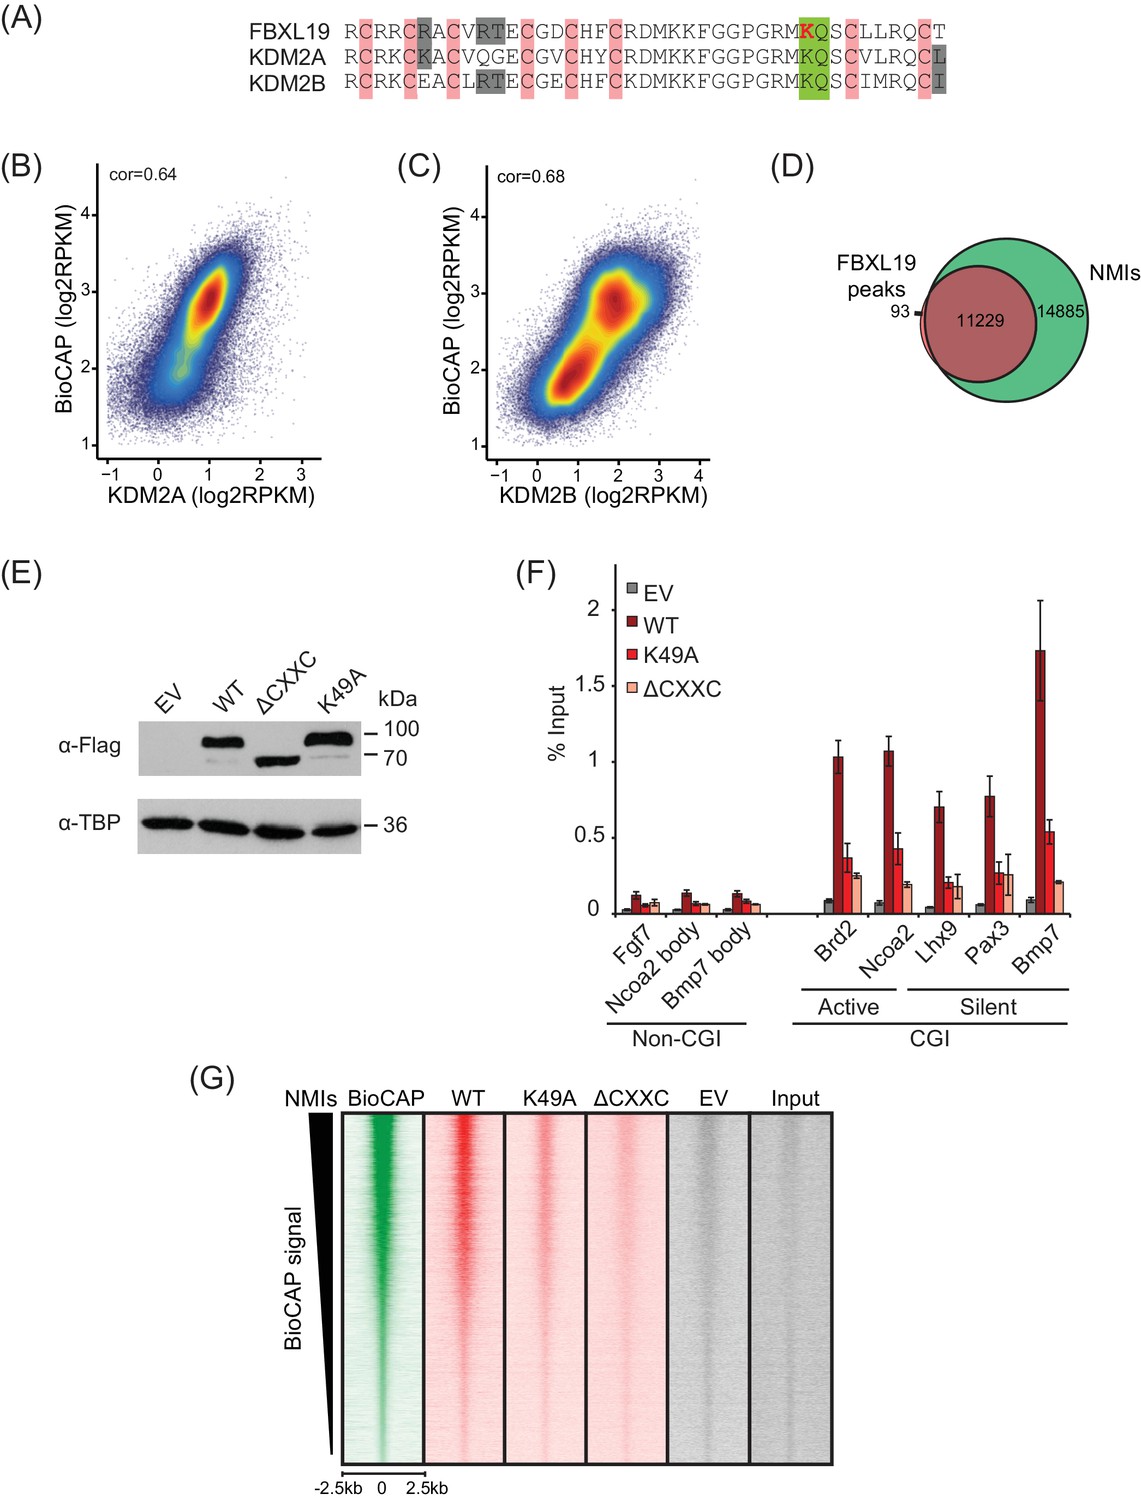
FBXL19 binds CpG islands genome-wide via its ZF-CxxC domain.
(A) Alignment of the KDM2 protein ZF-CxxC domains. Pink indicates the location of cysteine residues that coordinate Zn2+ binding in the ZF-CxxC domain. The conserved lysine K49 within the CpG-binding KQ motif (green) in FBXL19 is indicated in red. (B–C) A scatterplot showing the Spearman correlation between KDM2A or KDM2B and BioCAP at NMIs. (D) A Venn diagram showing the overlap between FS2-FBXL19 peaks (n = 11322) and NMIs (n = 27698). (E) Western blot analysis showing expression of wild-type (WT) FS2-FBXL19, ΔCxxC FS2-FBXL19 and ZF-CxxC-mutant (K49A) FS2-FBXL19 from nuclear extracts of the respective stable ES cell lines. (F) ChIP-qPCR for WT and mutant FS2-FBXL19 enrichment at gene promoters. Error bars show SEM of three biological replicates. (G) Heatmap analysis at NMI peaks (n = 27698), showing ChIP-seq data for BioCAP, WT FS2-FBXL19 and ZF-CxxC mutants over a 5 kb region centred on the NMI, sorted by decreasing BioCAP signal.
Figure 2 with 1 supplement
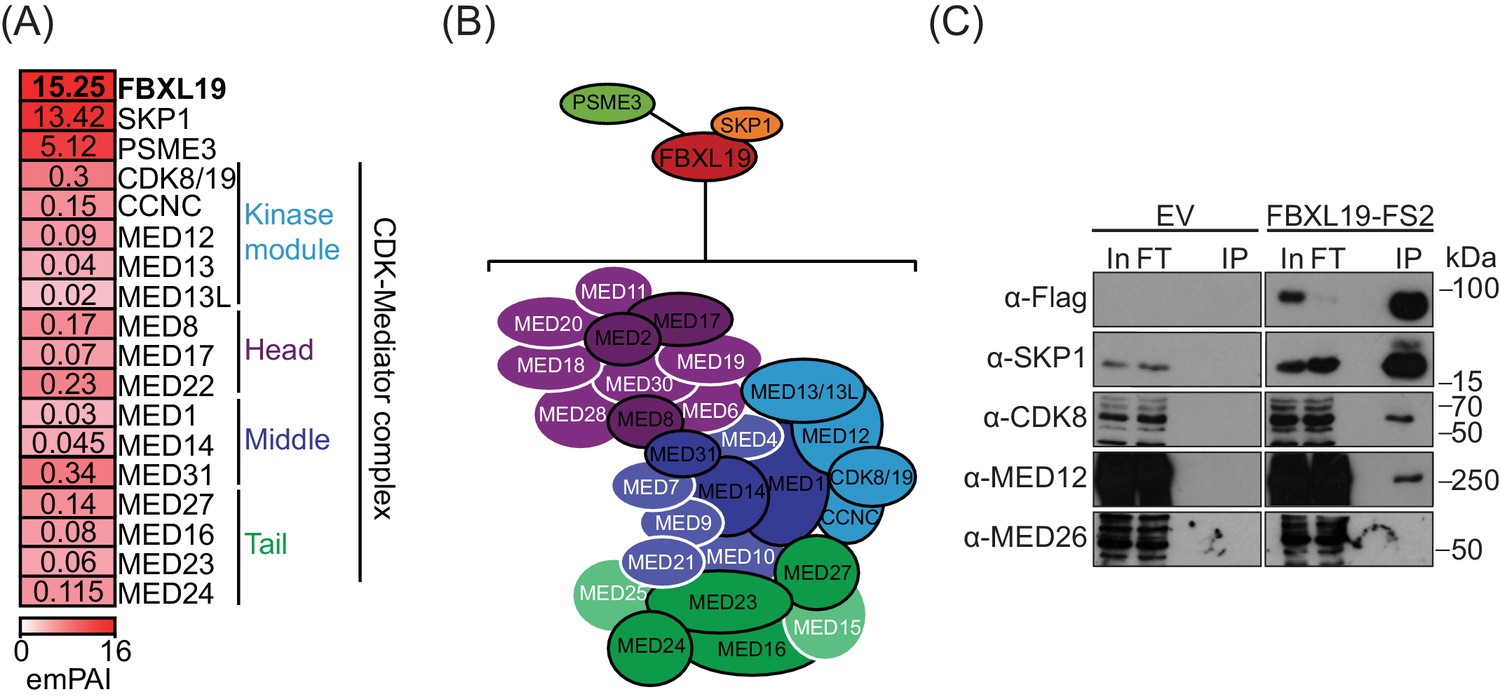
FBXL19 interacts with the CDK-Mediator complex in ES cells.
(A) A heatmap representing the empirically modified protein abundance index (emPAI) of identified FBXL19-interacting proteins by affinity purification mass spectrometry (AP-MS). Data shown is an average of two biological replicates. The location of the identified Mediator components within the holocomplex is summarised on the right and in (B). (B) A schematic representation of the identified FBXL19-interacting proteins. Subunits of the CDK-Mediator complex not identified by AP-MS are shown in white. (C) Western blot analysis of FS2-FBXL19 and control purifications (EV) probed with the indicated antibodies.
-
Figure 2—source data 1
Mass spectrometry data.
- https://doi.org/10.7554/eLife.37084.006
Figure 2—figure supplement 1
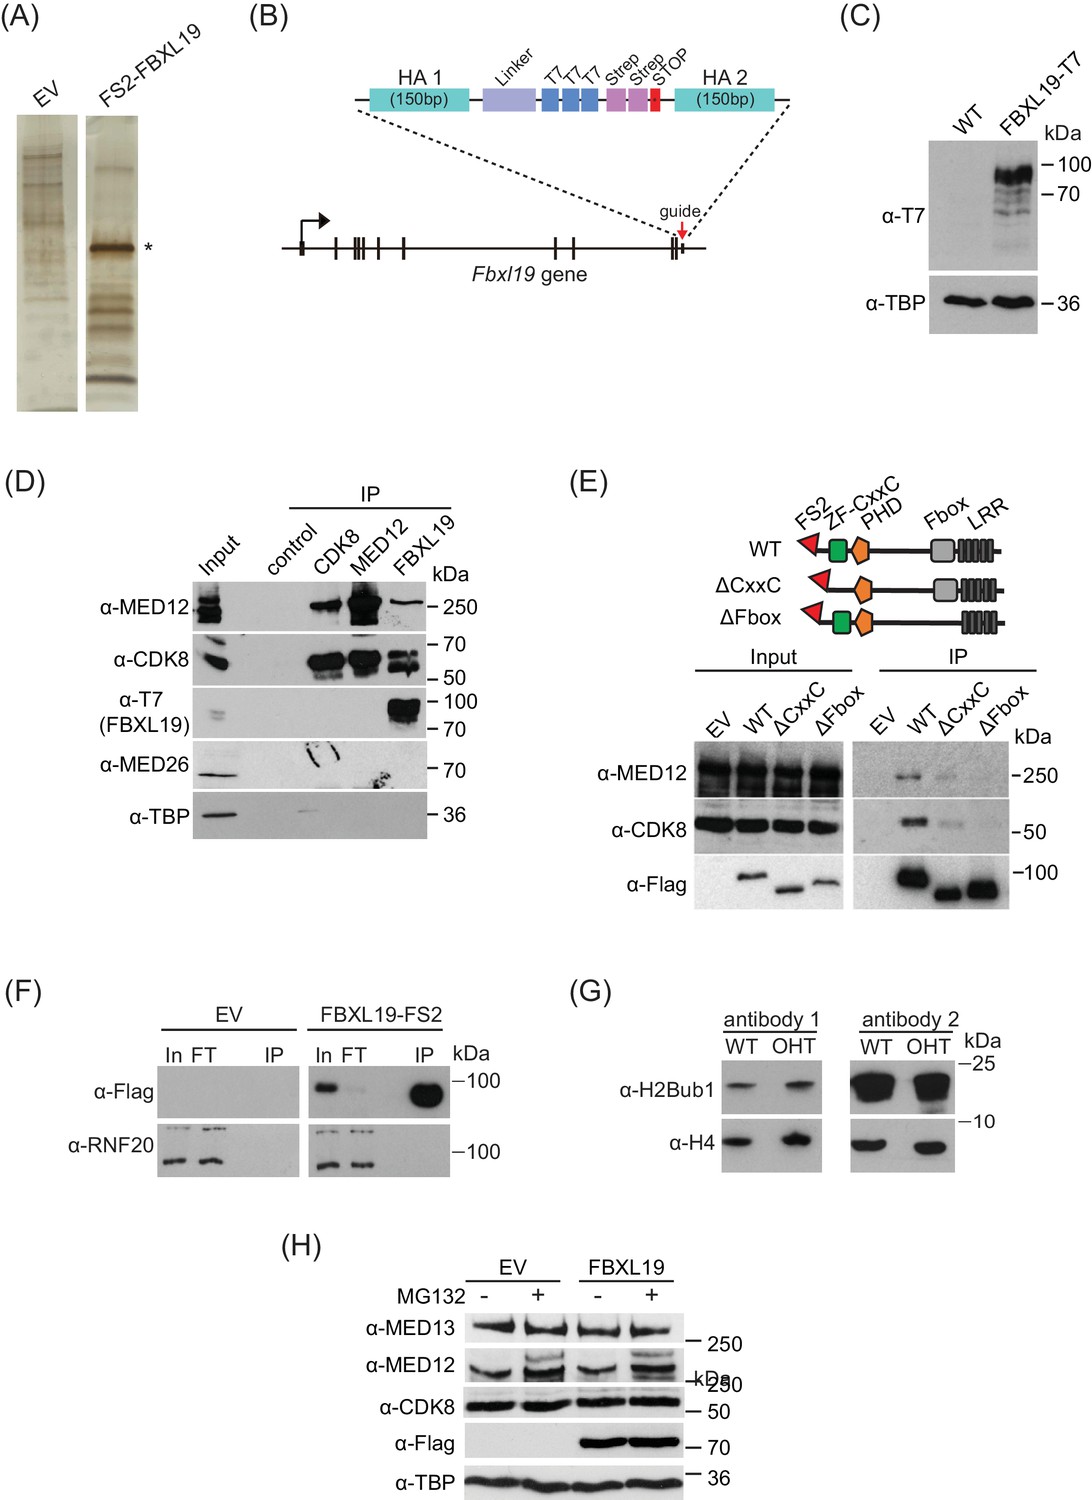
FBXL19 interacts with the CDK-Mediator complex in ES cells.
(A) A representative silver-stained gel for FS2-FBXL19 purification and an empty vector control (EV) purification. Asterisk identifies the band corresponding to FS2-FBXL19 protein. (B) In order to visualize FBXL19 protein by western blot in Figure 2—figure supplement 1D and Figure 4B, the Fbxl19 gene was tagged by T7 knock-in in Fbxl19fl/fl ES cells using the CRISPR Cas9 system. A schematic representation of the generation of the C-terminal T7 knock-in Fbxl19 is shown. HA1/2 indicate the homology arms of the targeting construct. (C) Western blot analysis of the expression of T7-FBXL19 from nuclear extract of the generated T7 knock-in ES cell line. (D) Western blot analysis of endogenous co-immunoprecipitation (IP) of FBXL19, CDK8 and MED12 from ES cell nuclear extracts. A control IP using a non-specific antibody (α-ΗΑ) was included. (E) A schematic illustration of the different FS2-FBXL19 truncation mutants and Western blot analysis of purification of FS2-FBXL19 mutants from HEK293T cells probed with the indicated antibodies. (F) Western blot analysis of FS2-FBXL19 and control purifications (EV) probed with the indicated antibodies. (G) Western blot analysis of histone extracts generated from Fbxl19fl/fl (WT) and Fbxl19ΔCXXC (OHT) ES cells probed with two different antibodies recognizing ubiquitylated H2B K120 (H2Bub1). H4 was used as a loading control. (H) Western blot analysis of nuclear extracts from HEK293T cells transiently transfected with empty vector (EV) or Flag-FBXL19-expressing vector without (-) or following MG132 treatment (+). Blots were probed with the indicated antibodies. TBP was used as loading control.
Figure 3 with 1 supplement
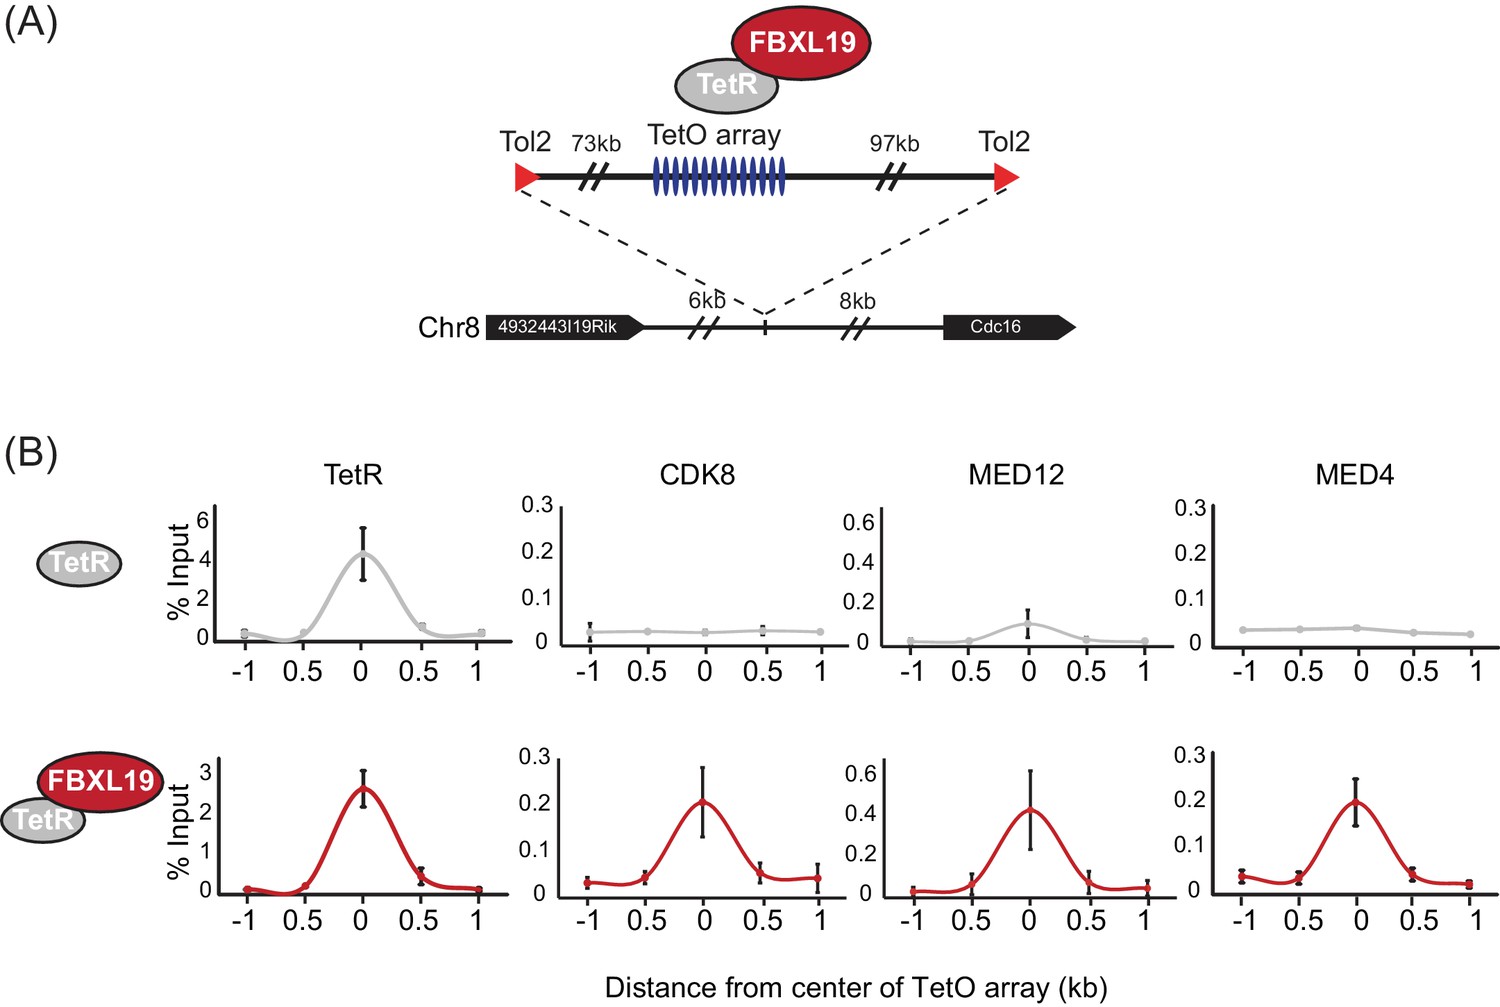
FBXL19 recruits CDK-Mediator to chromatin.
(A) A schematic representation of the integration site of the TetO array. (B) ChIP-qPCR analysis of the binding of the indicated proteins across the TetO array in TetR only (top) and TetR-FBXL19 (bottom) ES cell lines. The x-axis indicates the spatial arrangement of the qPCR amplicons with respect to the center of the TetO array (in kb). Error bars represent SEM of three biological replicates.
Figure 3—figure supplement 1
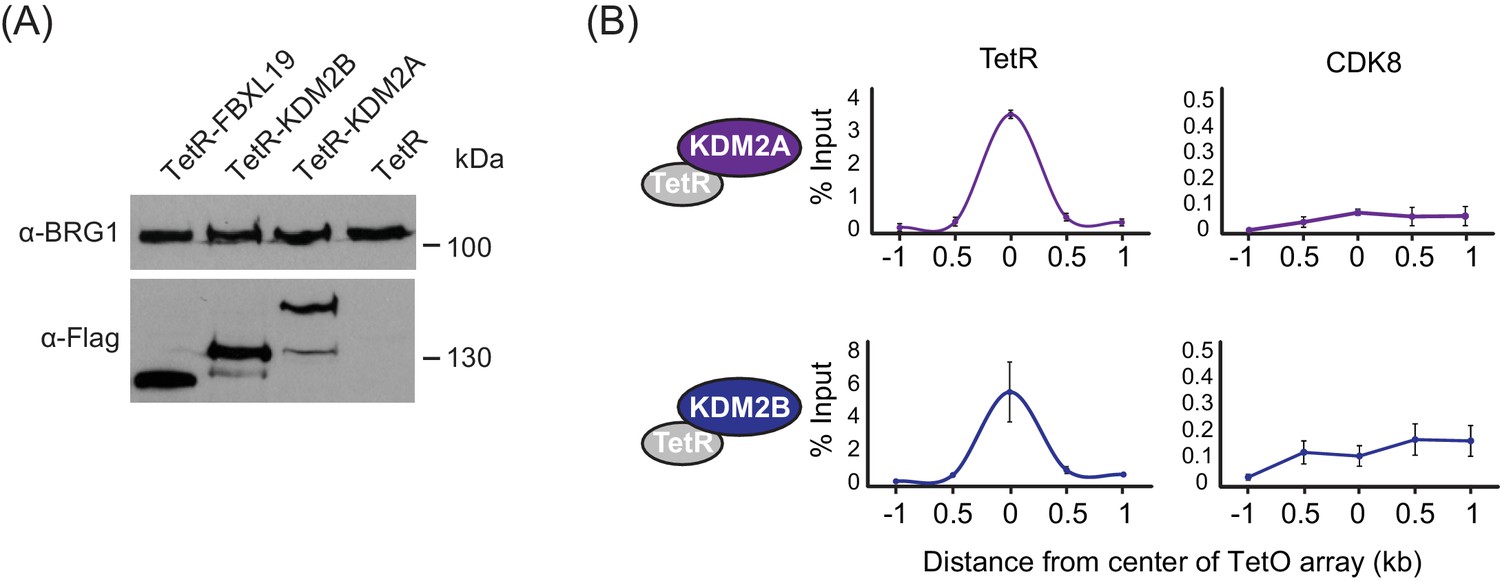
FBXL19 recruits CDK-Mediator to chromatin.
(A) Western blot analysis of the expression of the TetR-fusion proteins from nuclear extracts of the respective cell lines. BRG1 was probed as a loading control. (B) ChIP-qPCR analysis of the binding of the indicated proteins across the TetO array (distance from center shown) in TetR-KDM2A (top) and TetR-KDM2B (bottom) ES cell lines. The x-axis indicates the spatial arrangement of the qPCR amplicons with respect to the center of the TetO array (in kb). Error bars represent SEM of three biological replicates.
Figure 4 with 1 supplement
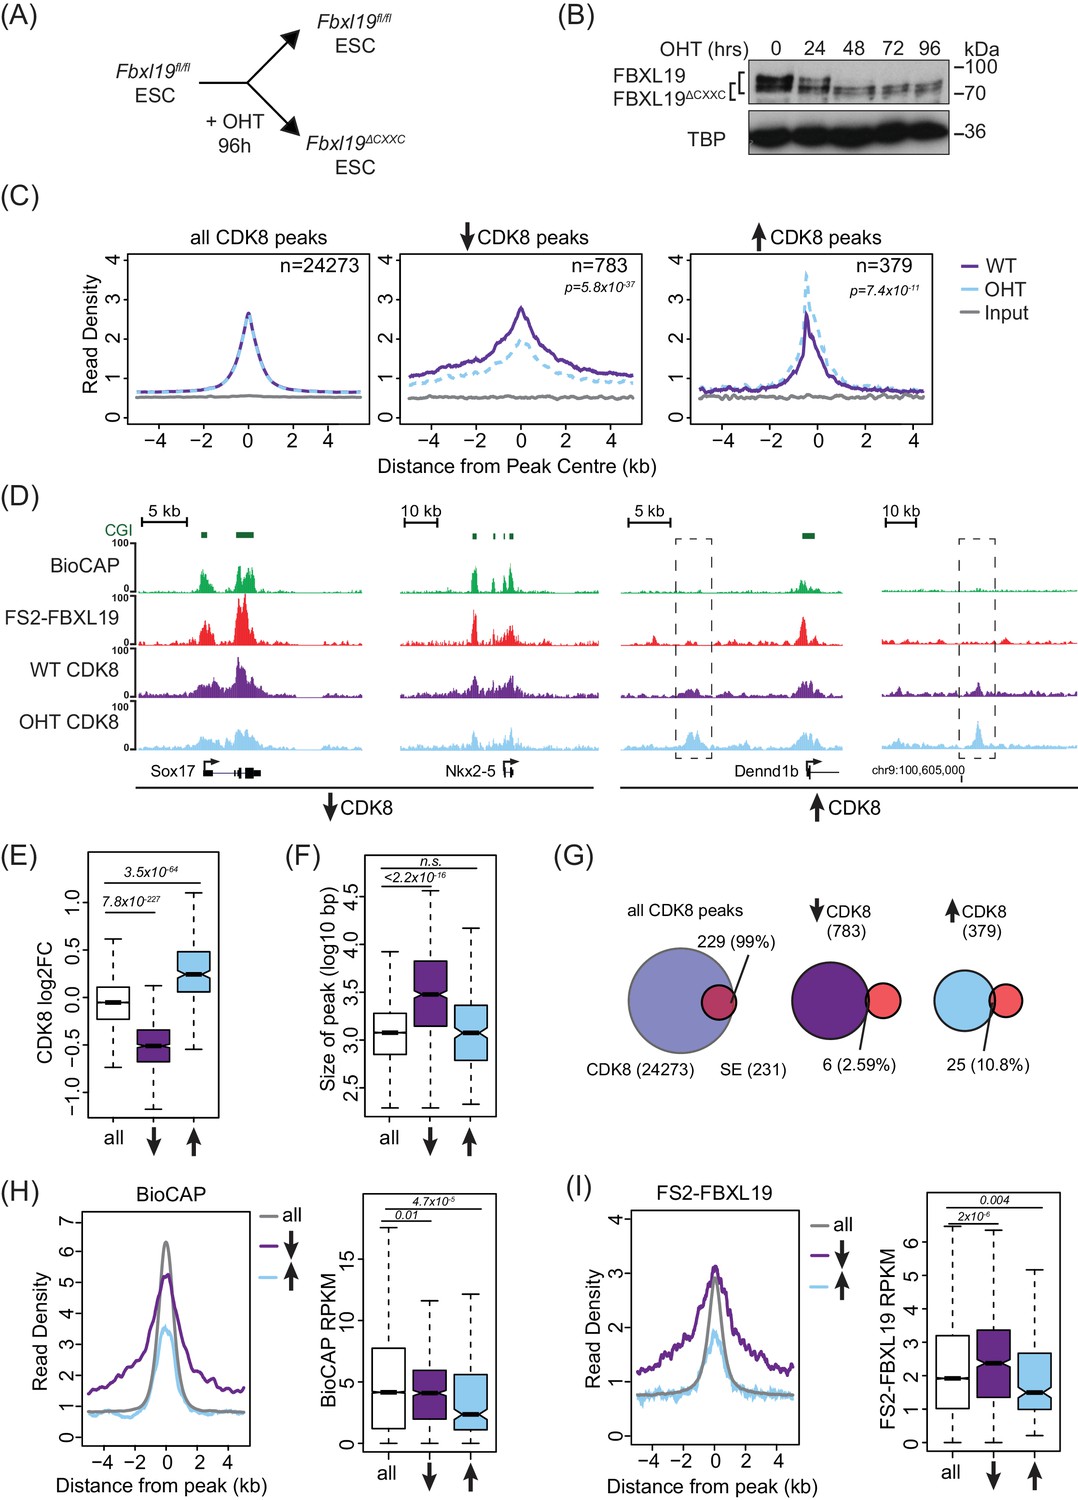
FBXL19 is required for appropriate CDK8 occupancy at a subset of CpG island promoters.
(A) A schematic illustrating how addition of OHT (4-hydroxytamoxifen) leads to the generation of Fbxl19ΔCXXC ES cells. (B) Western blot analysis of an OHT-treatment time course in the Fbxl19fl/fl ES cell line. Hours of treatment are shown. FBXL19 protein was C-terminally tagged with a T7 epitope (Figure 2—figure supplement 1B, C) to allow for Western blot detection with an anti-T7 antibody. FBXL19 runs as a doublet that shifts in size following deletion of the CxxC domain. TBP was probed as a loading control. (C) Metaplots showing CDK8 enrichment in Fbxl19fl/fl ES cells (WT) and Fbxl19ΔCXXC ES cells (OHT) at all CDK8 peaks (left), peaks showing decreased CDK8 occupancy (↑, middle) and peaks showing increased CDK8 occupancy (↓, right). The number of total peaks in each group is indicated. p-values denote statistical significance calculated by Wilcoxon rank sum test comparing ChIP-seq read counts between WT and OHT samples across a 1.5-kbp interval flanking the center of CDK8 peaks. (D) Screen shots showing ChIP-seq traces for CDK8 in wild type Fbxl19fl/fl ES cells (WT) and Fbxl19ΔCXXC ES cells (OHT). BioCAP and FS2-FBXL19 tracks are given for comparison. Left – CDK8 peaks showing reduced CDK8 binding in Fbxl19ΔCXXC ES cells; Right – CDK8 peaks showing increased CDK8 binding in Fbxl19ΔCXXC ES cells (indicated with rectangles). (E) Boxplots showing log2 fold change (log2FC) of CDK8 ChIP-seq signal (RPKM) at all CDK8 peaks (n = 24273), and those with reduced CDK8 (n = 783, ↓) and increased CDK8 (n = 379, ↑). p-values were calculated using a Wilcoxon rank sum test. (F) Boxplots showing the size of CDK8 peaks as in (E). p-values were calculated using a Wilcoxon rank sum test. (G) Venn diagrams representing the overlap between CDK8 peaks and super enhancers (SE) at CDK8 peaks as in (E). Percent overlap of all SEs is indicated. (H) A metaplot (left) showing BioCAP enrichment at CDK8 peaks as in (E) and boxplot quantification (right) of BioCAP RPKM levels. p-Values calculated using Wilcoxon rank sum test are indicated. (I) A metalplot (left) showing FS2-FBXL19 enrichment at CDK8 peaks as in (E) and boxplot quantification (right) of FS2-FBXL19 RPKM levels. p-values calculated using Wilcoxon rank sum test are indicated.
Figure 4—figure supplement 1
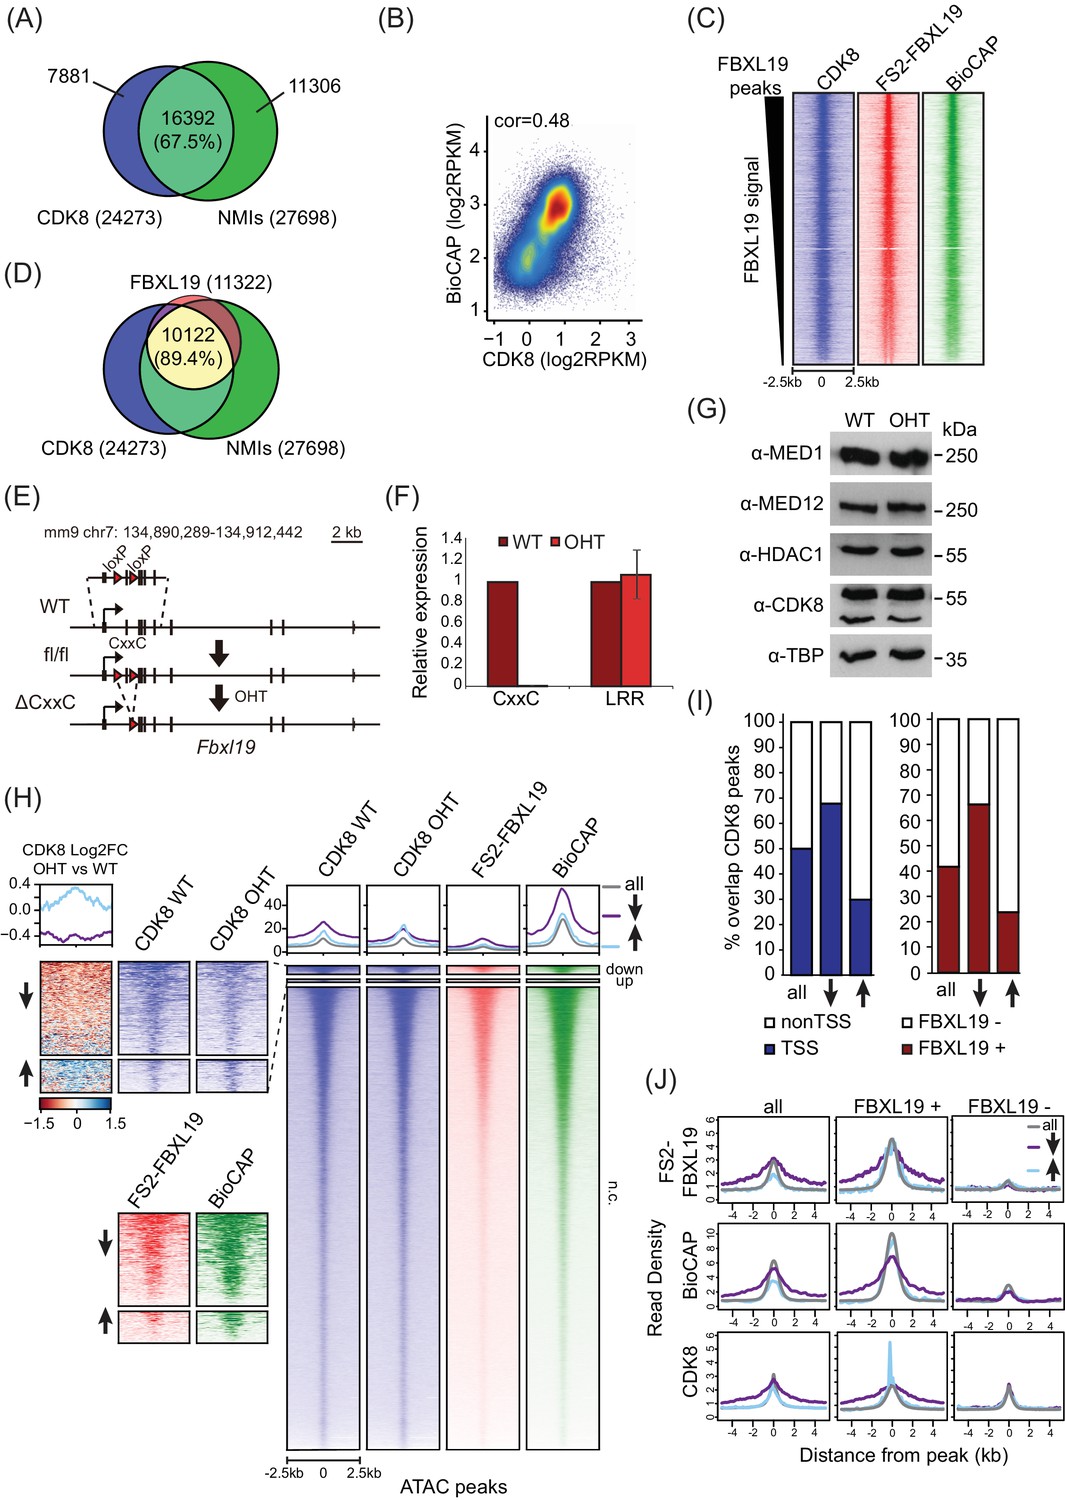
FBXL19 is required for appropriate CDK8 occupancy at a subset of CpG island promoters.
(A) A Venn diagram showing the overlap between CDK8 peaks (n = 24273) and NMIs (n = 27698). (B) A scatter plot showing Spearman correlation between CDK8 signal and BioCAP at NMIs. (C) Heatmaps showing enrichment of CDK8, FS2-FBXL19 and BioCAP at FBXL19 peaks (n = 11322) sorted by decreasing FBXL19 signal. (D) A Venn diagram showing the overlap between FBXL19 peaks (n = 11322), CDK8 peaks (n = 24273), and NMIs (n = 27698). Percent overlap of all FBXL19 peaks is shown. (E) A schematic of the Fbxl19fl/fl allele showing the location of the loxP sites. Treatment with tamoxifen (OHT) results in Cre-mediated deletion of the second exon, encoding for the ZF-CxxC domain but leaving the rest of the gene and protein intact. (F) RT-qPCR of FBXL19 expression in Fbxl19fl/fl ES cells before (WT) and following tamoxifen treatment (OHT). Primers specific for the ZF-CxxC and LRR domains were used. Expression is relative to expression in WT ES cells. Error bars show SEM of three biological experiments. (G) A Western blot analysis of the expression of Mediator subunits in Fbxl19fl/fl (WT) and Fbxl19ΔCXXC (OHT) ES cells. HDAC1 and TBP were probed as loading controls. (H) Heatmaps showing enrichment of CDK8 in Fbxl19fl/fl (WT) and Fbxl19ΔCXXC (OHT), FS2-FBXL19 and BioCAP signal at ATAC peaks divided based on change in CDK8 binding in Fbxl19ΔCXXC ES cells as in Figure 4E. The mean of the enrichment for each group is shown above the heatmaps. Left: zoomed heatmaps for ATAC peaks associated with a decrease (↓) or an increase (↑) in CDK8 binding and a differential heatmap representing log2 fold change of CDK8 signal between OHT and WT samples at the differential peaks. (I) Percent overlap between CDK8 peaks (as in Figure 4E) and transcription start sites of genes (TSS, left) or FBXL19 peaks (right). (J) Metaplots showing enrichment of FS2-FBXL19, BioCAP and CDK8 ChIPseq signal at all CDK8 peaks (left), FBXL19-bound CDK8 peaks (FBXL19+, middle) and nonFBXL19 CDK8 peaks (FBXL19-, right). Peaks were divided based on change in CDK8 binding in Fbxl19ΔCXXC ES cells as in Figure 4E.
Figure 5 with 1 supplement
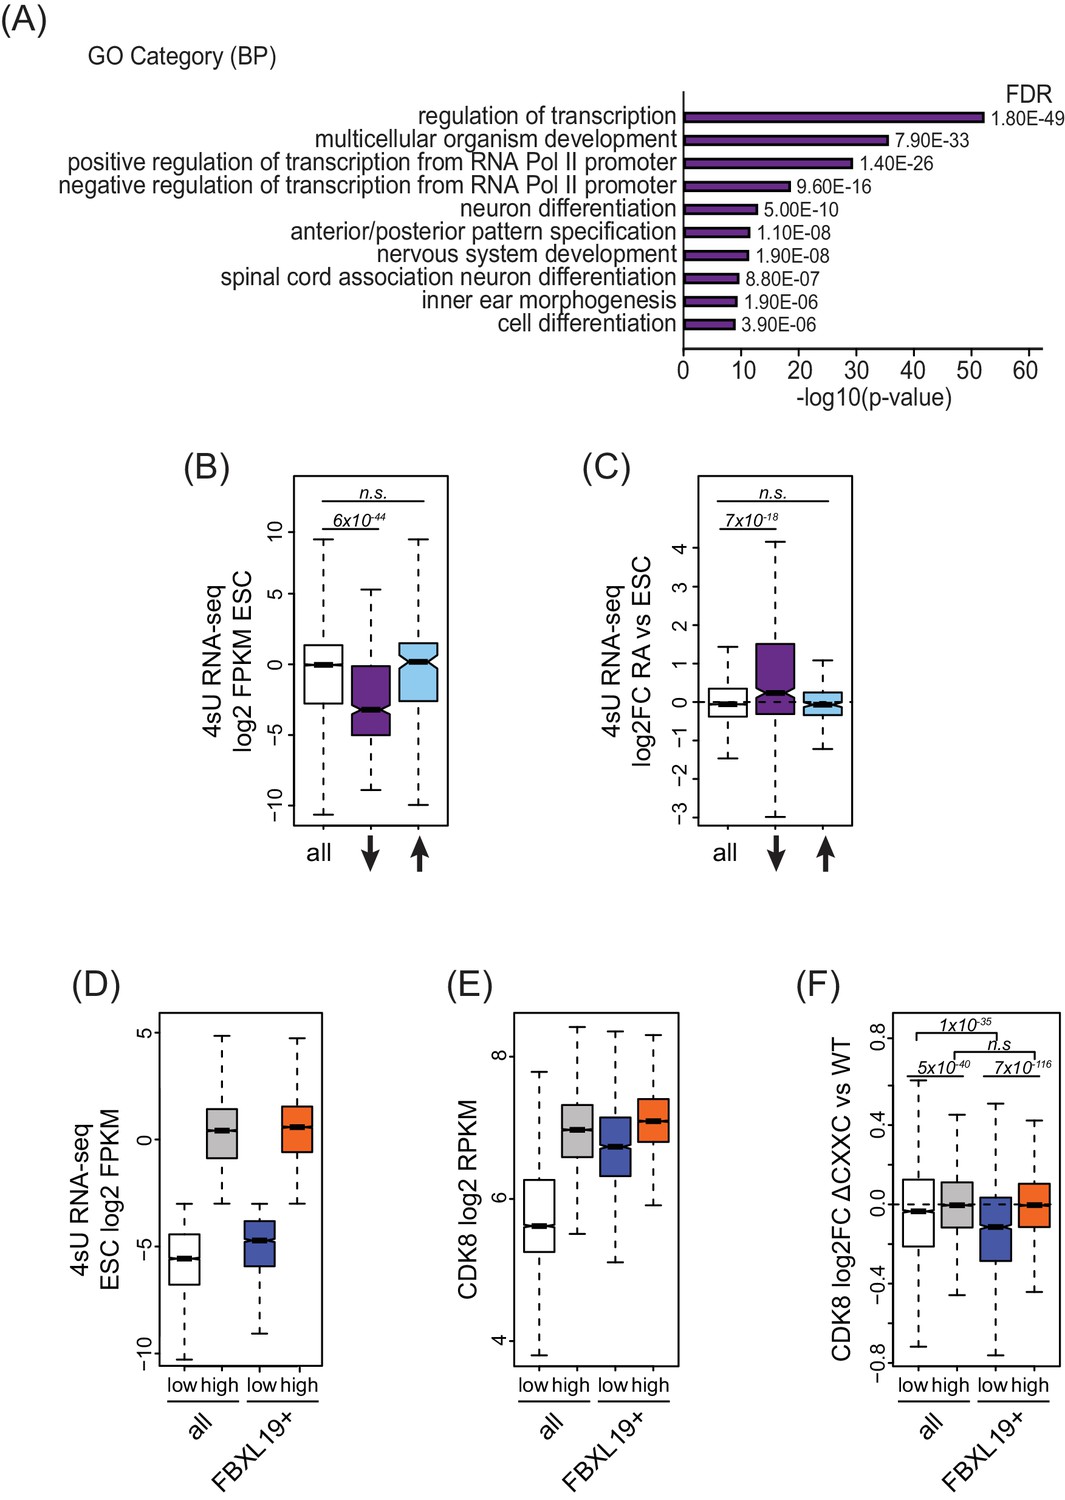
FBXL19 targets CDK8 to promoters of silent developmental genes in ES cells.
(A) Gene ontology analysis of genes associated with a decrease in CDK8 binding (n = 673).(B) A boxplot showing expression levels (log2FPKM) of CDK8-bound genes in wild-type ES cells. CDK8-associated genes are divided based on CDK8 binding in Fbxl19ΔCXXC ES cells: all CDK8-bound (n = 15161), reduced CDK8 (n = 673, ↓), and increased CDK8 binding (n = 255, ↑). p-values were calculated using a Wilcoxon rank sum test. (C) A boxplot showing the change in gene expression (log2 fold change) observed by 4sU RNA-seq of CDK8-associated genes (as in B) following RA treatment. p-values were calculated using a Wilcoxon rank sum test. (D) A boxplot comparing gene expression levels (log2FPKM) of all (n = 19310) and FBXL19-bound (FBXL19+, n = 11368) genes separated by low (all genes n = 7417; FBXl19+ genes n = 2031) and high expression levels (all genes n = 11893, FBXl19+ genes n = 9337) in ES cells (based on Figure 5—figure supplement 1B). (E) A boxplot showing CDK8 enrichment at all and FBXL19-bound genes separated by expression level as in (D). (F) A boxplot showing change in CDK8 binding at the TSSs of all and FBXL19-bound genes divided by expression level as in (D). p-values were calculated using a Wilcoxon rank sum test.
Figure 5—figure supplement 1
FBXL19 targets CDK8 to promoters of silent developmental genes in ES cells.
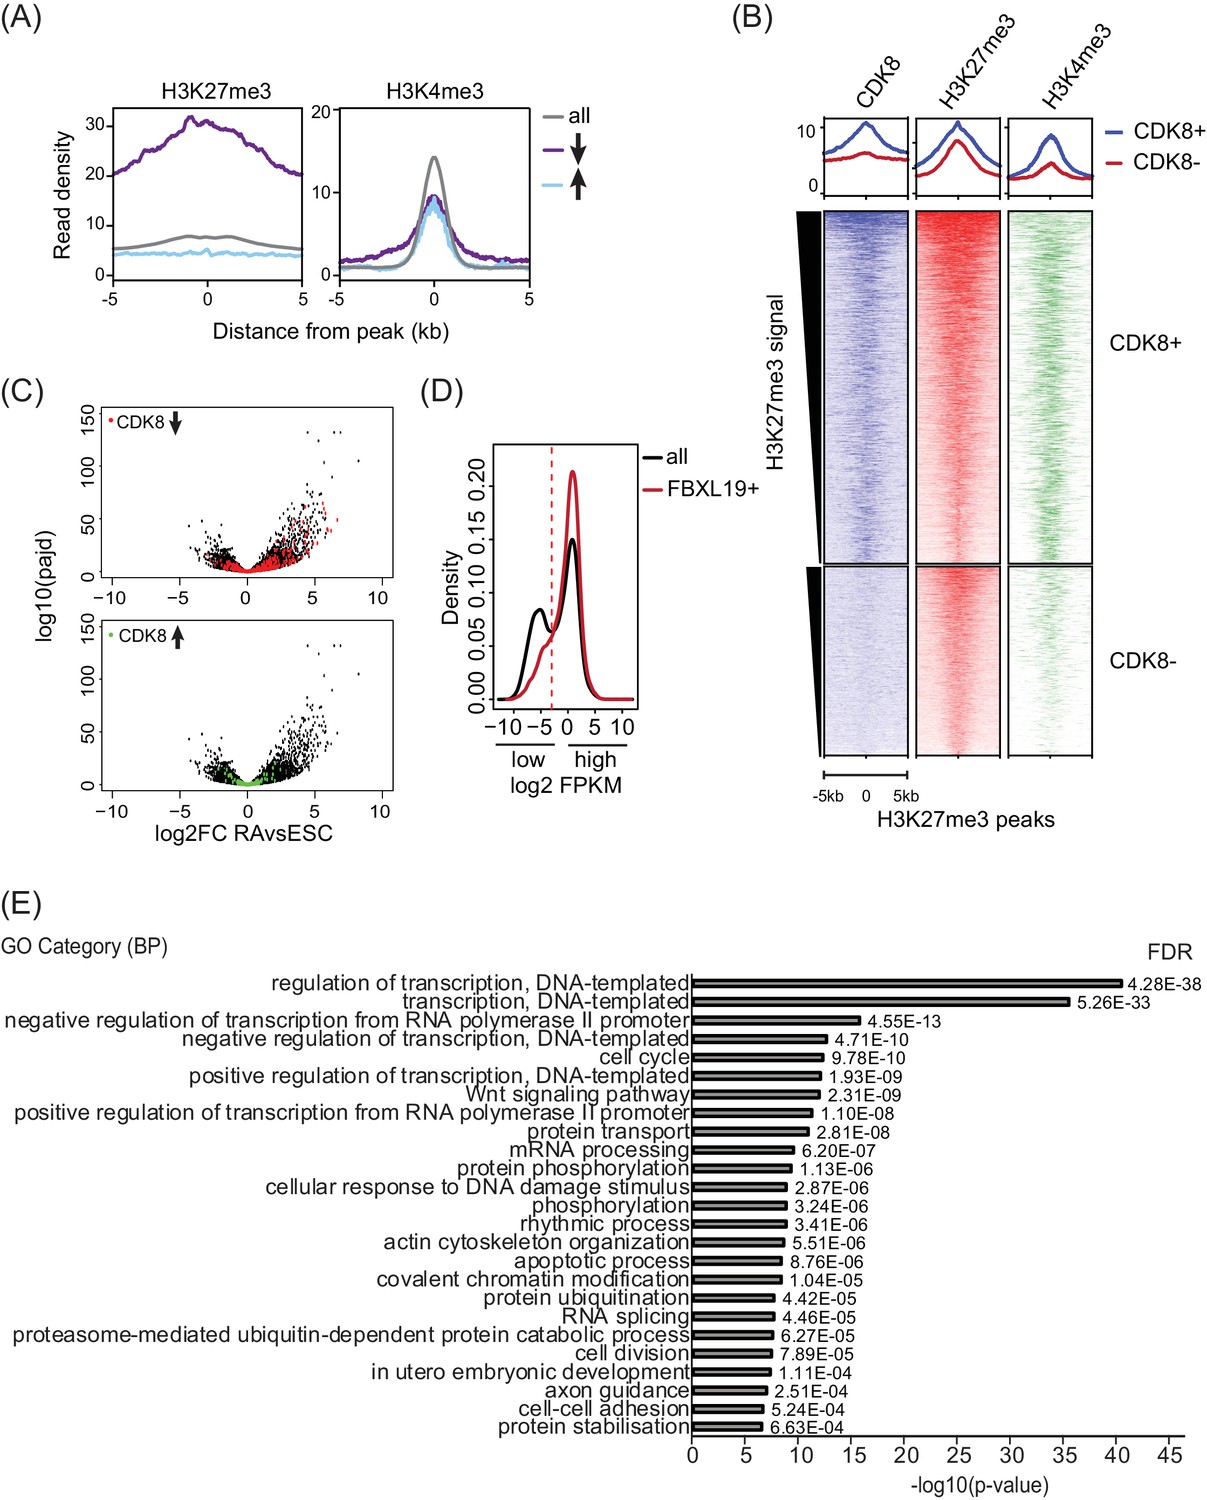
(A) Metaplots showing enrichment of H3K27me3 (left) and H3K4me3 (right) ChIPseq signal at all (top), reduced (↓) and increased (↑) CDK8 peaks. (B) Heatmaps showing enrichment of CDK8, H3K27me3 and H3K4me3 ChIPseq signal at H3K27me3 peaks (n = 5588) divided by overlap with CDK8 peaks (CDK8 +n = 3637, CDK8- n = 1950) sorted by decreasing H3K27me3 signal. Distance from the peak center is shown. (C) Volcano plots showing alterations in expression (log2 fold change) comparing ES cells and RA-treated cells. Genes that rely on FBXL19 for normal CDK8 binding in the ES cells state are plotted. Top: reduced levels of CDK8 (red, n = 673 of which 203 genes are significantly induced by RA and 55 genes are ES-specific). Bottom: increased levels of CDK8 (green, n = 255 of which 28 genes are significantly induced by RA and 26 genes are ES-specific). (D) Genes for Figure 5D–F were separated into two categories (low and high expression) based on FPKM value cut-off represented by the dashed line. (E) Gene ontology analysis of the genes associated with unchanged CDK8 levels in FBXL19ΔCxxC ES cells (n = 14767).
Figure 6 with 1 supplement
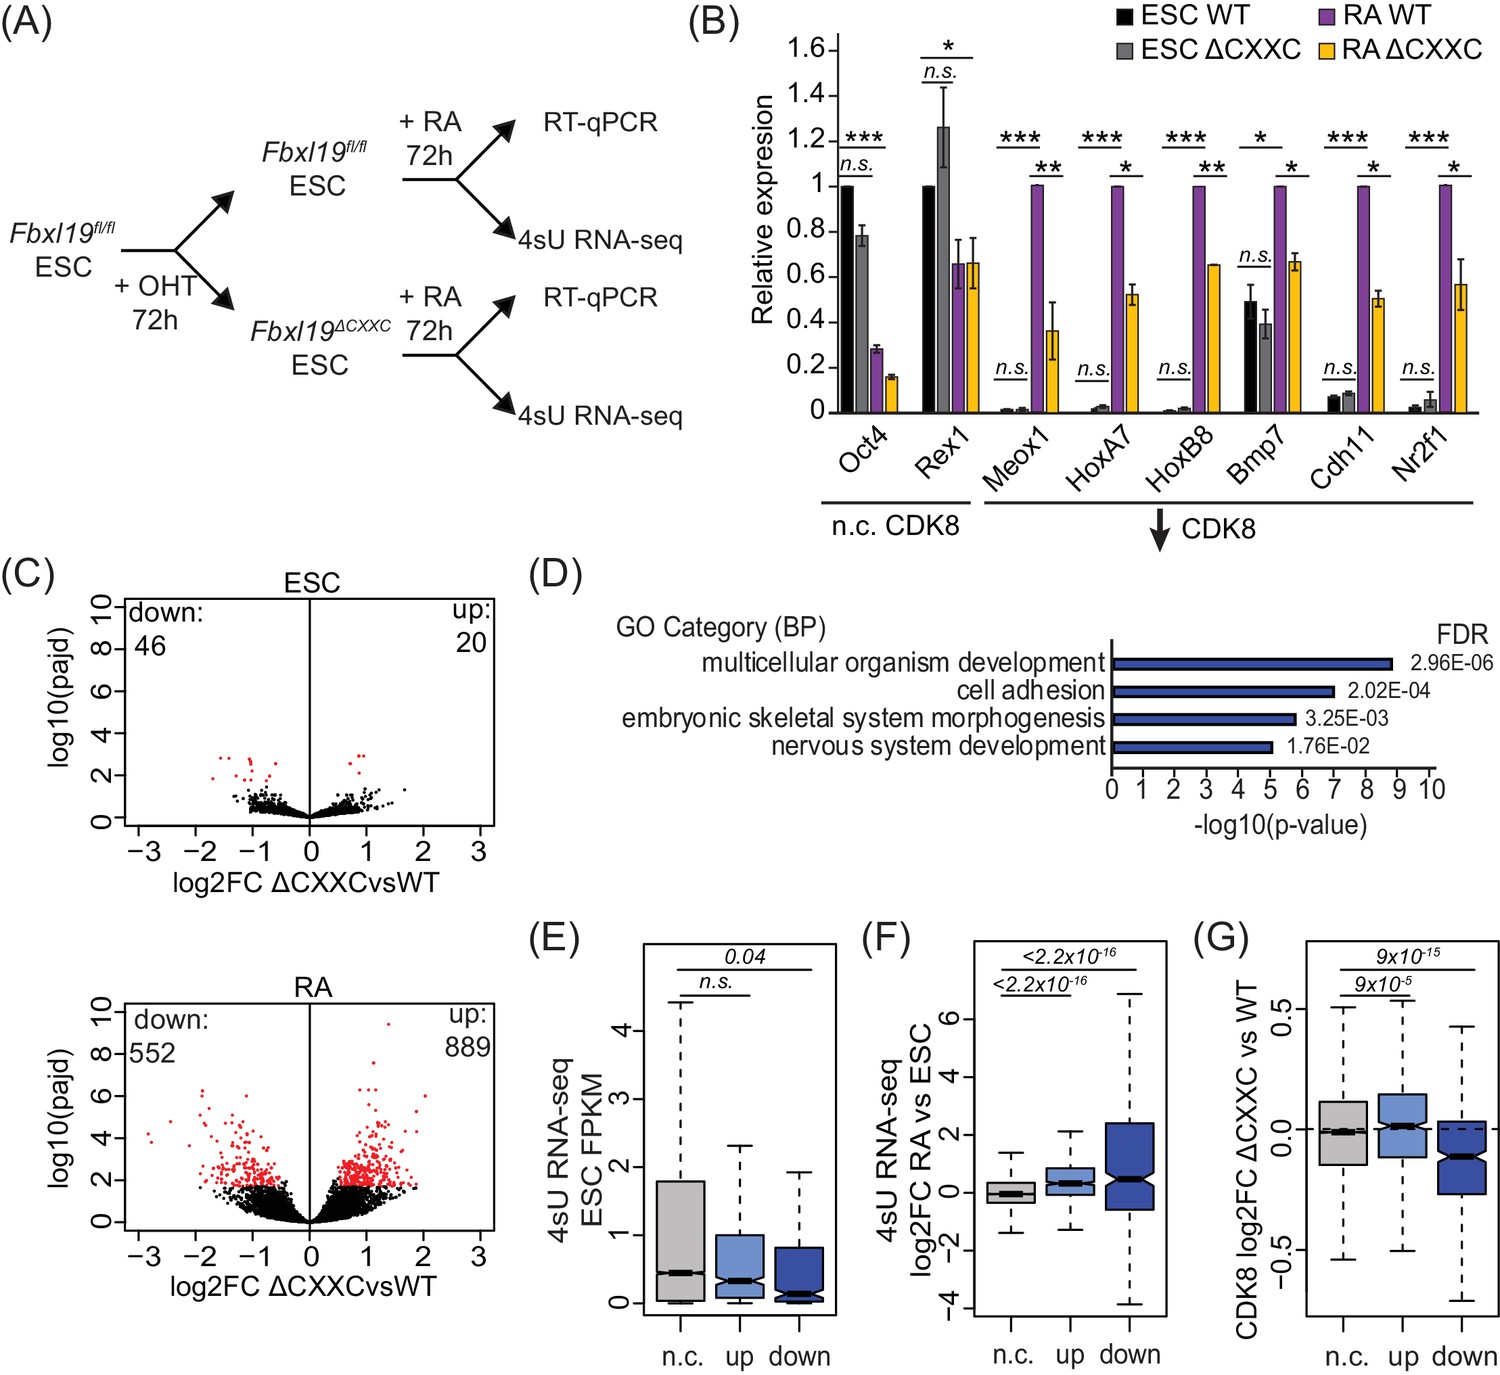
Removing the CpG island-binding domain of FBXL19 results in a failure to induce developmental genes during ES cell differentiation.
(A) A schematic illustrating the OHT treatment and differentiation approach. (B) RT-qPCR gene expression analysis of genes showing decreased CDK8 binding in Fbxl19ΔCXXC ES cells before (ESC) and after RA induction. Expression is relative to the average of two house-keeping genes. Error bars show SEM of three biological replicates, asterisks represent statistical significance calculated by Student T-test: *p<0.05, **p<0.01, ***p<0.001. (C) Volcano plots showing differential expression (log2 fold change) comparing WT and Fbxl19ΔCXXC cells in the ES cell (top) and RA-induced state (bottom). Differentially expressed genes (log2FC < −0.5 or log2FC > 0.5, padj <0.1) are shown in red. The number of genes considered to be significantly altered in expression are indicated. (D) Gene ontology analysis of genes with decreased expression in Fbxl19ΔCXXC ES cells following RA treatment (n = 552). (E) A boxplot indicating the expression level (FPKM) based on 4sU RNA-seq in wild-type ES cells of the gene groupings in (C): n.c. genes n = 17869 (no significant change), up genes = 889, down genes = 552. p-values calculated using a Wilcoxon rank sum test are indicated. (F) A boxplot indicating the log2 fold change in gene expression of the gene groupings in (E) upon RA differentiation of ES cells. p-values calculated using a Wilcoxon rank sum test are indicated. (G) A boxplot indicating the change in CDK8 binding (log2FC) at the promoters of the gene groupings in (E) in ES cells. p-values calculated using a Wilcoxon rank sum test are indicated.
-
Figure 6—source data 1
Differential gene expression analysis.
- https://doi.org/10.7554/eLife.37084.015
Figure 6—figure supplement 1
Removing the CpG island-binding domain of FBXL19 results in a failure to induce developmental genes during ES cell differentiation.
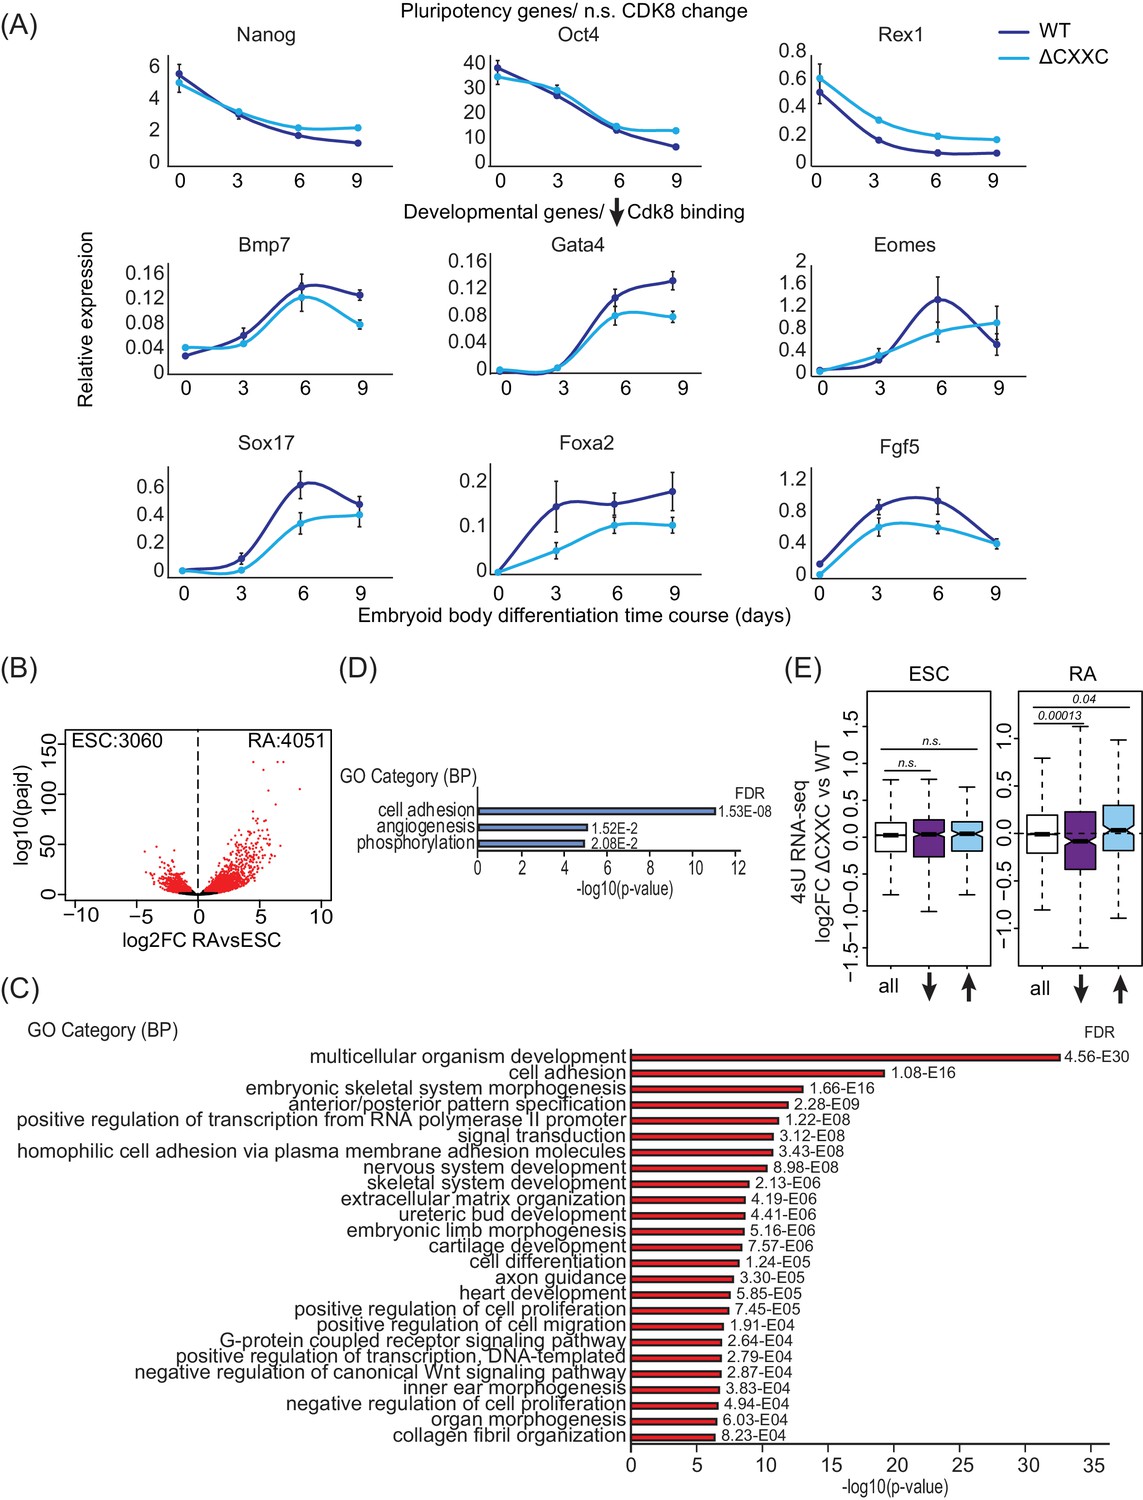
(A) RT-qPCR gene expression analysis of developmental genes during an embryoid body differentiation time course. Expression is relative to an average of two house-keeping genes. Error bars represent SEM of three biological replicates. (B) A volcano plot showing differential expression (log2 fold change) comparing ES cells and RA-induced cells. Differentially expressed genes (log2FC < −0.5 or log2FC > 0.5, padj <0.05) are shown in red. The number of genes considered to be significantly different in expression are indicated. (C) Gene ontology analysis of the genes induced following RA treatment (n = 4051). (D) Gene ontology analysis of the up-regulated genes in Fbxl19ΔCXXC cells following RA treatment (n = 889). (E) Expression changes of CDK8-target genes (log2 fold change) in Fbxl19ΔCXXC cells compared to WT cells in ES cells (ESC, left) and following RA treatment (right). Genes are divided based on the changes in CDK8 binding in Fbxl19ΔCXXC ES cells - all CDK8 peaks (n = 15161), reduced CDK8 peaks (n = 673, ↓) and increased CDK8 peaks (n = 255, ↑). p-values were calculated using a Wilcoxon rank sum test.
Figure 7 with 1 supplement
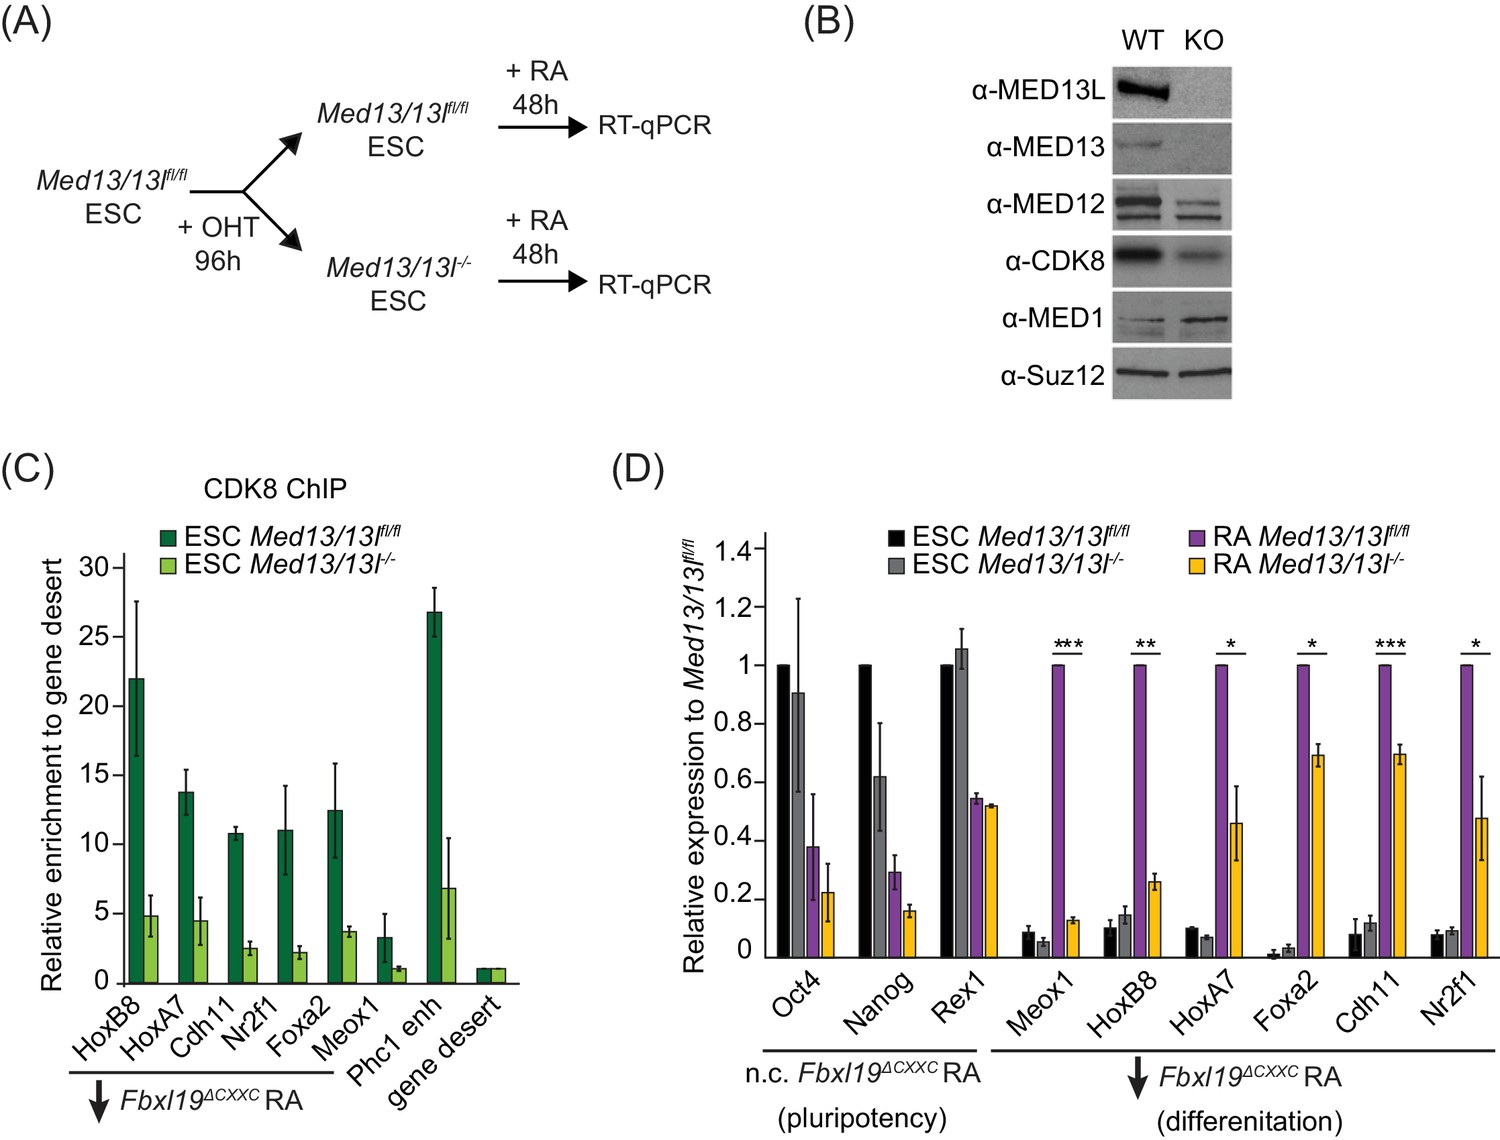
FBXL19 target genes rely on CDK-Mediator for activation during differentiation.
(A) A schematic illustrating the OHT treatment to generate MED13/13L KO ES cells and differentiation approach. (B) Western blot analysis showing the efficiency of MED13/13 knock-out upon 96 hr OHT treatment of Med13/13lfl/fl ES cells. Suz12 was blotted as a loading control. (C) ChIP-qPCR showing CDK8 enrichment in WT and MED13/13L KO ES cells. Enrichment is relative to gene desert control region. Error bars show standard deviation of two biological replicates. (D) RT-qPCR gene expression analysis in WT and MED13/13L KO ES cells before and after RA induction. Expression was normalized to the expression of the PolIII-transcribed gene tRNA-Lys and is represented as relative to WT ES cells (for pluripotency genes) or RA-treated WT cells (for differentiation markers). Error bars show SEM of three biological replicates, asterisks represent statistical significance calculated by Student T-test: *p<0.05, **p<0.01, ***p<0.001.
Figure 7—figure supplement 1

FBXL19 target genes rely on CDK-Mediator for activation during differentiation.
A schematic representation of the strategy used to generate a MED13/13 l double conditional ERT2-Cre ES cell line. LoxP sites flanking exons 7 and 8 of Med13 and Med13l were inserted using CRISPR-Cas9 mediated targeting. Treatment with tamoxifen (OHT) results in deletion of exons 7 and 8.
Figure 8
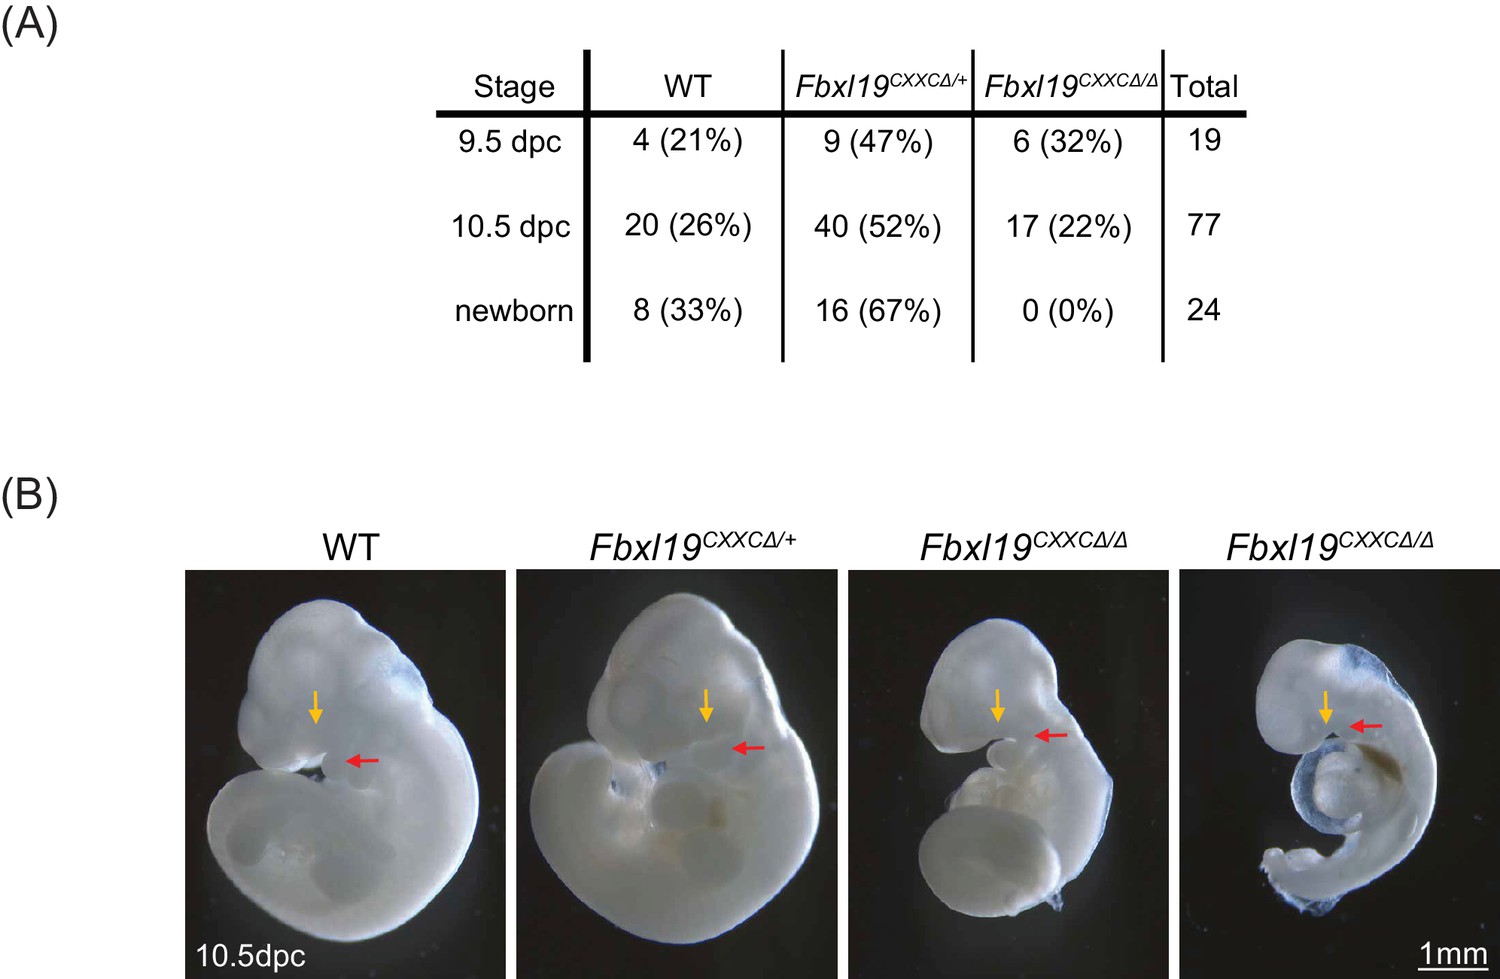
Deletion of the ZF-CxxC domain of FBXL19 leads to mouse embryonic lethality.
(A) After crossing heterozygotes, the number of live embryos (9.5 dpc or 10.5 dpc) or newborn pups with the indicated genotypes is indicated with the percentages shown in parentheses. (B) The morphological changes in 10.5 dpc Fbxl19CXXCΔ/Δ embryos are indicated. Lateral views of wild-type (wt), together with heterozygous (Fbxl19CXXCΔ/+) and homozygous (Fbxl19CXXCΔ/Δ) mutants are shown. Maxillary and mandibular components of first branchial arches are indicated by yellow and red arrows, respectively.
Author response image 1
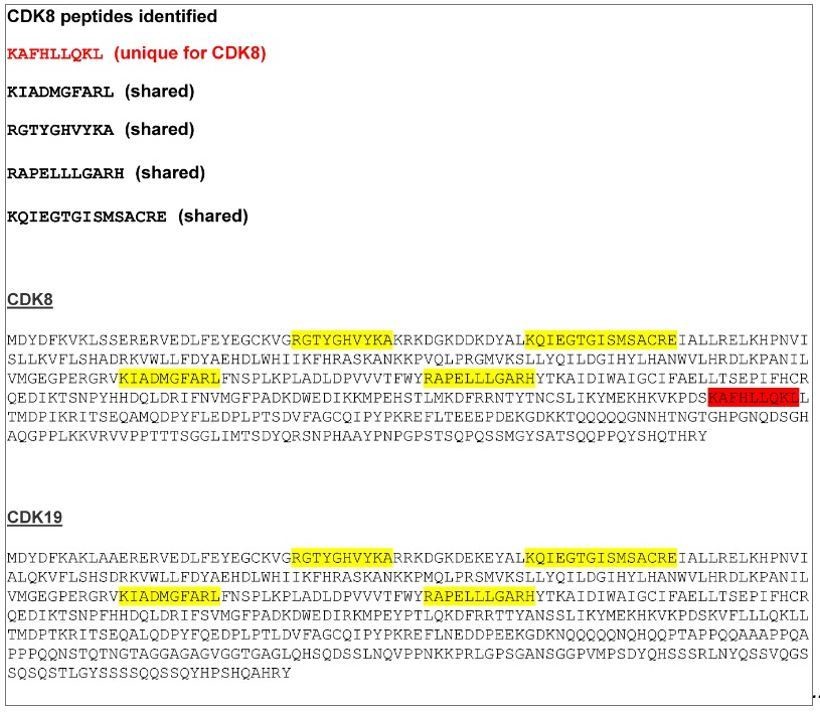
CDK8/19 peptide sequences identified by mass spectrometry.
A CDK8 unique peptide is indicated in red. The other four peptides, indicated in yellow, are shared between CDK8 and CDK19.
Author response image 2
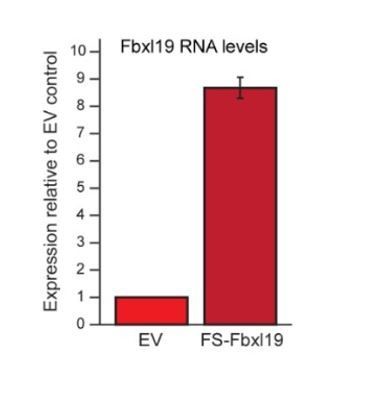
Fbxl19 overexpression levels.
RT-PCR showing the expression levels of FS2-Fbxl19 relative to endogenous Fbxl19 in the empty vector (EV) control line. Data is the average of three biological replicates. Error bars represent standard deviation.
Author response image 3
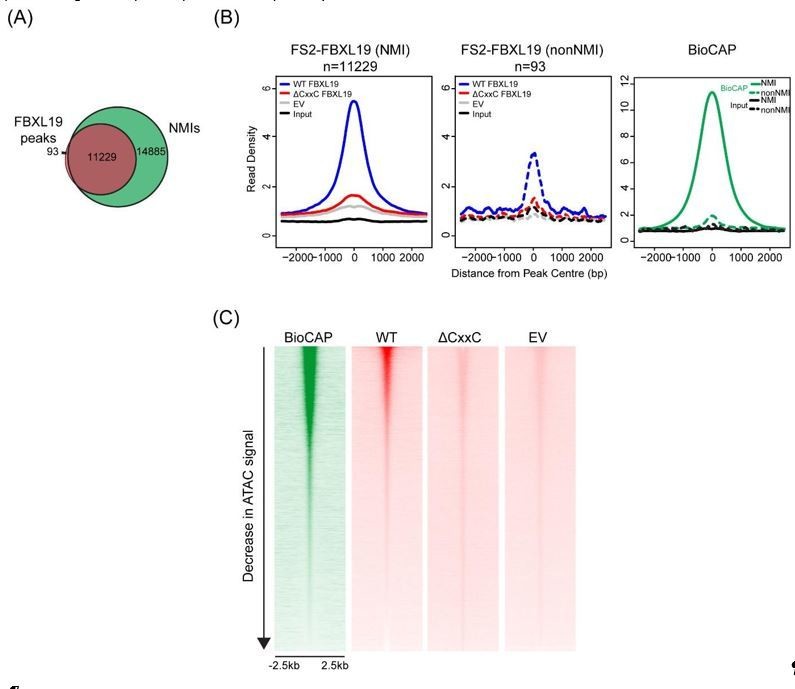
(A) A Venn diagram showing the overlap between FBXL19 peaks and NMIs; (B) Metaplot analysis of enrichment of WT FS2-FBXL19, ΔCxxC FS2-FBXL19, and EV control at FBXL19-occupied NMIs (solid line) and nonNMI (dashed line) regions; (C) Heatmaps showing enrichment of BioCAP, WT FS2-FBXL19, ΔCxxC FS2FBXL19 and EV control at DNA accessible regions measured by ATAC-seq.
https://doi.org/10.7554/eLife.37084.023Additional files
-
Transparent reporting form
- https://doi.org/10.7554/eLife.37084.019
Download links
A two-part list of links to download the article, or parts of the article, in various formats.
Downloads (link to download the article as PDF)
Open citations (links to open the citations from this article in various online reference manager services)
Cite this article (links to download the citations from this article in formats compatible with various reference manager tools)
FBXL19 recruits CDK-Mediator to CpG islands of developmental genes priming them for activation during lineage commitment
eLife 7:e37084.
https://doi.org/10.7554/eLife.37084


