Mediodorsal thalamus is required for discrete phases of goal-directed behavior in macaques
- Georgetown University, United States
- National Institute of Mental Health, United States
Figures
Figure 1
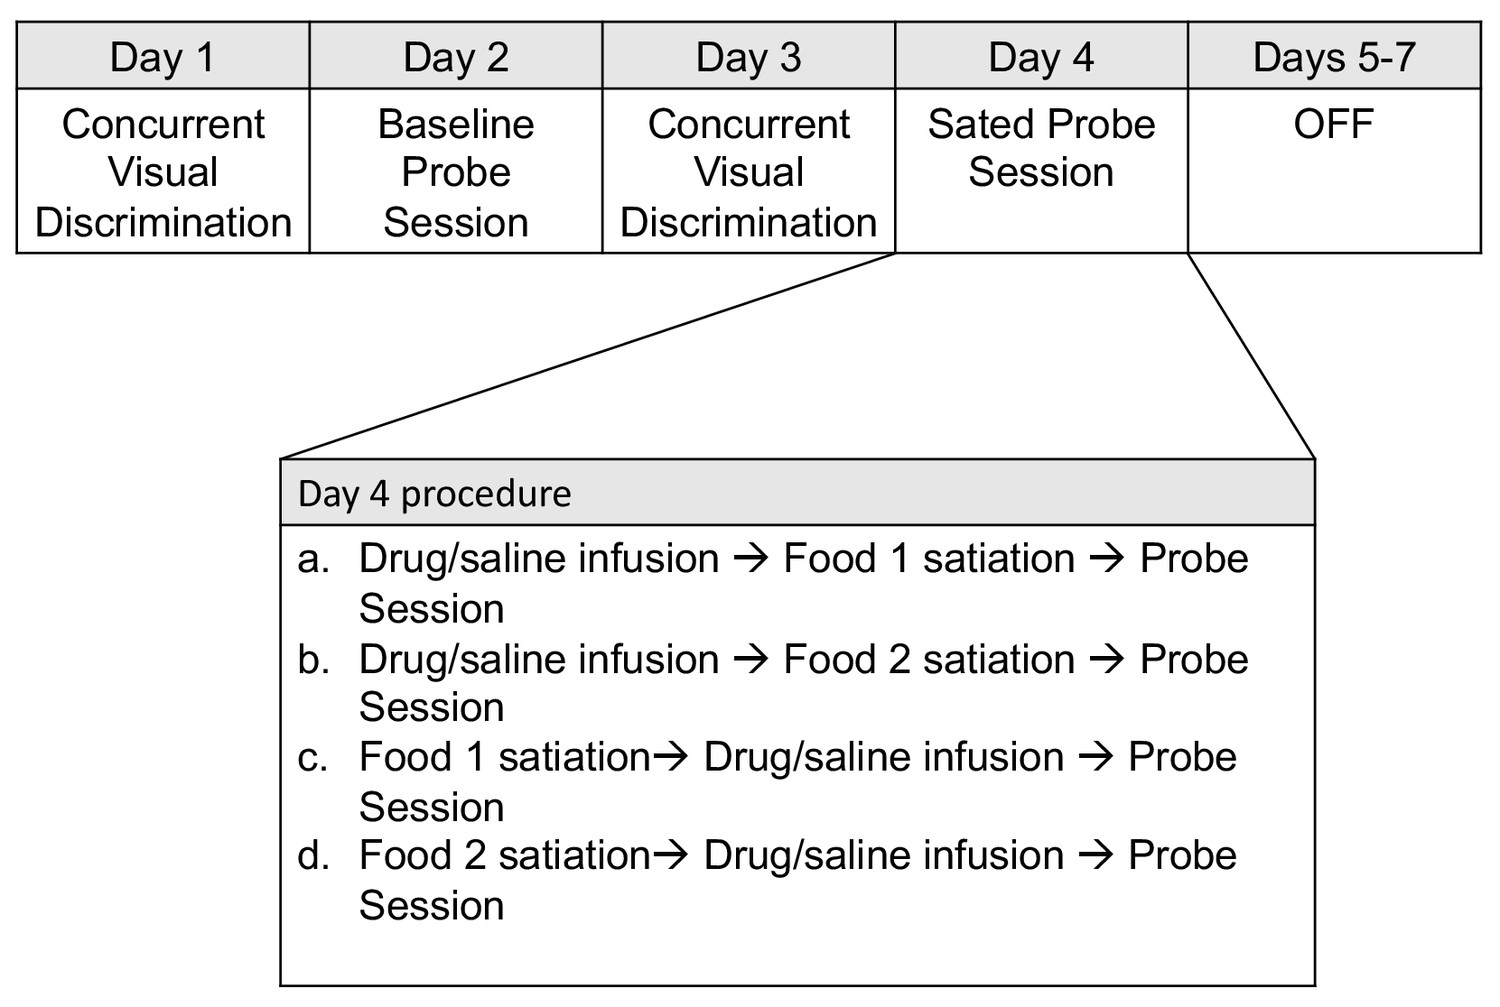
Weekly schedule of testing sessions.
Days 1–7 represent a sequence of daily behavioral training. Testing order was pseudorandomized for each animal on the infusion probe sessions conducted on Day 4.
Figure 2 with 2 supplements
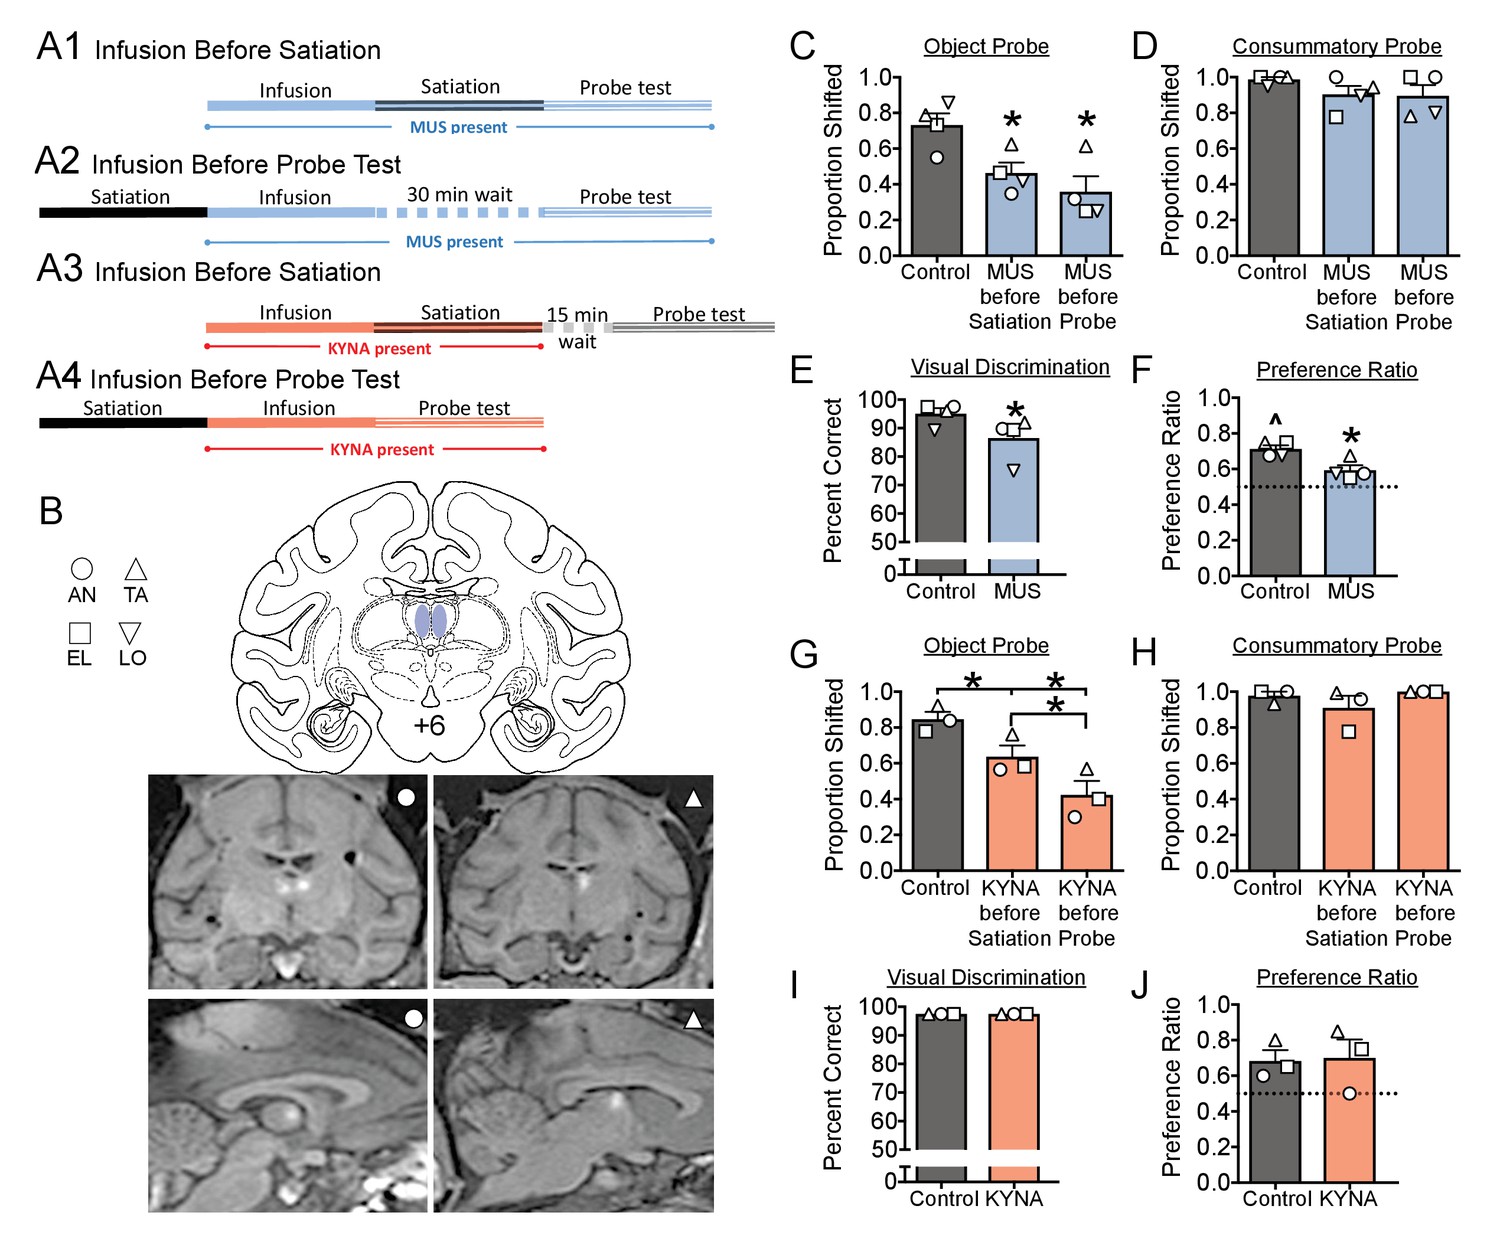
(A) Schematic, indicating the timing of drug infusions and tests.
Muscimol (MUS, blue), was infused either before satiation (A1), and was thus present during both satiation and the probe test, or infused 30 min before the probe test, and was thus present only during the probe test (A1). The 30 min interval between infusion and test in (A2) was selected to match the interval between infusion and probe in (A1). Kynurenic acid (KYNA, red) was infused either before satiation (A3) or before the probe test (A4). The 15 min interval between satiation and probe test in (A3) was selected to allow for clearance of KYNA prior to the probe test. (B) Intended infusion sites (top) with representative MRIs showing gadolinium contrast after infusion into the MD of two subjects (bottom). (C–J) Histograms indicate means + SEM with individual subject data points overlaid. *=significant difference from control, p<0.05; ^=significantly greater than chance, p<0.05. Full statistical results are presented in Supplementary file 1c.
Figure 2—figure supplement 1
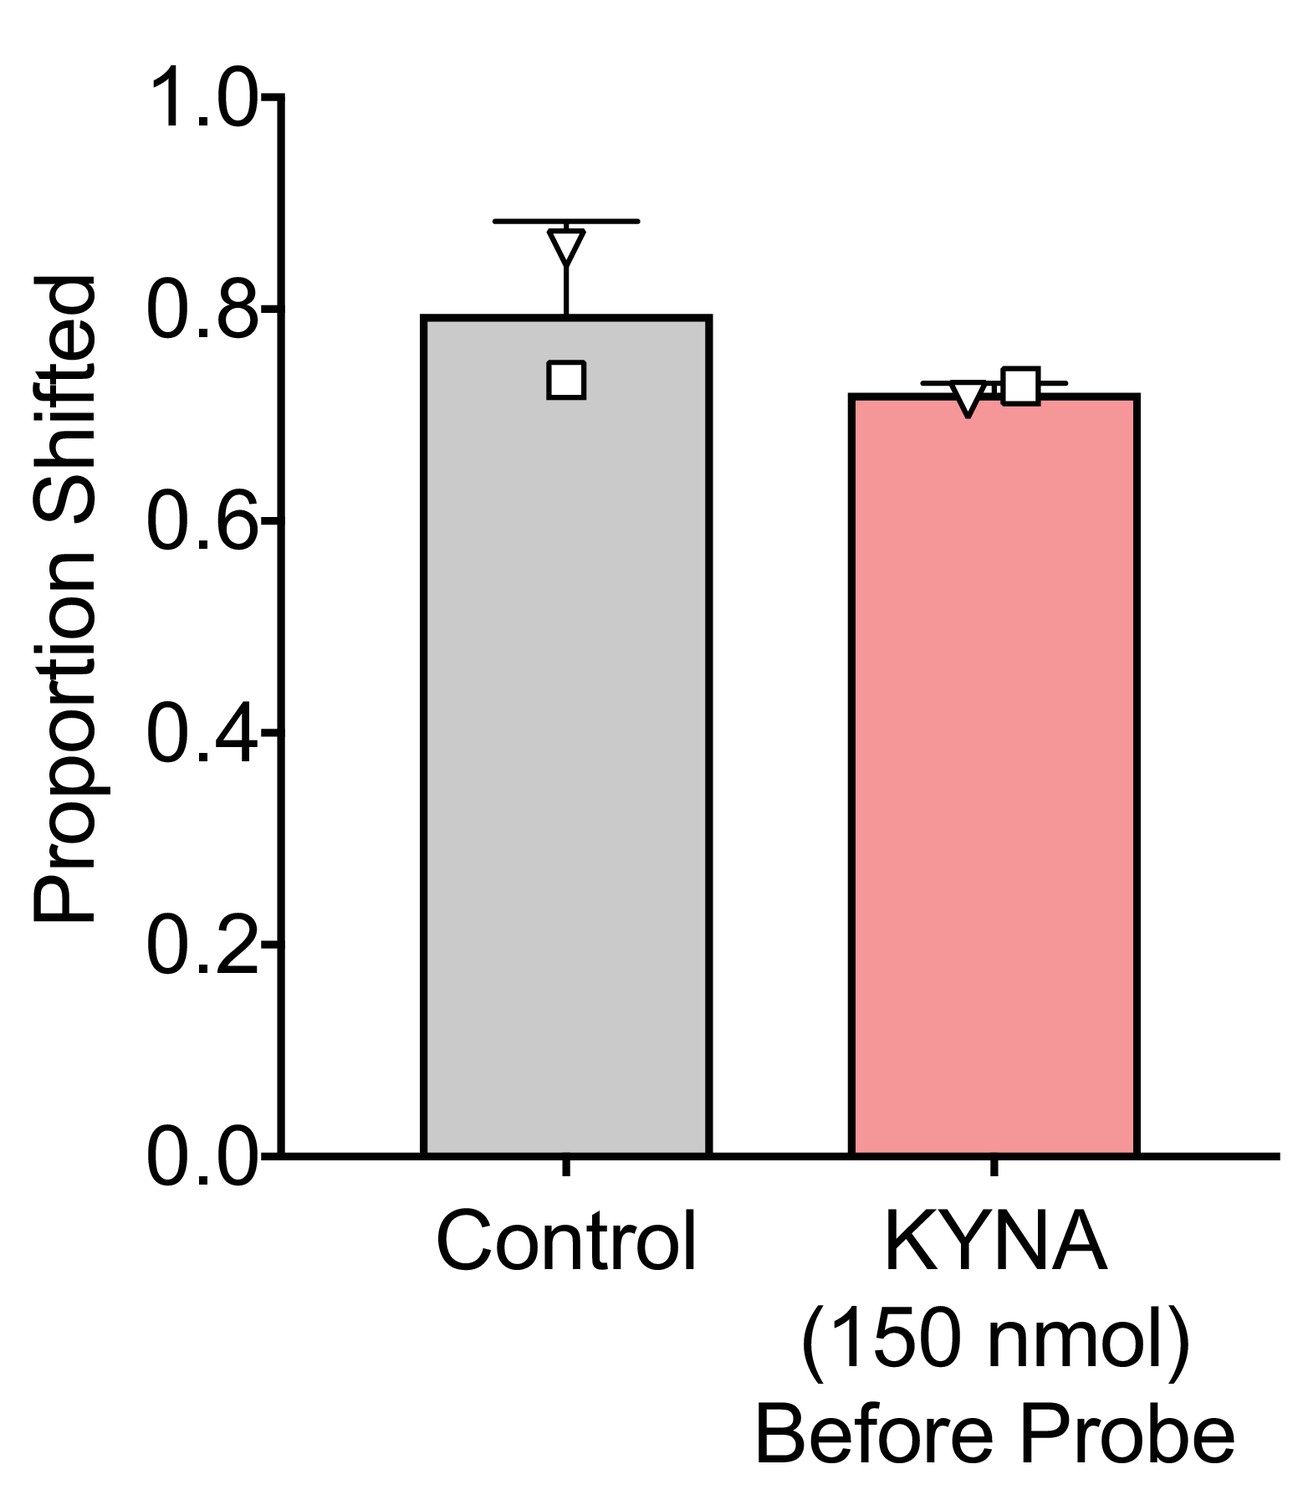
Low dose KYNA infused before the probe session does not impact reinforcer devaluation.
Two animals (EL and LO) were microinjected with a lower dose of KYNA (150 nmol, i.e., one third of the dose we used in the experiments shown in Figure 2). The half-life of KYNA after microinjection into the rodent hippocampus is non-linear with values increasing from a T1/2 of 8 min during the 15 min immediately following drug infusion, to a T1/2 of 16 min in the second 15 min following drug infusion, and further still to a T1/2 of 24 min in the second 30 min following drug infusion (Vécsei and Beal, 1990; Turski and Schwarcz, 1988). Similar studies have not been performed in primates, but these data are consistent with our prior observations of the duration of deficits following KYNA injection (Forcelli et al., 2014). Based on the timing of our experiments (the probe session was conducted 45 min after drug infusion,~3 half-lives), less than 10% of drug is expected to remain during the probe session. However, to take a conservative approach, we selected the dose of 150 nmol to approximate two half-lives. The proportion shifted did not differ after injection of this lower dose of KYNA. These data support the timing of our experiments in Figure 2, and strongly suggest that KYNA infusion prior to satiation does not result in neuroactive levels of drug remaining by the time the probe test is initiated. Thus, deficits we observed following KYNA infusion before satiation in Figure 2 are due to impacts on the MD during satiation per se.
Figure 2—figure supplement 2
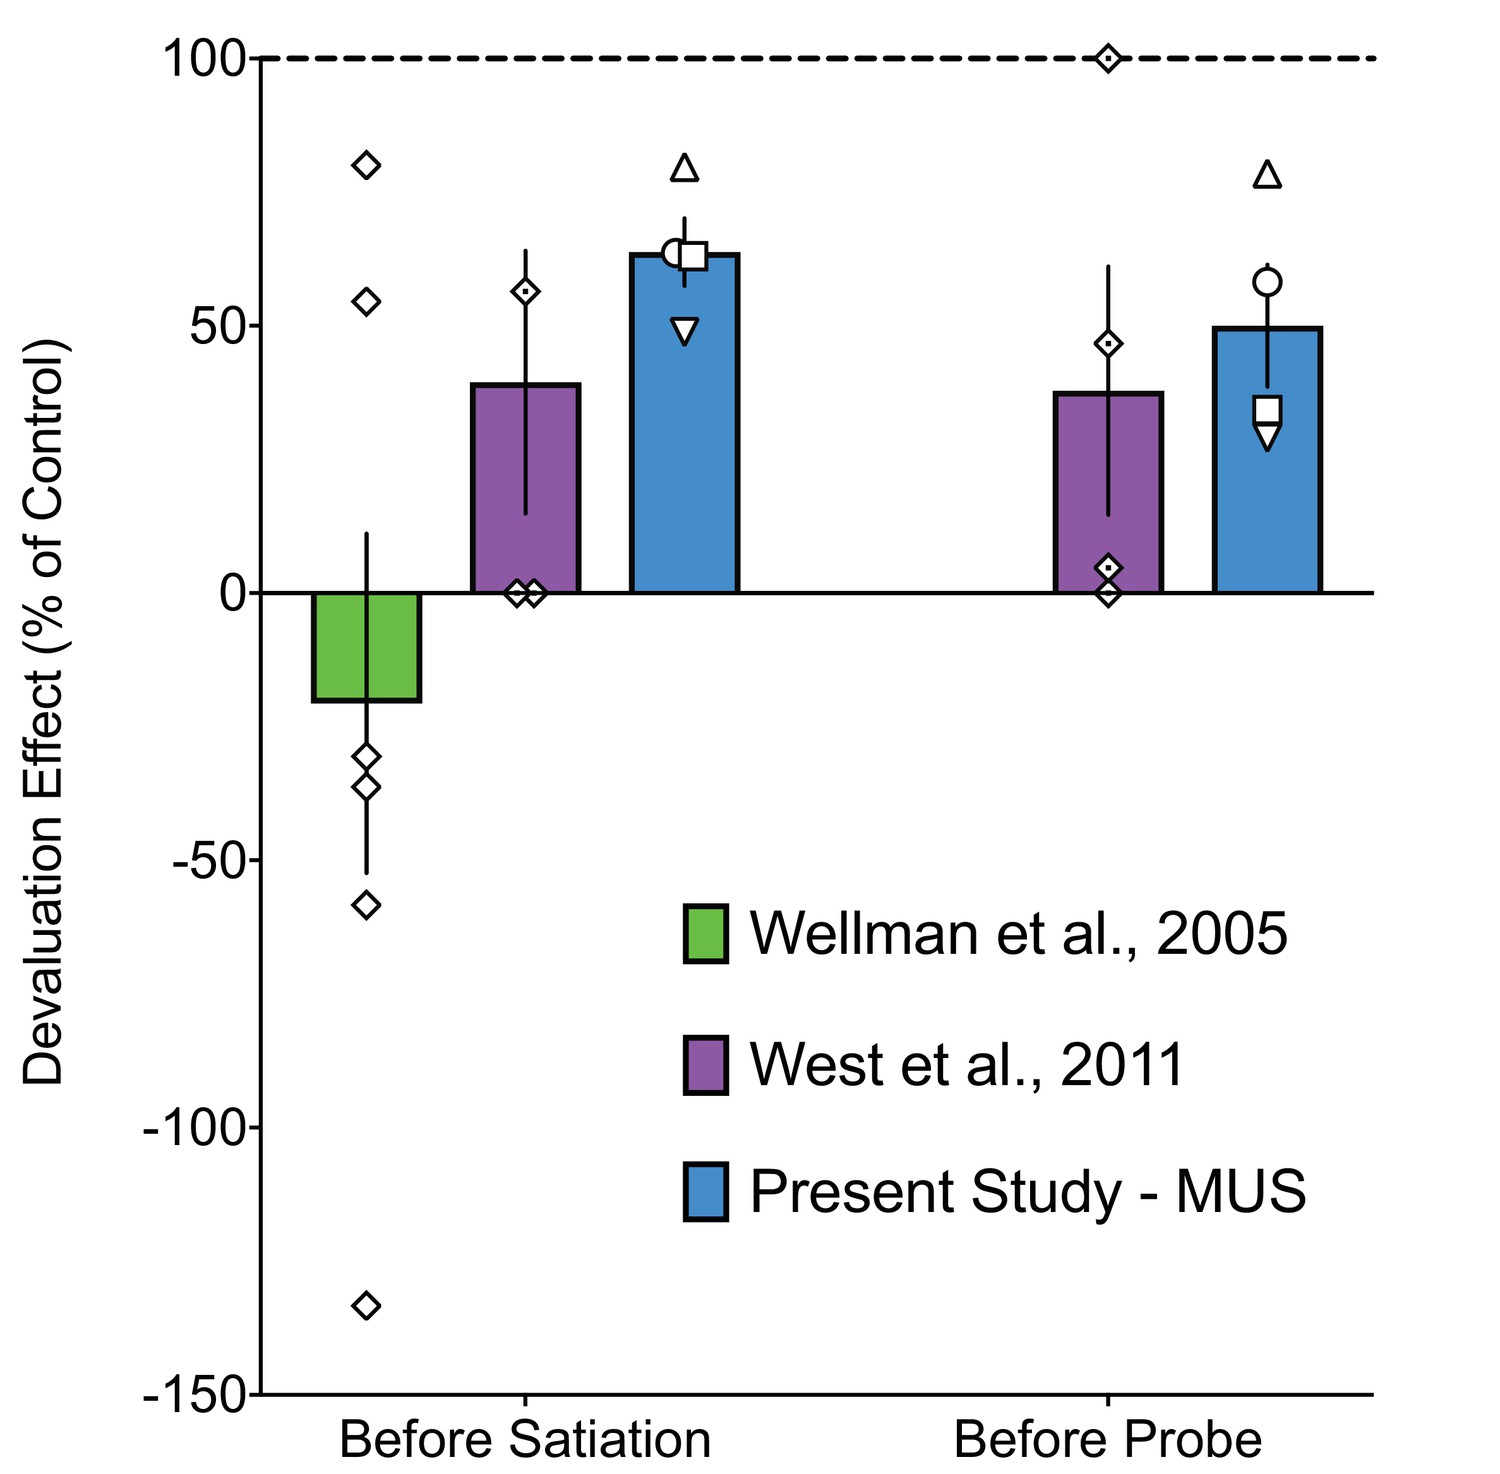
Magnitude of Disruption in Devaluation Following Inactivation of the MD is similar to that seen after inactivation of either BLA or OFC.
We compared the magnitude of devaluation deficits in the present study to those in our prior reports following microinjection of MUS into either the BLA or OFC (Wellman et al., 2005; West et al., 2011). The only other primate study to employ inactivation methods in the reinforcer devaluation task used a different agent (THIP) (Murray et al., 2015) so we were unable to compare those data to experiments conducted using MUS. Moreover, all prior studies of the thalamus in the reinforcer devaluation task have used permanent lesions, rather than inactivation (Izquierdo et al., 2004; Izquierdo and Murray, 2010; Browning et al., 2015), and thus were not compared to the present study. Note that West and colleagues (2011) did not attempt to dissociate between the effects of inactivation of Area 11 and Area 13. Further, note that the Wellman study (2005) only found a deficit after injection before satiation, and not when MUS was injected prior to the probe. Thus, only data from the infusion before satiation condition are included. To compare across these studies, we normalized the proportion shifted after drug infusion to the proportion shifted after control infusions. Normalization was required, as the raw proportion shifted under saline conditions differed substantially across these studies. Proportion shifted values for drug-infused sessions were expressed as a percent of the value during the control session, thus, a value of 100% indicates no deficit. In all cases, a one-tailed, one sample T-test (against a test value of 100, i.e. no change from control) confirmed the presence of deficits compared to control conditions. [Wellman et al., Before Satiation: t = 3.8, df = 5, p=0.006; West et al., Before Satiation: t = 2.47, df = 3, p=0.045; Present Study, Before Satiation: t = 5.73, df = 3, p=0.005; West et al., Before Probe: t = 2.68, df = 3, p=0.0375; Present Study, Before Probe: t = 4.38, df = 3, p=0.011]. We next analyzed the normalized proportion shifted for the three studies when MUS was infused before satiation. Analysis of Variance did not reveal a significant treatment effect (F2,11=2.768, p=0.106), but consistent with visual observation of the data, there was a non-significant trend towards a difference between the effect in the present study and that reported in Wellman et al., p=0.084, Dunnett's test). We next compared the proportion shifted when MUS was infused prior to the probe test in West, et al., to that in the present study. Unpaired t-test showed that the magnitude of devaluation did not differ between these conditions (t=0.4691, df=6, p=0.6555). These data suggest that deficits caused by inactivation of any of these regions are similar in magnitude, although, in the case of infusion before satiation, there is a trend toward more severe deficits after inactivation of BLA. The symbols used for the present study follow the conventions in the other figures. Diamonds show individual animals for the other studies. In all cases, the deficits we observed fell within the range of deficits previously reported after inactivation of the BLA and OFC.
Additional files
-
Supplementary file 1
(A) Amount of food consumed (in grams) during selective satiation does not differ across session types.
Table shows the amount of food consumed for each animal on each session type. For infusions performed before satiation, mixed effects analysis revealed no significant main effects of food type (F1,15=2.6, p=0.13) or treatment (F0.3,2.1=0.87, p=0.30) nor a food-by-treatment interaction (F1.9,14=0.34, p=0.71). Similarly, for either infusions performed before the probe test, no significant main effects of food type (F1,15=1.15, p=0.30) or treatment (F1.4,10.5=0.005, p=0.99) nor a food-by-treatment interaction (F0.3,2.4=0.07, p=0.52) were detected. Thus, differences in the degree of satiation across session types cannot contribute to the deficits we report. (B) Testing Order for Control Infusions. As described in the methods, to minimize penetrations of the brain, animals received one saline infusion and one sham infusion for each drug. Sham infusions were performed in the same manner as drug infusions except no cannula was inserted. A pair of tests, comprised of one sham infusion and one saline infusion, were performed for each drug (i.e., one pair was performed for MUS, one pair for KYNA). Each pair contained a manipulation performed before satiation and a manipulation performed before the probe session. Furthermore, each pair contained one control with each of the two foods. In the Table, SHAM indicates a sham infusion, SAL indicates a saline infusion. Boxes shaded blue are control infusions for MUS, while those shaded red are control infusions for KYNA. One animal (AN), received an additional control session for KYNA. Data across these two control sessions were summed for analysis. Since LO was not included in the KYNA experiments, this animal only received two control infusions (i.e., those for MUS). (C) Statistical Results for Figure 2. The table shows detailed statistical results for the data presented in Figure 2. Post tests (where appropriate) were Holm-Sidak corrected for multiple comparisons. (D) Tabulated number of objects associated with each food chosen during the non-sated probe (FN) and during the sated probe (FD). The saline infusions followed the schedule shown in Supplementary file 1a. *=summed across two control sessions. N/A = not tested.
- https://doi.org/10.7554/eLife.37325.007
-
Transparent reporting form
- https://doi.org/10.7554/eLife.37325.008
Download links
A two-part list of links to download the article, or parts of the article, in various formats.
Downloads (link to download the article as PDF)
Open citations (links to open the citations from this article in various online reference manager services)
Cite this article (links to download the citations from this article in formats compatible with various reference manager tools)
Mediodorsal thalamus is required for discrete phases of goal-directed behavior in macaques
eLife 7:e37325.
https://doi.org/10.7554/eLife.37325


