Chromatin accessibility dynamics across C. elegans development and ageing
- University of Cambridge, United Kingdom
- Max Delbrück Center for Molecular Medicine, Germany
- Otto-Warburg Laboratories, Germany
Figures
Figure 1 with 3 supplements
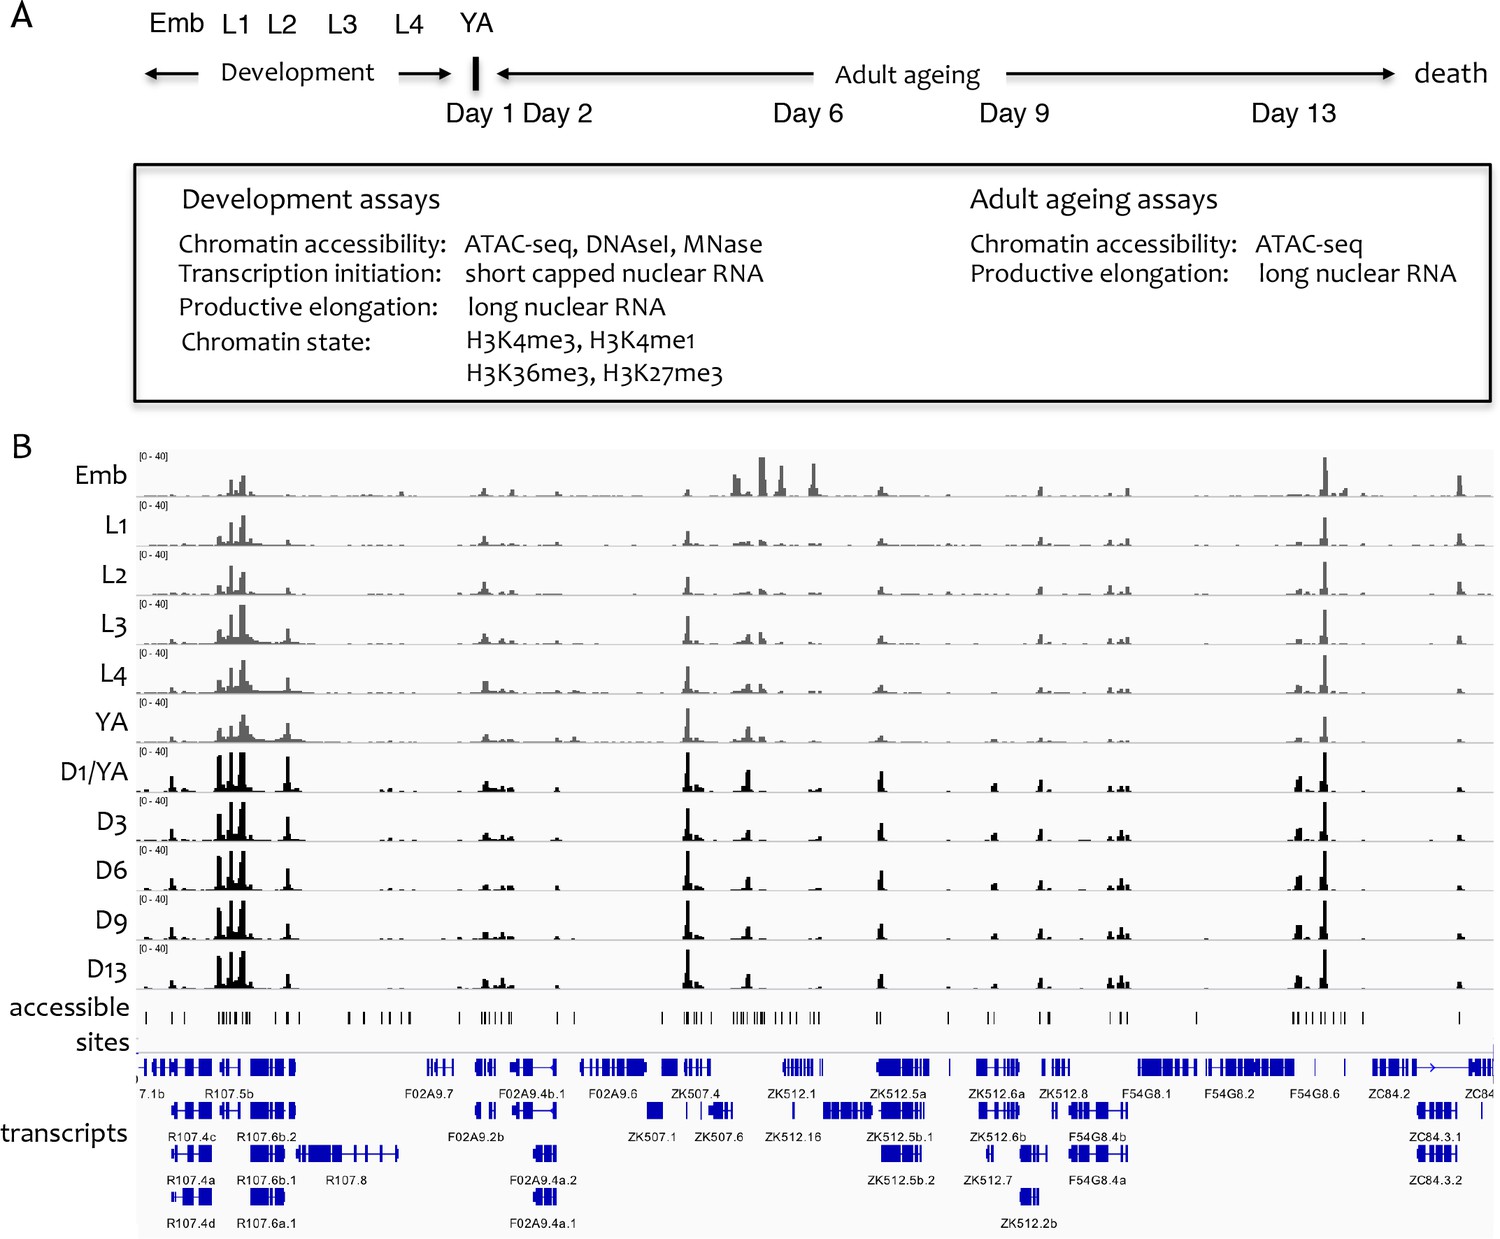
Overview of the project.
(A) Overview of genome-wide assays and time points of developmental and ageing samples. For development samples, chromatin accessibility, transcription initiation, productive elongation, and chromatin state were profiled in six stages of wild-type animals (embryos, four larval stages, young adults). For ageing samples, chromatin accessibility and productive transcription elongation were profiled in five time points of sterile adult glp-1 mutants (Day 1/Young adult, Day 2, Day 6, Day 9, Day 13). (B) Representative screen shot of normalized genome-wide accessibility profiles in the eleven samples (chrIII:9,041,700–9,196,700, 154 kb).
-
Figure 1—source data 1
Accessible sites identified using ATAC-seq.
● chrom_ce10, start_ce10, end_ce10 location of the accessible site (bed-style coordinates, ce10). ● atac_%stage_height maximum SPMR-normalized ATAC-seq signal at the peak in %stage (one of wt_emb, wt_l1, wt_l2, wt_l3, wt_l4, wt_ya, glp1_d1, glp1_d2, glp1_d6, glp1_d9, glp1_d13). ● atac_source source of the ATAC-seq peak call (see Materials and methods). ○ atac_wt_pe wt (developmental) ATAC-seq treated as paired-end. ○ atac_wt_se wt (developmental) ATAC-seq treated as single-end. ○ atac_glp1_se glp-1 (ageing) ATAC-seq, single-end only.
- https://doi.org/10.7554/eLife.37344.006
Figure 1—figure supplement 1
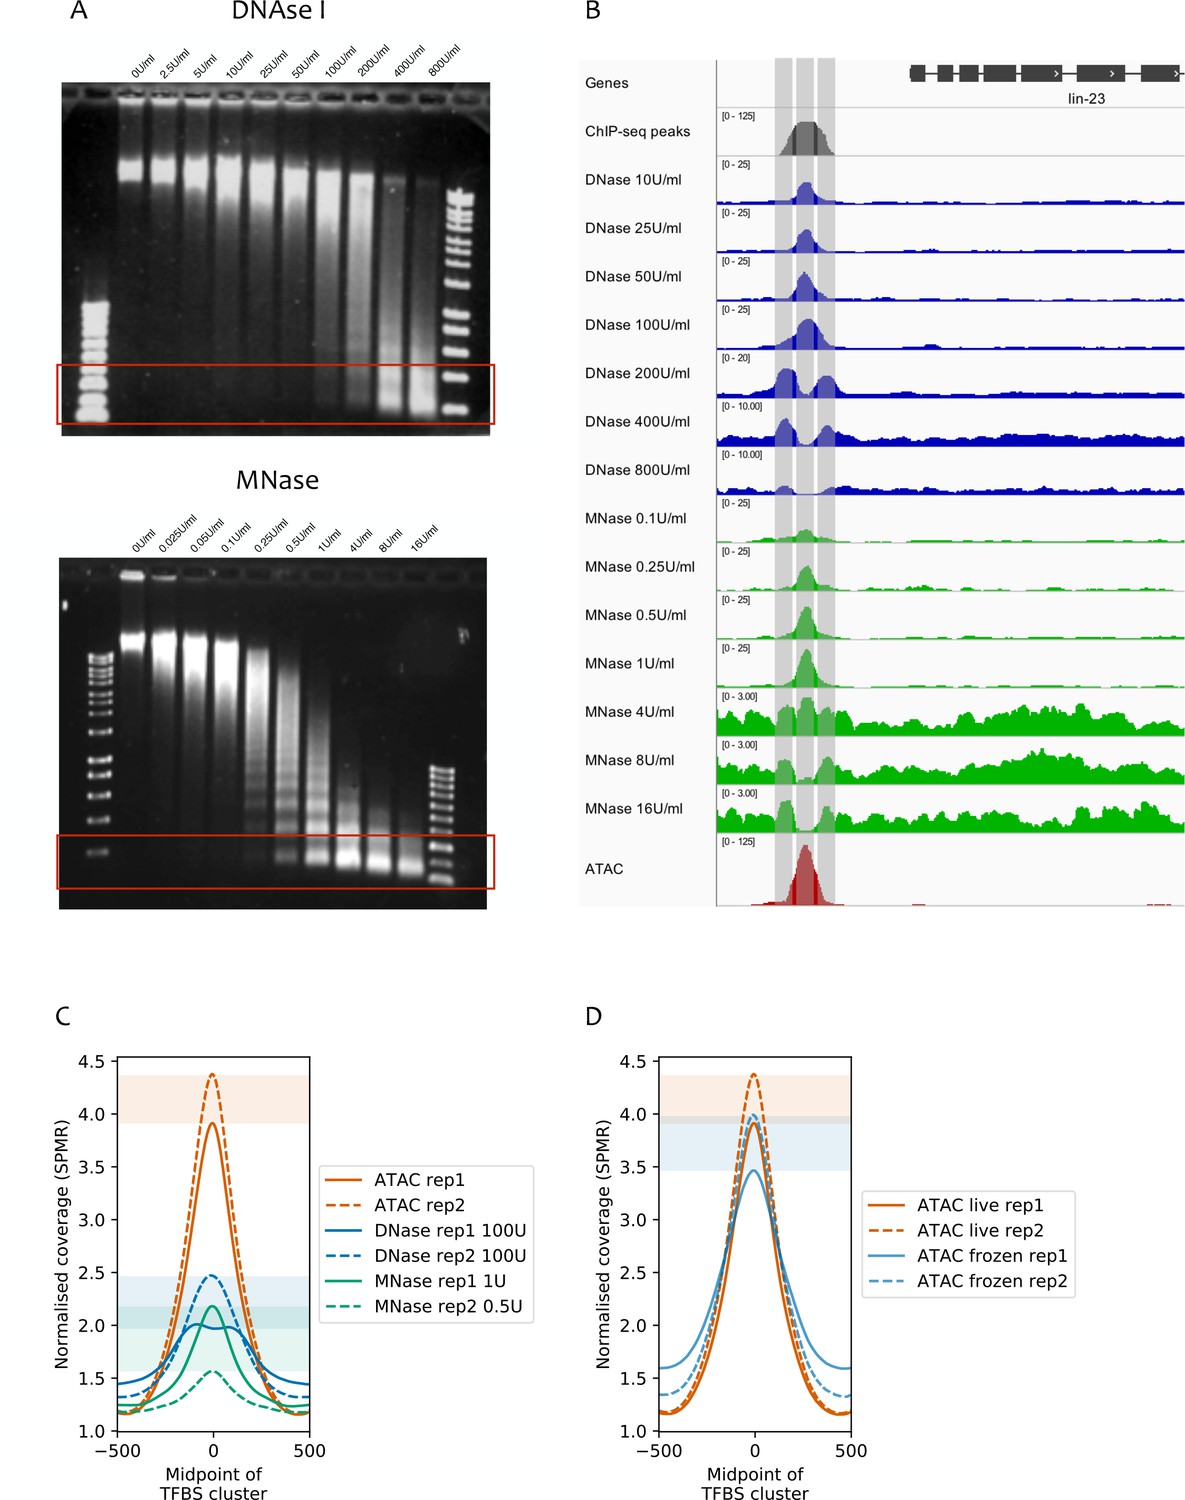
Comparison of ATAC-seq to concentration courses of DNase I-seq and MNase-seq.
(A) Genomic DNA digested using different concentrations of DNase I (top) or MNase (bottom). Red rectangles highlight approximate size ranges subjected to paired-end Illumina sequencing. (B) SPMR-normalized coverage of a DNase I concentration series (blue tracks), MNase concentration series (green tracks), and ATAC-seq (red track) at the lin-23 locus (chrII:6,369,650–6,373,750, 4.1 kb). The modENCODE/modERN ChIP-seq peak call pileup (grey track) shows a TF binding region upstream of the gene. Different concentrations of nuclease show different types of signal. Low concentrations of DNase I and MNase produce a peak in the middle of the TF-binding region, at the expected NDR (middle vertical bar). At higher concentrations, both enzymes show a peak at the −1 and +1 nucleosomes (left and right vertical bars). ATAC-seq has a single large peak centered in the middle of the TF-binding region. (C) Mean normalized coverage at transcription factor binding sites defined by clustering modENCODE/modERN peak calls (n = 36,389; Materials and methods) in ATAC-seq, DNase-seq, and MNase-seq (the latter two are shown at concentrations with the highest accessibility enrichment). ATAC-seq shows higher signal than DNase-seq or MNase-seq. Shaded rectangles show the range of signal between assay replicates at the midpoint of the TFBS cluster. (D) Normalized read coverage of ATAC-seq prepared from nuclei harvested from live (red), or frozen (blue) embryos. Shaded rectangles are used as in (C).
Figure 1—figure supplement 2
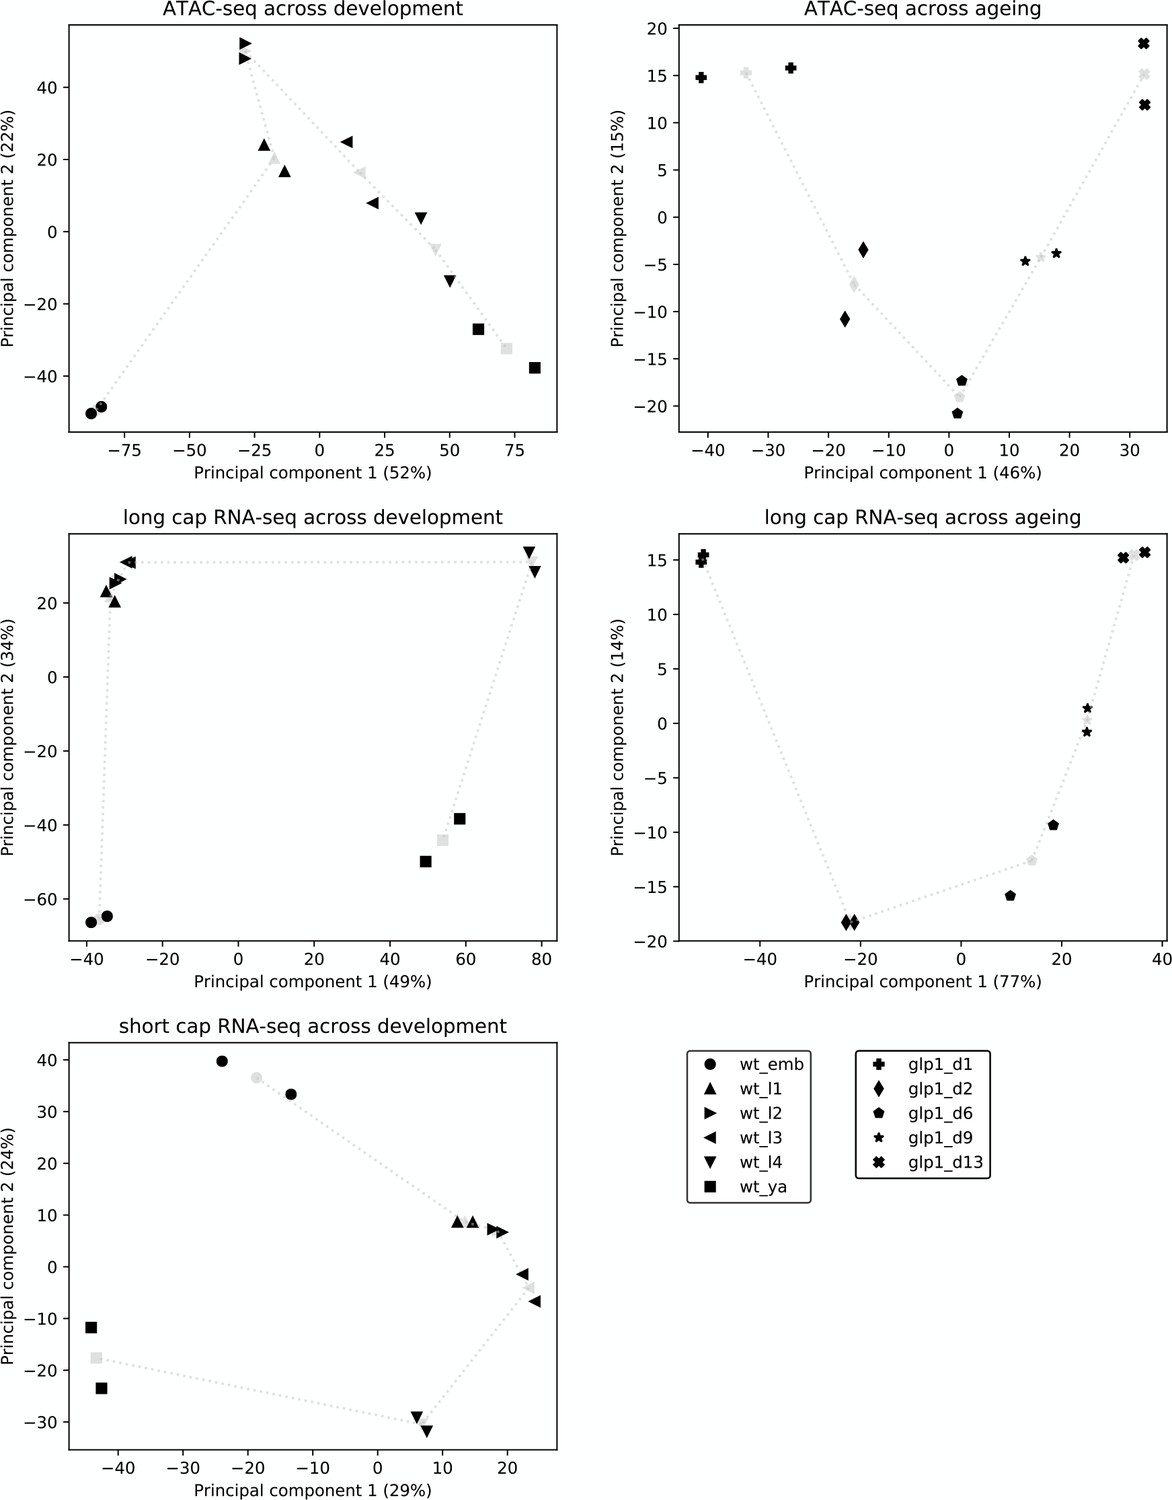
Reproducibility and broad relatedness of ATAC-seq and RNA-seq data.
Reproducibility and broad relatedness of the different samples and time points in ATAC-seq (top), long cap RNA-seq (middle), and short cap RNA-seq (bottom). We applied PCA to peak accessibility at promoters (ATAC-seq), read counts at annotated genes (long cap RNA-seq), and 5' end read counts at promoters (short cap RNA-seq). Black markers show different biological samples (two per time point) whereas gray markers show centroids, calculated by averaging the two samples collected at the same time point. Gray dotted lines show the time progression across development or ageing.
Figure 1—figure supplement 3
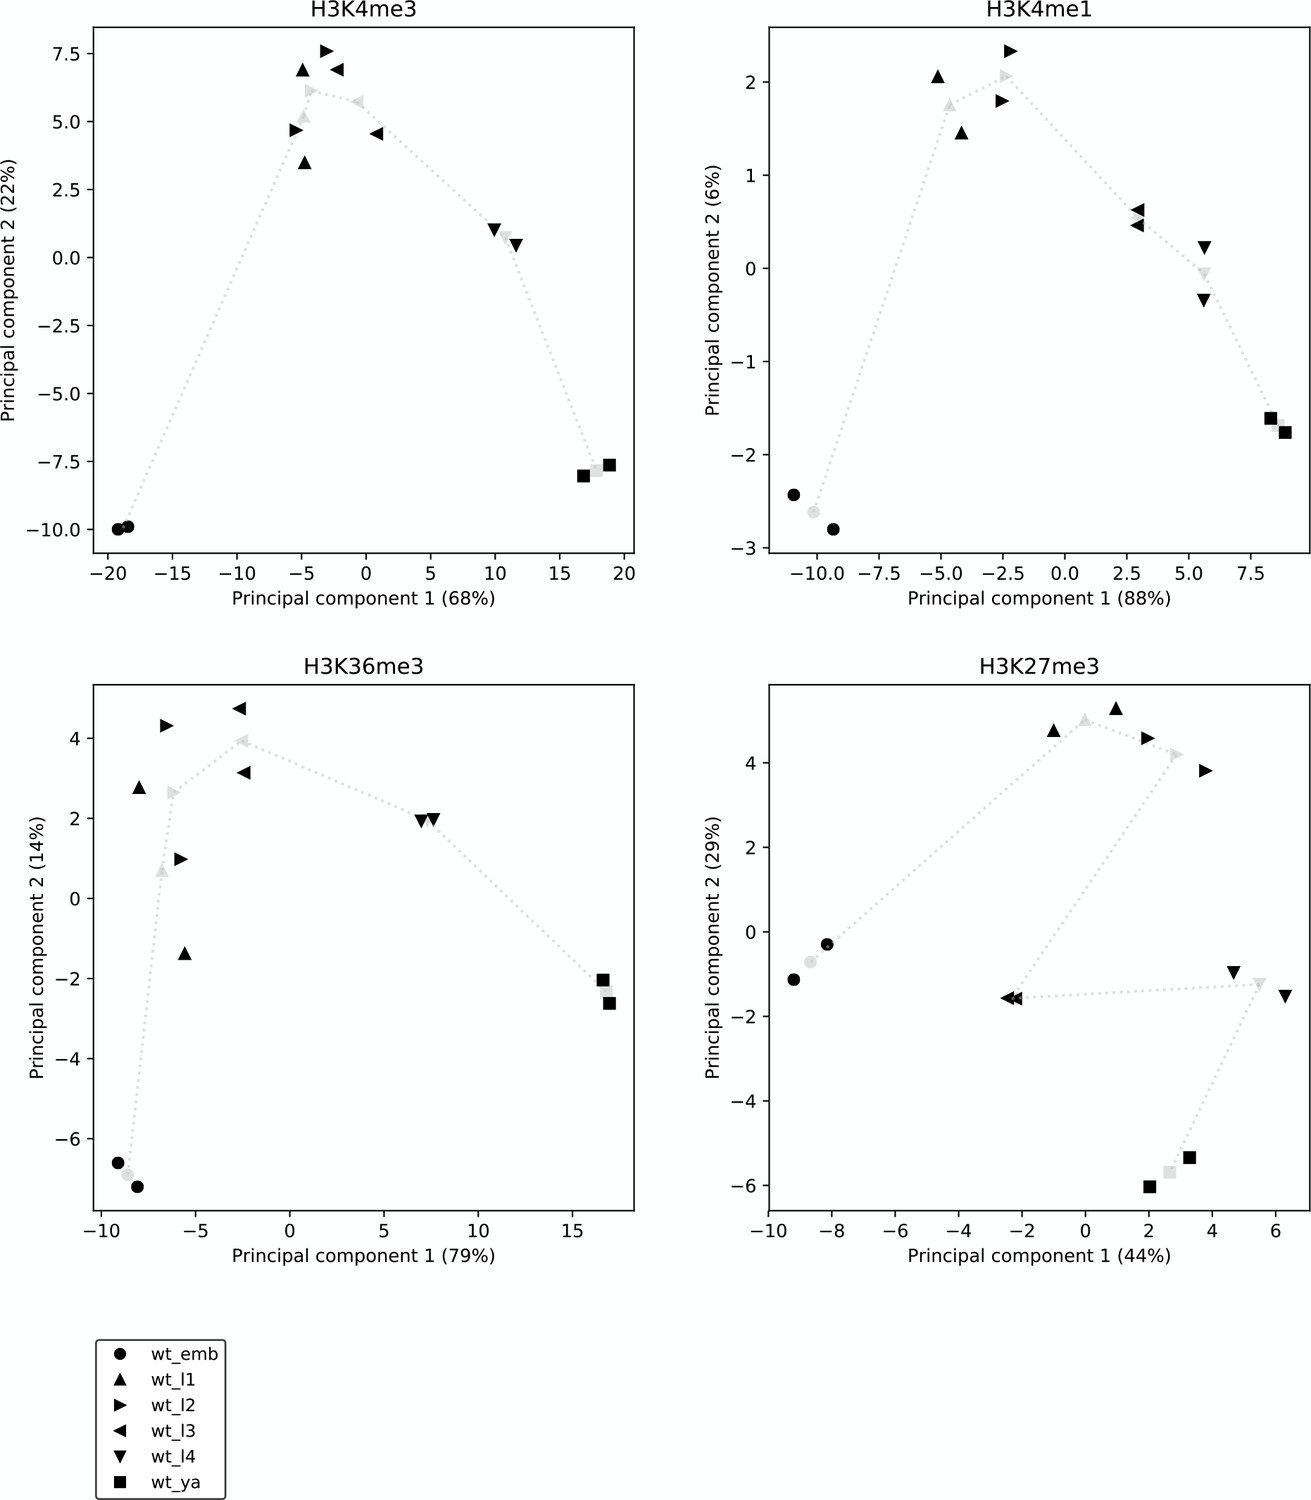
Reproducibility and broad relatedness of the histone modification data.
Reproducibility and broad relatedness of the different samples and time points in H3K4me3 (top left), H3K4me1 (top right), H3K36me3 (bottom left), and H3K27me3 ChIP-seq (bottom right). We applied PCA to genic regions, from the most upstream promoter to the annotated 3' end, considering genes with at least one promoter. Black markers show different biological samples (two per time point), whereas gray markers show centroids, calculated by averaging the two samples collected at the same time point. Gray dotted lines show the time progression across development.
Figure 2 with 6 supplements
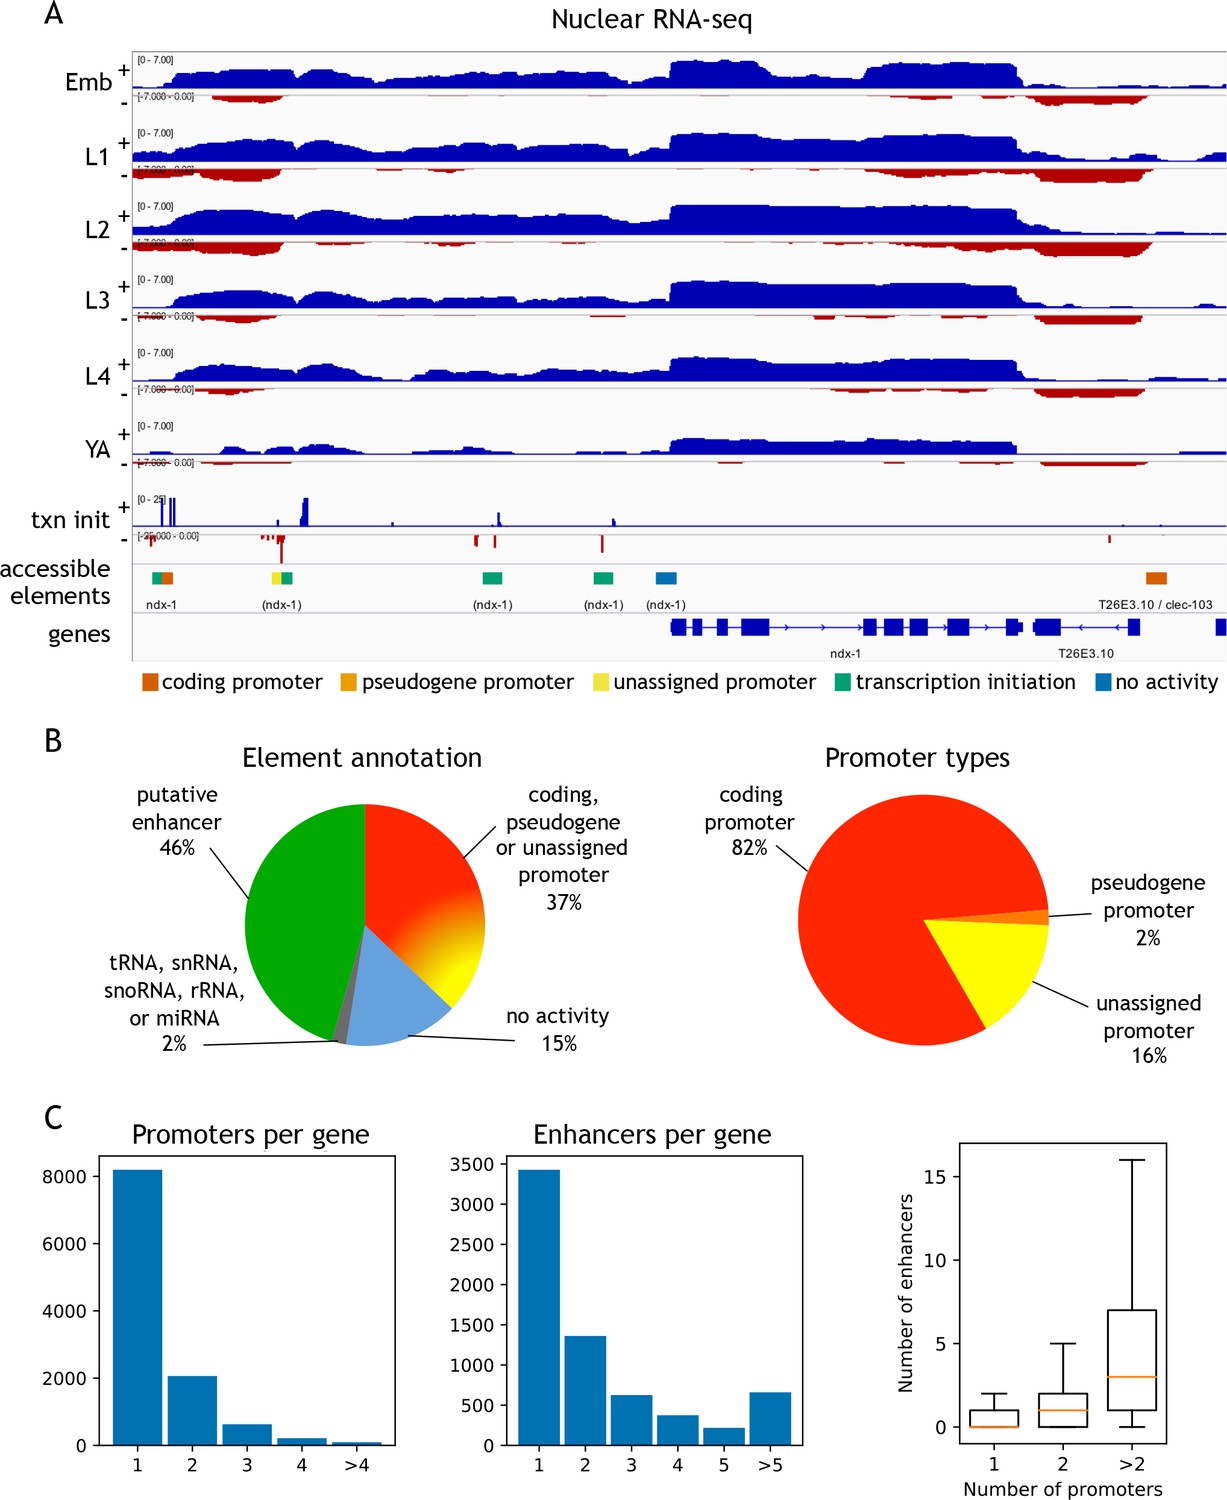
Annotation of accessible elements.
(A) Top, strand-specific nuclear RNA in each developmental stage monitors transcription elongation; plus strand, blue; minus strand, red. Below is transcription initiation signal, accessible elements (colored by annotation), and gene models (chrI:12,675,000–12,683,400, 8.4 kb). The left side of each element is colored by the reverse strand annotation whereas the right side of an element is colored by the forward strand annotation (color key at bottom). (B) Left, distribution of accessible sites in four categories: promoters (one or both strands), putative enhancers, no activity, or overlapping a tRNA, snRNA, snoRNA, rRNA, or miRNA. Right, distribution of different types of promoter annotations. (C) Left, distribution of the number of promoters and enhancers per gene; right, boxplot shows that genes with more promoters also have more enhancers.
-
Figure 2—source data 1
Regulatory annotation of accessible sites.
● chrom_ce10, start_ce10, end_ce10 location of the accessible site (bed-style coordinates, ce10). ● chrom_ce11, start_ce11, end_ce11 as above, but lifted over to ce11. ● annot final regulatory element type, obtained by combining strand-specific transcription patterns (see Materials and methods). ● annot_%strand annotation of the strand-specific transcription patterns at the site (%strand is either fwd or rev). ● promoter_gene_id_%strand, promoter_locus_id_%strand, promoter_gene_biotype_%strand WormBase gene id, locus id, biotype for sites annotated as coding_promoter, pseudogene_promoter or non-coding_RNA on %strand. ● associated_gene_id, associated_locus_id WormBase gene id, locus id of genes whose gene body or outron region overlaps the site. These are defined for for sites annotated as unassigned_promoter, putative_enhancer or other_element. If a site overlaps multiple genes, all overlaps are reported, separated by commas. ● tss_%strand_ce10 representative transcription initiation mode (Materials and methods) on %strand, ce10 coordinates. ● tss_%strand_ce11 as above, but lifted over to ce11. ● scap_%strand_passed True or False based on whether the site has reproducible transcription initiation (Materials and methods). ● lcap_%stage_%strand_passed_jump True or False based on whether the site passed the jump test for elongating transcription (Materials and methods, %stage is one of wt_emb, wt_l1, wt_l2, wt_l3, wt_l4, wt_ya, glp1_d1, glp1_d2, glp1_d6, glp1_d9, glp1_d13). ● lcap_%stage_%strand_passed_incr True or False based on whether the site passed the incr test for elongating transcription (Materials and methods).
- https://doi.org/10.7554/eLife.37344.014
Figure 2—figure supplement 1
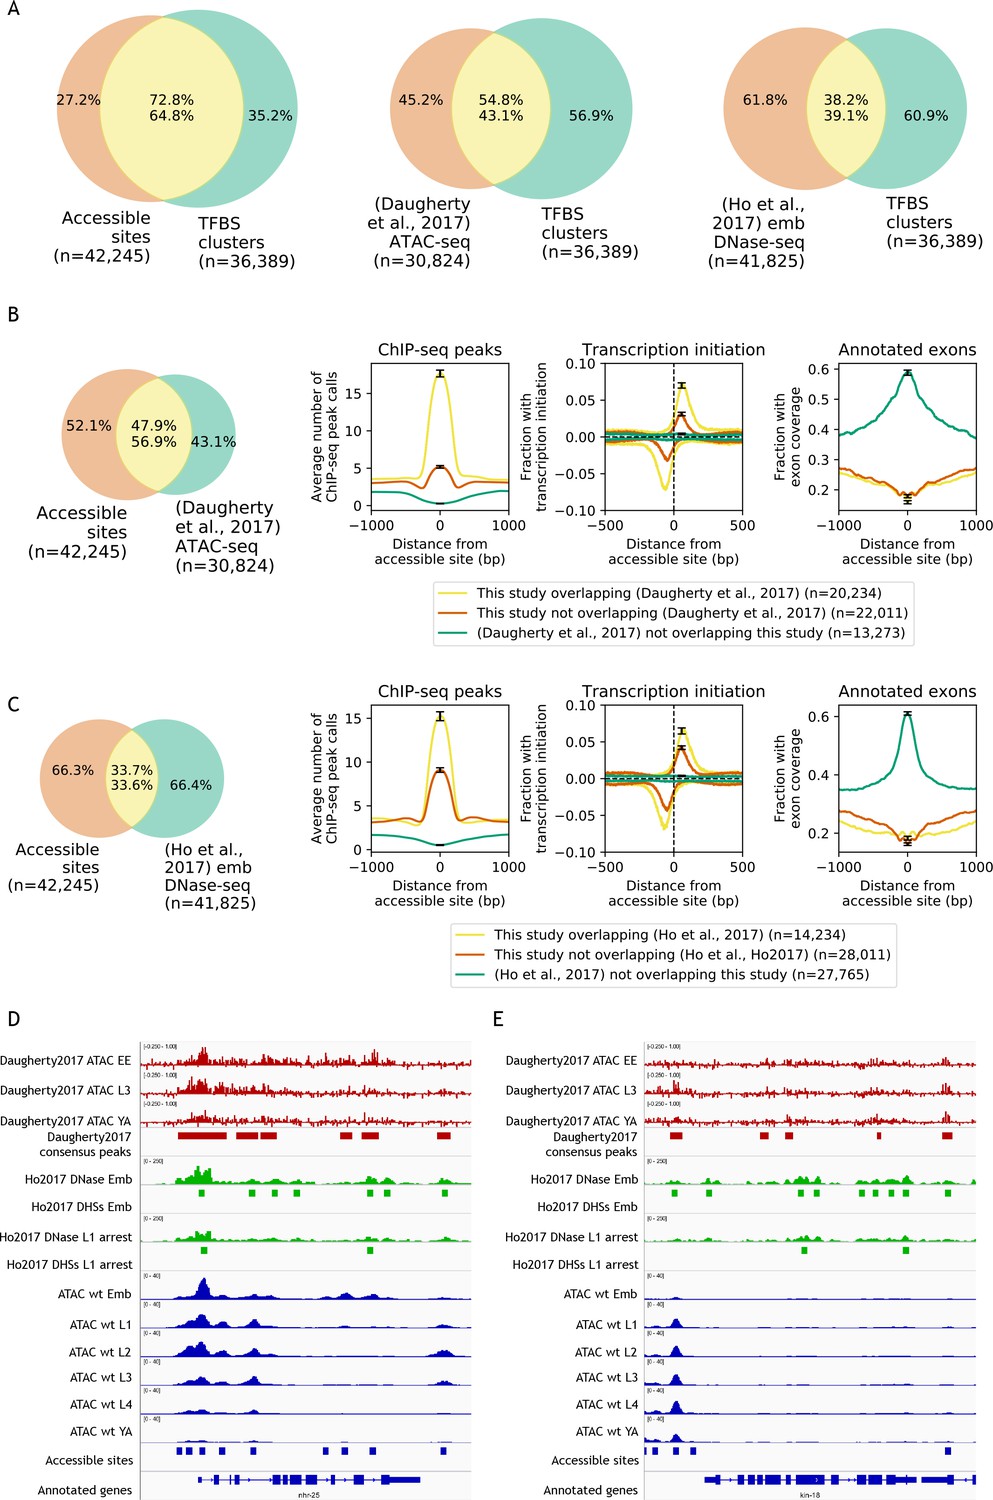
Comparisons to previous accessibility maps.
(A) Venn diagrams showing the overlap of transcription factor binding sites defined by clustering modENCODE/modERN peak calls (n = 36,389; Materials and methods) to accessible sites from this study and two previous studies (Daugherty et al., 2017; Ho et al., 2017). (B) Comparison of accessible sites defined in this study to accessible sites defined in Daugherty et al. (2017). (C) Comparison of accessible sites defined in this study to accessible sites defined in Ho et al. (2017). (B,C) Leftmost plot shows overlaps between accessible sites. Rightmost three plots compare regions found in both studies or unique to only one study, for mean profile of modENCODE/modERN peak call pileup, fraction of sites with transcription initiation signal (negative values are reverse strand signals), and fraction overlapping an exon. (D,E) IGV screenshots (D: nhr-25, chrX:13,007,000–13,015,000, 8 kb; E: kin-18, chrIII:6,117,000–6,125,500, 8.5 kb) of stage-specific accessibility profiles and peak calls from Daugherty et al. (2017) (top, red), (Ho et al., 2017) (middle, green), and this study (bottom, blue).
Figure 2—figure supplement 2
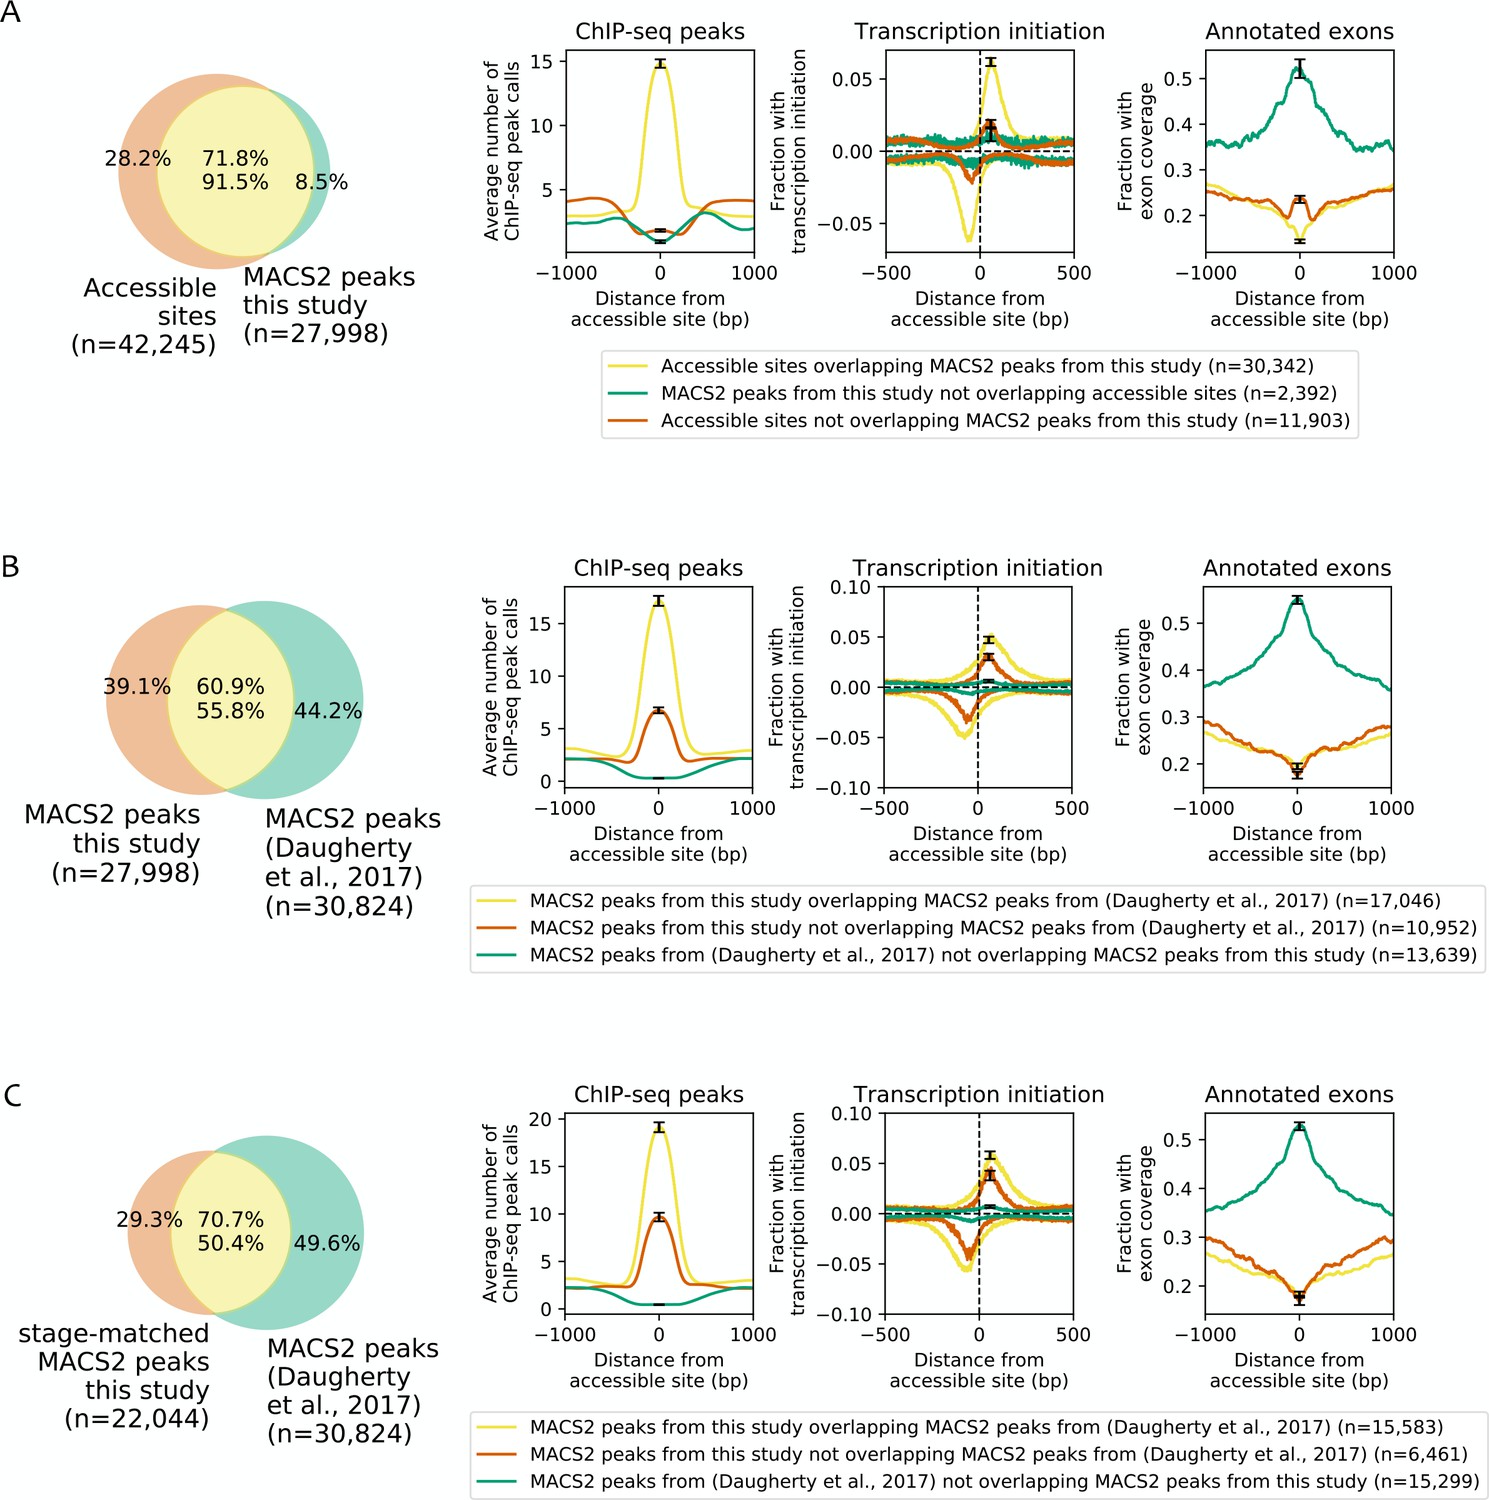
Effect of differences in peak calling methods on the types of identified accessible sites.
As done by Daugherty et al. (2017), MACS2 was used to call peaks on the ATAC-seq data reported here using MACS2 parameters --shift −75 --gsize ce -q 5e-2 --nomodel --extsize 150 --bdg --keep-dup all --call-summits --SPMR. Peaks from biological replicates of the same stage were combined by intersecting peak calls from the two biological replicates, and then peaks from each stage were combined by taking their union. This identified 27,998 peaks used for this analysis. (A) Comparison between accessible regions identified by the focal enrichment peak calling method used in this study (n = 42,245) to those defined using MACS2 (n = 27,998). (B) Comparison of ATAC-seq MACS2 peak calls from our data to ATAC-seq MACS2 peak calls from (Daugherty et al., 2017). (C) Comparison of stage-matched ATAC-seq MACS2 peak calls from our data to ATAC-seq MACS2 peak calls from Daugherty et al. (2017). (A–C) Leftmost plots show overlaps between accessible sites. Rightmost three plots compare regions found in both sets of peak calls or unique to only one set, for mean profile of modENCODE/modERN peak call pileup, fraction of sites with transcription initiation signal (negative values are reverse strand signals), and fraction overlapping an exon.
Figure 2—figure supplement 3
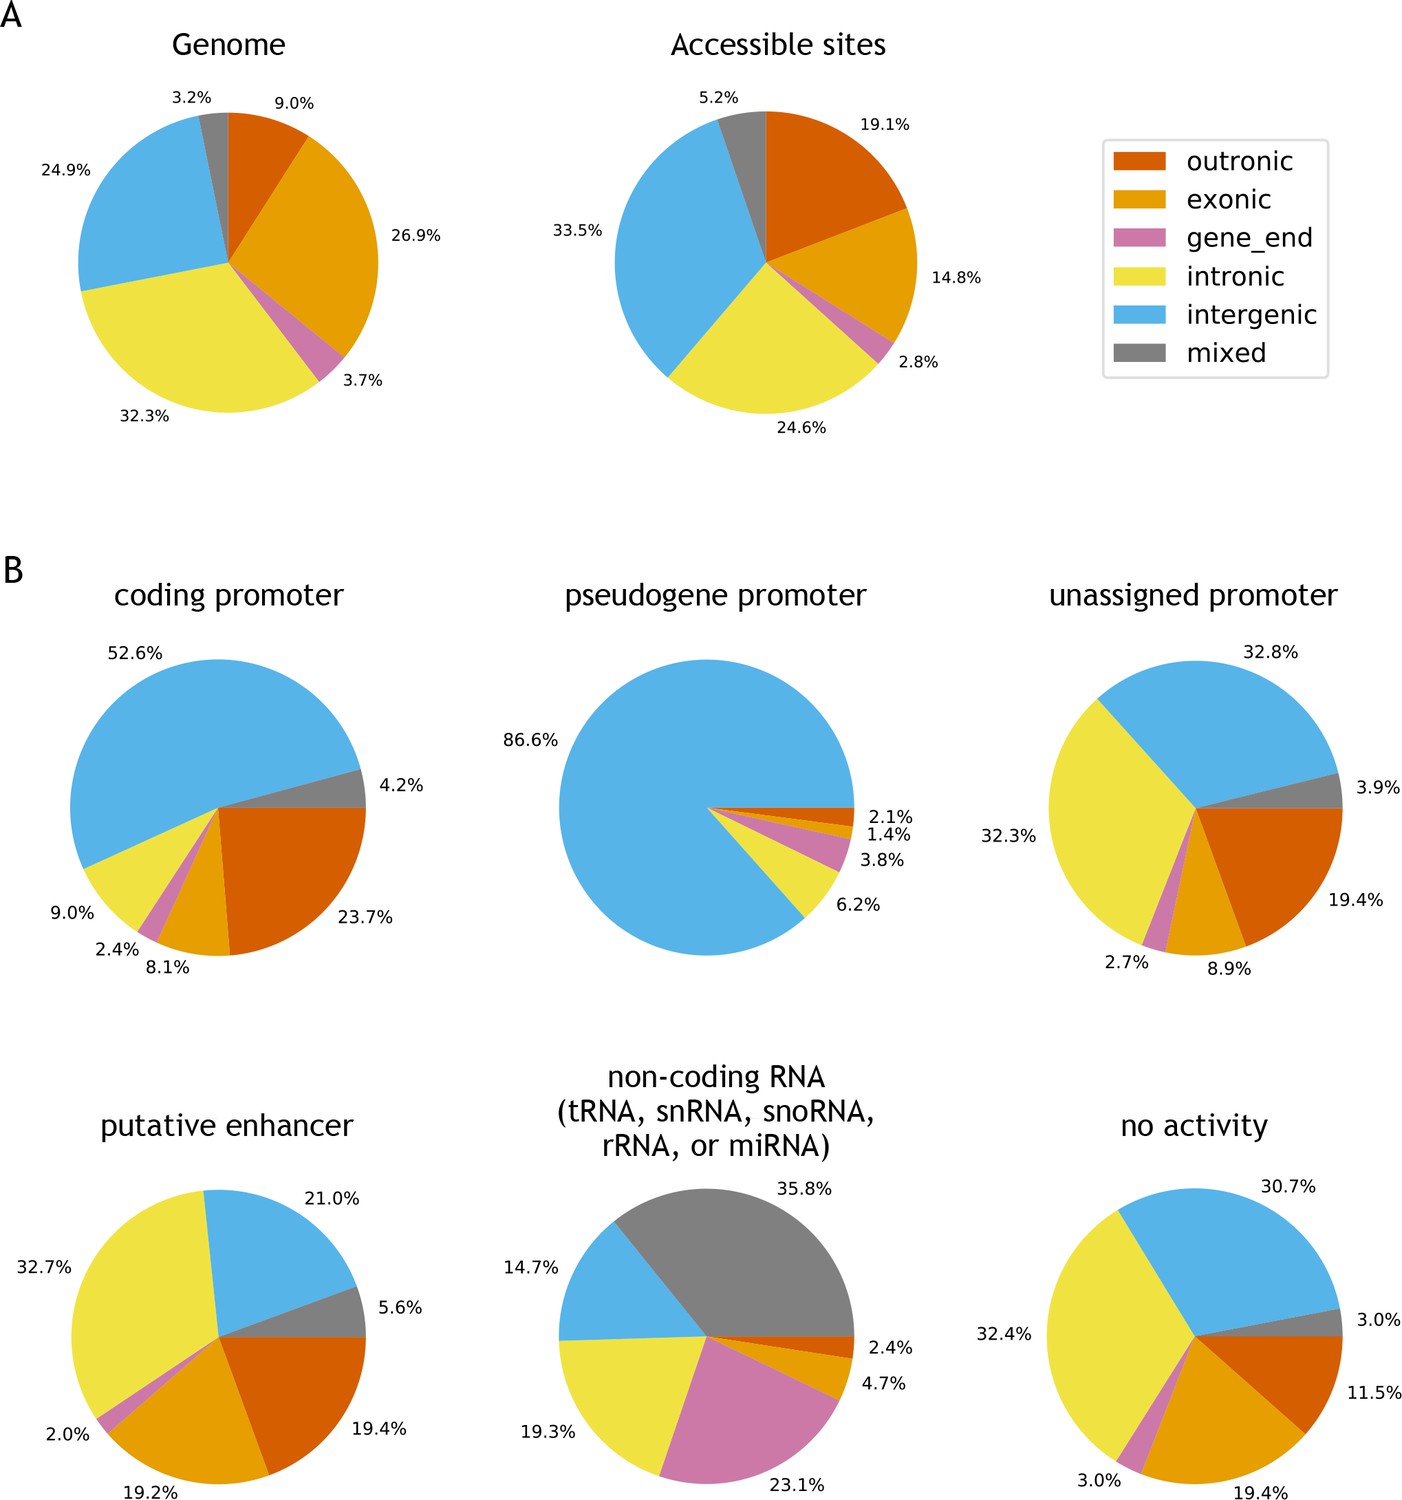
Genomic locations of accessible sites.
(A) Left: distribution of bases in the C. elegans genome, partitioned into outronic, exonic, intronic, intergenic or mixed, based on the regulatory annotation. Right: distribution of genomic region type at accessible sites. (B) Distribution of genomic region at specific types of accessible sites.
Figure 2—figure supplement 4
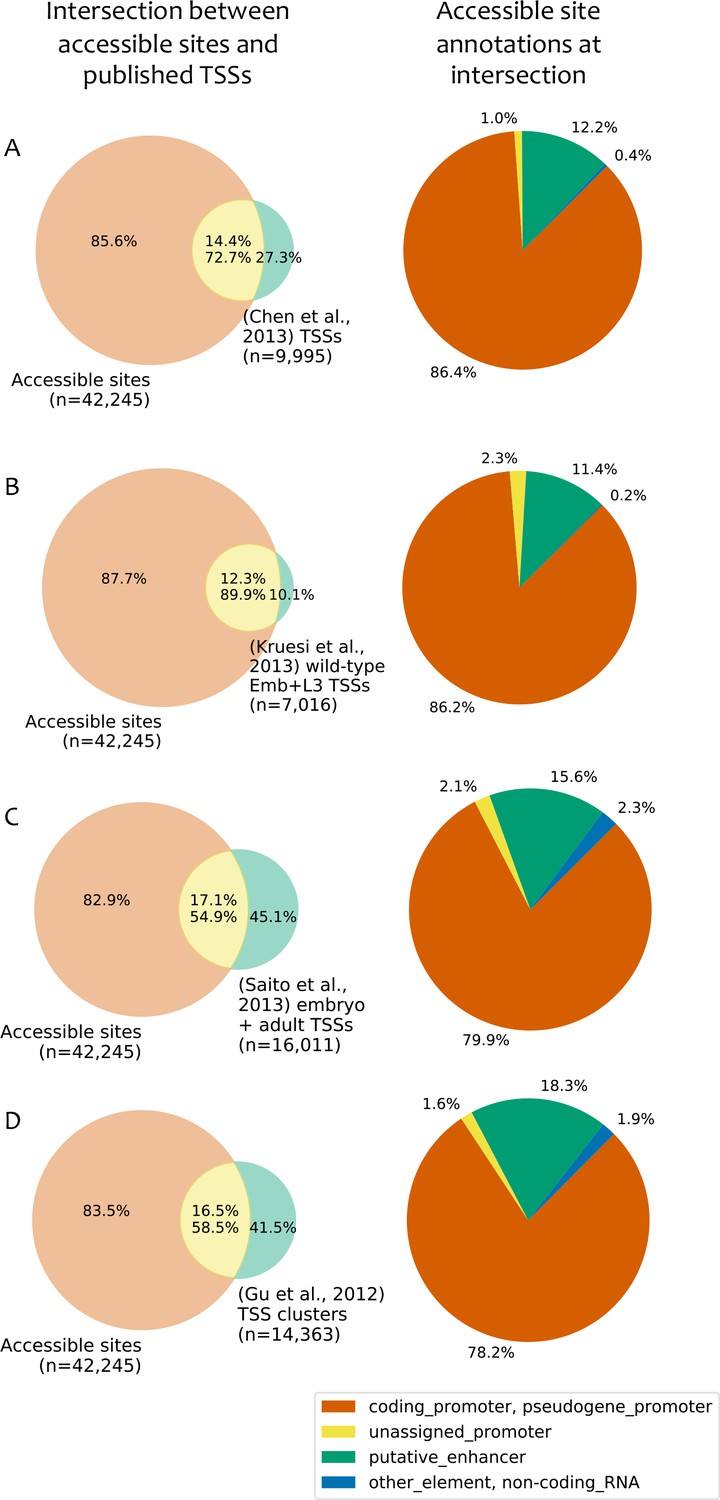
Comparison to published TSS maps.
(A–D) Left: overlap between accessible sites and TSS annotations from (A) (Chen et al., 2013); (B) (Kruesi et al., 2013); (C) (Saito et al., 2013); (D) (Gu et al., 2012). Right: accessible site annotations of elements that overlap a TSS in the indicated study. TSSs were considered to overlap an accessible site if they were located within 150 bp of peak accessibility. For Gu et al. (2012), TSSs were clustered using a single-linkage approach using a distance threshold of 50 bp, and the overlaps are based on those clusters.
Figure 2—figure supplement 5
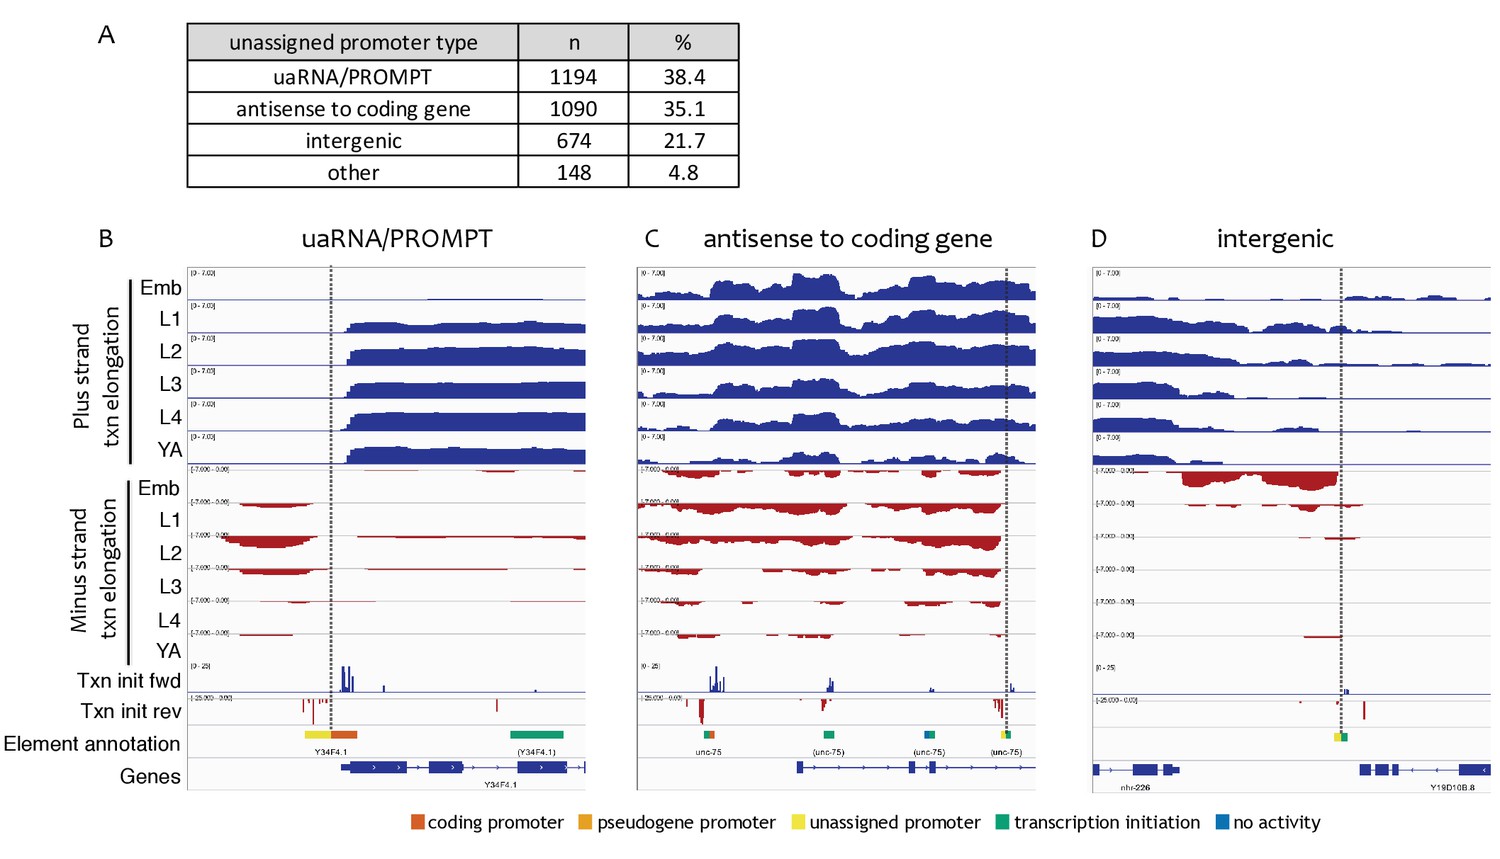
Types of unassigned promoters.
(A) Types and numbers of unassigned promoters. (B–D) Examples of transcription patterns at unassigned promoters. Shown are forward and reverse strand nuclear RNA-seq signals to indicate genomic regions with transcription elongation, forward and reverse strand transcription initiation signal (pooled across stages), and accessible elements colored with left halves indicating reverse strand annotation and right halves indicating forward strand annotation. Vertical dotted lines highlight unassigned promoters. (B) uaRNA/PROMPT (chrIII:1,020,500–1,021,700, 1.2 kb), (C) antisense to coding gene (chrI:11,590,000–11,596,000, 6 kb), (D) intergenic (chrV:2,296,000–2,300,500, 4.5 kb).
Figure 2—figure supplement 6
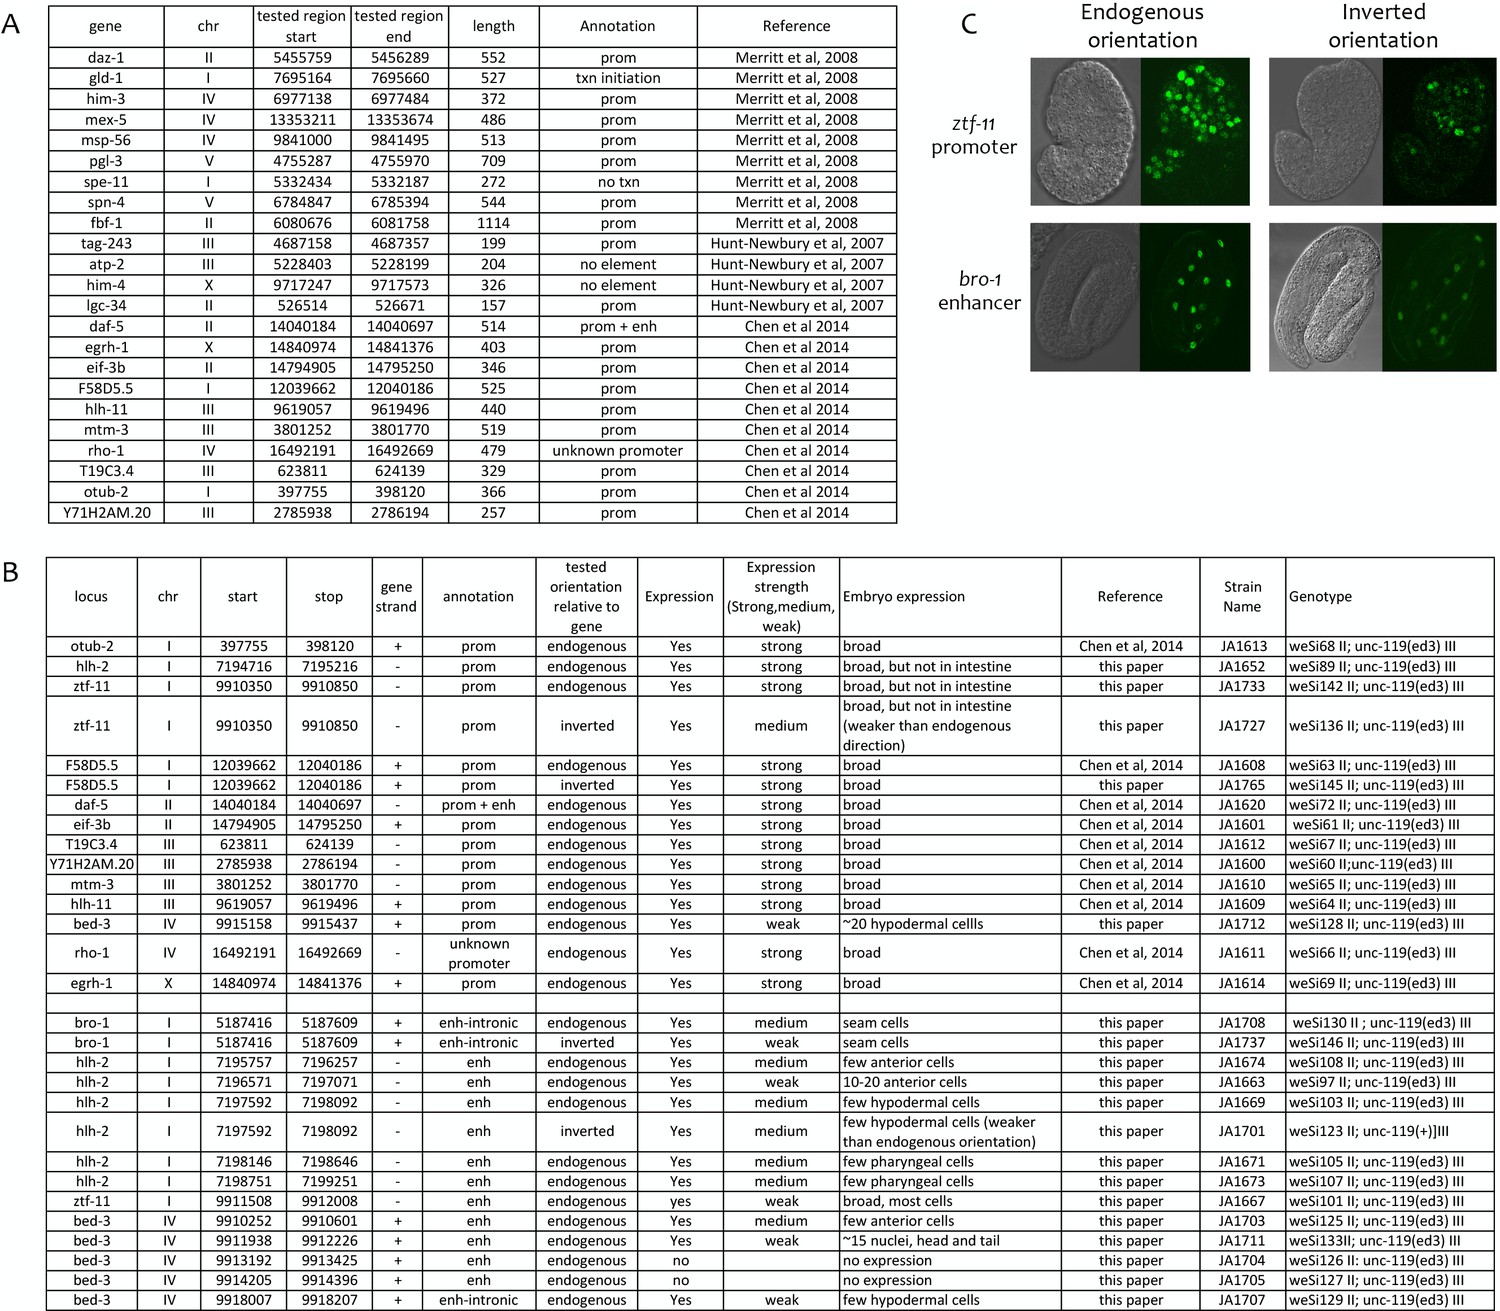
Transgenic tests of annotated promoters and enhancers for promoter activity.
(A) Comparison of annotations to 23 elements previously shown to function as promoters in transgenic assays (Merritt et al., 2008; Hunt-Newbury et al., 2007; Chen et al., 2014). (B) Indicated elements were fused to his-58::gfp (see Materials and methods) and the resulting transgenic strains tested for GFP expression in embryos. Elements were cloned in the endogenous orientation relative to their associated gene or in inverted orientation, as indicated. In expression strength column, ‘strong’ and ‘medium’ indicate high and low level of GFP visible in live embryos; ‘weak’ indicates expression only visible by immunofluorescence. (C) Examples of transgene expression. Shown is expression driven by the ztf-11 promoter and the bro-1 enhancer in both orientations; DIC image on left, HIS-58-GFP on right.
Figure 3 with 1 supplement
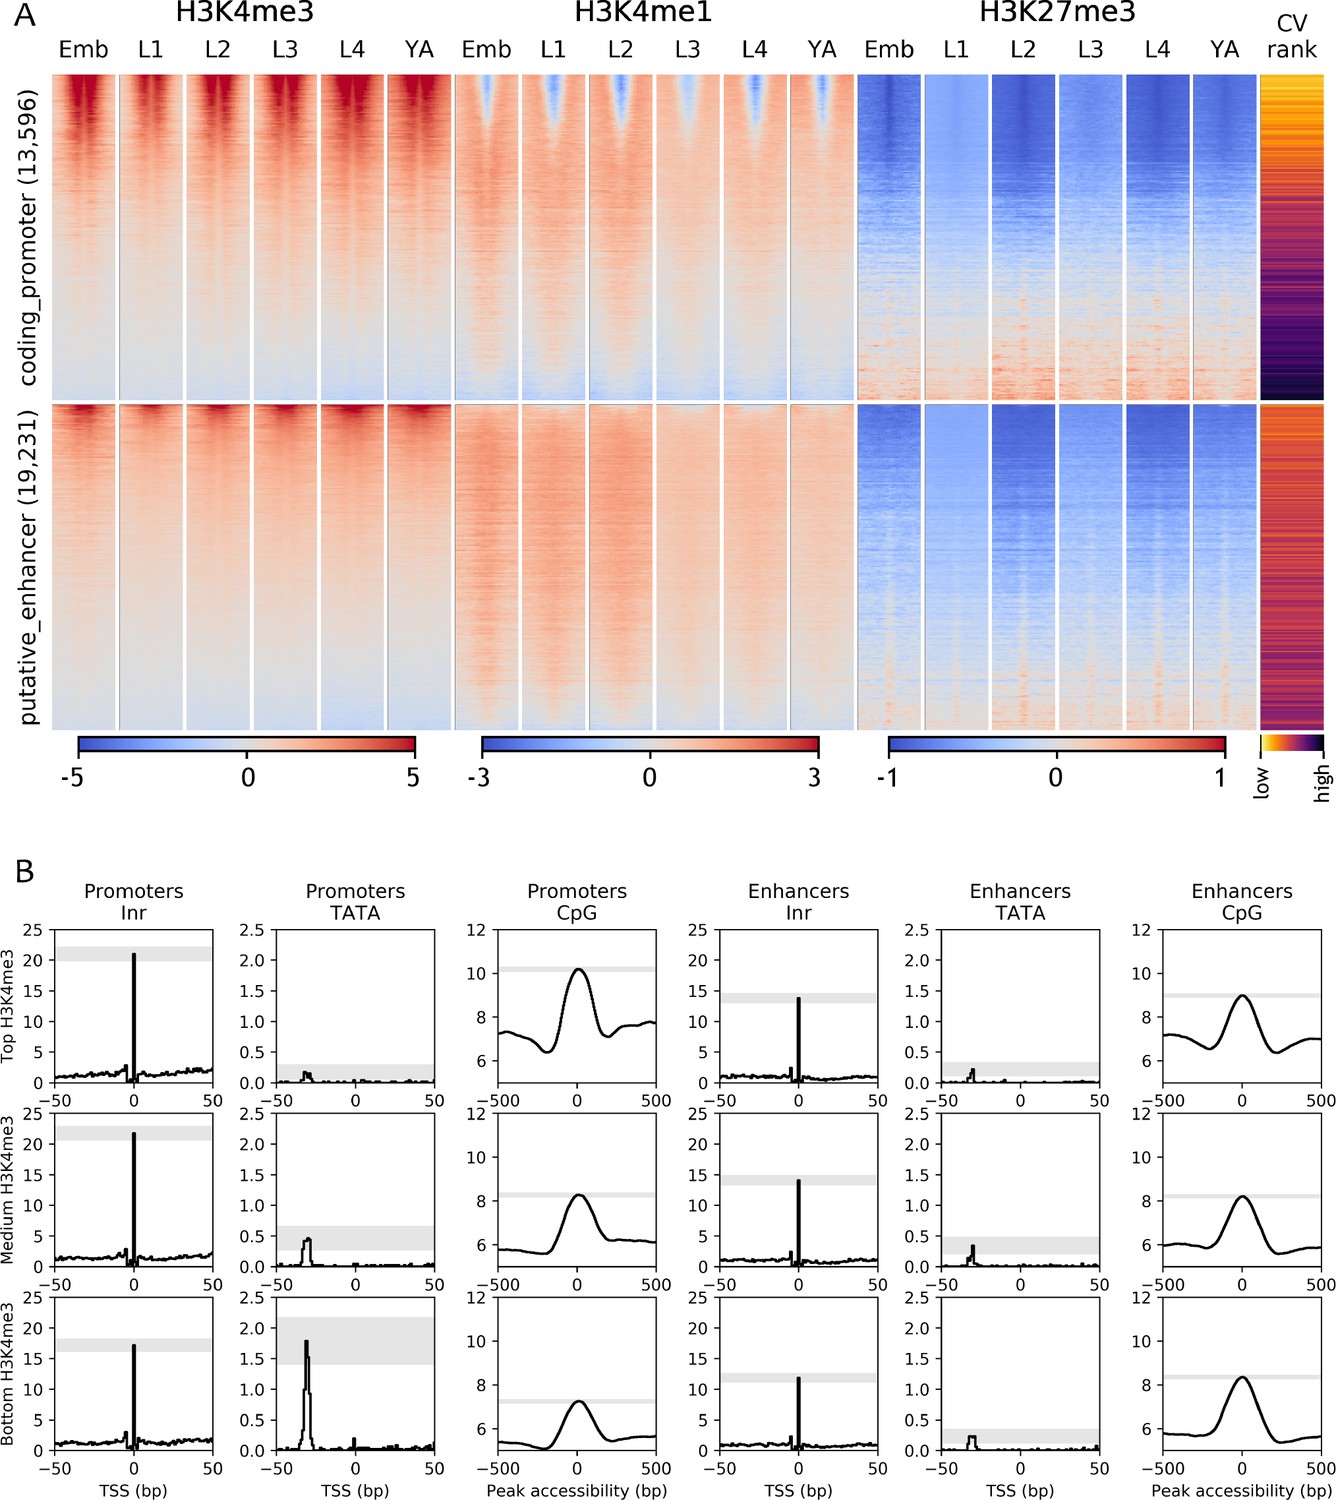
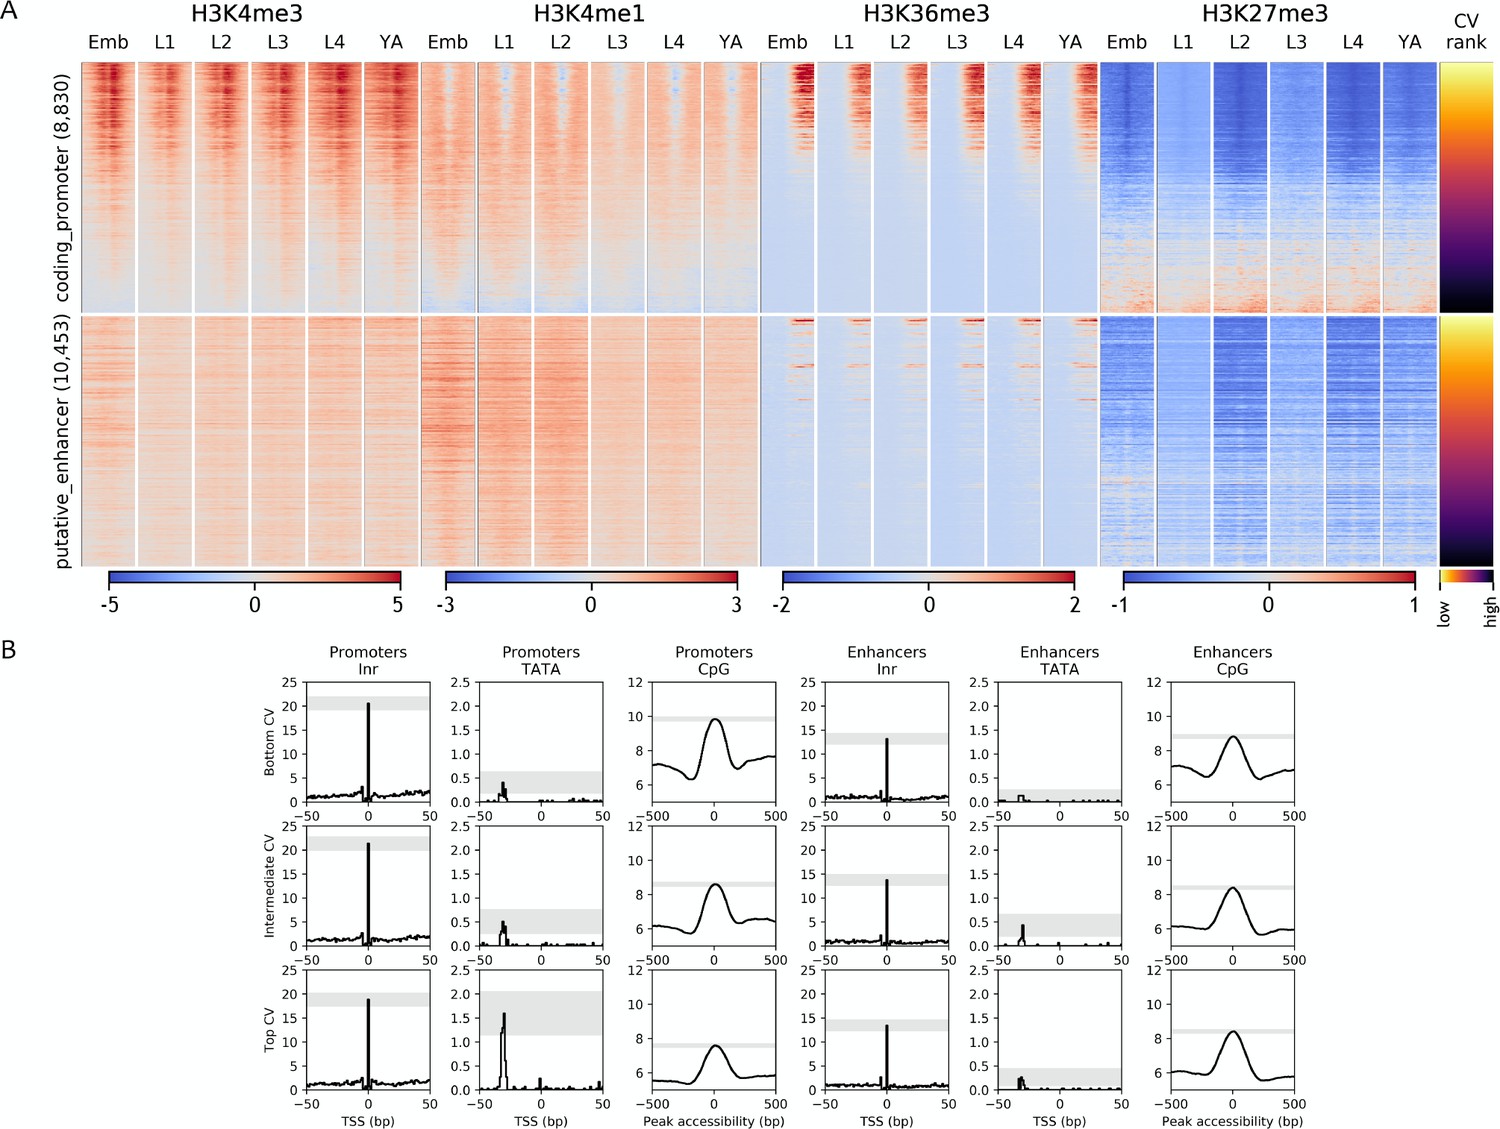
Chromatin state and sequence features of promoters and enhancers.
(A) Heatmaps of indicated histone modifications and CV values at coding promoters (top), and enhancers (bottom), aligned at element midpoints. Elements are ranked by mean H3K4me3 levels. Low CV values indicate broad expression across development and cell types and high CV values indicate regulated expression. Promoters of genes with low CV values have high H3K4me3 levels. (B) Distribution of initiator Inr motif, TATA motif, and CpG content at coding promoters and enhancers, separated by H3K4me3 level (top, middle, and bottom thirds). Grey-shaded regions represent 95% confidence intervals of the sample mean at the genomic position with the highest signal.
Figure 3—figure supplement 1
Chromatin state and sequence features of promoters and enhancers sorted by CV value.
(A) Heatmaps of indicated histone modifications and CV values at coding promoters (top), and enhancers (bottom). Elements are ranked by CV value. Low CV values indicate broad expression across development and cell types and high CV values indicate regulated expression. H3K4me3, H3K4me1, and H3K27me3 signals are aligned at element midpoints; H3K36me3 is aligned at the start of the associated gene annotation. (B) Distribution of initiator Inr motif, TATA motif, and CpG content at coding promoters and enhancers, separated by CV value (top (high CV), middle, and bottom (low CV)). Grey-shaded regions represent 95% confidence intervals of the sample mean at the genomic position with the highest signal.
Figure 4 with 3 supplements
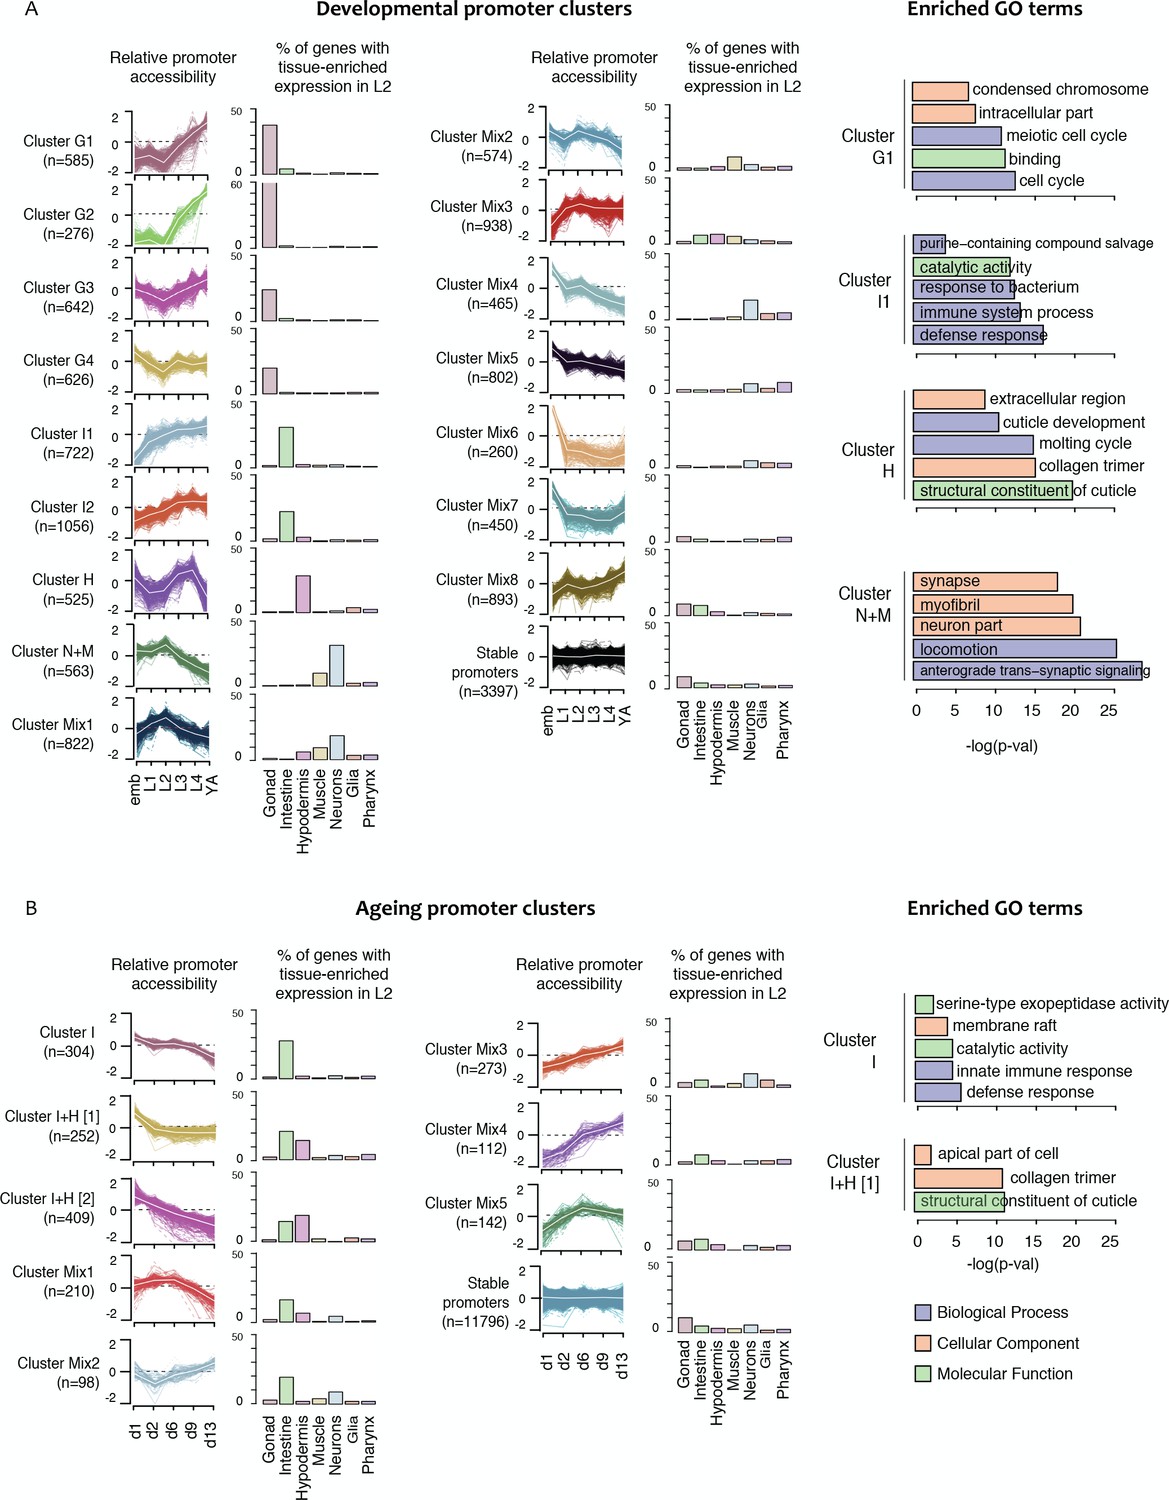
Shared dynamics of promoter accessibility in development and ageing.
Clusters of promoters with shared relative accessibility patterns across (A) development or (B) ageing. Relative promoter accessibility is log2 of the depth-normalized ATAC-seq coverage at a given time point divided by the mean ATAC-seq coverage across the time series (see Materials and methods). The percentage of associated genes that have enriched expression in the indicated tissues was determined from single-cell L2 larval RNA-seq data (Cao et al., 2017); see Materials and methods). Right hand panels show examples of GO terms enriched in genes associated with development or ageing clusters.
-
Figure 4—source data 1
Element accessibility dynamics and promoter accessibility clusters in development and ageing.
● chrom_ce10, start_ce10, end_ce10 location of the accessible site (bed-style coordinates, ce10). ● devel_is_dynamic True or False based on whether the site shows differential accessibility between any two developmental stages. ● ageing_is_dynamic True or False based on whether the site shows differential accessibility between any two ageing time points. ● devel_prom_cluster_label assigned developmental accessibility promoter cluster. ● ageing_prom_cluster_label assigned ageing accessibility promoter cluster. ● HOTness based on the number of transcription factors overlapping the accessible site, either HOT (19 or more factors), cold (between 1 and 18 factors) or none (zero factors). ● factor_count number of transcription factors with binding sites overlapping the accessible site. ● factor_names comma-separated list of the names of transcription factors with binding sites overlapping the accessible site.
- https://doi.org/10.7554/eLife.37344.021
Figure 4—figure supplement 1
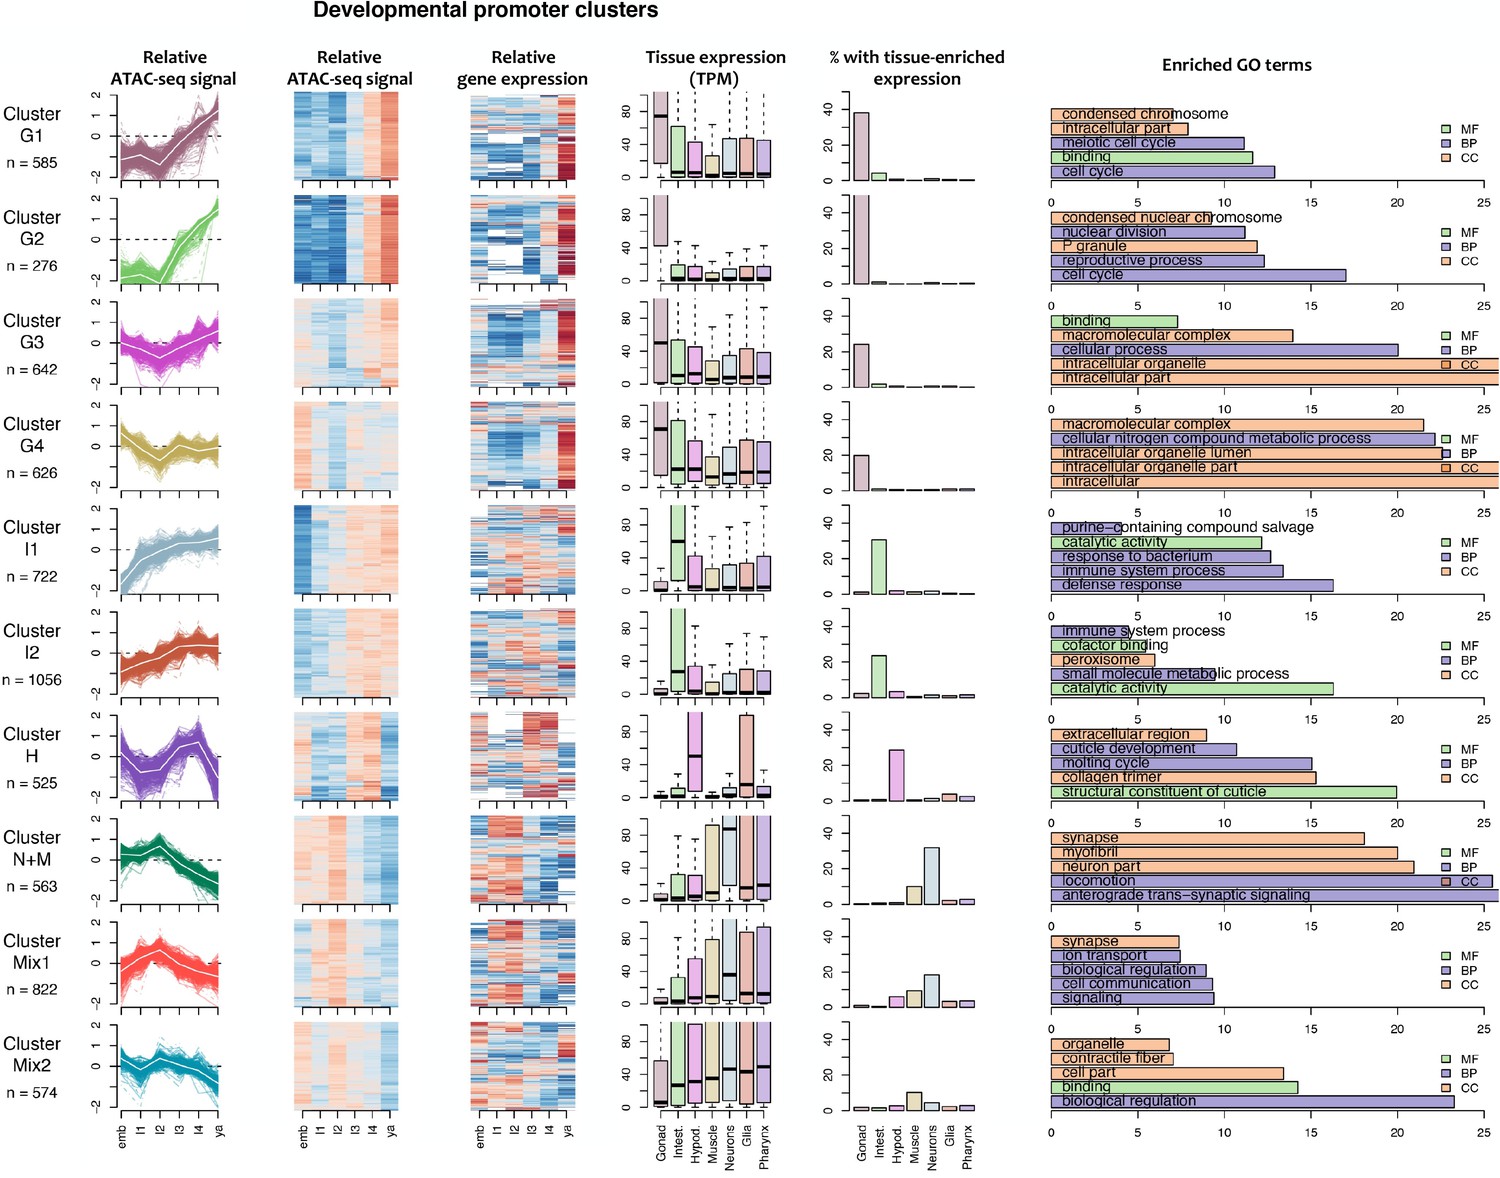
Characteristics of developmental promoter clusters (continued in Figure 4—figure supplement 2).
Characteristics of promoter clusters with shared accessibility patterns across development. Relative promoter ATAC-seq coverage is shown across the time series as a graph (each line representing a promoter) and a heatmap (each row representing a promoter). Values are scaled from −2 (dark blue) to 0 (white) to +2 (dark red). Heatmap showing relative expression of the associated genes across the time series, using the same color scale. Tissue expression box plots show TPMs of clustered genes in individual tissues (data from Cao et al., 2017). Percentage of genes with tissue-enriched expression shows the percentage of genes within the cluster with enriched expression in the indicated tissues. Enriched GO terms show the top five enriched GO terms obtained for each cluster from the corresponding list of genes using gProfiler. MF = Molecular Function, CC = Cellular Component, BP = Biological Process.
Figure 4—figure supplement 2
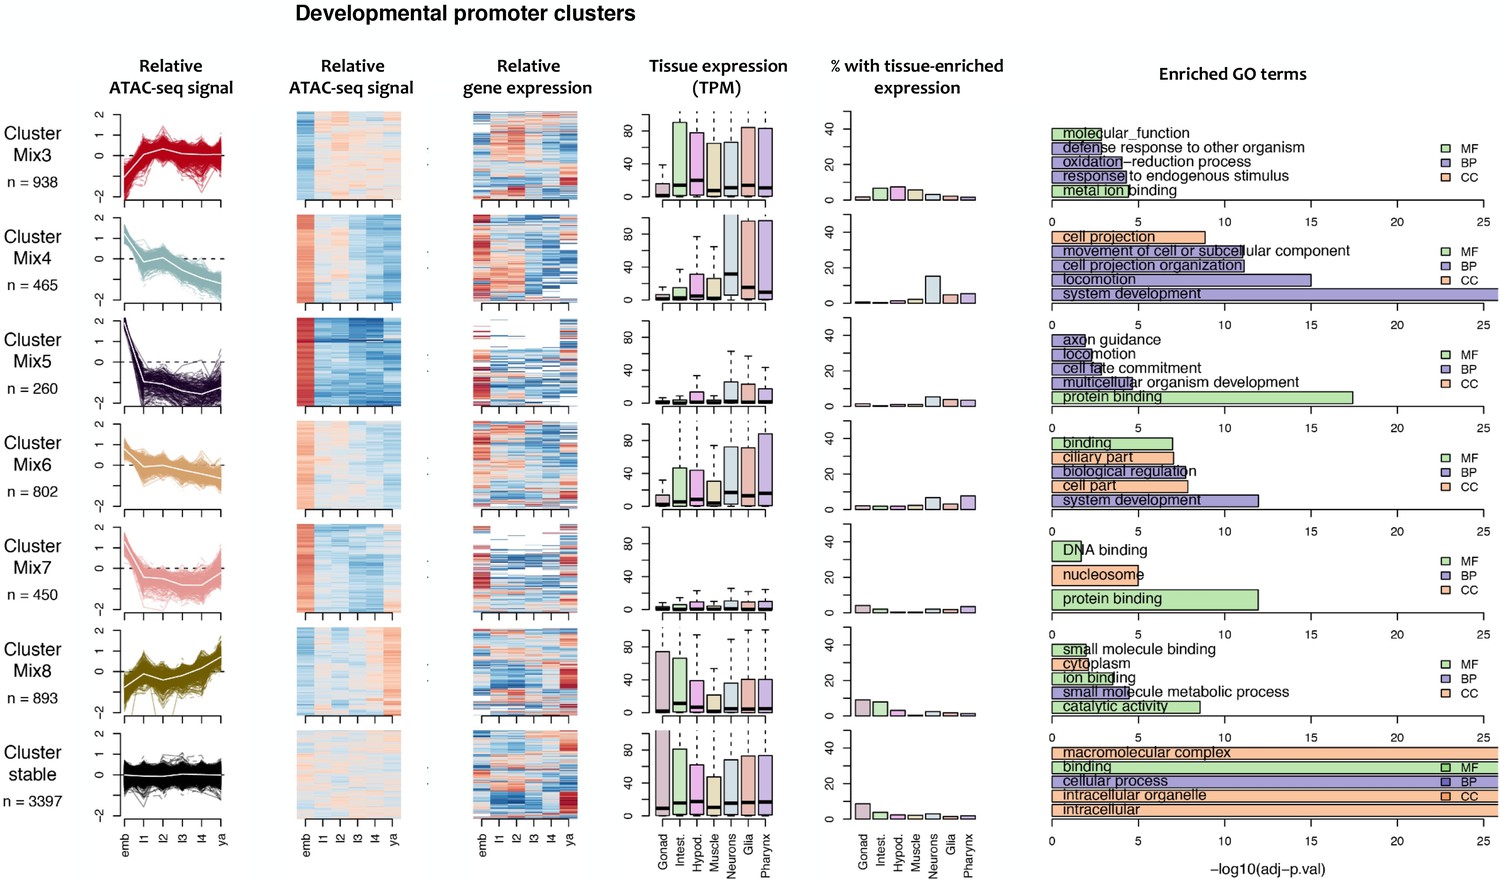
Characteristics of developmental promoter clusters (continued from Figure 4—figure supplement 1).
Characteristics of promoter clusters with shared accessibility patterns across development. Relative promoter ATAC-seq coverage is shown across the time series as a graph (each line representing a promoter) and a heatmap (each row representing a promoter). Values are scaled from −2 (dark blue) to 0 (white) to +2 (dark red). Heatmap showing relative expression of the associated genes across the time series, using the same color scale. Tissue expression box plots show TPMs of clustered genes in individual tissues (data from Cao et al., 2017). Percentage of genes with tissue-enriched expression shows the percentage of genes within the cluster with enriched expression in the indicated tissues. Enriched GO terms show the top five enriched GO terms obtained for each cluster from the corresponding list of genes using gProfiler. MF = Molecular Function, CC = Cellular Component, BP = Biological Process.
Figure 4—figure supplement 3
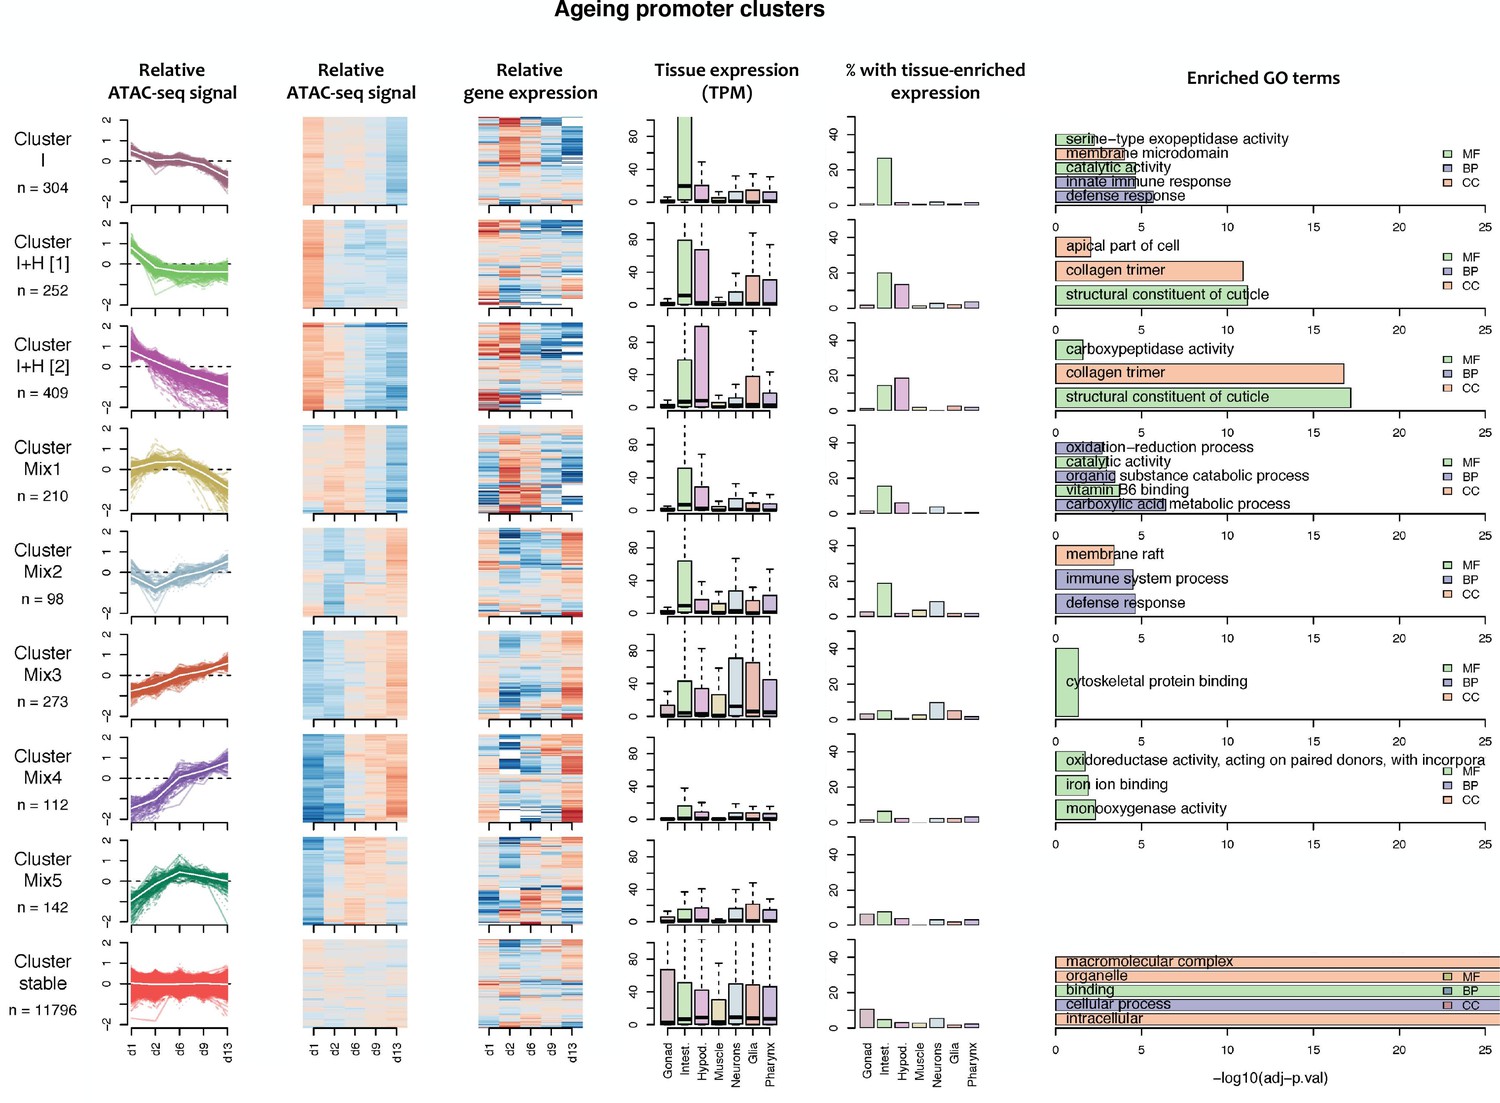
Characteristics of ageing promoter clusters.
Characteristics of promoter clusters with shared accessibility patterns across ageing. Relative promoter ATAC-seq coverage is shown across the time series as a graph (each line representing a promoter) and a heatmap (each row representing a promoter). Values are scaled from −2 (dark blue) to 0 (white) to +2 (dark red). Heatmap showing relative expression of the associated genes across the time series, using the same color scale. Tissue expression box plots show TPMs of clustered genes in individual tissues (data from Cao et al., 2017). Percentage of genes with tissue-enriched expression shows the percentage of genes within the cluster with enriched expression in the indicated tissues. Enriched GO terms show the top five enriched GO terms obtained for each cluster from the corresponding list of genes using gProfiler. MF = Molecular Function, CC = Cellular Component, BP = Biological Process. Note that Cluster Mix5 does not have any enriched GO terms.
Figure 5
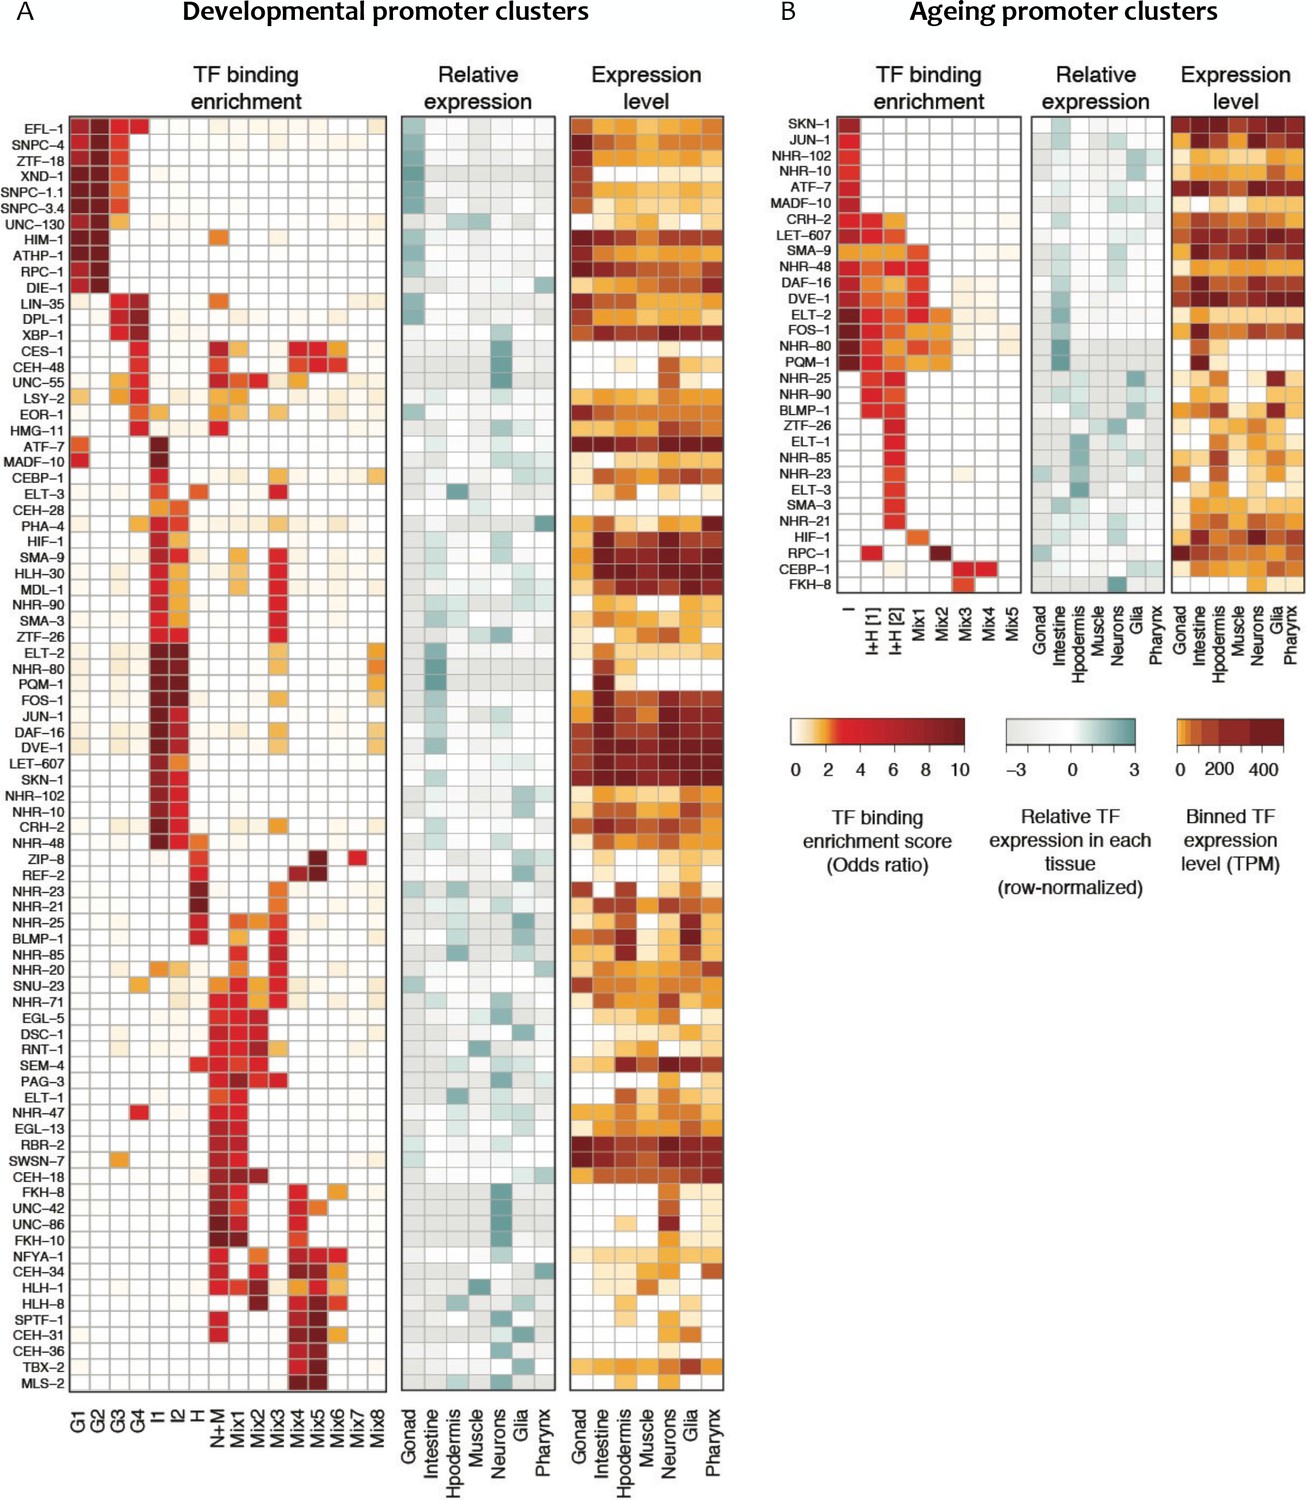
Transcription factor binding enrichment in developmental and ageing promoter clusters.
Transcription factor (TF) binding enrichments in developmental (A) or ageing (B) promoter clusters from Figure 4. TF-binding data are from modENCODE/modERN (Araya et al., 2014; Kudron et al., 2018); peaks in HOT regions were excluded (see Materials and methods). Only TFs enriched more than twofold in at least one cluster are shown, and only enrichments with a p<0.01 (Fisher’s exact test) are shown. Plots show TF binding enrichment odds ratio (left), expression of the TF in each tissue relative to its expression across all tissues (log2(TF tissue TPM/mean of the TF’s TPMs across all tissues), middle), and the decile of expression of the TF in each tissue (right; TPMs < 1 are not taken into account when calculating TPMs deciles). Expression data are from Cao et al. (2017). Legends for Figure Supplements.
-
Figure 5—source data 1
TF datasets used for analyses.
● factor transcription factor name. ● dataset_name modENCODE/modERN DCC dataset name(s), separated by commas if multiple datasets from the same transcription factor were used. ● dataset_id modENCODE/modERN DCC dataset ID(s), comma-separated as above.
- https://doi.org/10.7554/eLife.37344.023
Author response image 1
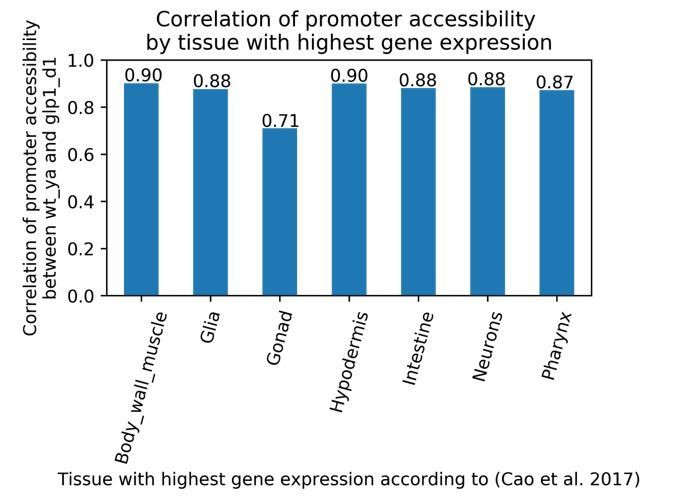
Correlation of peak chromatin accessibility between wild-type young adult, and glp-1 day 1 time points at protein-coding promoters, grouped by tissue with the highest gene expression.
Additional files
-
Transparent reporting form
- https://doi.org/10.7554/eLife.37344.024
Download links
A two-part list of links to download the article, or parts of the article, in various formats.
Downloads (link to download the article as PDF)
Open citations (links to open the citations from this article in various online reference manager services)
Cite this article (links to download the citations from this article in formats compatible with various reference manager tools)
Chromatin accessibility dynamics across C. elegans development and ageing
eLife 7:e37344.
https://doi.org/10.7554/eLife.37344


