Engineering induction of singular neural rosette emergence within hPSC-derived tissues
- University of Wisconsin-Madison, United States
- Wisconsin Institute for Discovery, University of Wisconsin-Madison, United States
Figures
Figure 1 with 1 supplement
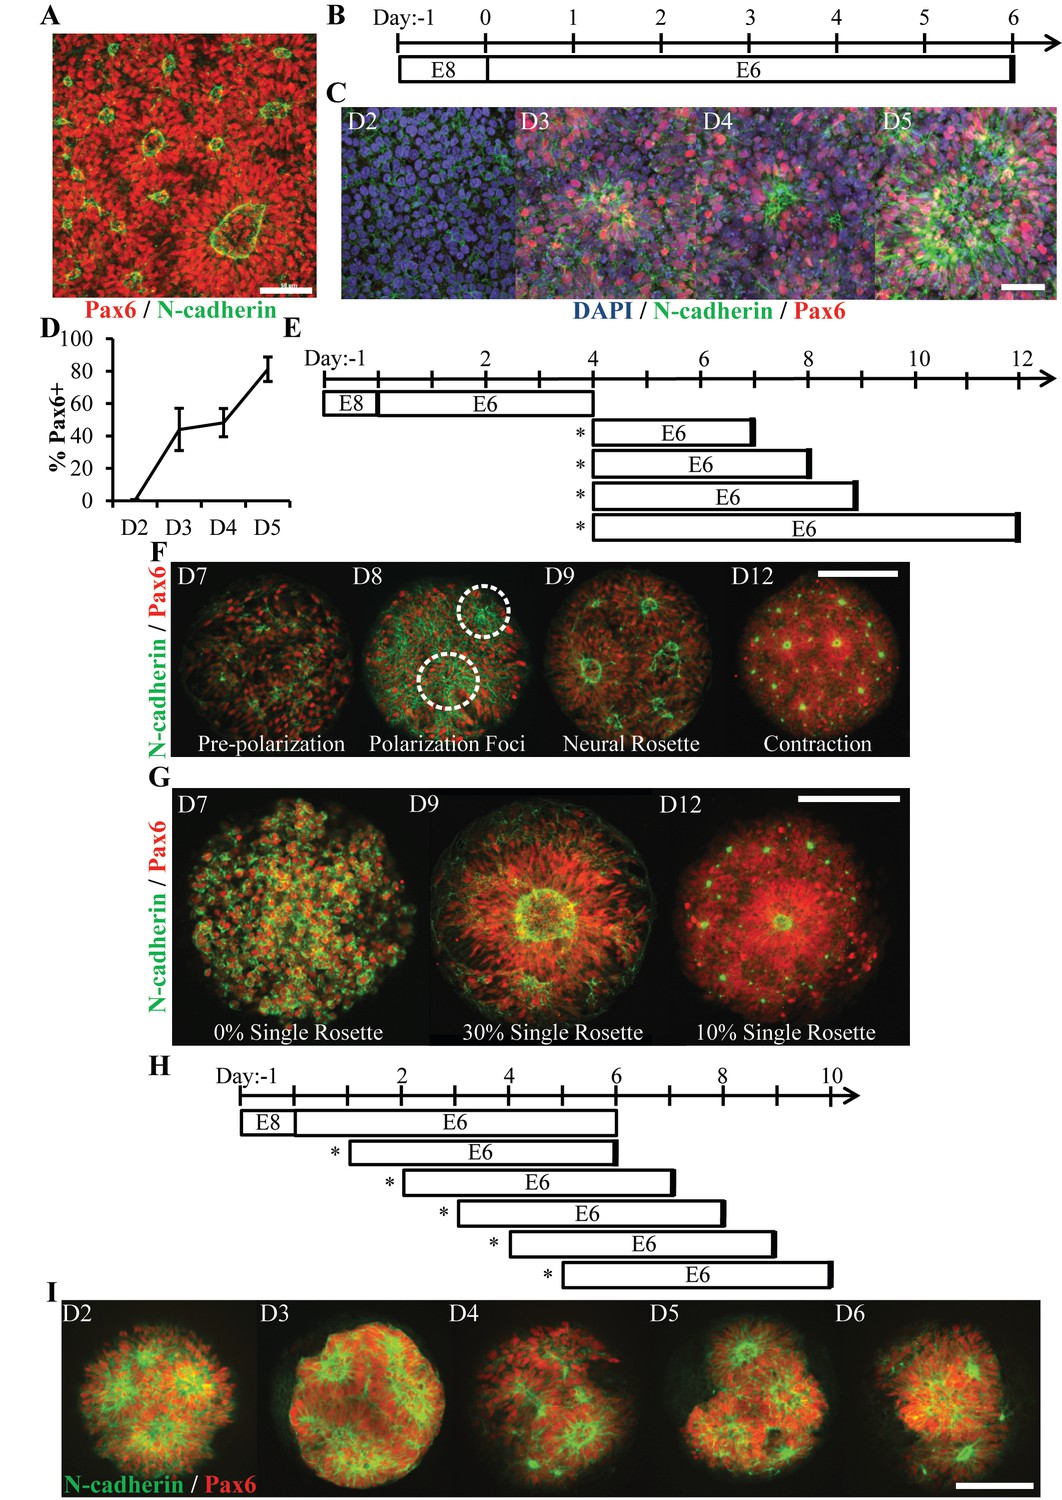
Characterization of Neural Rosette Emergence.
(A) Image of N-cadherin polarized neural rosettes structures within neuroepithelial tissues derived from hPSCs using the E6 method in 6-well TCPS plates. (B) Schematic of NEC derivation via the E6 method and (C) representative immunostaining images of neural induction (Pax6) and polarization (N-cadherin) time course. Co-staining of neural rosettes with F-actin, ZO-1 tight junction proteins, and phospho-H3+ mitotic nuclei are provided in Figure 1—figure supplement 1. (D) Quantification of Pax6 expression during NECs derivation (n = 6 fields of view for one well per time point). Error bars represent standard deviation. (E) Schematic of neural rosette emergence within micropatterned tissues derived from D4 NECs; sub-culture/seeding onto micropatterned substrates indicated by (*). (F) Representative images depicting stages of rosette emergence and (G) rate of singularity within neuroepithelial tissues on select days. Dotted lines highlight polarization foci. (H) Schematic of experiment testing the effect of E6 subculture time point on neural rosette emergence within micropatterned neuroepithelial tissues, and (I) corresponding images of immunostained tissues 5 days after culture on micropatterned substrates. Analysis of the tissues’ cell density and percentage of Pax6+ cells are provided in Figure 1—figure supplement 1. Scale bars are (A, C) 50 μm and (F, G, and I) 200 μm.
-
Figure 1— source data 1
Imaging and quantitative analysis of micropatterned neuroepitelial tissues.
- https://doi.org/10.7554/eLife.37549.004
Figure 1—figure supplement 1

Imaging and Quantitative Analysis of Micropatterned Neuroepithelial Tissues.
(A) Co-localization of F-actin, ZO-1 tight junction proteins, and phospho-H3+ mitotic nuclei within N-cadherin polarized structures confirms neural rosette formation. Scale bar is 50 μm. (B) Image of D4-NEC-derived tissues on micropatterned substrates. Scale bar is 300 μm. (B) Quantification of average cell density and (C) Pax6 expression within micropatterned neuroepithelial tissues 5 days post-seeding of cells sub-cultured on indicated days of the E6 method. (*) indicates a significance of p<0.05 calculated using a One-way ANOVA, and error bars represent standard deviation. Red line denotes initial seeding density on microarray, and number of tissues (technical replicates) analyzed per condition in both graphs is indicated within bars.
Figure 2 with 1 supplement
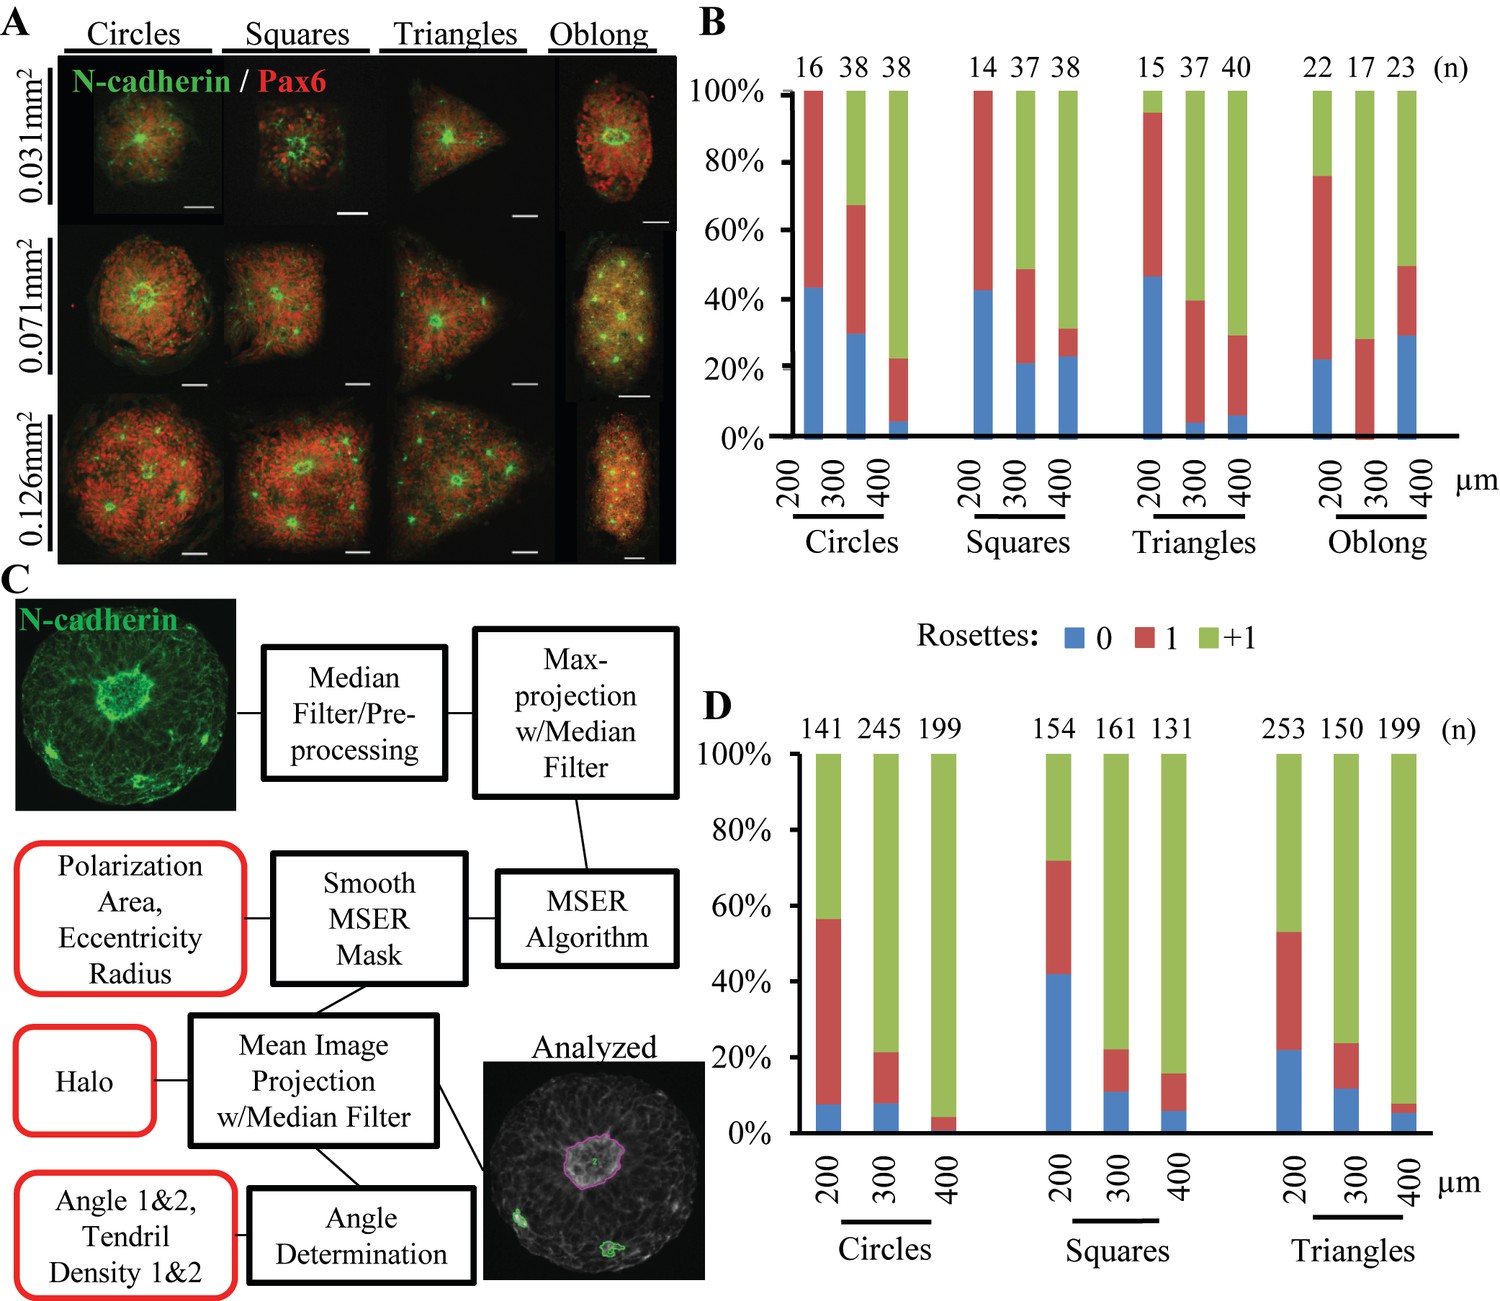
Effect of Tissue Morphology on Singular Rosette Emergence.
(A) Representative images of micropatterned neuroepithelial tissues of circle, square, triangle, and oblong morphologies of varying size. Scale bars are 50 μm. (B) Manual quantification of polarization foci and neural rosettes within micropatterned neuroepithelial tissues of varying morphology. Number of tissues (technical replicates) analyzed per geometry is indicated above each bar. (C) Schematic of automated image analysis algorithm for quantification of polarization foci and neural rosettes. In ‘Analyzed’ micrograph, the purple outline indicates a rosette and green outlines indicate polarization foci as determined by the image analysis workflow. Micrograph’s providing further visual representation of neuroepithelial tissue descriptors (outlined in red) detected by the image analysis algorithm are provided in Figure 2—figure supplement 1. (D) Automated quantification of polarization foci and neural rosettes in micropatterned neuroepithelial tissues of varying morphology. Number of tissues (technical replicates) analyzed per geometry is indicated above each bar.
-
Figure 2— source data 1
Manual and automated quantification of neural rosette emergence.
- https://doi.org/10.7554/eLife.37549.007
Figure 2—figure supplement 1
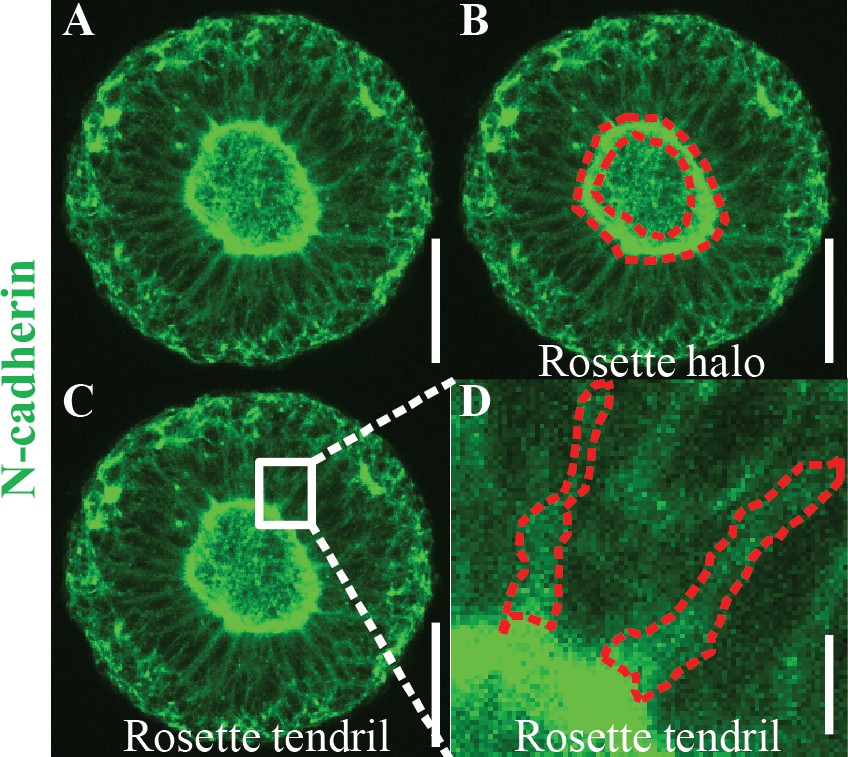
Schematic of Automated Image Analysis Algorithm Descriptors.
(A) Maximum intensity projection of micropatterned neuroepithelial tissue immunostained for N-cadherin. (B) Outlined region identified as N-cadherin halo boundary for use in area, radius, and eccentricity measurements. (C) Selected box region (white) that proceeds around N-cadherin ring boundary to calculate tendril angle 1 and two and tendril density 1 and 2. (D) Magnification of box region with dotted red outline of N-cadherin stained tendrils, which are indicative of cell-to-cell membrane interfaces. Scale bars are (A, B, C) 100 μm and (D) 10 μm.
Figure 3

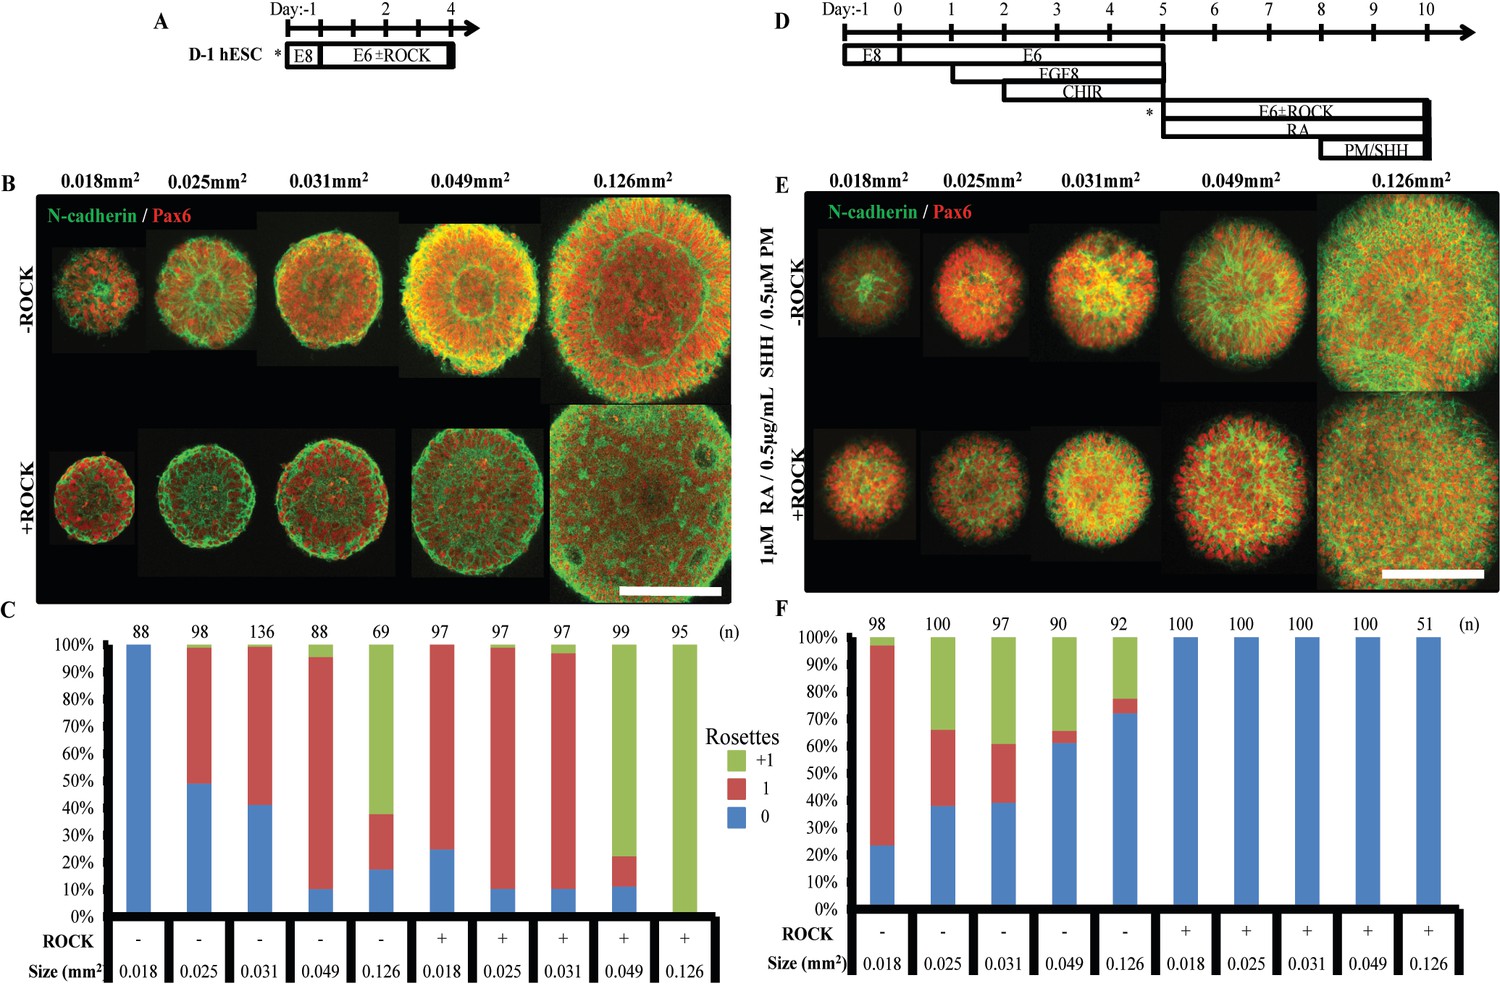
Comparison of Rosette Emergence in D-1 hESC vs D4 NEC micropatterned tissues.
(A) Schematic of micropatterned tissue derivation for D-1 hESCs and D4 NECs; sub-culture/seeding onto micropatterned substrates indicated by (*). (B) Representative immunostained images of forebrain, micropatterned neuropithelial tissues. (C) Manual quantification of polarization foci/neural rosettes per tissue with the number of tissues (technical replicates) analyzed per condition indicated above each bar. (D) Average cell density and (E) area of polarized N-cadherin ring within micropatterned neuroepithelial tissues derived from D-1 hESCs and D4 NECs. Number of tissues analyzed per condition indicated on each bar, and error bars represent standard deviation. (*) indicates a significance of p<0.05 calculated using a One-way ANOVA. (F) Representative confocal Z-stack images of micropatterned neuroepithelial tissues (top) with profile view of red highlighted region (bottom). Scale bars are (B, F-top) 100 μm and (F-bottom) 10 μm.
-
Figure 3— source data 1
Quantification of rosette emergence, tissue cell density, and polarized N-cadherin ring area.
- https://doi.org/10.7554/eLife.37549.009
Figure 4 with 1 supplement
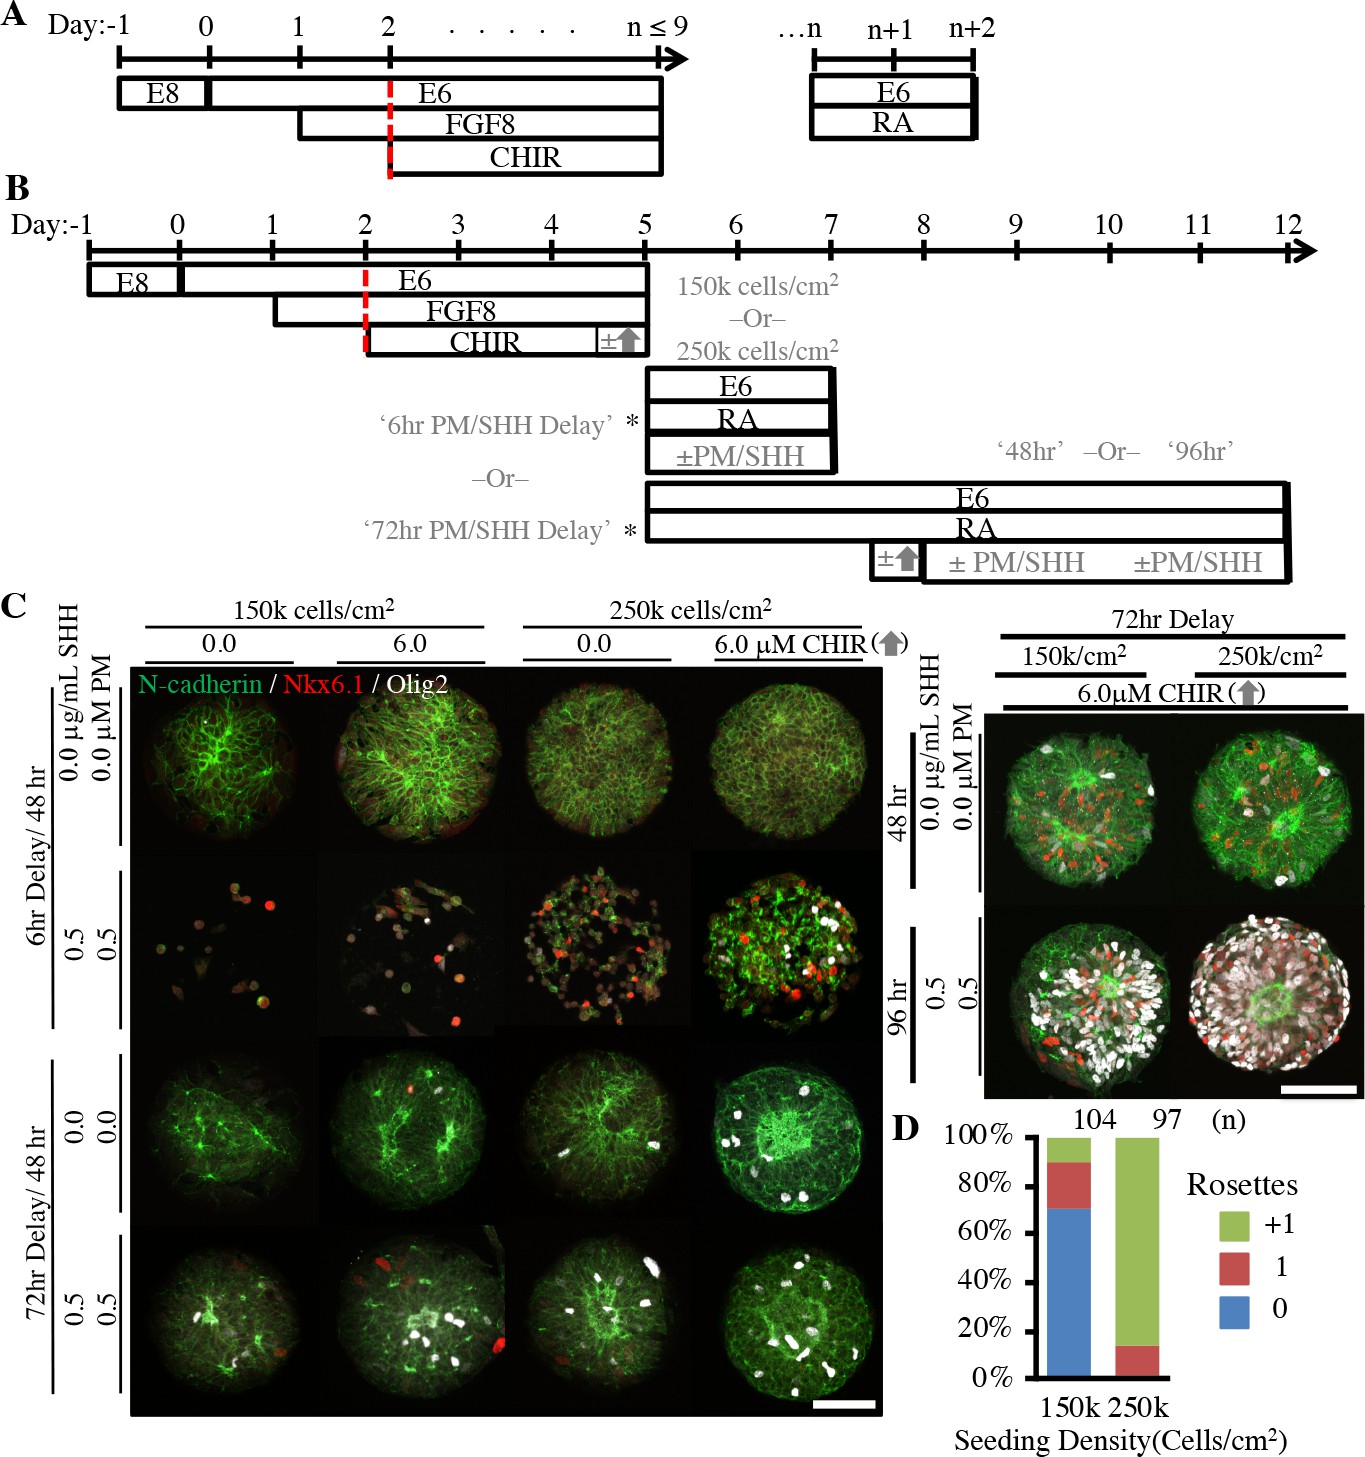
Derivation of micropatterned spinal neuroepithelial tissues.
(A) Schematic for deterministic HOX patterning of hPSC-derived neuroepithelium in well plate culture. Dotted red bars indicated well-plate subculture. (B) Schematic for translation of well plate protocol to micropatterned arrays with sub-culture (*) of cervical HOX patterned NMPs onto micropatterned substrates and subsequent differentiation to ventral spinal tissues. Tested variables indicated in gray. (C) Representative images of tissues derived when varying seeding density, timing of CHIR boost, and timing and duration of ventral patterning using Sonic Hedgehog (SHH/PM) signaling. Scale bars are 100 μm. Analysis of spinal tissue HOX expression plus quantification of Nkx6.1/Olig2 expression and cell density in each experimental condition is provided in Figure 4—figure supplement 1. (D) Quantification of polarization foci/rosettes per tissue with the number of tissues (technical replicates) analyzed per condition above each bar.
-
Figure 4— source data 1
Quantification of micropatterned spinal neuroepithelial tissue regional patterning and cell density.
- https://doi.org/10.7554/eLife.37549.012
Figure 4—figure supplement 1
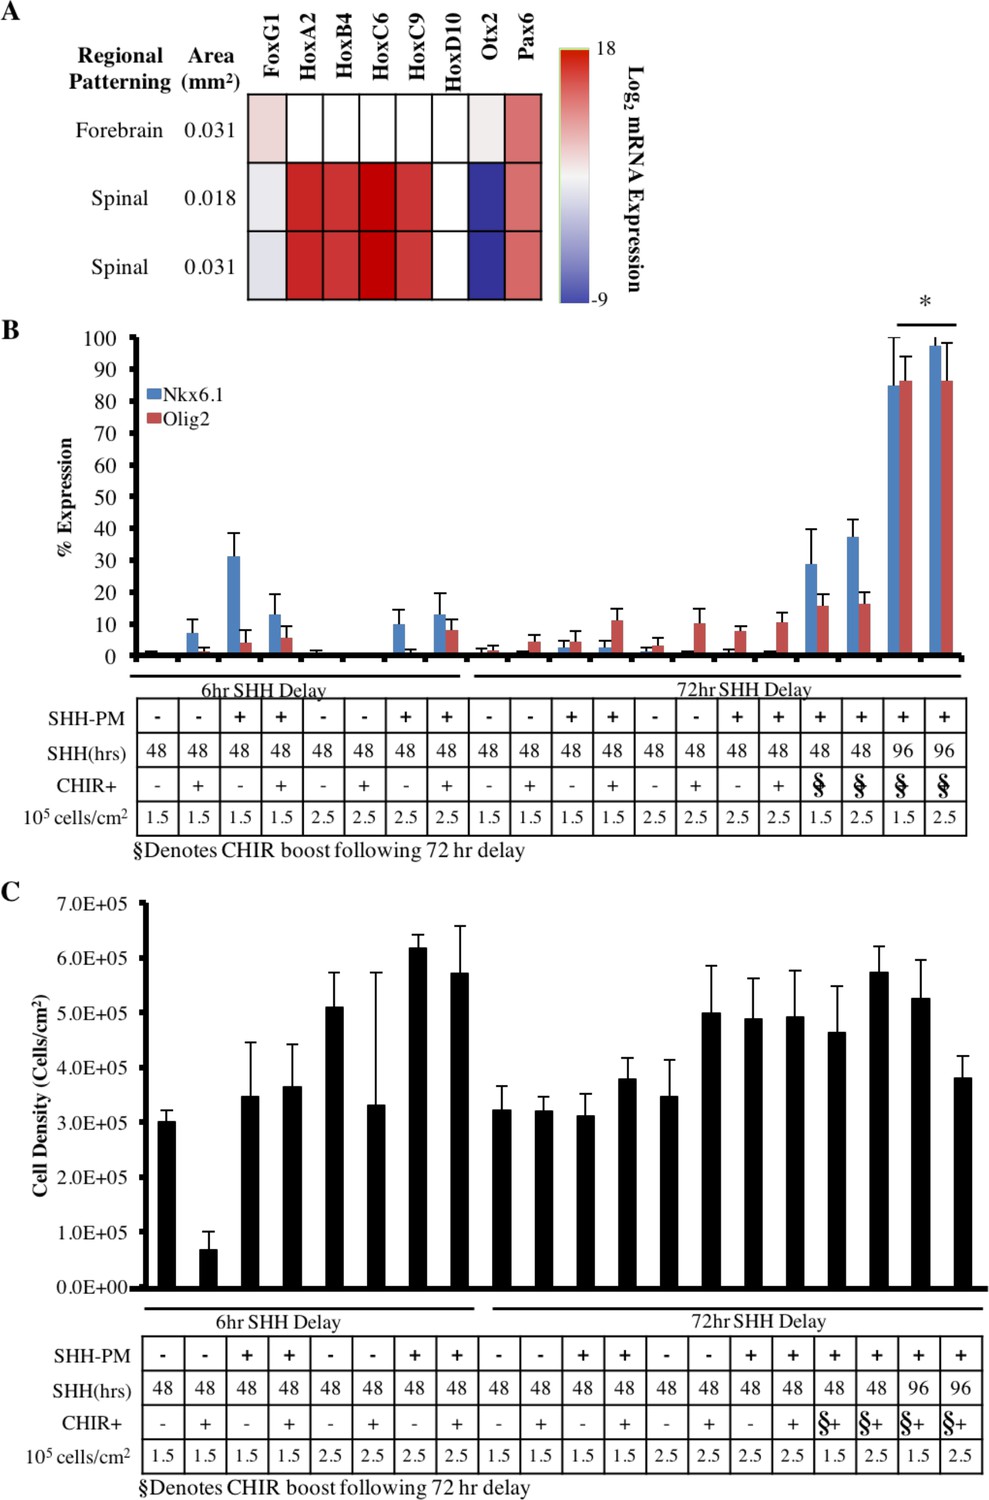
Characterization of regional specification of micropatterned spinal neuroepithelial tissues.
(A) Heatmap of qRT-PCR analysis of the micropatterned neuroepithelial tissue’s R/C regional patterning. Data presented as ΔΔCt values relative to RSP18 and normalized to caudalization Day 2 cells. (B) Quantification of neuroepithelial tissue ventralization as assessed by percentage of Nkx6.1+ and Olig2+ cells, which is indicative of motor neuron progenitors; n = 8 tissues (technical replicates) per condition. (*) indicates a significance of p<0.05 calculated using a One-way ANOVA, and error bars represent standard deviation. (C) Quantification of spinal cord NEC density within micropatterned tissues.
Figure 5 with 2 supplements
Singular neural rosette emergence within forebrain and spinal neuroepithelial tissues.
(A) Schematic for derivation of micropatterned forebrain neuroepithelial tissues; subculture/seeding onto micropatterned substrates indicated by (*). (B) Representative images of neural rosette emergence in micropatterned, hESC-derived forebrain neuroepithelial tissues of various areas with and without ROCK inhibitor. (C) Quantification of polarization foci/rosettes per forebrain tissue with the number of tissues analyzed per condition above each bar. (D) Schematic for derivation of micropatterned spinal neuroepithelial tissues; sub-culture/seeding onto micropatterned substrates indicated by (*). (E) Representative images of neural rosette emergence in micropatterned, hESC-derived spinal cord neuroepithelial tissues of various areas with and without ROCK inhibitor. (F) Quantification of polarization foci/neural rosettes per spinal tissue with the number of tissue (technical replicates) analyzed per condition above each bar. Figure 5—figure supplement 1 provides quantification of average cell density within hESC-derived forebrain and spinal neuroepithelial tissues for each experimental condition. Figure 5—figure supplement 2 shows a representative image and quantification of polarization foci/rosettes per forebrain tissue derived from D90A SOD1 mutant ALS-iPSCs. Scale bars are (B, F) 200 µm.
-
Figure 5— source data 1
Quantification of cell density and rosette emergence in forebrain and spinal and iPSC-derived tissues.
- https://doi.org/10.7554/eLife.37549.016
Figure 5—figure supplement 1
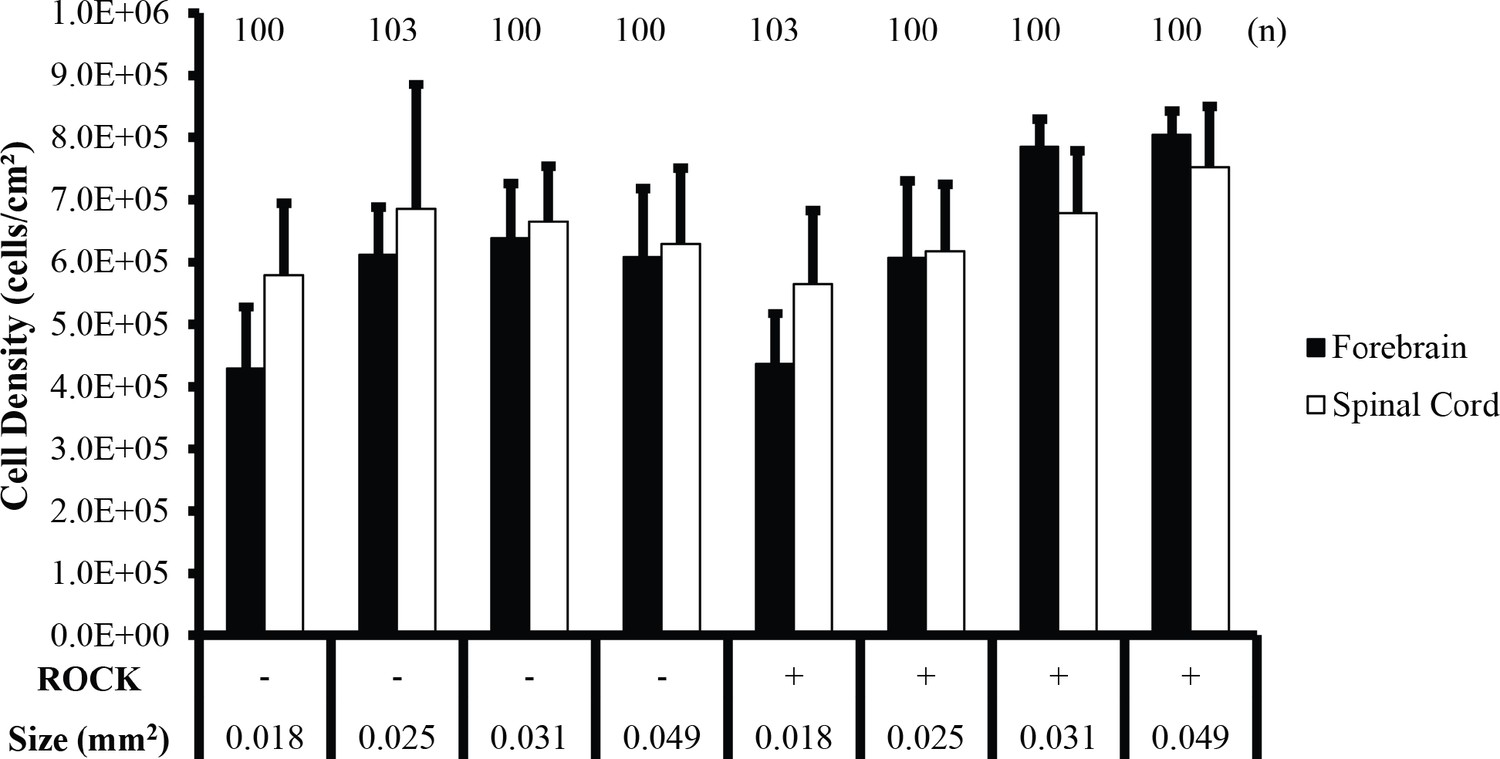
Cell density analysis of forebrain and spinal cord neuroepithelial tissues.
Average NEC density compared between forebrain and spinal cord tissues on 150, 180, 200, and 250 µm diameter circular micropatterns in the absence or presence of ROCK inhibition. Number of tissues (technical replicates) analyzed presented above each condition. Pairwise Student’s t-Test indicated no significant differences between tissues of equivalent dimensions in the absence or presence of Rock inhibition or between forebrain and spinal cord tissues in each condition. Error bars represent standard deviation.
Figure 5—figure supplement 2
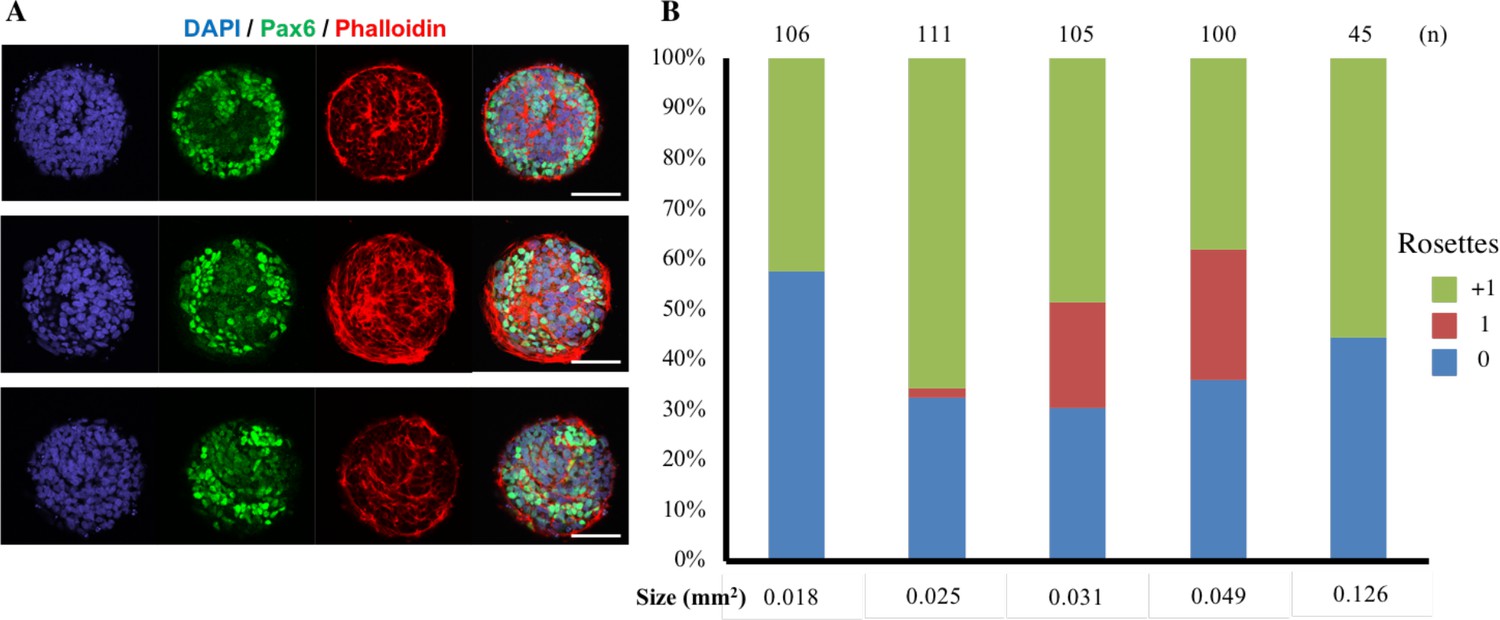
Singular rosette emergence within D90A SOD1 mutant ALS-iPSCs.
(A) Representative images of micropatterned tissues with non-homogenous Pax6 expression on Day 4 of culture. Scale bars are 100 µm. (B) Quantification of polarization foci/rosettes per forebrain tissue with the number of tissues analyzed per condition above each bar.
Figure 6 with 5 supplements
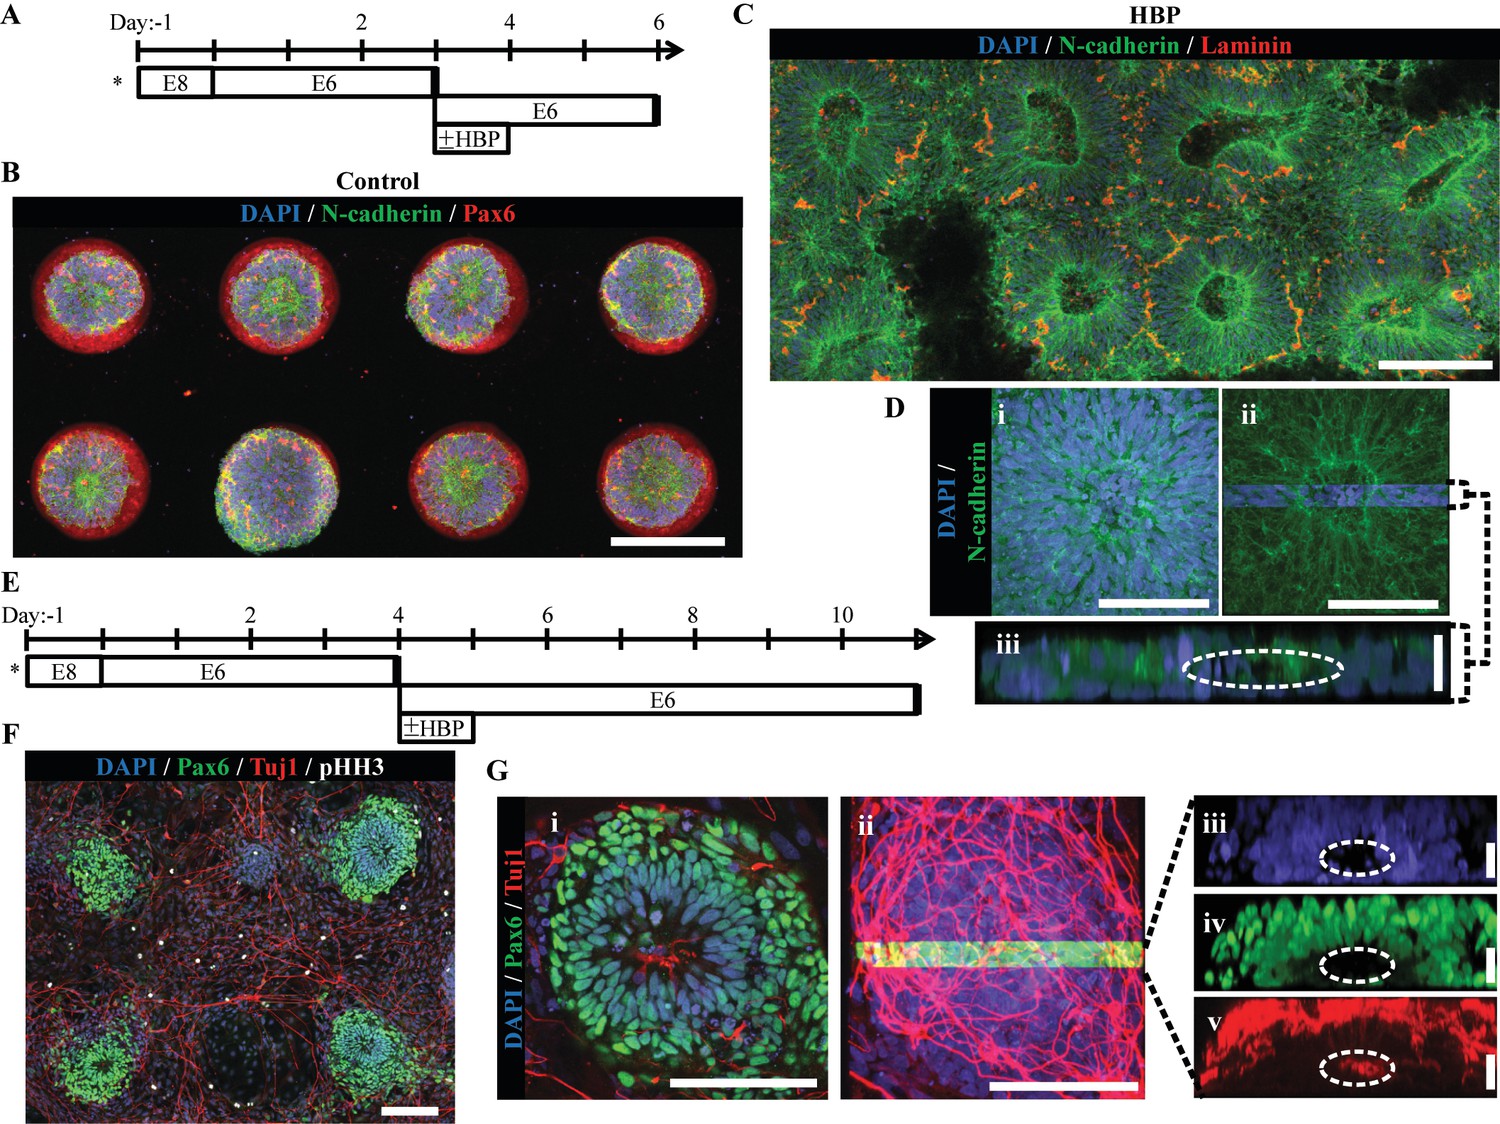
Micropatterned neuroepithelial tissue outgrowth on clickable, HBP-presenting substrates.
(A) Schematic for derivation and HBP-mediated expansion of forebrain neuroepithelial tissues on chemically-modified micropattern arrays of 200 µm diameter circles with 400 µm center-to-center spacing. Figure 6—figure supplements 2 and 3 show spectroscopic and protein assay quantification of HBP-DBCO bioconjugates and functional demonstration in their surface immobilized form, respectively. (B) Image of singular neural rosette emergence within D6 neuroepithelial tissues on inert PEG-MA substrates not functionalized by HBP-DBCO bioconjugates. (C) Image of singular neural rosette expansion within D6 neuroepithelial tissues on reactive PEG-MA substrates functionalized with HBP-DBCO bioconjugates. The tissues show radial expansion and deposition of a Laminin+ basement membrane analogous to extended neuroepithelial culture in well plates as shown in Figure 6—figure supplement 1. Bright-field, time course images of radial tissue expansion are shown in Figure 6—figure supplement 4. (D) (i) Magnified image of expanded neuroepithelial tissue with (ii) highlighted 3D cross-section and (iii) profile view; white dotted line indicates hollow polarization cavity. (E) Schematic for derivation and HBP-mediated expansion of forebrain neural tissues on chemically-modified micropattern arrays of 200 µm diameter circles with 800 µm center-to-center spacing. (F) Image of singular neural rosette tissue outgrowth and neuronal differentiation on HBP-functionalized substrates at day 11. (G) (i) Magnified image of the neuroepithelial center of expanded neural tissues with (ii) the highlighted 3D cross-section and profile view of (iii) nuclei, (iv) Pax6+ core, and (v) primarily peripheral Tuj1+ neuronal processes; white dotted lines indicate hollow polarization cavity. 3D animated deconstruction of an immunostained tissue that further facilitates cavity visualization is provided in Figure 6—video 1. Scale bars are (B, C, F) 200 µm, (D(i,ii), G(i,ii)) 100 µm, and (D(iii), G(iii,iv,v)) 20 µm.
-
Figure 6— source data 1
Quantification of micropatterned substrate engineering.
- https://doi.org/10.7554/eLife.37549.023
Figure 6—figure supplement 1
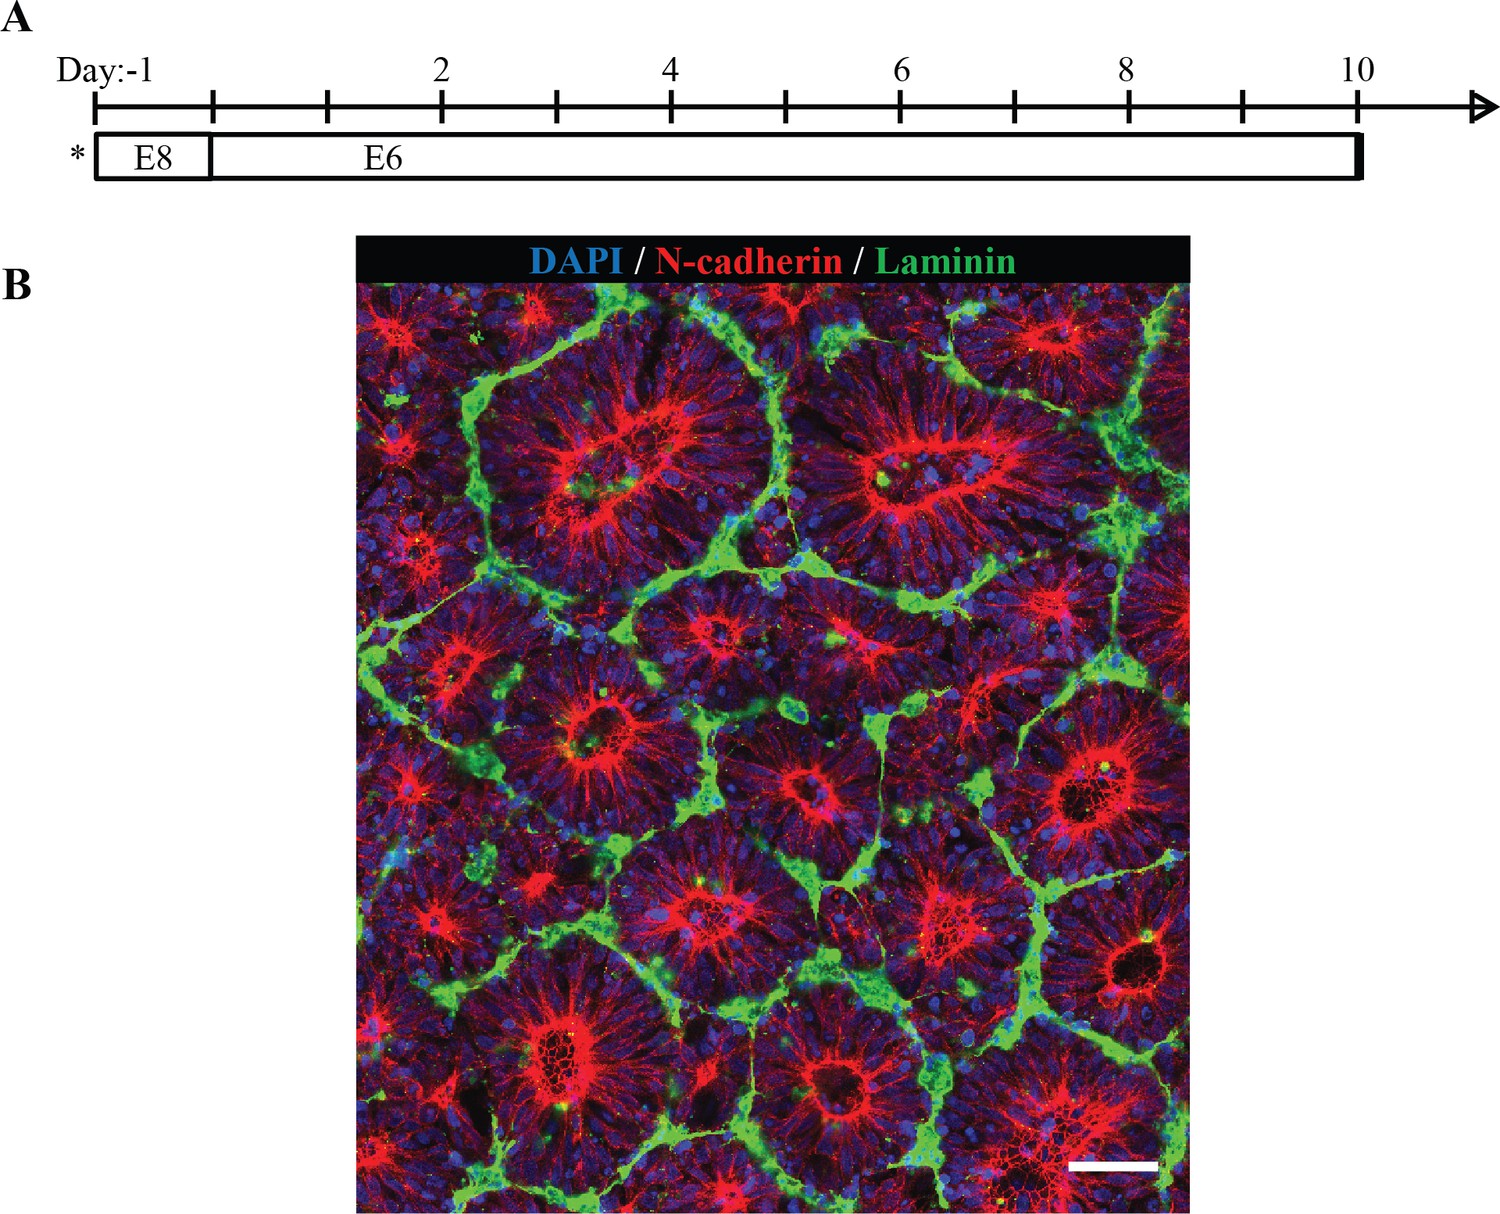
ECM deposition by neuroepithelial tissues upon extended culture.
(A) Schematic timeline for extended culture of forebrain NECs in standard well plate culture; seeding onto TCPS well plate indicated by (*) (B) Fluorescent image of D10 NECs depicting dense deposition of laminin at the neural rosettes’ basal tissue boundary. Scale bar is 50 µm.
Figure 6—figure supplement 2
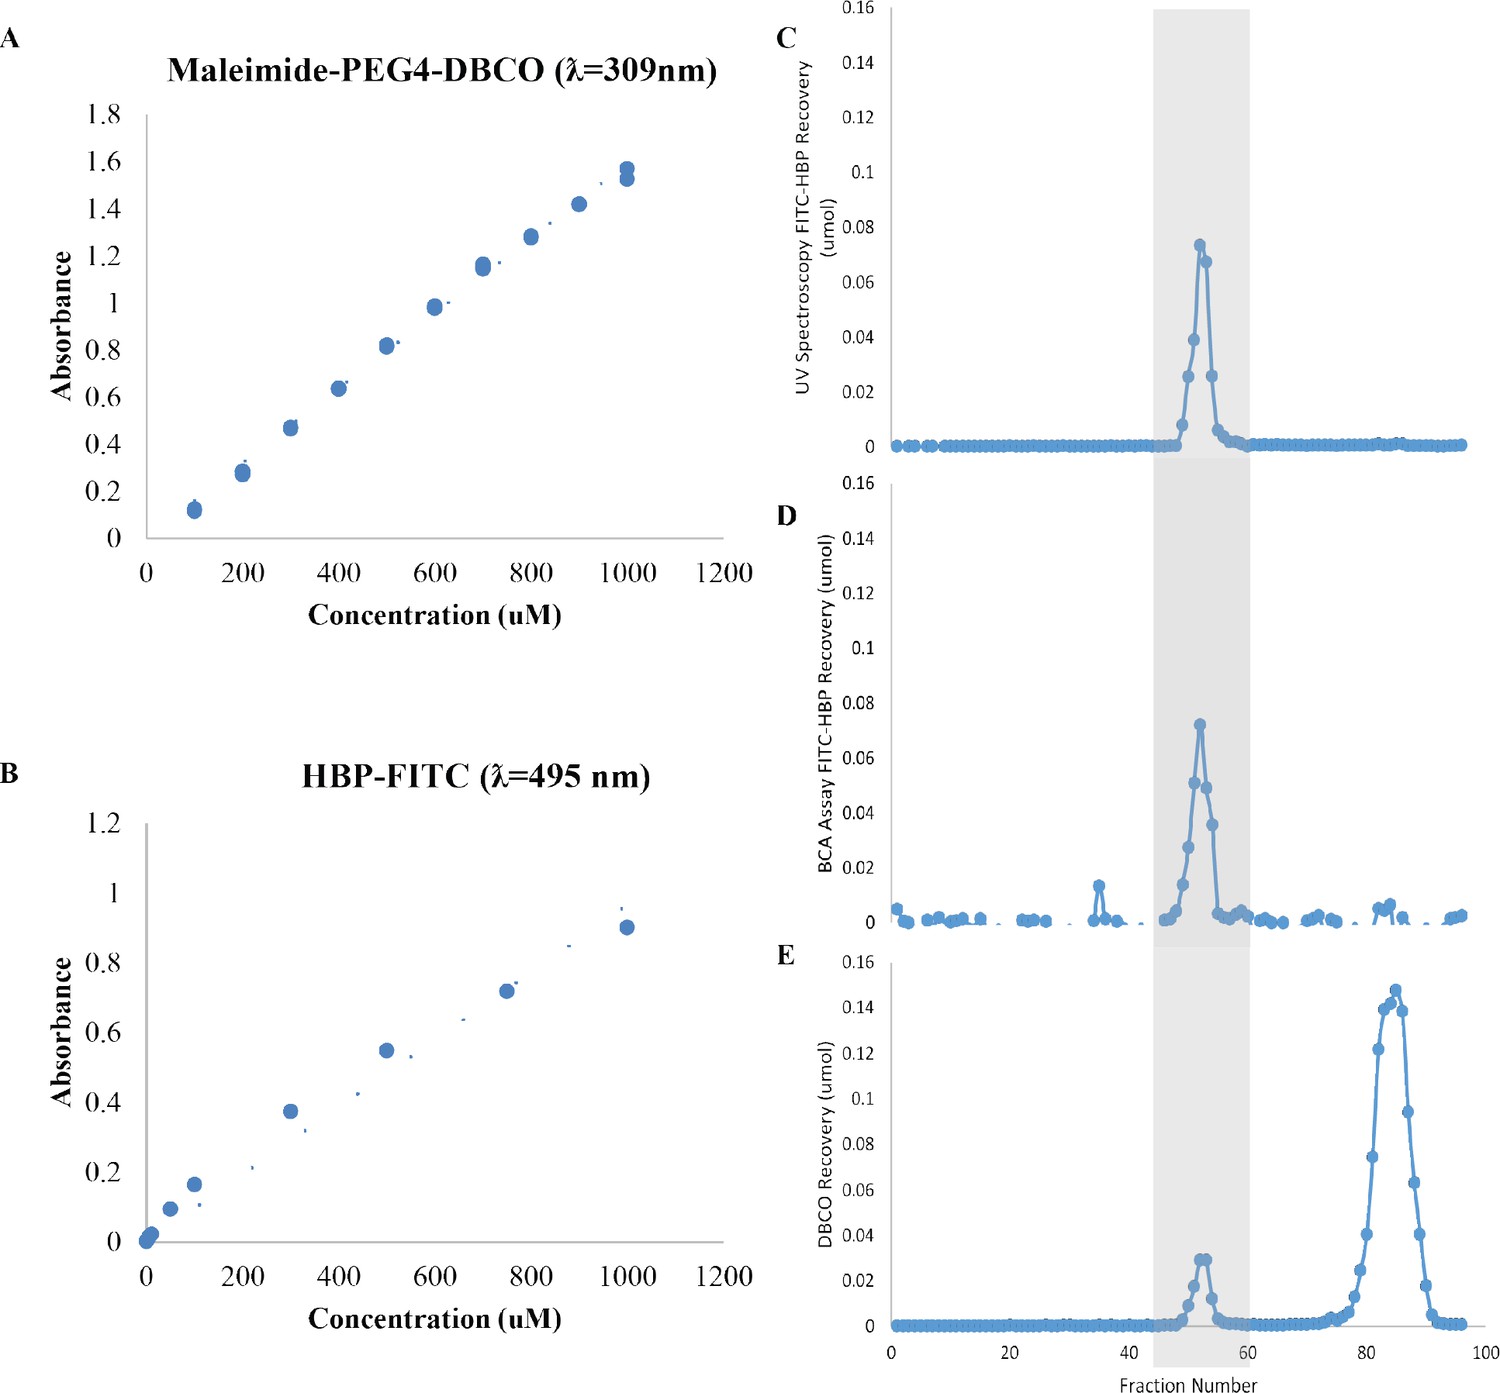
Characterization of FITC-HBP-DBCO Bioconjugate Synthesis.
(A) Standard curve of Maleimide-PEG4-DBCO crosslinker absorbance measured at 309 nm. (B) Standard curve of FITC-HBP absorbance measured at 495 nm. Size exclusion chromatography traces of FITC-HBP quantified from (C) 495 nm measurements and (D) a Micro-BCA assay, and (E) DBCO quantified from 309 nm measurements in 1 mL fractions. Gray box indicates alignment of FITC-HBP and DBCO elution in fractions containing the desired bioconjugate.
Figure 6—figure supplement 3
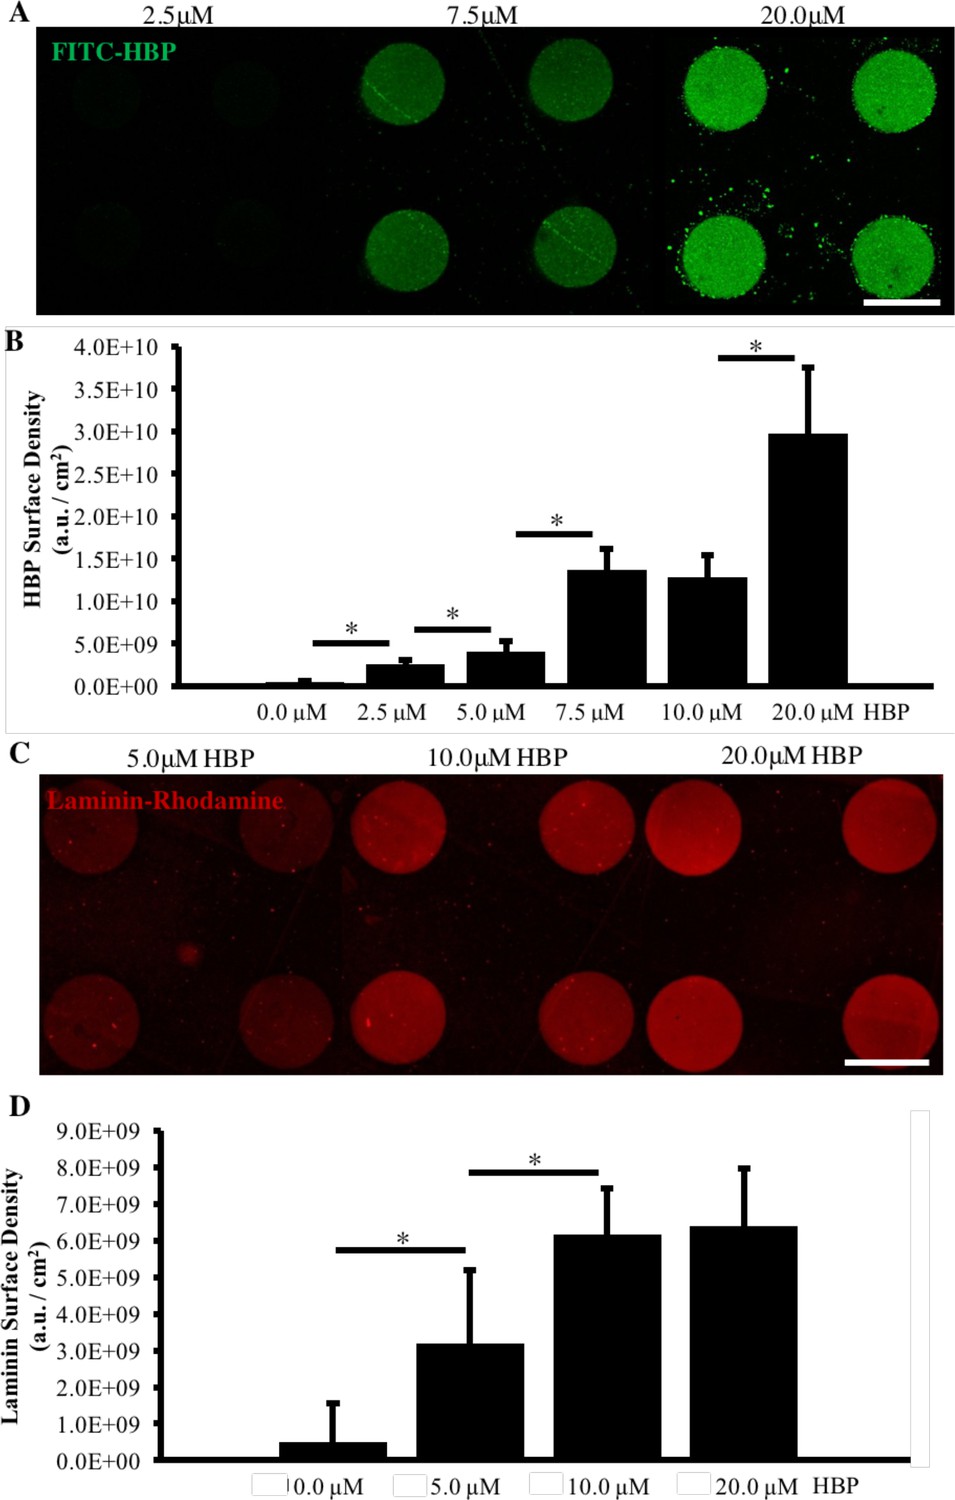
Analysis of HBP-DBCO bioconjugate surface density and ECM adsorption.
(A) Fluorescent images of FITC-HBP surface immobilization after 24 hr incubation of micropatterned substrates of 200 µm diameter circular and azide-functionalized PEG-MA posts backfilled with inert PEG brushes at various concentrations of FITC-HBP-DBCO. (B) Relative quantification of FITC-HBP surface density on micropatterned substrates, n = 50 micropatterns per condition (technical replicates). (C) Fluorescent images of rhodamine-laminin adsorption on micropatterned substrates functionalized with various concentrations of HBP. (D) Relative quantification of laminin adsorption on micropatterned substrates, n = 50 micropatterns per condition (technical replicates). (*) indicates a significance of p<0.05 calculated using a One-way ANOVA, and error bars represent standard deviation. Scale bars are 200 µm.
Figure 6—figure supplement 4
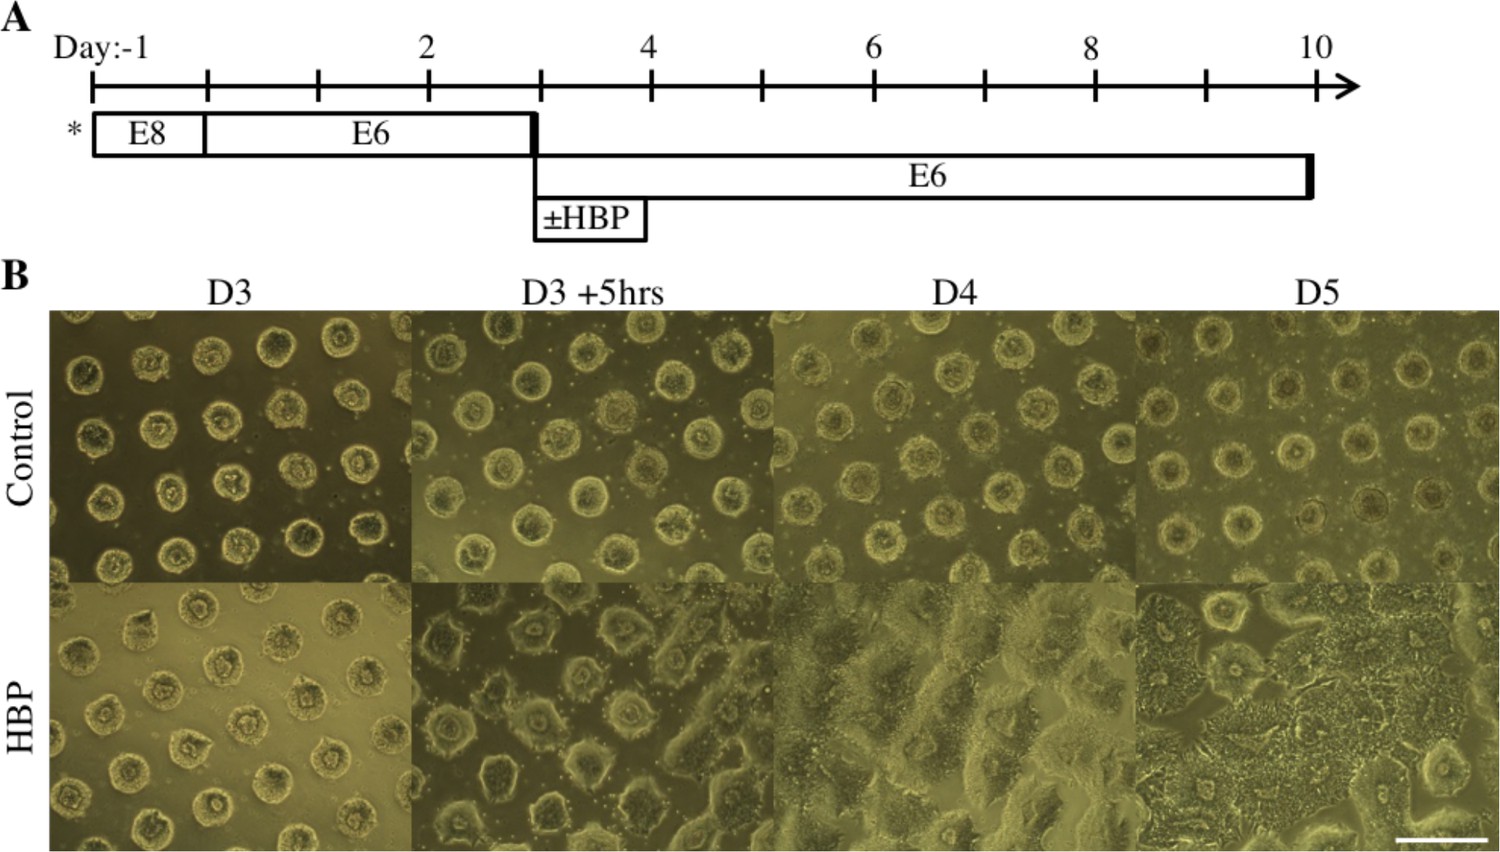
Time Course Imaging of Patterned NEC Tissue Outgrowth.
(A) Schematic timeline for derivation and HBP-mediated expansion of forebrain NEC tissues on 200 µm circular micropatterned arrays with 400 µm center-to-center spacing and intervening reactive PEG-MA brushes. (*) indicates when hPSCs were seeded on micropatterned substrates. (B) Representative brightfield images of neuroepithelial tissue expansion directly following in situ surface functionalization with HBP. Scale bar is 400 µm.
Figure 6—video 1
3D Deconstruction of Patterned Neural Tissue Immunostaining.
Tissues were fixed after the radial outgrowth period and immunostained for cell nuclei (blue), Pax6 (green), and βIII-Tubulin (red). Pax six indicates NECs, and βIII-Tubulin indicated neurons. The animated deconstruction shows persistence of polarized NECs and a 3-D lumen at the tissue’s core.
Additional files
-
Supplementary file 1
Image analysis data and reagent tables.
Table S1 and S2 provide summary statistics on human vs. algorithm (i.e. the automated neuroepithelial image analysis algorithm and machine learning classifier) error rates. Table S1 reports analysis conducted on 300 μm diameter (0.071 mm2) circular tissue images, and Table S2 reports analysis conducted on 35 neuroepithelial tissue images selected randomly and distributed across all morphologies. Table S3 and S4 provide catalog and usage information for primary antibodies and QPCR primer sets used in this study.
- https://doi.org/10.7554/eLife.37549.024
-
Supplementary file 2
Image analysis algorithm.
Folder provides instructions, that is ‘readme.txt’, and code files for batch analysis of N-cadherin immunostained neuroepithelial tissue images using MATLAB. This folder can be used to create image descriptor vectors.
- https://doi.org/10.7554/eLife.37549.025
-
Supplementary file 3
Machine learning classifier workspace.
Folder provides MATLAB workspace files that can be uploaded to apply our custom classifier to image descriptor vector data sets. This is used to automatically classify whether N-cadherin+ foci within a neuroepithelial tissue image are polarization foci or rosettes.
- https://doi.org/10.7554/eLife.37549.026
-
Transparent reporting form
- https://doi.org/10.7554/eLife.37549.027
Download links
A two-part list of links to download the article, or parts of the article, in various formats.
Downloads (link to download the article as PDF)
Open citations (links to open the citations from this article in various online reference manager services)
Cite this article (links to download the citations from this article in formats compatible with various reference manager tools)
Engineering induction of singular neural rosette emergence within hPSC-derived tissues
eLife 7:e37549.
https://doi.org/10.7554/eLife.37549


