The adhesion function of the sodium channel beta subunit (β1) contributes to cardiac action potential propagation
- Rengasayee Veeraraghavan

- Gregory S Hoeker
- Anita Alvarez-Laviada
- Daniel Hoagland
- Xiaoping Wan
- D Ryan King
- Jose Sanchez-Alonso
- Chunling Chen
- Jane Jourdan
- Lori L Isom
- Isabelle Deschenes
- Julia Gorelik
- Steven Poelzing
- Robert G Gourdie
- Virginia Polytechnic University, United States
- Imperial College London, United Kingdom
- Case Western Reserve University, United States
- Virginia Tech, United States
- University of Michigan Medical School, United States
- Case Western Reserve University, Unites States
- College of Science, United States
Figures
Figure 1 with 3 supplements
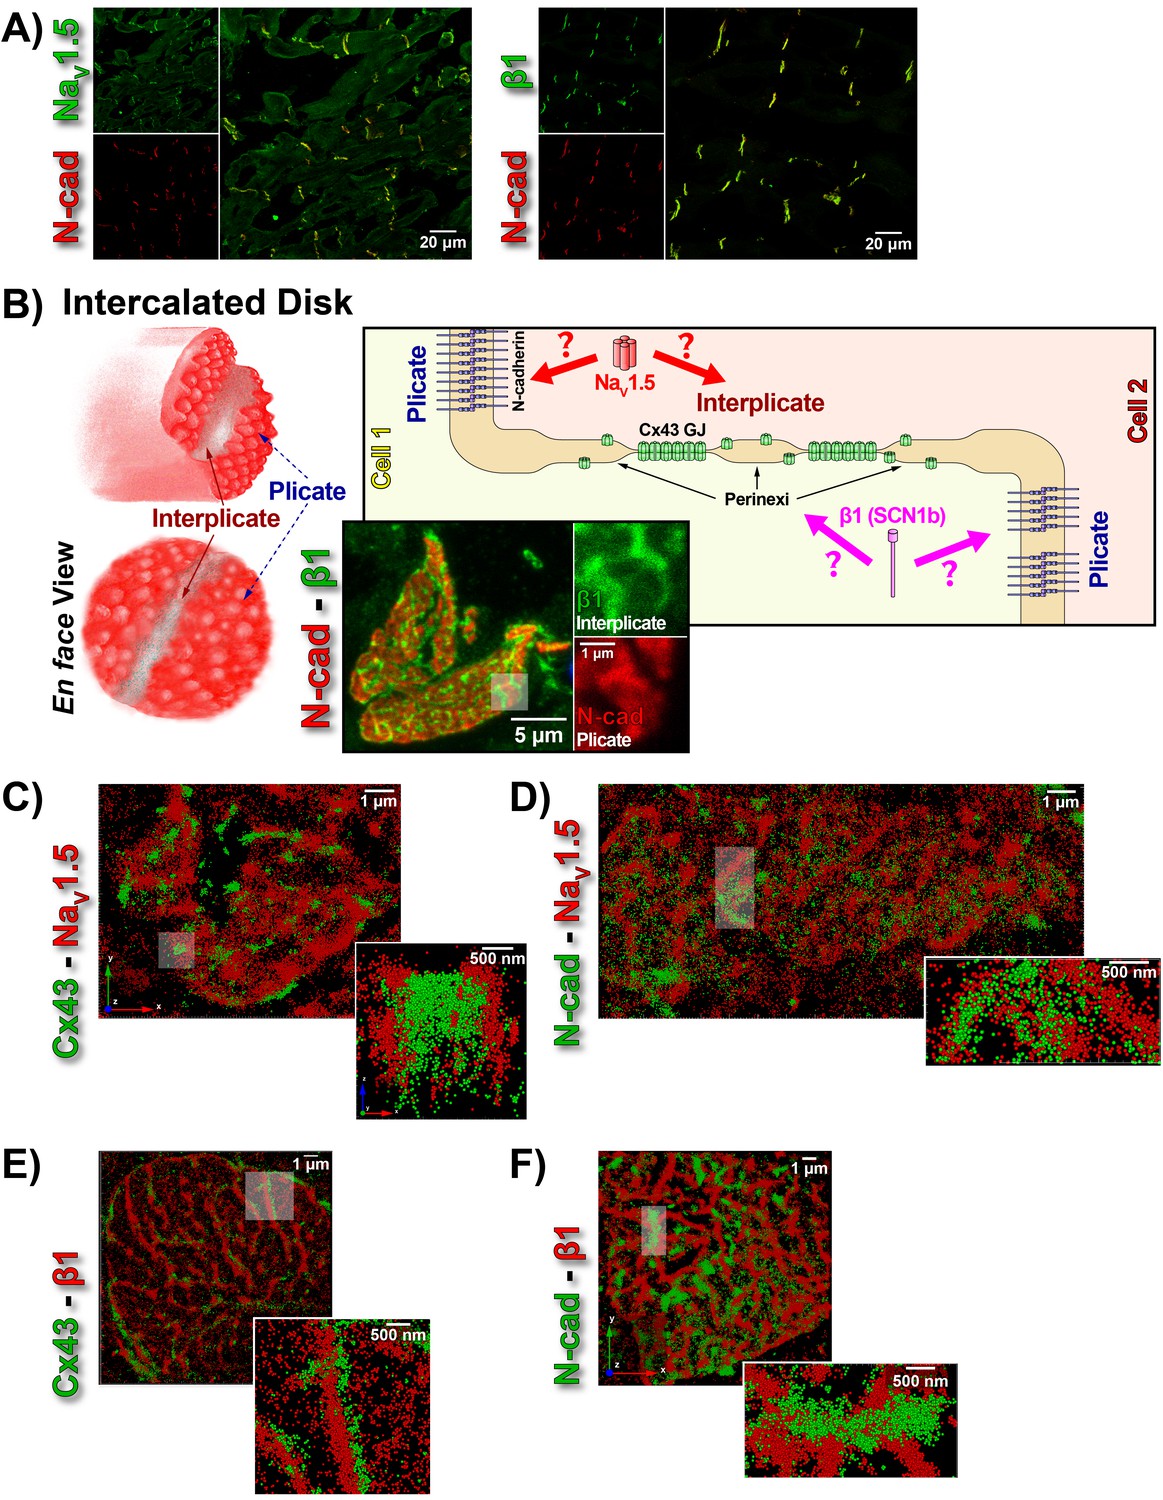
ID Localization of NaV1.5 and β1.
(A) Representative confocal images of GP left ventricular (LV) sections co-labeled for NaV1.5 (green; top) / β1 (green; bottom) along with N-cad (red). (B) Schematic diagrams, and representative confocal images of N-cad (red), and β1 (green) illustrate the plicate, and interplicate regions of the ID when viewed en face. The cartoon on the right summarizes the essential question addressed using STORM: Where within the ID are NaV1.5 and β1 localized? Representative STORM images showing x-y plane views of en face IDs labeled for: (C) Cx43 (green) and Nav1.5 (red), (D) N-cad (green) and NaV1.5 (red), (E) Cx43 (green) and β1 (red), (F) N-cad (green) and β1 (red). Individual fluorophore molecules localized were at 20 nm lateral resolution, but are represented as 50 nm spheres to enhance visibility in print. The inset in C is shown rotated by 90° along the z-axis, and illustrates a Cx43 cluster flanked on either side by a cluster of NaV1.5.
Figure 1—figure supplement 1

Validation of NaV1.5 and β1 antibodies.
Representative confocal images of GP LV sections labeled using the novel rabbit (A) anti-NaV1.5 and (B) β1 antibodies in the absence (left) and presence (right) of a peptide corresponding to the respective epitopes. Western immunoblots of whole cell lysates of GP LV tissue labeled with the novel (C) NaV1.5 and (D) β1 antibodies in the absence (left lanes) and presence (right lane) of peptides corresponding to the respective epitopes. Western immunoblots of β1 expression in (E) 1610 Parental and β1OX cells and (F) in membrane lysates from the brains of Scn1b/β1-null (β1 -/-) and WT (β1 +/+) littermate mice (three experimental replicates shown).
Figure 1—figure supplement 2
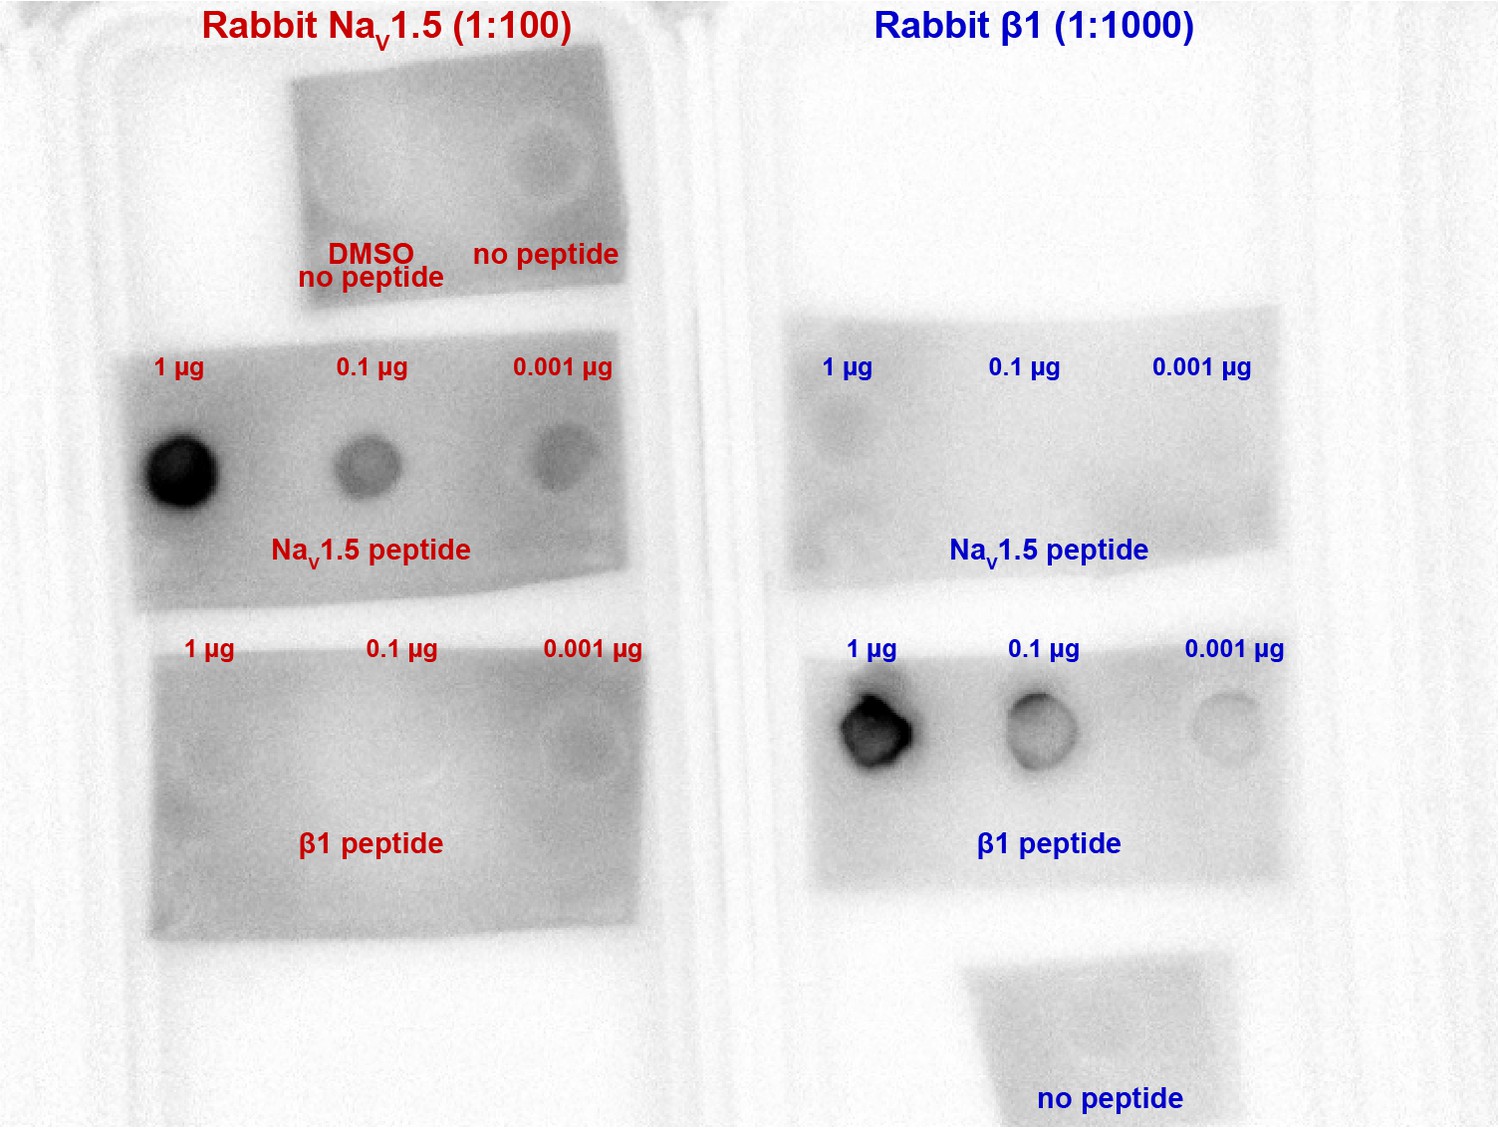
Validation of NaV1.5, β1 antibody specificity.
A dot blot experiment showing NaV1.5 and β1 antibody binding to specifically peptides corresponding to the epitopes against which they were raised. Both antibodies displayed selective affinity for their corresponding epitopes, with no evidence of cross-reactivity to each other’s epitopes.
Figure 1—figure supplement 3

ID localization of β1 via confocal immunofluorescence.
(A) A confocal image of a transmural section of GP LV labeled for β1 (green), Cx43 (red), and nuclei (blue).
Higher magnification images of en face IDs labeled for (B) β1 (green) along with Cx43 (red), and (C) β1 (green) along with N-cad (red) are also presented.
Figure 2
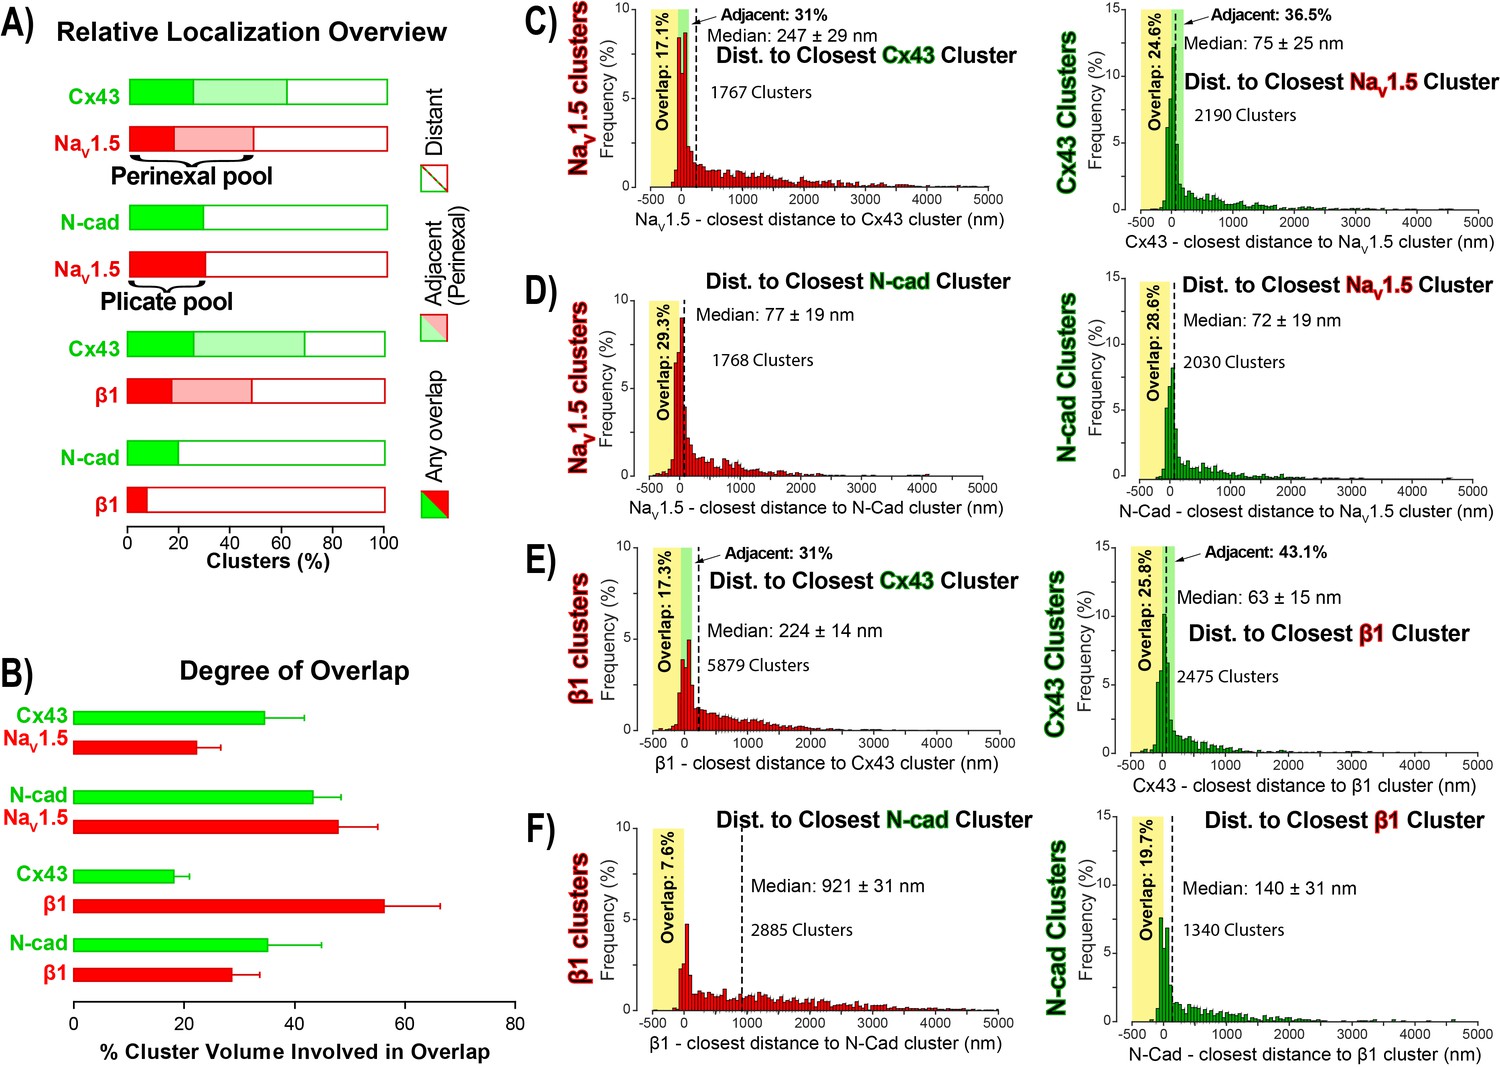
STORM-RLA quantification of NaV1.5 and β1 localization.
(A) A graph summarizing STORM-RLA analysis of relative localization between clusters of co-labeled proteins. The solid bars indicate clusters with any overlap, the shaded bars represent adjacent clusters (corresponding to perinexal localization), and the clear bars indicate clusters distant from each other. (B) A summary graph of the degree of overlap, that is the fraction of cluster volume involved in overlap for those clusters, which demonstrated any overlap (corresponding to the filled bars in A). (D–F) Summary histograms generated by STORM-RLA show the closest inter-cluster distances between clusters of co-labeled proteins (n = 3 hearts, four image volumes per heart). The yellow boxes on each plot highlight negative inter-cluster distances, which correspond to overlapping clusters. Dashed black lines mark the median values. The green boxes indicate overlap of NaV1.5/β1 clusters with perinexal regions surrounding Cx43 clusters (extending 200 nm from the GJ/Cx43 cluster edge [Veeraraghavan et al., 2015]).
Figure 3 with 2 supplements
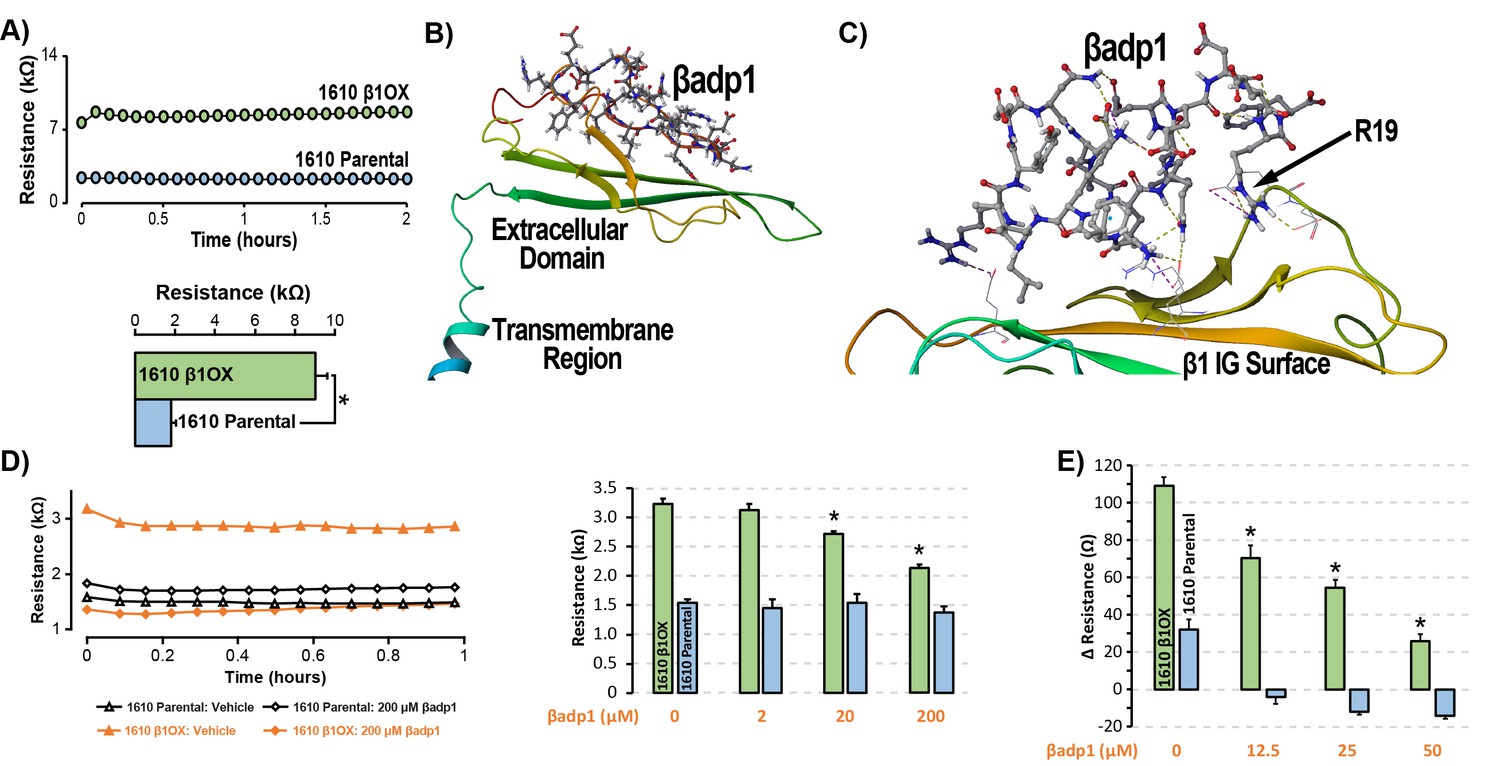
βadp1 – a novel inhibitor of β1-mediated adhesion.
(A) Representative traces (top) and summary plot (bottom) of intercellular junctional resistance measured by ECIS in 1610 β1OX, and 1610 Parental cells (five experimental replicates with two technical replicates per experiment; 4 × 10⁴ cells/well). (B) Homology model of the β1 ectodomain based on the β3 crystal structure, with the βadp1 sequence highlighted. (C) Docking of βadp1 with the β1 homology model in silico in a low-energy conformation with the adhesion surface of the β1 Ig loop. (D) Representative traces (left) and summary plot (right) demonstrating the effects of βadp1 on intercellular junctional resistance in 1610 β1OX and 1610 parental cells (five experimental replicates with two technical replicates per experiment, 104 cells/well, *p<0.05 by 2-factor ANOVA). (E) Effects of βadp1 on the formation of intercellular interactions between sub-confluent 1610 β1OX and 1610 Parental cells, quantified as the change in resistance over 24 hr following plating in the absence/presence of βadp1.
Figure 3—figure supplement 1
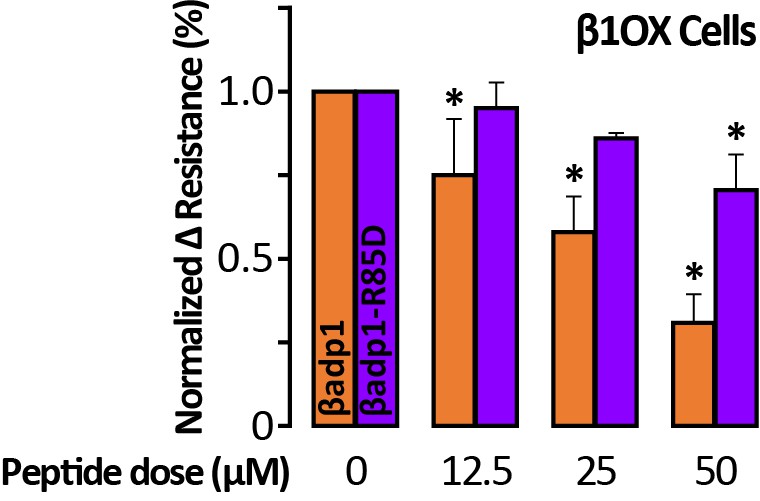
R85D mutation abrogates βadp1 effects on β1-mediated adhesion.
Effects of βadp1 and βadp1-R85D on the formation of intercellular interactions between sub-confluent 1610 β1OX cells forming into monolayers. The change in resistance over 24 hr from plating in the presence of peptide was normalized to the vehicle control measurement obtained simultaneously (*, p<0.05 vs. 0 µM βadp1).
Figure 3—figure supplement 2
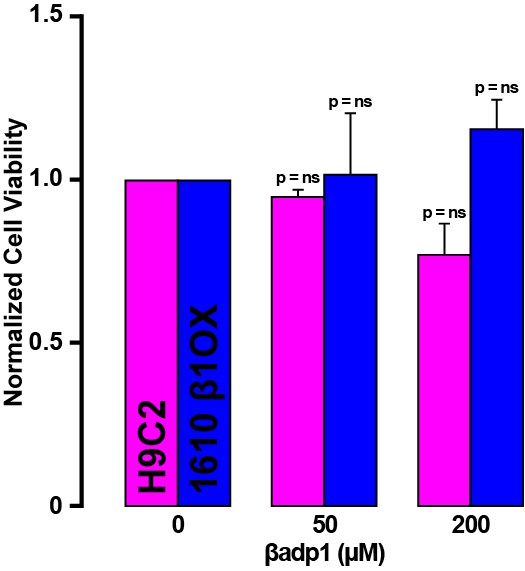
βadp1 effects on cell viability.
Normalized viability of rat myocardial (H9C2) cells and 1610 β1OX cells following 24 hr of treatment with βadp1.
Figure 4 with 1 supplement

Modulating β1-mediated adhesion.
(A) A representative confocal image from a GP LV perfused with biotinylated βadp1 (βadp1-b) shows Cx43 (green) and βadp1-b (red) immunosignals. (B) Representative TEM images of GJ and perinexi from hearts perfused with control Tyrode’s solution (top) and βadp1 (100 µM; bottom). (C) A summary plot of inter-membrane distance at perinexal (open bars) and non-junctional ID (hatched bars) from hearts perfused with vehicle (white), βadp1 (orange), or a scrambled version of βadp1 (βadp1-scr; gray) [n = 3 hearts/dose, *p<0.05 by 2-factor ANOVA].
Figure 4—figure supplement 1
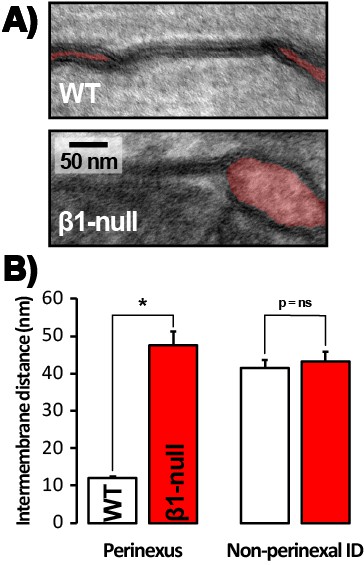
Perinexal ultrastructure in β1-null mice.
(A) Representative TEM images of GJ and perinexi (shaded in red), and (B) summary plots of intermembrane distance at perinexal and non-perinexal sites from WT, and β1-null littermate mice (*, p<0.05 vs. WT).
Figure 5

βadp1 effects on INa, APs.
(A) Representative INa traces from myocytes during vehicle control, or treatment with βadp1 or βadp1-scr. Current-voltage relationships during treatment with (B) 50, or (C) 100 µM peptides. (D) Summary plots of INa density. (E) Representative AP traces and (F) AP duration during peptide treatment. Number of cells measured indicated on bar graphs.
Figure 6 with 2 supplements
βadp1 effects on INa.
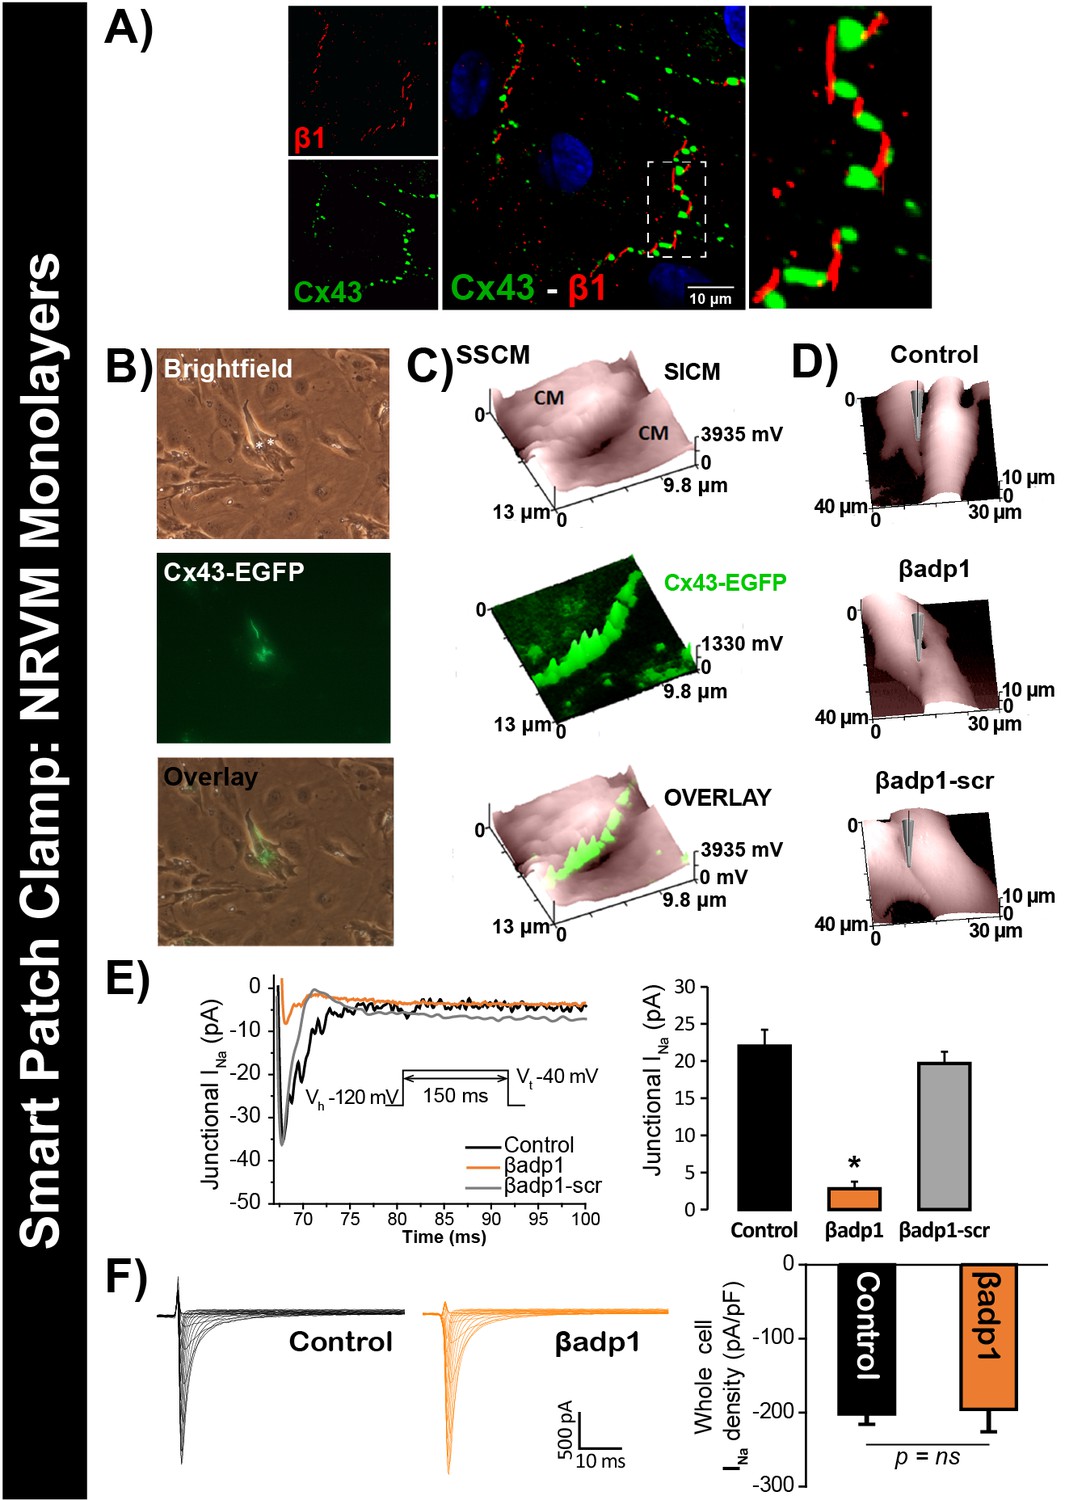
(A) Representative confocal image of NRVMs labeled for Cx43 (red) and β1 (green). (B) Paired brightfield and fluorescence images along with an overlay demonstrate Cx43-EGFP fluorescence at cell-to-cell contacts. (C) Paired images of cell surface (SICM) and Cx43-EGFP fluorescence (surface scanning confocal microscopy; SSCM) at a cell-to-cell contact site. (D) Representative SICM images of cell-to-cell contacts under control conditions and following 30 min of treatment with βadp1 or βadp1-scr (50 µM) illustrate sites where INa was measured using SPC. (E) Representative traces and summary plot of INa from Cx43-EGFP fluorescence-adjacent junctional sites (Control: n = 12, βadp1: n = 8, βadp1-scr: n = 6; *p<0.05 vs control). (F) Representative traces and summary plot of whole-cell INa density (n = 6/ group).
Figure 6—figure supplement 1
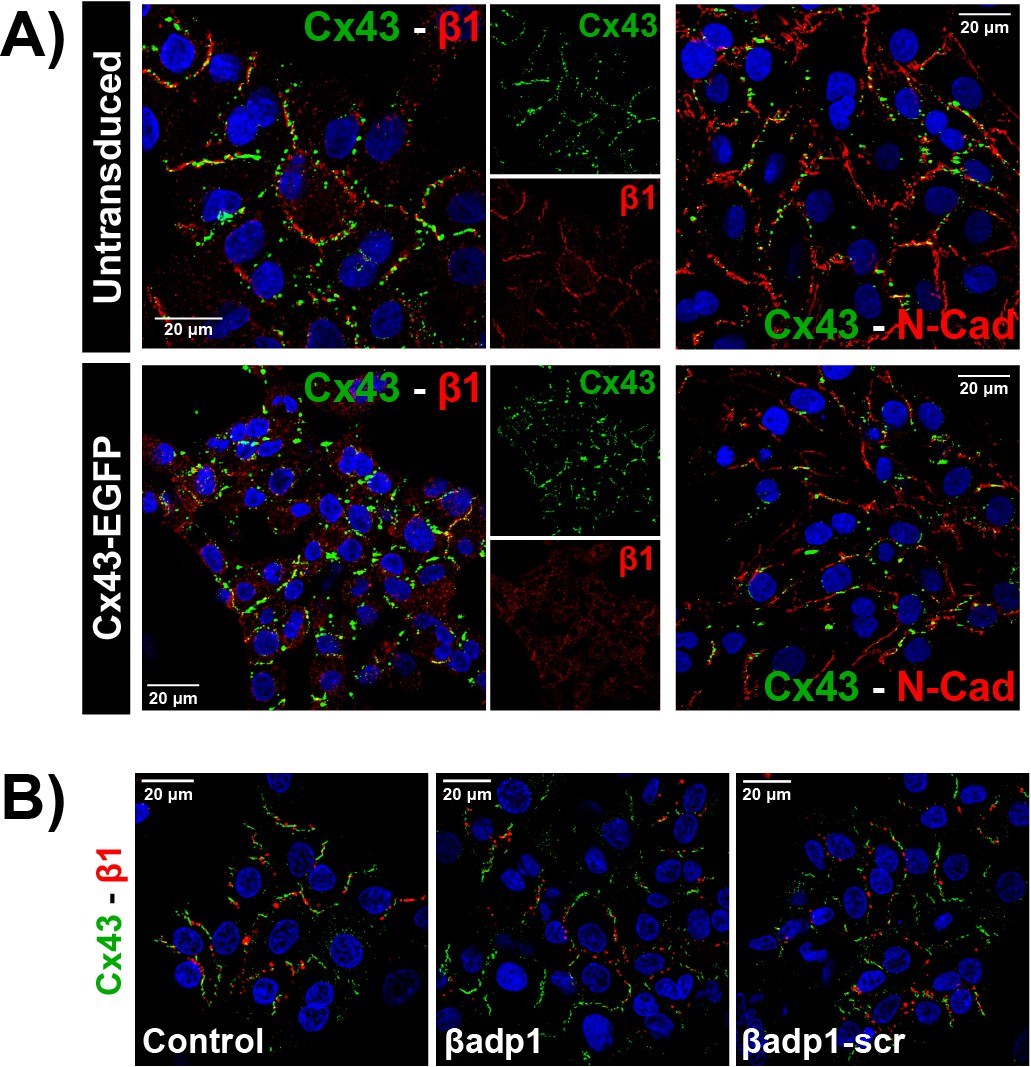
β1 expression in NRVMs.
(A) Confocal images of Cx43 (green) along with β1 (red; left) or N-Cad (red; right) and nuclei (blue) in untransduced and Cx43-EGFP-expressing NRVMs. (B) Confocal images of Cx43 (green), β1 (red), and nuclei (blue) in NRVMs under control conditions and following 30 min of treatment with βadp1 or βadp1-scr (50 µM).
Figure 6—figure supplement 2
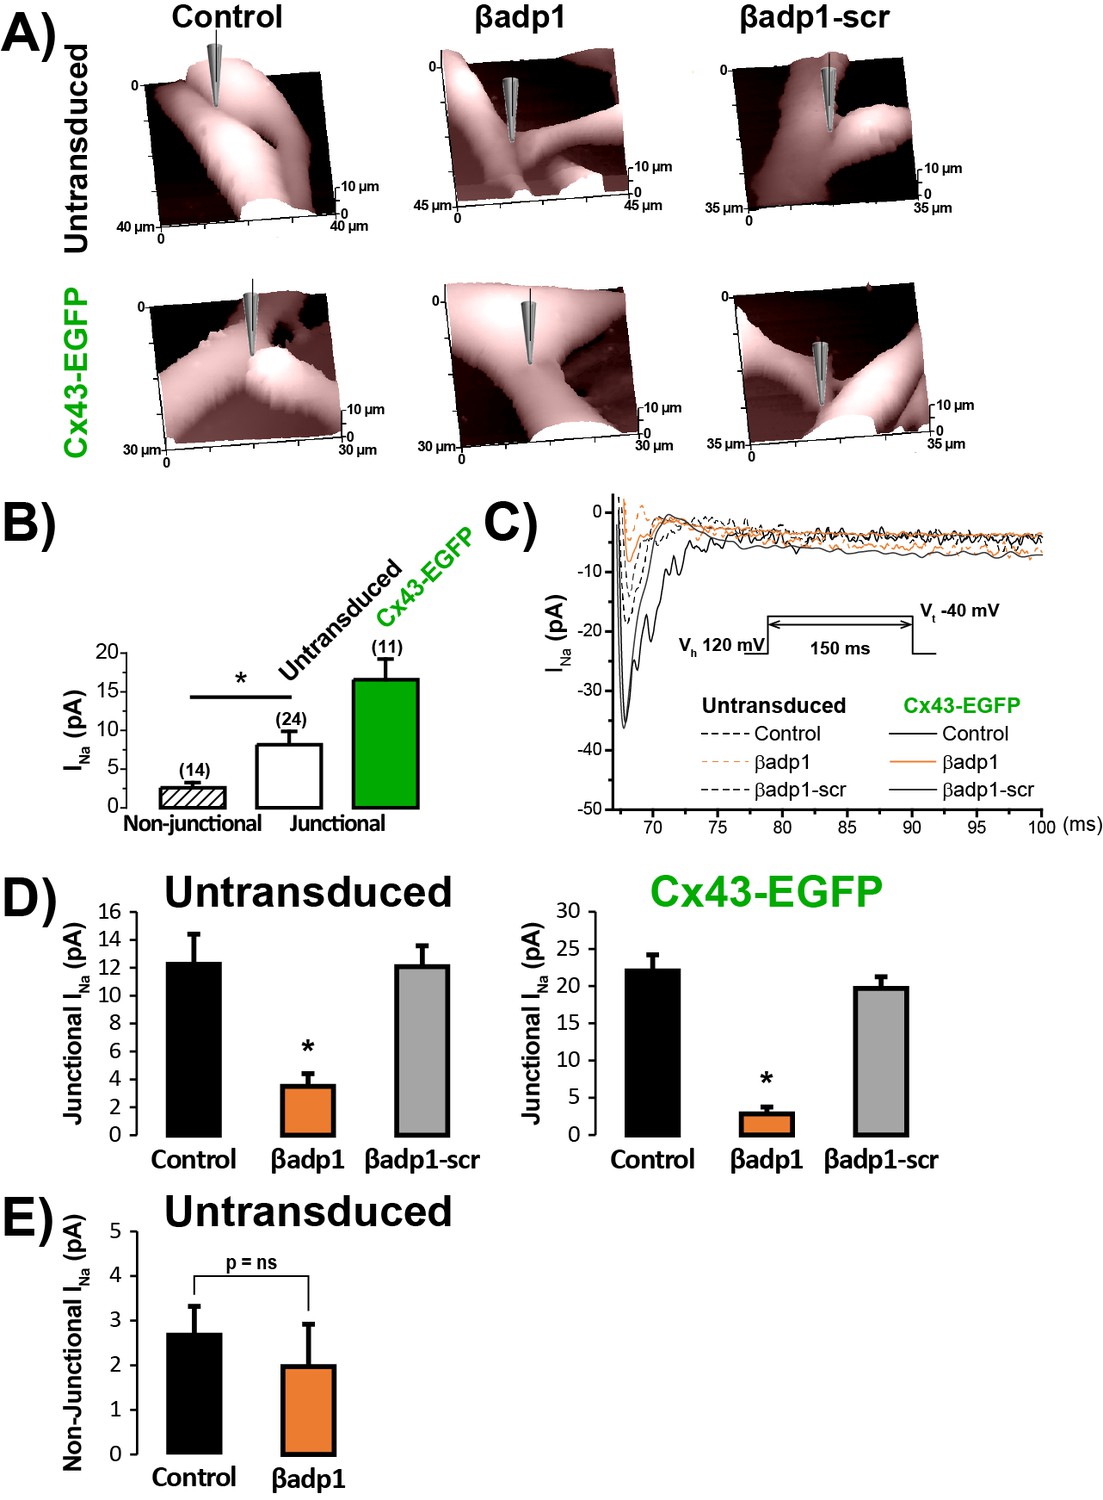
βadp1 effects on INa at cell-to-cell contacts.
(A) Representative SICM images of the surface of untransduced and Cx43-EGFP expressing NRVMs showing cell-to-cell contact sites under control conditions and following 60 min of treatment with βadp1 or βadp1-scr (50 µM). (B) Local INa density at junctional (solid bars) and non-junctional (hashed bar) sites (n’s indicated in parentheses above bars; *p<0.05 vs. non-junctional). (C) Representative traces of local INa at junctional sites under control conditions and following peptide treatment. (D) Summary plots of junctional INa density under control conditions and following peptide treatment (Untransduced: Control: n = 12, βadp1: n = 9, βadp1-scr: n = 6; Cx43-EGFP: Control: n = 12, βadp1: n = 8, βadp1-scr: n = 6; *p<0.05 vs. control). (E) Summary plot of non-junctional INa density under control conditions and following peptide treatment (Control: n = 15, βadp1: n = 12, p=ns vs. Control).
Figure 7 with 2 supplements
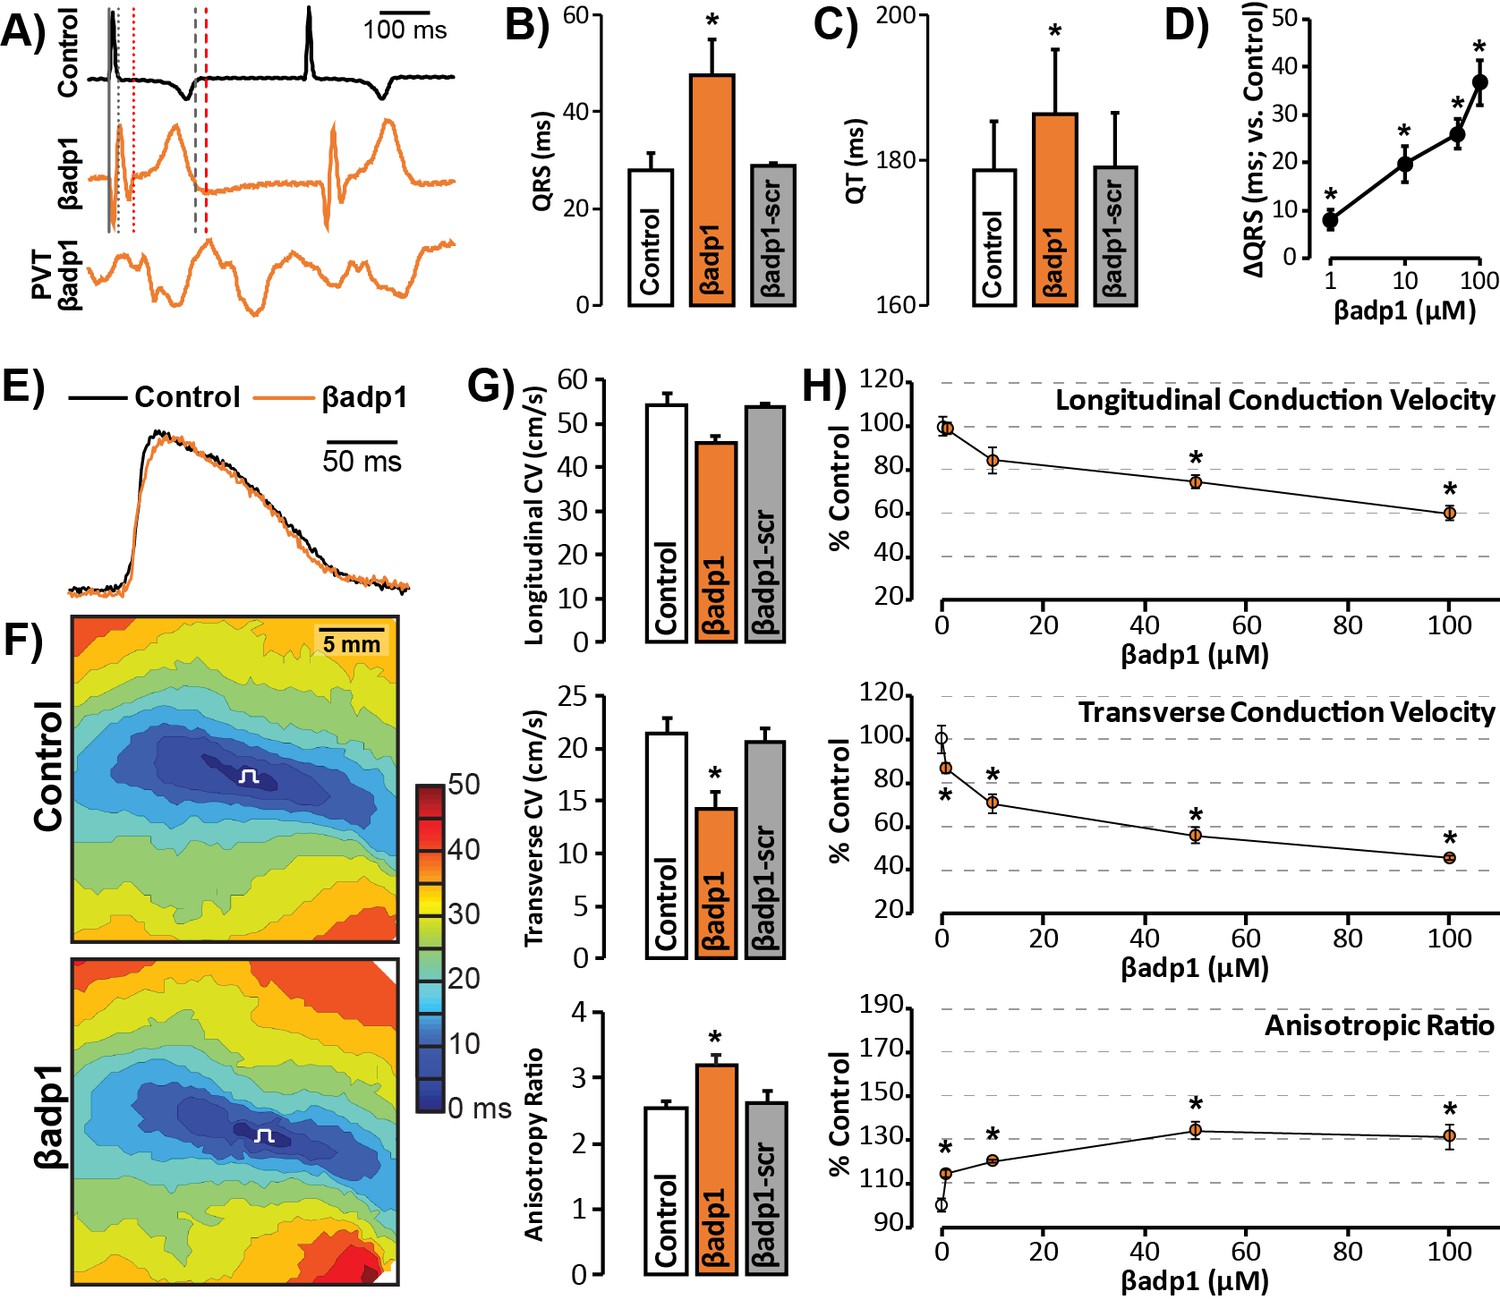
βadp1 effects on cardiac electrophysiology.
(A) Representative traces of volume-conducted ECGs from GP ventricles during control (black) and βadp1 (10 µM; orange) perfusion. The solid gray vertical line marks the start of the QRS in both traces while gray and red dotted lines mark the end of the QRS in the control and βadp1 traces, respectively. Likewise, gray and red dashed lines mark the ends of the T wave in the control and βadp1 traces, respectively. The bottom orange trace shows an example of a polymorphic ventricular tachycardia (PVT) observed during βadp1 perfusion. Summary plots of (B) QRS duration and (C) QT interval during control, βadp1 (10 µM) and βadp1-scr (10 µM) perfusion (*p<0.05 vs. control). (D) Summary plot of QRS prolongation relative to control induced by different doses of βadp1 (*p<0.05 vs. control). Representative optical (E) APs and (F) isochrone maps of activation during unipolar epicardial pacing during control and βadp1 treatment (10 µM). The white symbols indicate the sites of pacing. (G) Summary plots of longitudinal conduction velocity (CVL; top), transverse conduction velocity (CVT; middle) and anisotropy ratio (AR; bottom) during control (white), βadp1 (10 µM; orange) and βadp1-scr (10 µM; gray) perfusion (*p<0.05 vs. control). (H) Summary plots of normalized CVL (top), CVT (middle) and AR (bottom) at different doses of βadp1 during pacing at 300 ms cycle length (n = 3 per dose per treatment, *p<0.05 by 2-factor ANOVA).
Figure 7—figure supplement 1
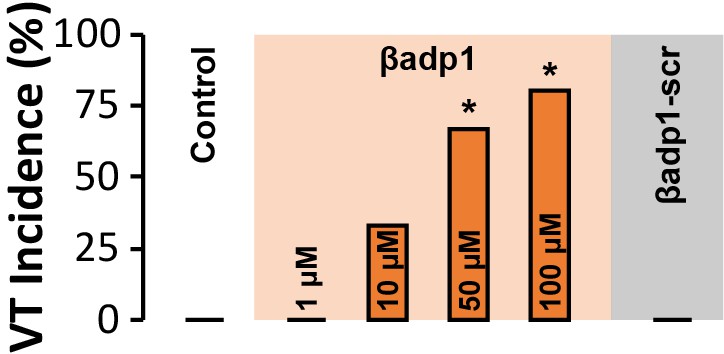
VT Incidence.
Spontaneous VT incidence in GP ventricles under control conditions and in the presence of βadp1 (doses indicated on graph) or βadp1-scr (10 µM) [n = 3 hearts/dose/ treatment; *p<0.05 vs. control].
Figure 7—figure supplement 2
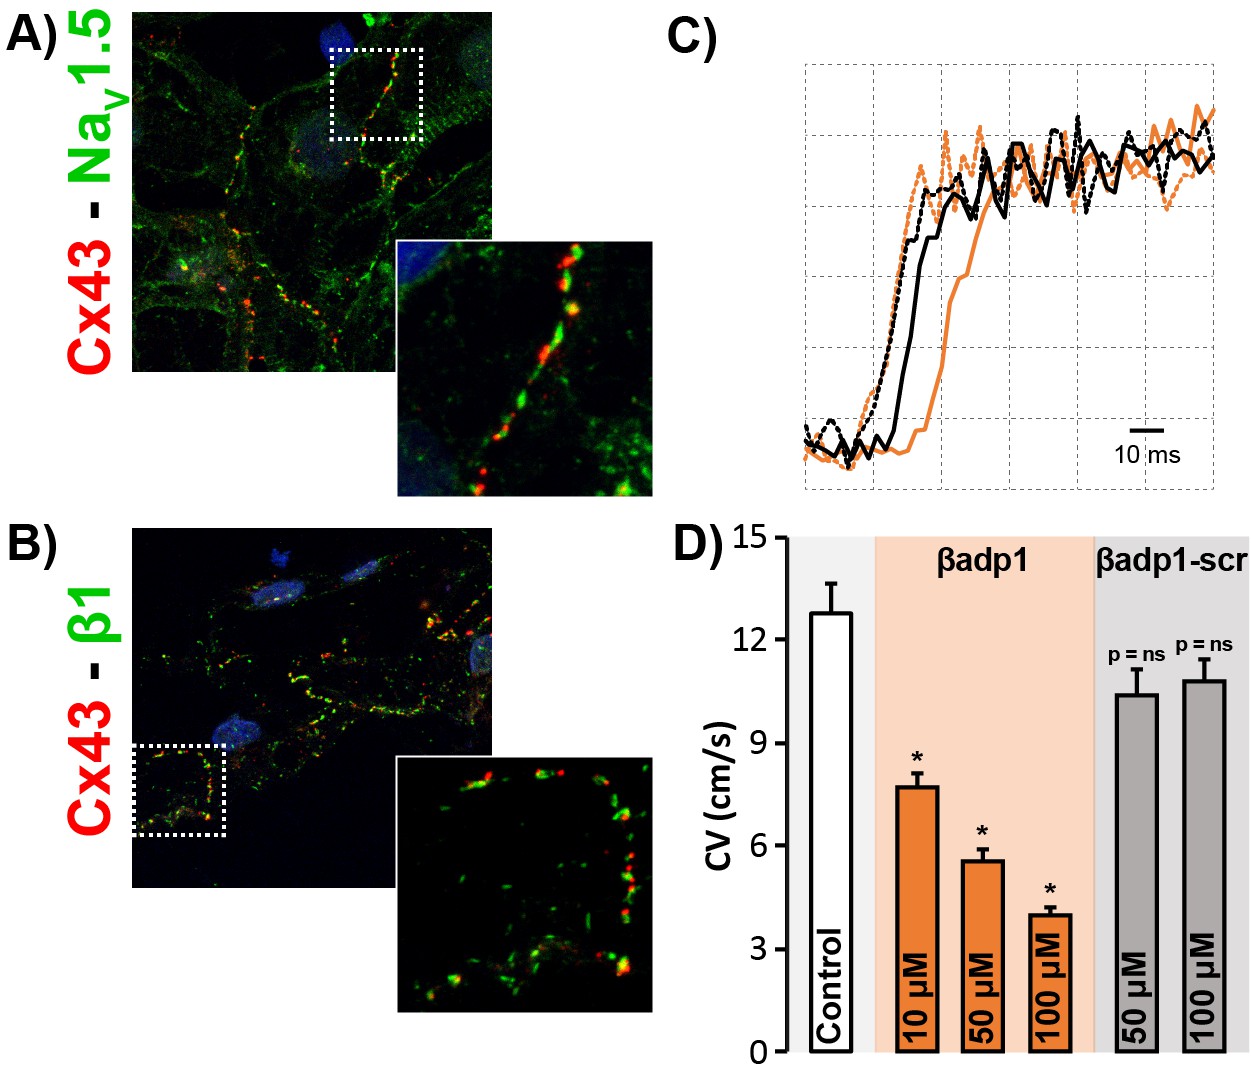
βadp1 effects on conduction in iPSC-CMs.
Confocal images of Cx43 (red) co-labeled with (A) NaV1.5 (green) and (B) β1 (green) in monolayers of iPSC-CMs. Insets show higher magnification views of regions highlighted by the dashed white boxes. (C) Optical AP upstrokes from equally spaced sites in the absence (black) and presence (orange) of βadp1. The earlier upstrokes from the two conditions are temporally aligned to illustrate differences in activation delay over an equal distance. (D) Summary plot of CV during control and following treatment with βadp1 or βadp1-scr (three experimental replicates with two technical replicates per experiment; *p<0.05 vs. control).
Figure 8

Schematic diagram of the cardiac ephapse.
Top. A schematic diagram illustrating the organization of NaV1.5, β1, Cx43 and N-cad to different ID nanodomains. Note that plicate (fascia adherens/area composita) and interplicate (GJ, perinexus) regions of the ID are displayed side-by-side for convenience of representation, although they are, in reality, oriented along perpendicular axes. Bottom left. Illustration of an intact perinexus with close membrane apposition displayed with an ECG trace of intrinsic activity and illustration of normal intrinsic activation sequence represented on a diagram of the heart. The earliest sites of activation are represented in blue, and the latest in red as illustrated by the color bar. Bottom right. Illustration of a widened perinexus resulting from βadp1 inhibition of β1-mediated adhesion with an ECG trace of a resulting PVT and illustration of arrhythmic activation sequence represented on a diagram of the heart.
Additional files
-
Transparent reporting form
- https://doi.org/10.7554/eLife.37610.020
Download links
A two-part list of links to download the article, or parts of the article, in various formats.
Downloads (link to download the article as PDF)
Open citations (links to open the citations from this article in various online reference manager services)
Cite this article (links to download the citations from this article in formats compatible with various reference manager tools)
The adhesion function of the sodium channel beta subunit (β1) contributes to cardiac action potential propagation
eLife 7:e37610.
https://doi.org/10.7554/eLife.37610


