E-cadherin binds to desmoglein to facilitate desmosome assembly
- Iowa State University, United States
- Center for Molecular Medicine Cologne, University of Cologne, Germany
- Emory University School of Medicine, United States
Figures
Figure 1
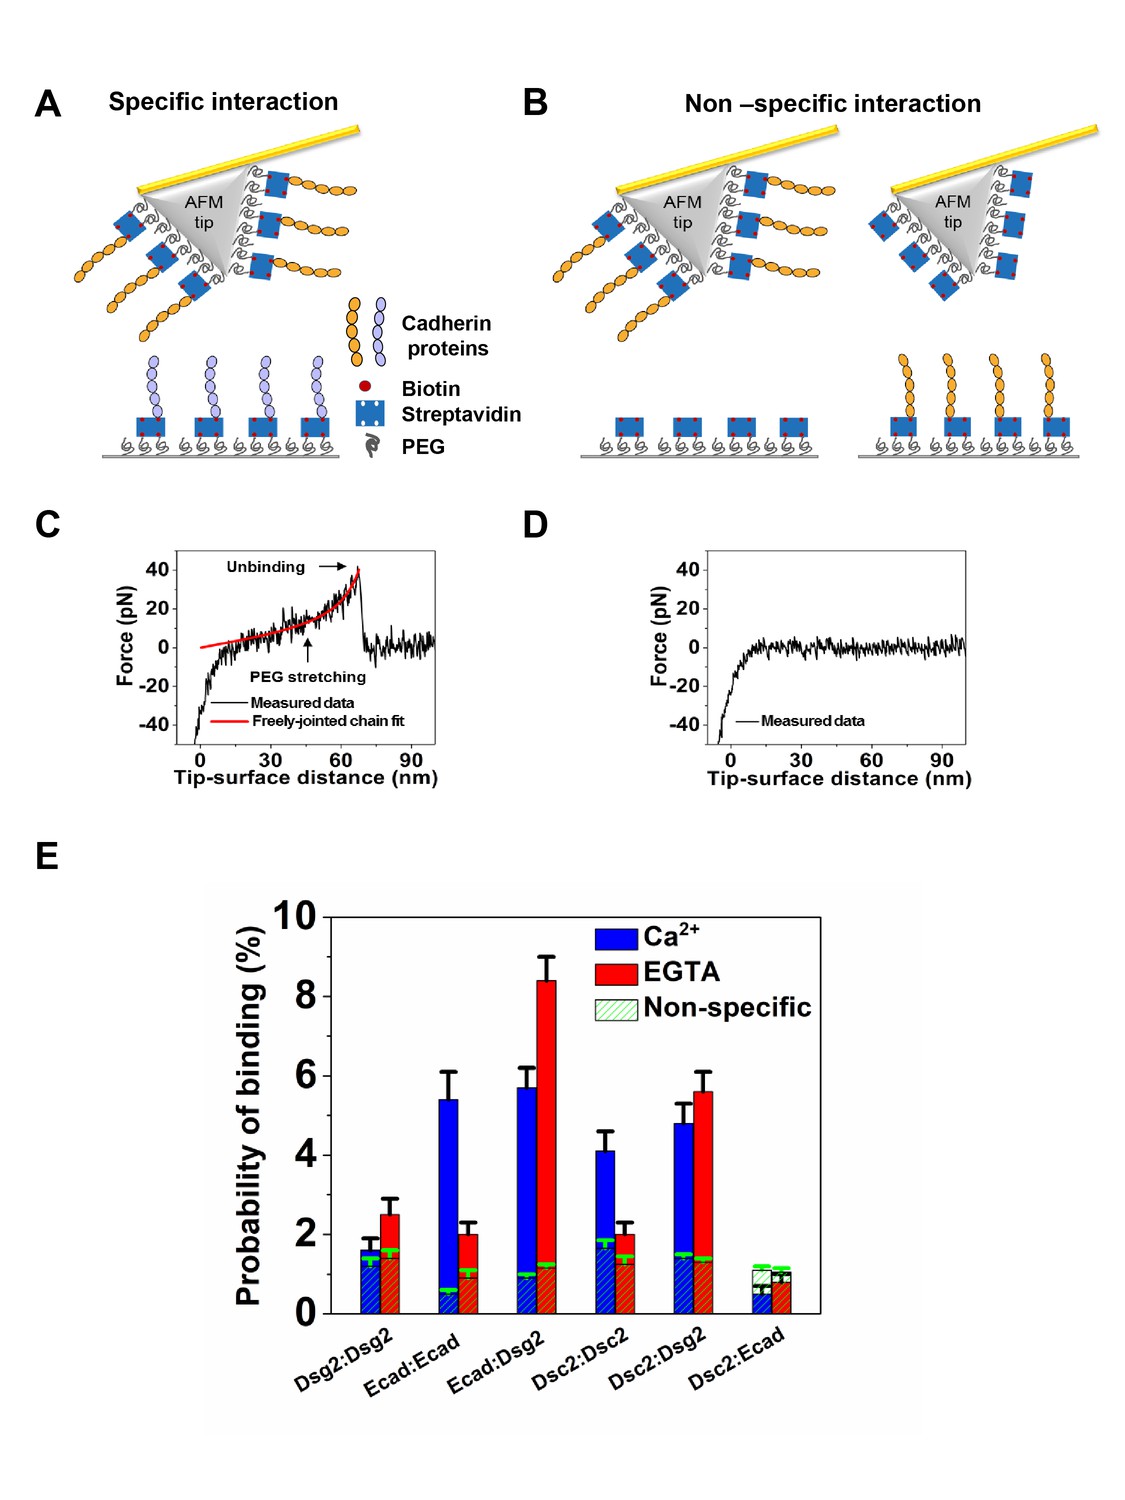
Ecad interacts with Dsg2 to form Ca2+-independent dimers.
(A) Schematic of specific interaction experiment. The AFM tip and substrate were functionalized with PEG linkers some of which were decorated with streptavidins. Biotinylated cadherin proteins were attached to streptavidin. (B) Schematic of nonspecific interaction experiment. The probability of interactions between the AFM tip functionalized with biotinylated cadherin proteins and the substrate lacking cadherins (left) and the binding probability of an AFM cantilever lacking cadherin and a substrate decorated with cadherins (right) was measured. Example force versus tip-surface distance traces showing (C) a single unbinding event with signature PEG stretching and (D) no interaction. (E) Specific binding probabilities for different combination of cadherins on the tip and substrate measured in Ca2+ (blue) and in EGTA (red), a Ca2+ chelator. Non-specific binding levels (hatched green) were determined from the average of measured binding probabilities between a cadherin functionalized AFM tip and a surface lacking cadherin and between an AFM tip lacking cadherin and surface functionalized with biotinylated cadherin proteins. Dsg2/Dsg2 data was from a total of 1666 (Ca2+) and 1849 (EGTA) measurements; Ecad/Ecad data was from a total of 1052 (Ca2+) and 2150 (EGTA) measurements; Ecad/Dsg2 data was from a total of 2215 (Ca2+) and 2051 (EGTA) measurements; Dsc2/Dsc2 data was from a total of 1658 (Ca2+) and 2025 (EGTA) measurements; Dsc2/Dsg2 data was from a total of 1850 (Ca2+) and 2025 (EGTA) measurements; Dsc2/Ecad data was from a total of 2122 (Ca2+) and 2098 (EGTA) measurements. Error bars are s.e. calculated using bootstrap with replacement.
Figure 2
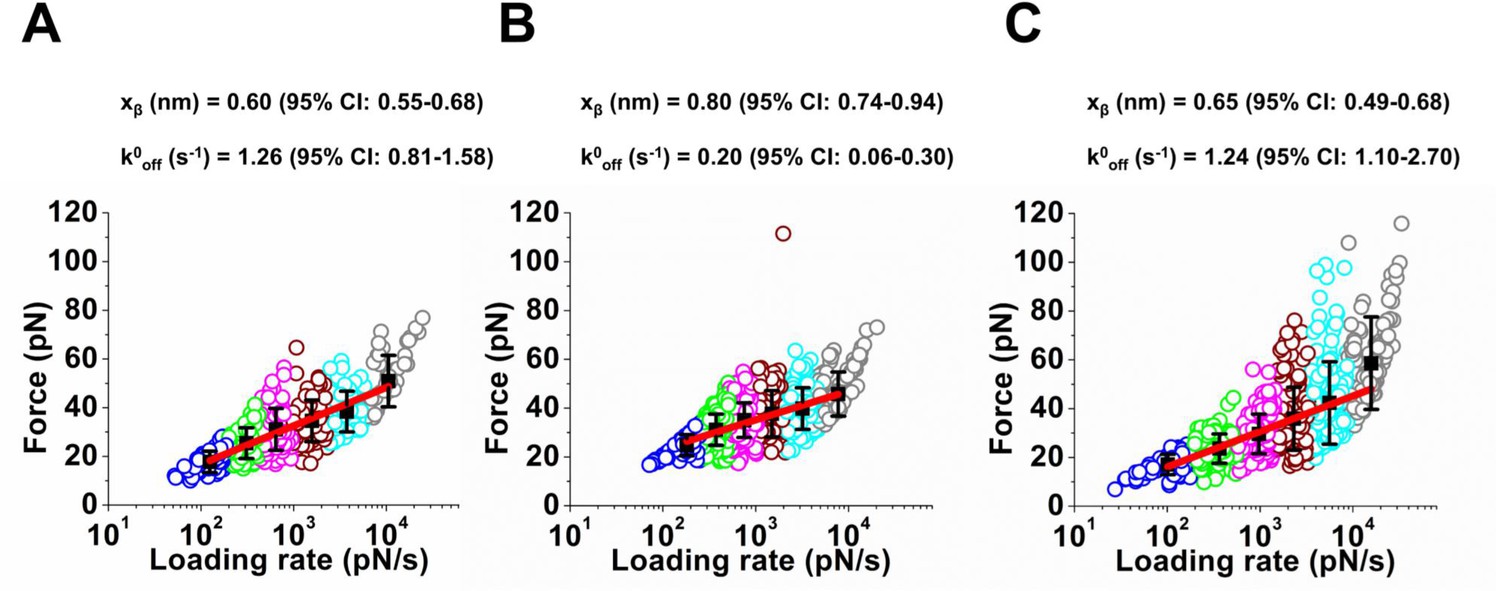
Lifetimes of the Ecad/Dsg2 dimer and the Dsc2/Dsc2 dimer are shorter than the lifetime of the Dsg2/Dsc2 complex.
Loading rates of the rupture events measured in Ca2+ at six different pulling velocities were grouped using K-means clustering method. Each clustered loading rate is shown by a different color, with each circle represent a single rupture event. The mean force and mean loading rates (black filled squares) for the groups were fit to Bell-Evans model (red line) using a nonlinear least-squares fitting with bisquare weights. Fits yielded the intrinsic off-rate (k0off) and the width of the transition energy barrier (xβ). Error bars in force correspond to standard deviation. 95% confidence interval (CI) was calculated using bootstrap with replacement. Analysis shown for (A) Dsc2/Dsc2 (B) Dsc2/Dsg2 and (C) Ecad/Dsg2. The data shown in panels A, B and C correspond to 415 events, 988 events, and 725 events respectively.
Figure 3 with 1 supplement

Ecad and Dsg2 are both localized in nascent desmosomes.
(A) Analysis of cadherin localization within desmosomes. Structured illumination microscopy (SIM) is able to resolve the distance from plaque to plaque when desmosomes are stained with a C-terminal DP antibody and an N-terminal cadherin antibody, as shown in the example SIM image (Figure 3A). Desmosomes were defined by regions of parallel DP staining, or ‘railroad tracks’. DP (green) and cadherin (either Ecad or Dsg2, red) fluorescence intensity were measured within the desmosome region of interest (black rectangle). (B) Representative images of desmosomal regions in human keratinocytes cultured in high Ca2+ media for 1, 3 or 18 hr as indicated. Images are oriented with cell border horizontal. Scale bar, 0.5 µm. (C) Quantification of cadherin (Ecad or Dsg2) levels relative to DP in desmosomes at different time points after initiation of desmosome assembly with high Ca2+ culture conditions. AU, arbitrary units. Means ± SE, n = 25 desmosomes, *p<0.05.
Figure 3—figure supplement 1
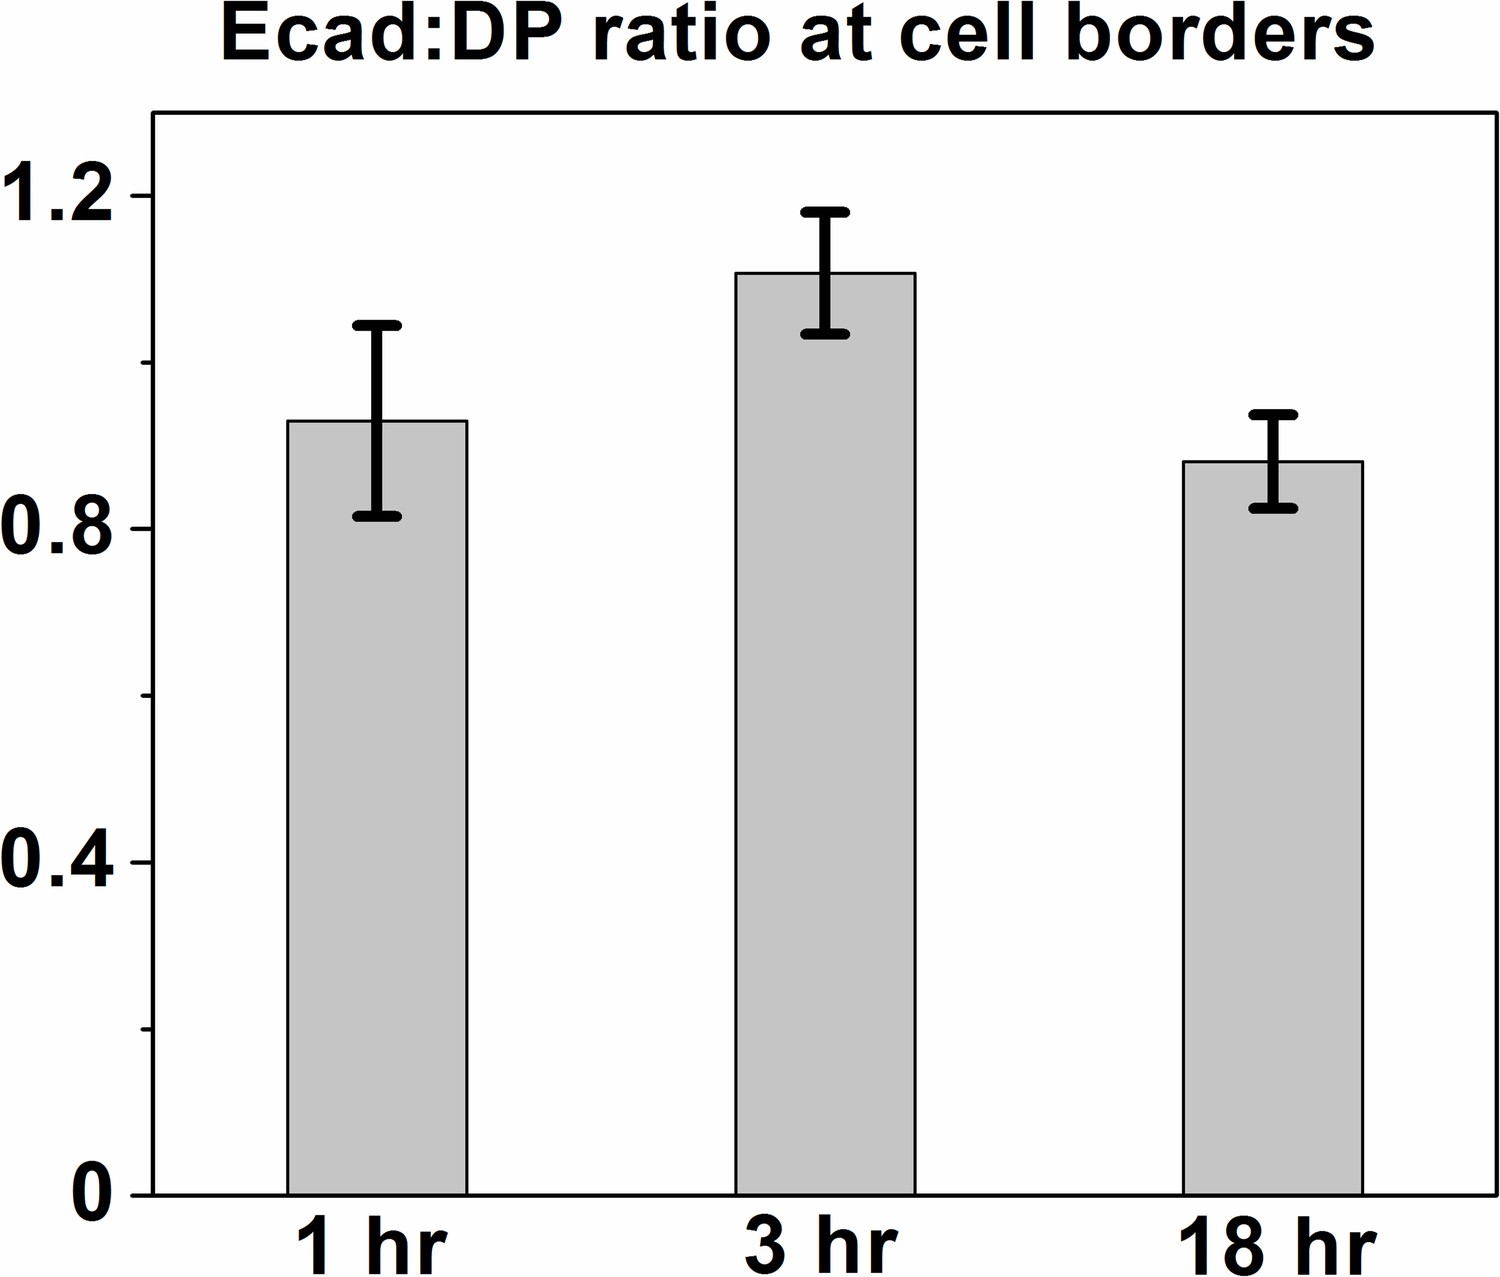
Relative Ecad levels remain unchanged over a calcium switch time-course.
Quantification of Ecad:DP ratio at cell borders. Entire cell border regions (in contrast to individual desmosomes as for Figure 3) were selected using the polygon selection tool in Fiji and the mean intensity of Ecad was normalized to the mean intensity of DP within the border region of interest (defined by cadherin and DP presence) for the time points indicated. n = 17, 19 and 12 respectively. P>0.05 with Kruskal–Wallis, Dunn’s post hoc test. A nonparametric test was used as data did not pass D’Agostino–Pearson omnibus normality test.
Figure 4
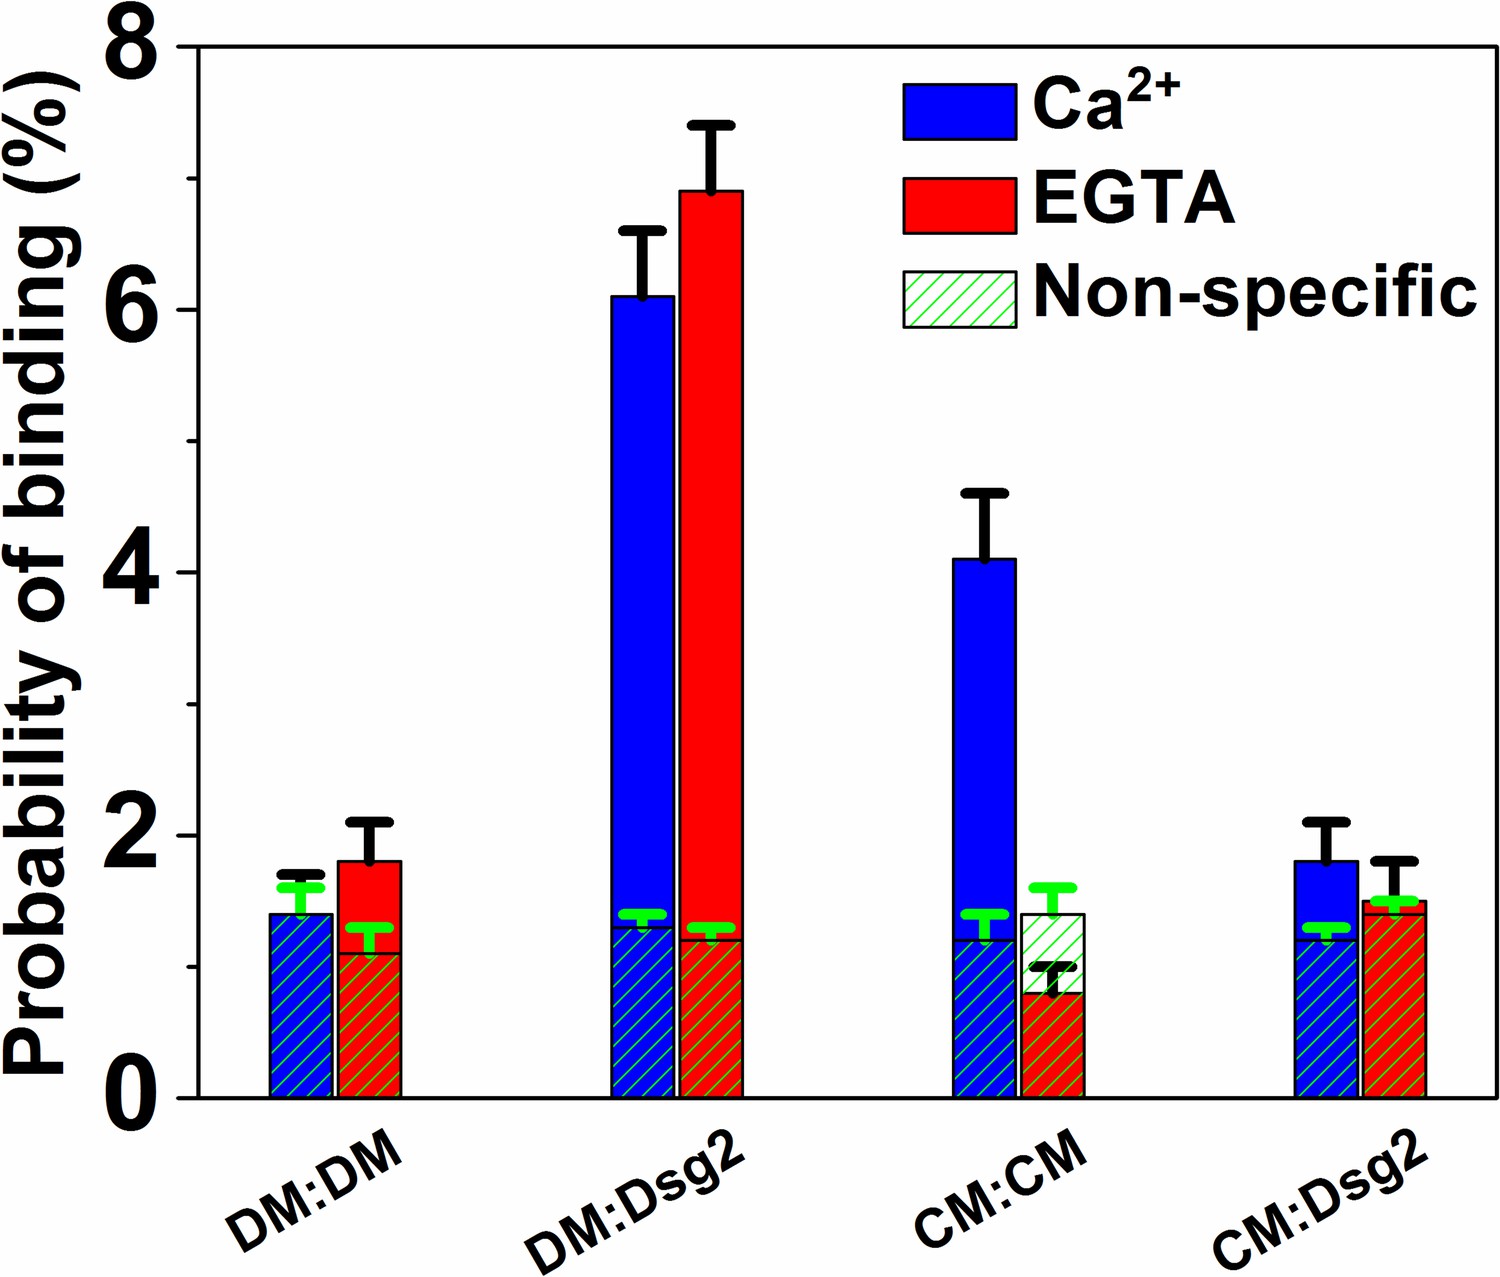
Ecad interacts with Dsg2 via Leu 175.
Homophilic binding probability of Ecad W2A-K14E double mutant (DM); heterophilic binding probability of DM and Dsg2; homophilic binding probability of Ecad L175D cis dimer mutant (CM); and the heterophilic binding probability of CM and Dsg2 was measured in Ca2+ (blue) and in EGTA (red). Nonspecific binding probabilities determined from the average of measured binding probabilities between a cadherin functionalized AFM tip and a surface lacking cadherin and between an AFM tip lacking cadherin and surface functionalized with biotinylated cadherins are shown in shaded green. DM/DM data was from a total of 1898 (Ca2+) and 2122 (EGTA) measurements; DM/Dsg2 data was from a total of 2150 (Ca2+) and 2009 (EGTA) measurements; CM/CM data was from a total of 1970 (Ca2+) and 1906 (EGTA) measurements; CM/Dsg2 data was from a total of 2027 (Ca2+) and 2122 (EGTA) measurements. Error bars are s.e. calculated using bootstrap with replacement.
Figure 5 with 1 supplement

Ecad-L175 promotes desmosome assembly in cells.
(A) Immunofluorescence analysis for transfected WT or mutant Ecad (myc) and Dsg2, 6 hr after allowing de novo junction formation in EcadKO/PcadKD keratinocytes. Note decreased localization of Dsg2 at intercellular contacts formed by Ecad-L175D. (B) Quantification of adherens junction (AJ) formation at intercellular contacts, judged by zipper-like enrichment of Ecad constructs. (C) Quantification of Dsg2 recruitment to AJ formed by WT or mutant Ecad. (D) Immunofluorescence analysis for transfected WT or mutant Ecad (myc) and desmoplakin (DP), 6 hr after allowing de novo junction formation in EcadKO/PcadKD keratinocytes. Note decreased localization of DP at intercellular contacts formed by Ecad-L175D. (E) Quantification of DP recruitment to AJ formed by WT or mutant Ecad. Numbers of quantified junctions (interface of two contacting, transfected cells) are shown above each bar and are derived from at least three independent experiments. Scale bar: 10 µm.
Figure 5—figure supplement 1
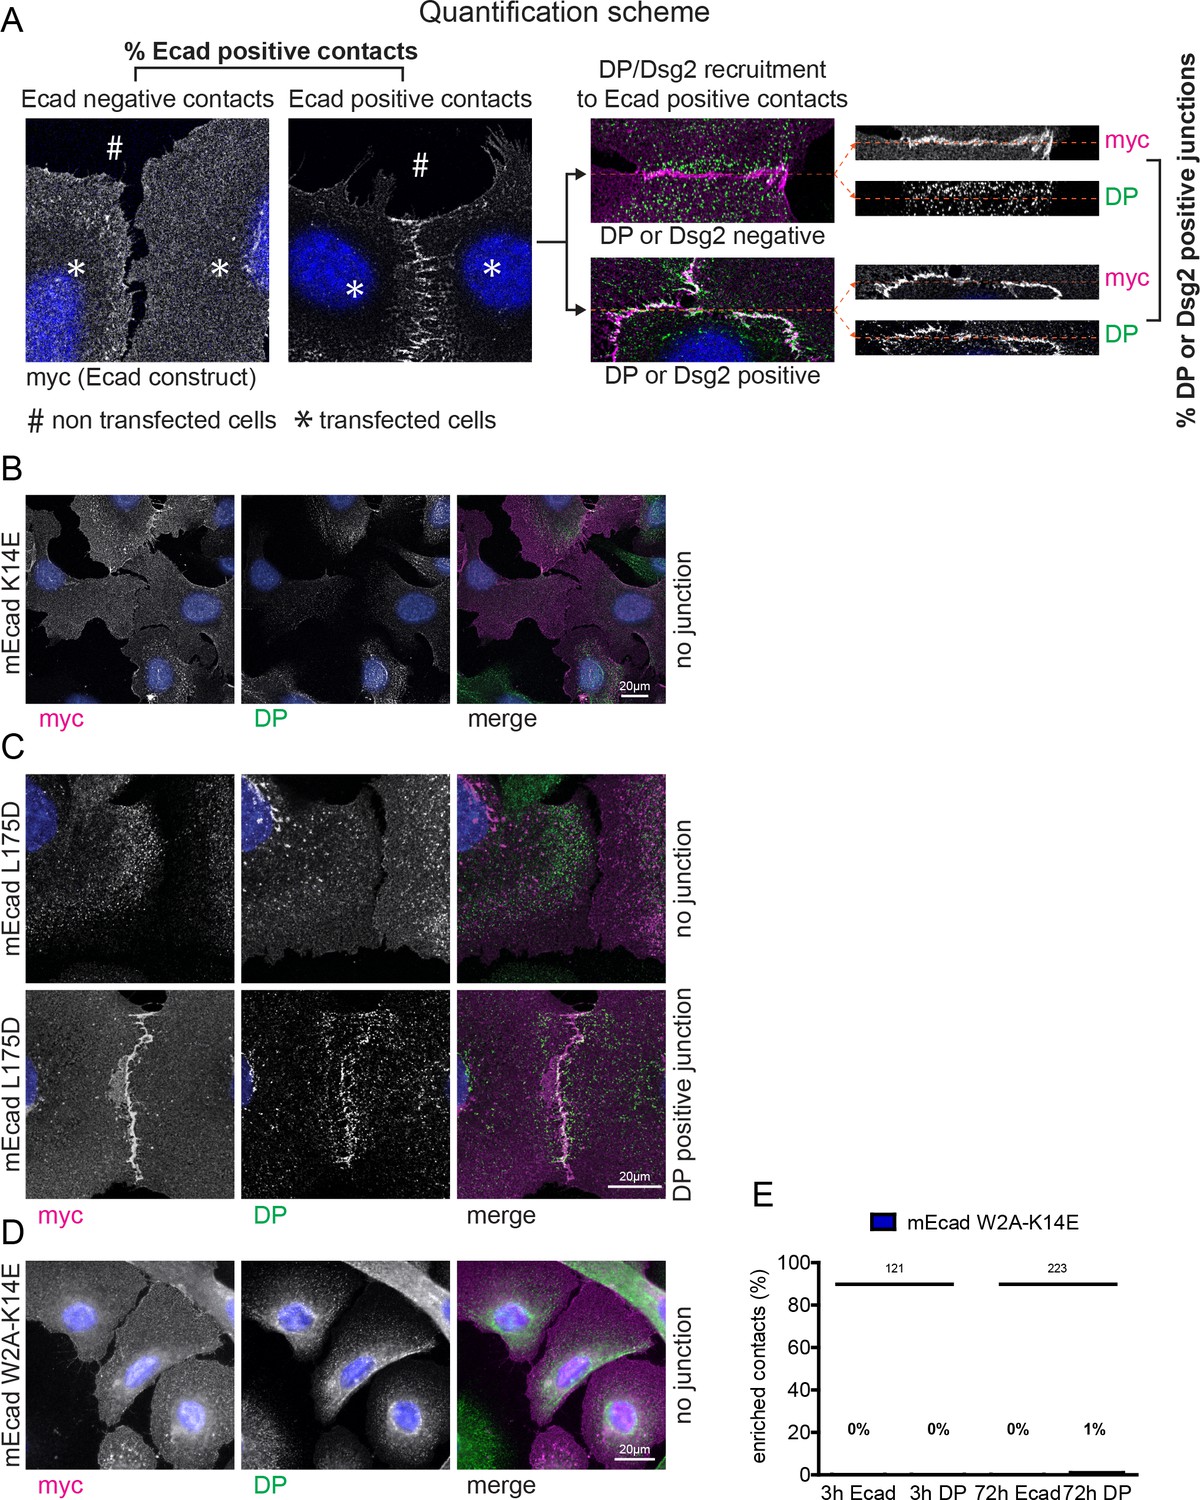
Impaired junction formation in Ecad-K14E, Ecad-L175D, and Ecad-W2A/K14E (DM) mutants.
(A) Representation of the quantification criteria and junctional categories that were used in the analysis. Examples of cells transfected with Ecad mutant that do not (left panel) or do (right panel) show intercellular AJ formation. For Dsg2 or DP recruitment, only those intercellular interfaces were quantified in which AJ zippers were observed. Shown in the insets are examples of an AJ positive contact that is either also positive for DP or negative for DP. (B–D) Immunofluorescence analysis for transfected Ecad-K14E, Ecad-L175D, Ecad-DM, and desmoplakin (DP), 6 hr after de novo junction formation in EcadKO/PcadKD keratinocytes. (B) Example for Ecad-K14E transfected contacting cells that do not form strand-swap dimer mediated AJ zippers. (C) Upper panel: example for Ecad-L175D transfected contacting cells that do not form AJ zippers. Lower panel: example for Ecad L175D mediated AJ zippers that were counted as DP positive. (D) Example for Ecad-DM transfected contacting cells that do not form AJ zippers. (E) Quantification of AJ formation and DP recruitment at intercellular contacts of DM transfected cells. Numbers of quantified junctions (interface of two contacting, transfected cells) are shown above each bar.
Figure 6
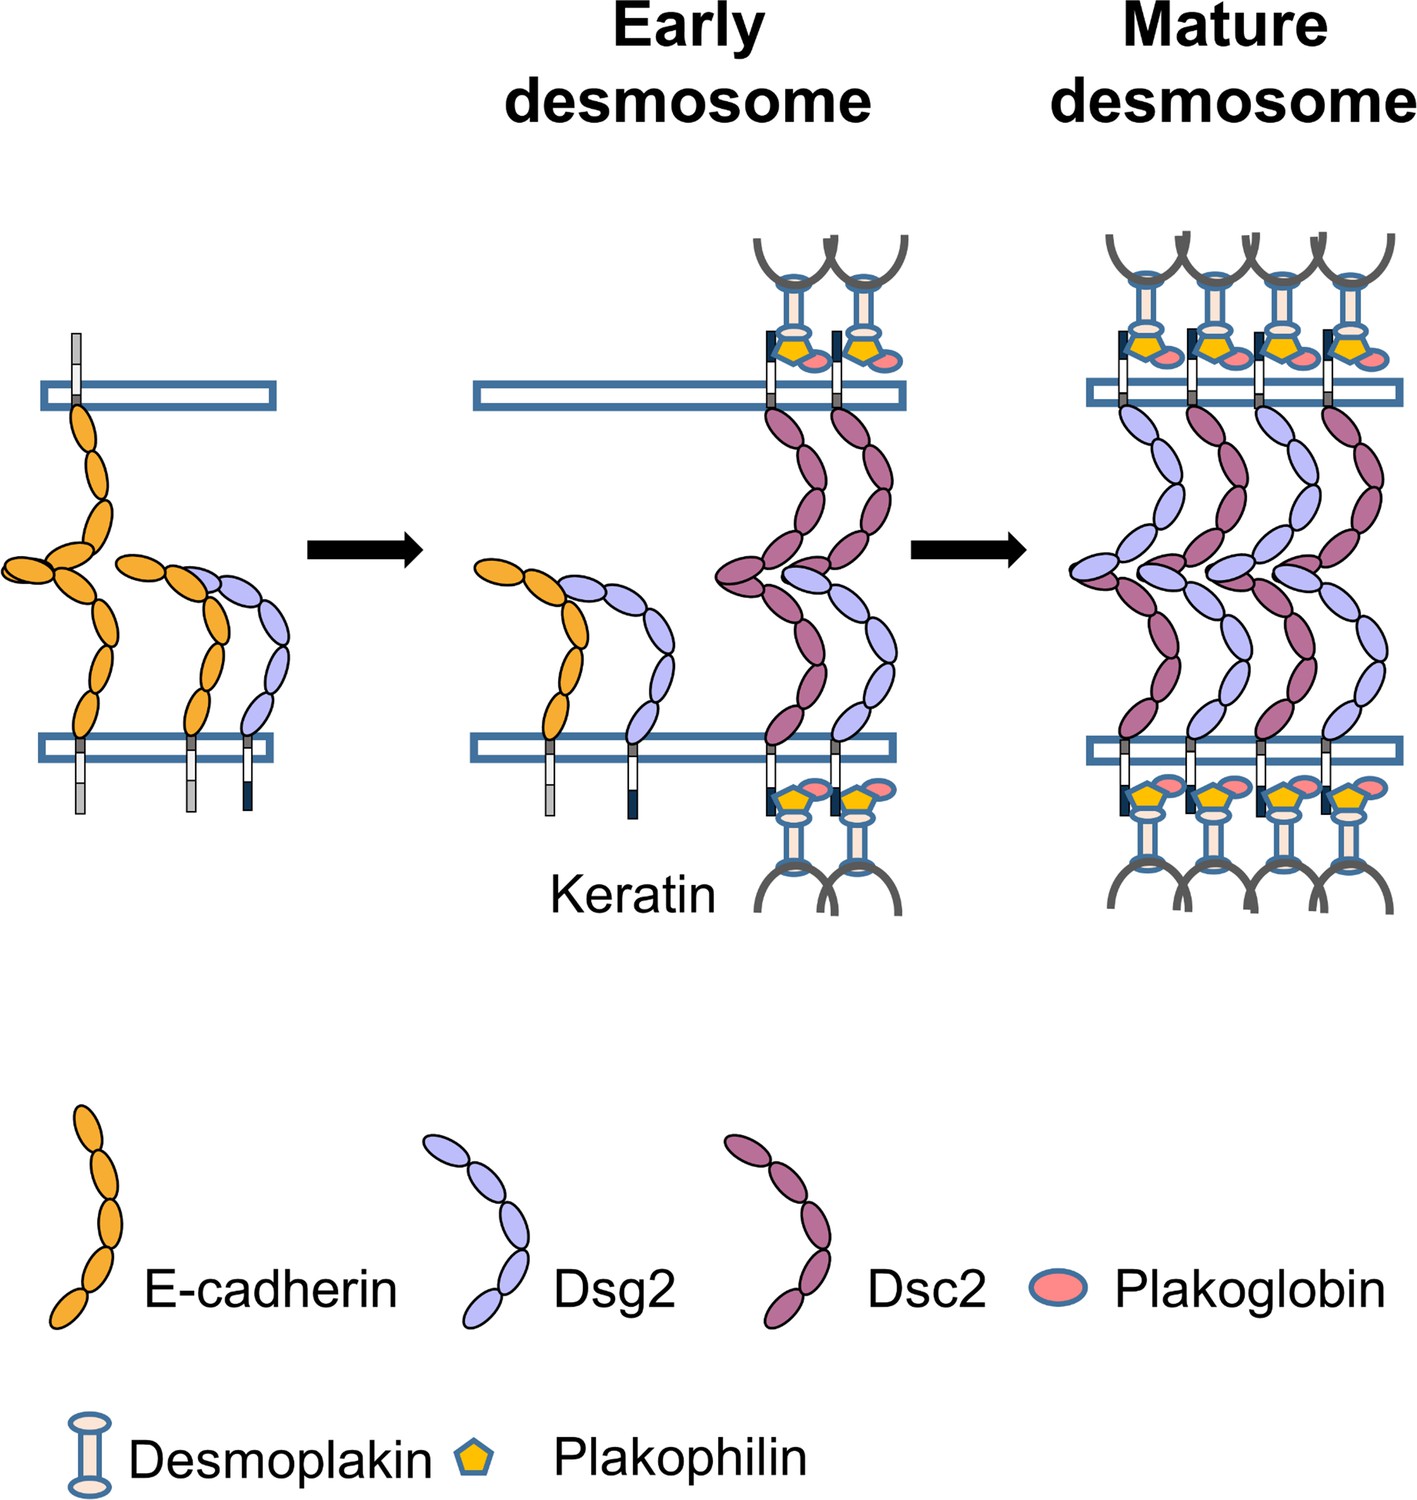
Proposed model for the role of Ecad in desmosome assembly.
Ecad (orange) interacts with Dsg2 (light blue) to form a low-lifetime cis heterodimer. Formation of Ecad/Dsg2 complex requires prior Ecad trans homodimerization. The Ecad/Dsg2 complex is incorporated in the nascent desmosome which also contains low-lifetime Dsc2/Dsc2 dimers (purple). As the desmosome matures, the Ecad/Dsg2 heterodimers and Dsc2/Dsc2 homodimers dissociate. The Dsg2 and Dsc2 interact to form a robust, high-lifetime, trans adhesive complex.
Additional files
-
Transparent reporting form
- https://doi.org/10.7554/eLife.37629.010
Download links
A two-part list of links to download the article, or parts of the article, in various formats.
Downloads (link to download the article as PDF)
Open citations (links to open the citations from this article in various online reference manager services)
Cite this article (links to download the citations from this article in formats compatible with various reference manager tools)
E-cadherin binds to desmoglein to facilitate desmosome assembly
eLife 7:e37629.
https://doi.org/10.7554/eLife.37629


