Morphogenetic degeneracies in the actomyosin cortex
- Max Planck Institute of Molecular Cell Biology and Genetics, Germany
- Max Planck Institute for the Physics of Complex Systems, Germany
- Flatiron Institute, United States
- Newcastle University, United Kingdom
- Wellcome Trust/Cancer Research UK Gurdon Institute, United Kingdom
- Technische Universität Dresden, Germany
- IRCCS Centro Neurolesi “Bonino Pulejo”, Italy
Figures
Figure 1
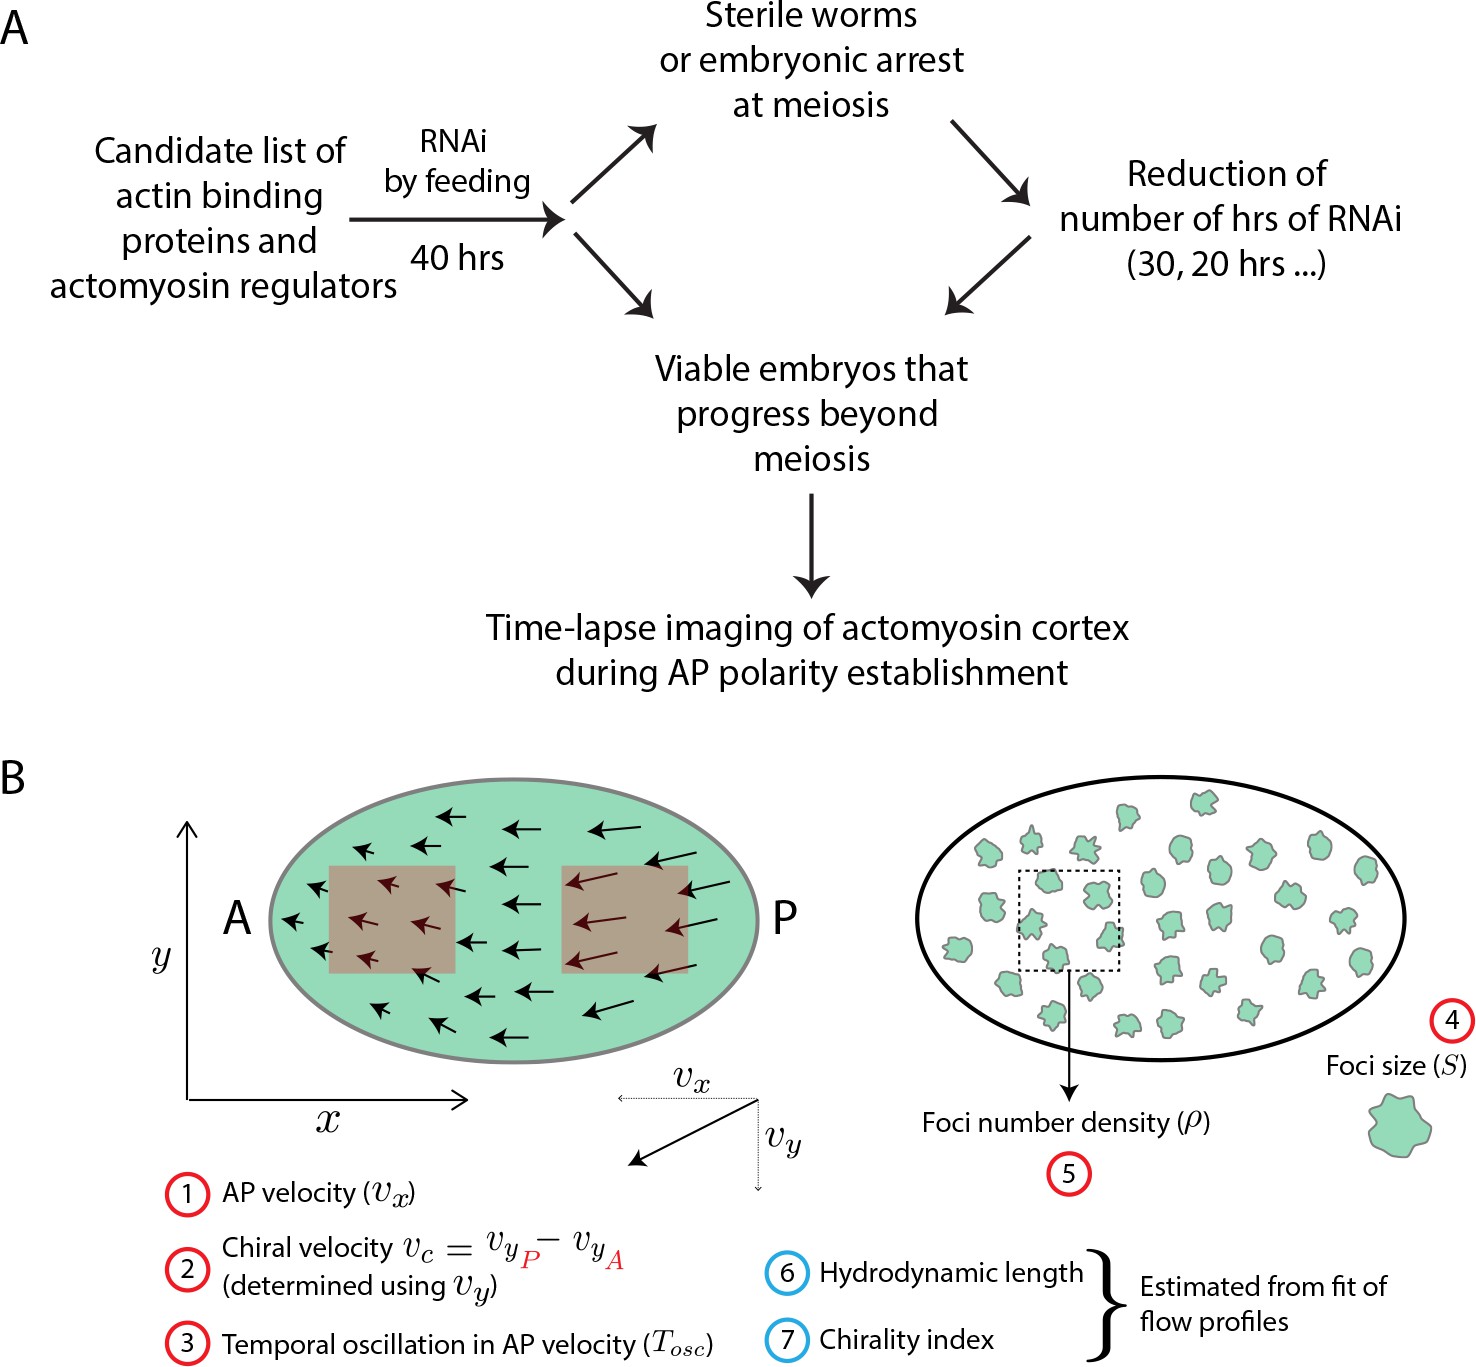
Screen strategy.
(A) Flow chart describes strategy undertaken to perform candidate RNAi screen of actin binding proteins and actomyosin regulators. Time-lapse images were then used to determine flow properties of the cortex. (B) Schematic of a 1-cell embryo indicating the quantities measured (numbers in red circle) and estimated (numbers in blue circle). Left - 1-cell embryo, where arrows indicate flow velocities and arrow lengths signify magnitude. A, anterior and P, posterior of the embryo; x-axis is along the long-axis of the embryo and the y-axis orthogonal to it. Red boxes within embryo indicate analysis regions in the posterior and anterior. Right - 1-cell embryo with myosin foci (green blobs).
Figure 2 with 3 supplements
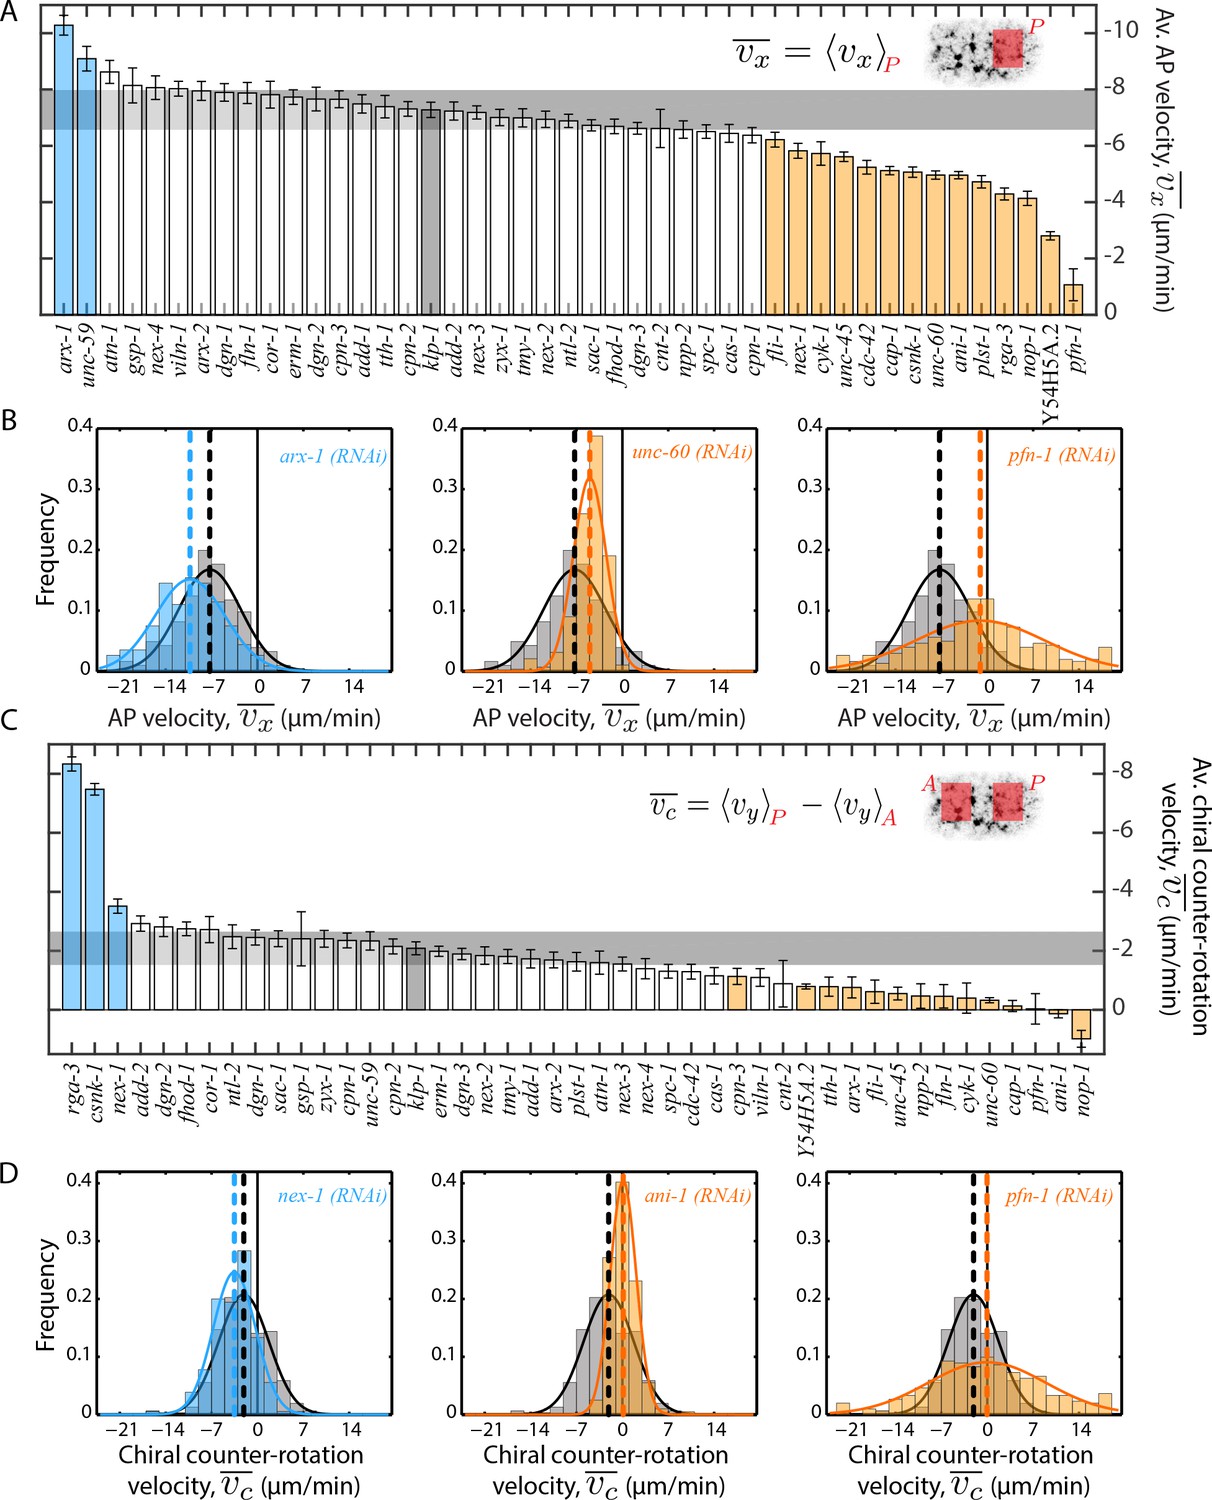
Quantification of cortical flow velocities.
(A), (C) Comparison of mean AP velocity and mean chiral counter-rotation velocity respectively. Shaded areas in the inset represent regions over which the spatial average was performed in each time frame. Error bars, SEM; gray bar, negative control, klp-1 (RNAi) condition; gray horizontal bar, error of the mean with 99% confidence for klp-1 (RNAi); cyan, beige bars, significantly different knockdowns with 99% confidence (Wilcoxon rank sum test). (B), (D) Representative histograms of instantaneous and respectively. Gray histograms, klp-1 (RNAi) condition; dashed lines, mean and respectively. See Figure 2—figure supplement 1 and Figure 2—figure supplement 2 for histograms of significantly different ABPs and Figure 2—figure supplement 3 for a comparison of mean magnitude velocities. See Supplementary file for number of independent embryo samples in each RNAi condition.
Figure 2—figure supplement 1
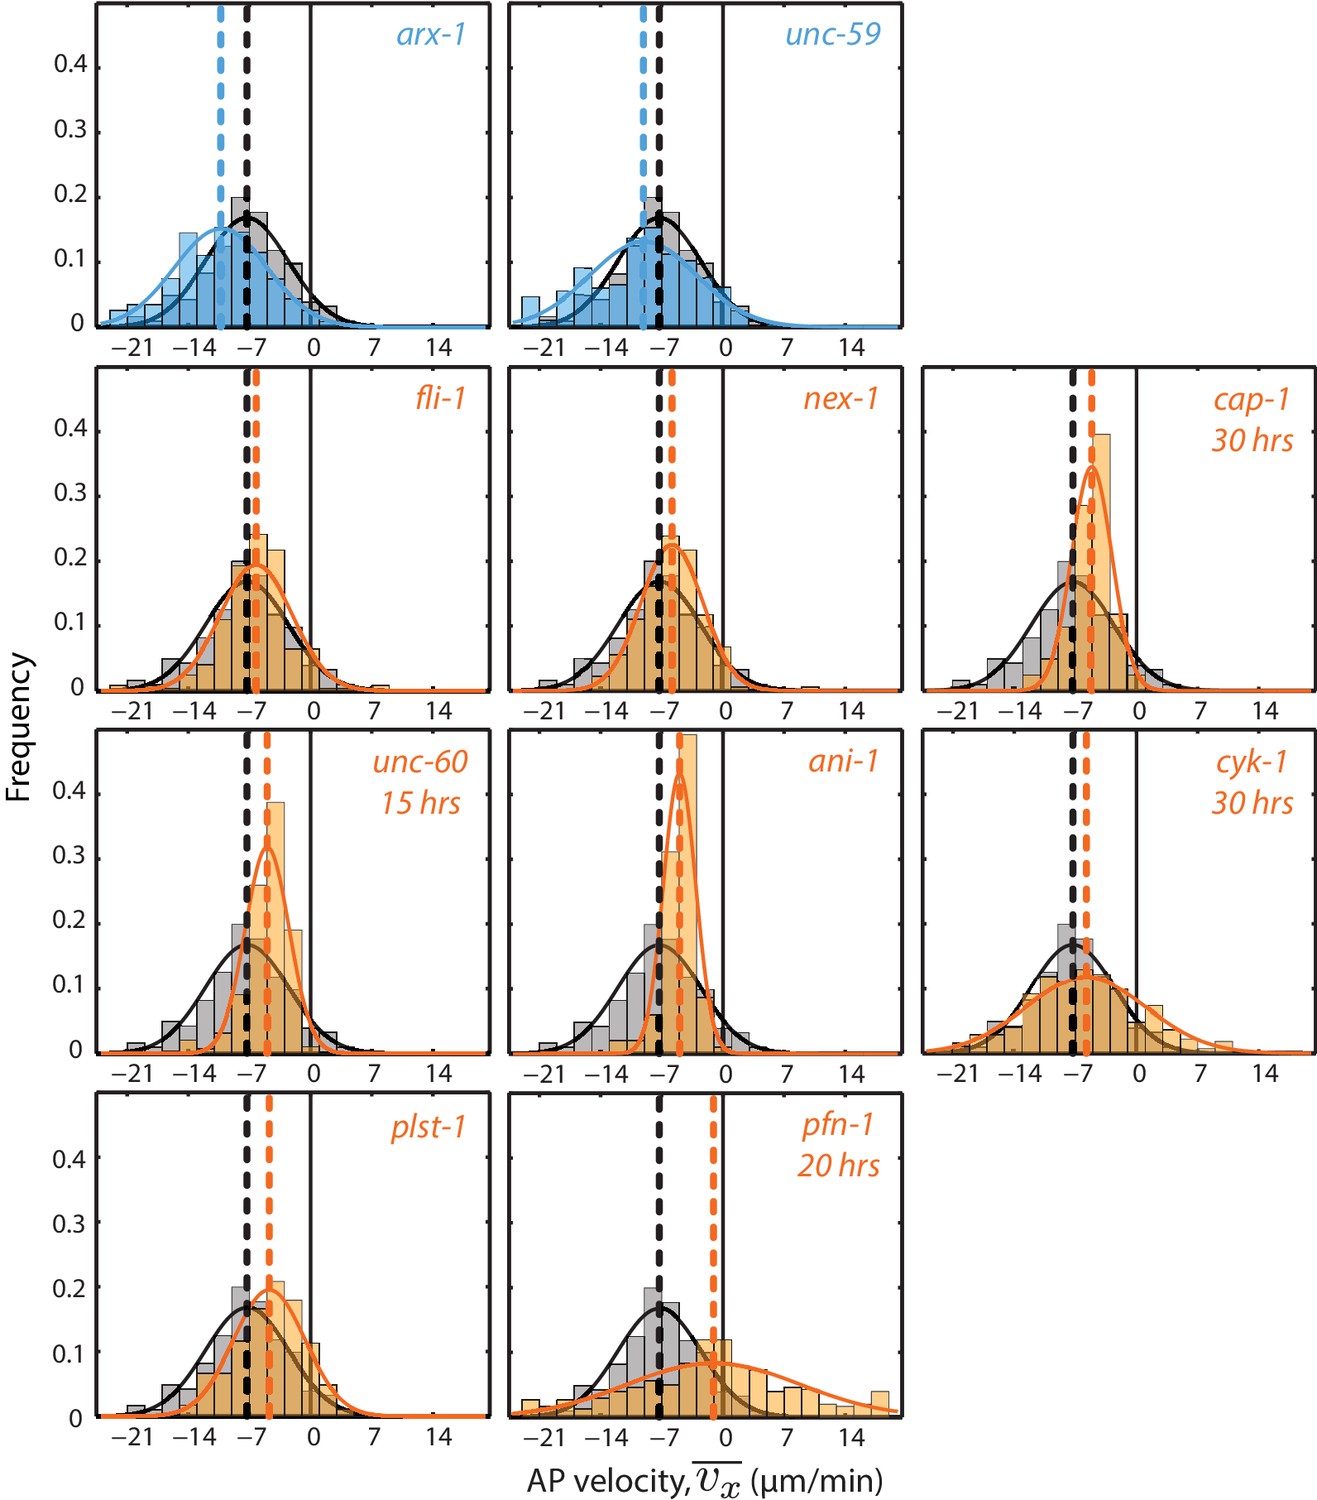
Comparison of mean AP velocity, .
Each graph presents the instantaneous AP velocity histogram for the RNAi condition specified. Only ABP knockdowns that are significantly different from the negative control, klp-1 (RNAi), are shown. Gray histogram, klp-1 (RNAi) condition; dashed lines, mean . The number of hours of RNAi is 40 hrs, unless otherwise stated.
Figure 2—figure supplement 2
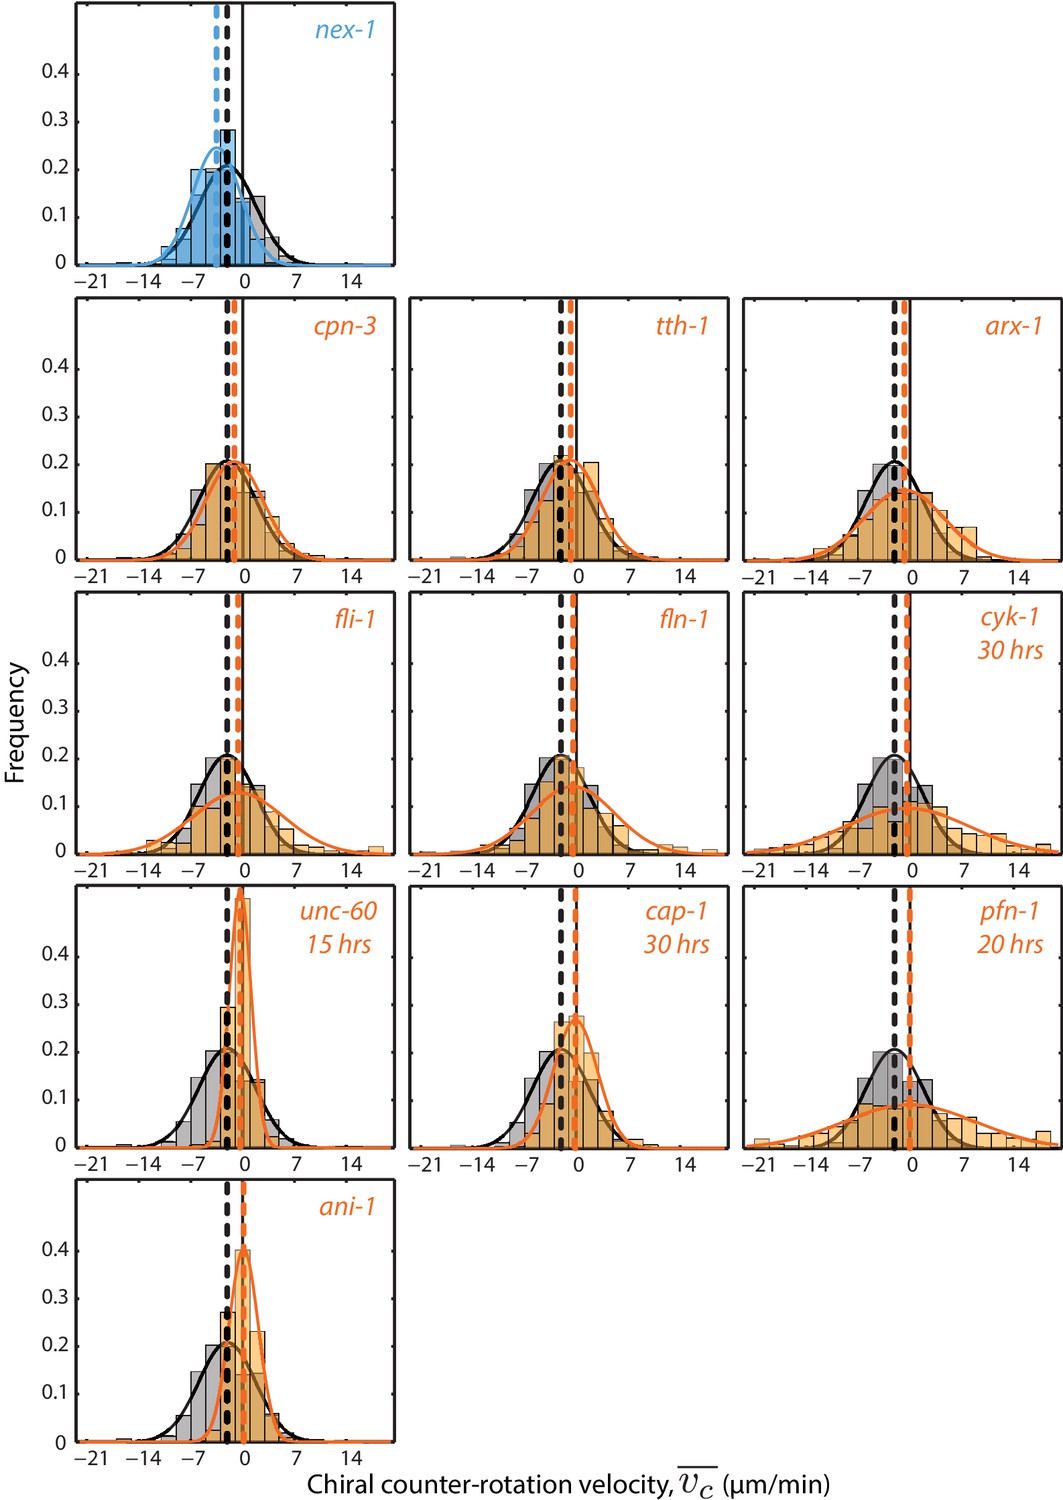
Comparison of mean chiral counter-rotation velocity, .
Each graph presents the instantaneous chiral counter-rotation velocity histogram for the RNAi condition specified. Only ABP knockdowns that are significantly different from the negative control, klp-1 (RNAi), are shown. Gray histogram, klp-1 (RNAi) condition; dashed lines, mean . The number of hours of RNAi is 40 hrs, unless otherwise stated.
Figure 2—figure supplement 3
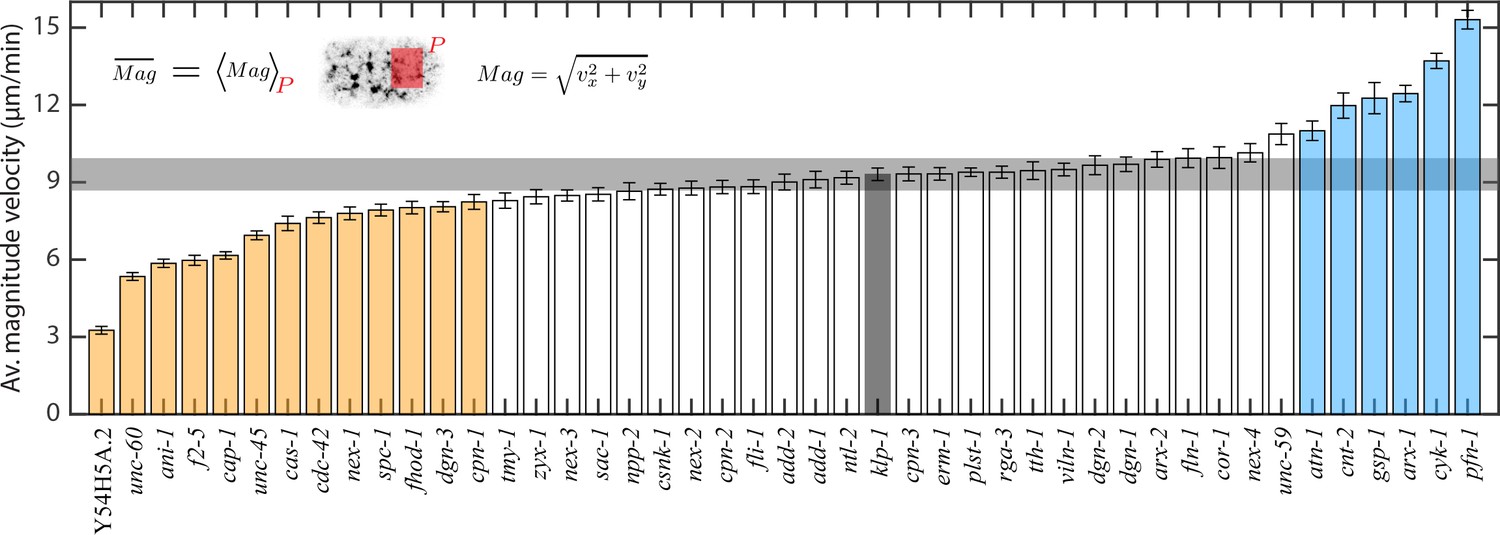
Comparison of mean magnitude velocity, .
Error bars, SEM; gray bar, negative control, klp-1 (RNAi) condition; gray horizontal bar, error of the mean with 99% confidence for klp-1 (RNAi); cyan, beige bars, significantly different knockdowns with 99% confidence (Wilcoxon rank sum test).
Figure 3
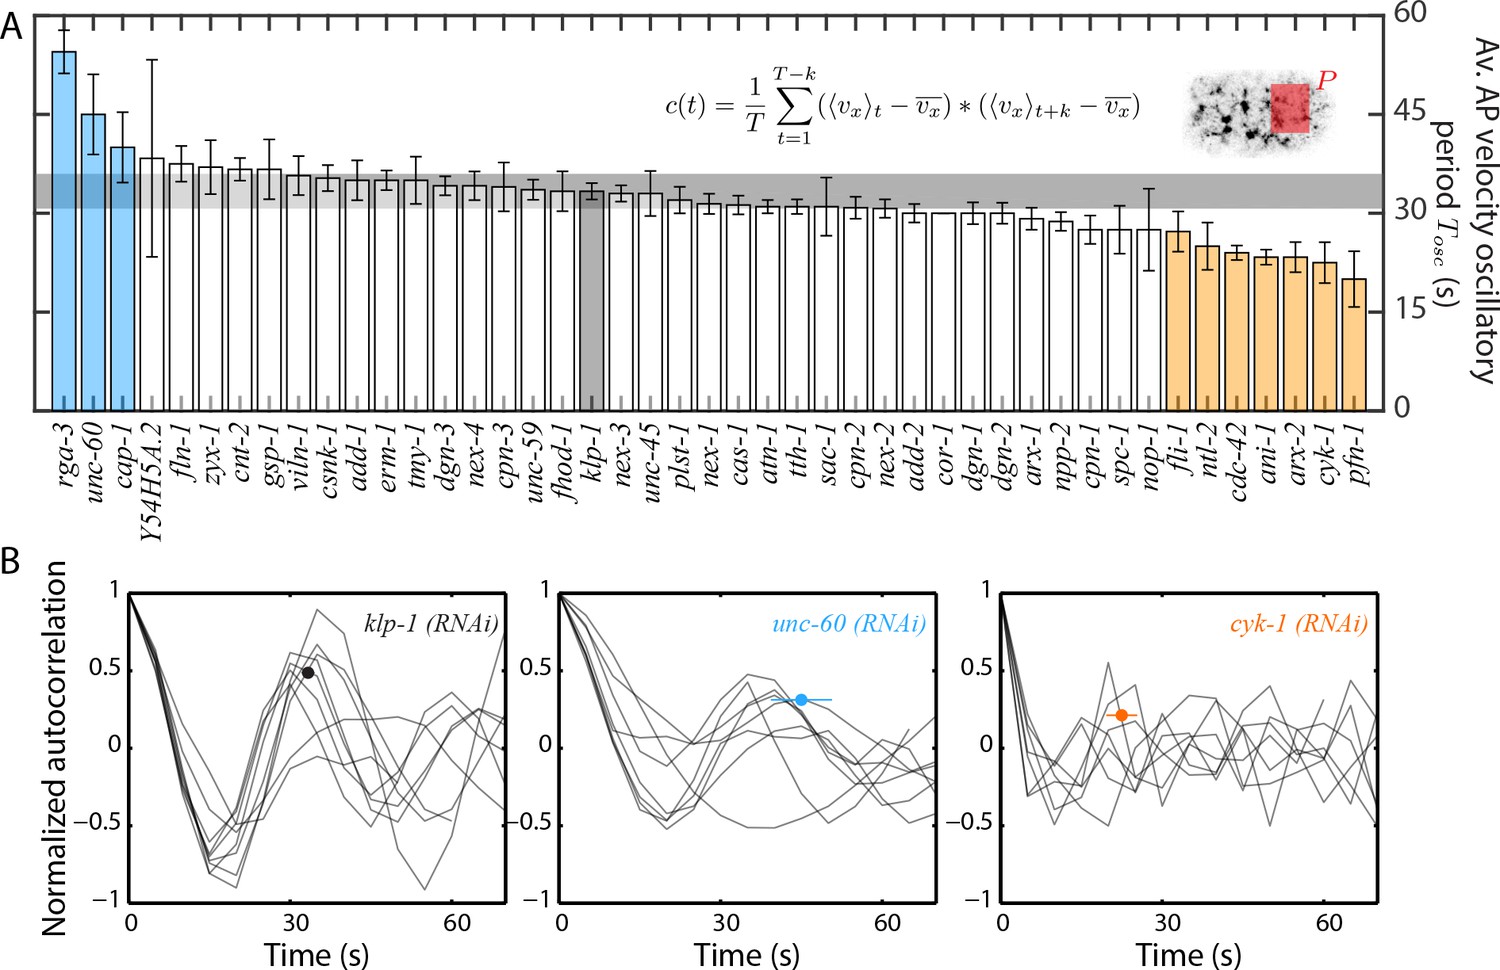
Quantification of pulsatile period of cortical flow.
(A) Comparison of mean period of pulsatile AP velocity, , in the posterior of the embryo. Shaded area in the inset represents the region over which the spatial average of velocity was performed in each time frame. The formula for the autocorrelation function is indicated, where is total analysis time of cortical flow and is increment (see Materials and methods). Error bars, SEM; gray bar, negative control, klp-1 (RNAi) condition; gray horizontal bar, error of the mean with 95% confidence for klp-1 (RNAi); cyan, beige bars, significantly different knockdowns with 95% confidence (Wilcoxon rank sum test). (B) Normalized autocorrelation decay curves from individual embryos (thin black lines) for the negative control, klp-1 (RNAi), cyk-1 (RNAi) and unc-60 (RNAi). Circular markers represent mean of the periods determined from individual embryos, with error bars representing SEM. See Supplementary file for number of independent embryo samples in each RNAi condition.
Figure 4 with 1 supplement
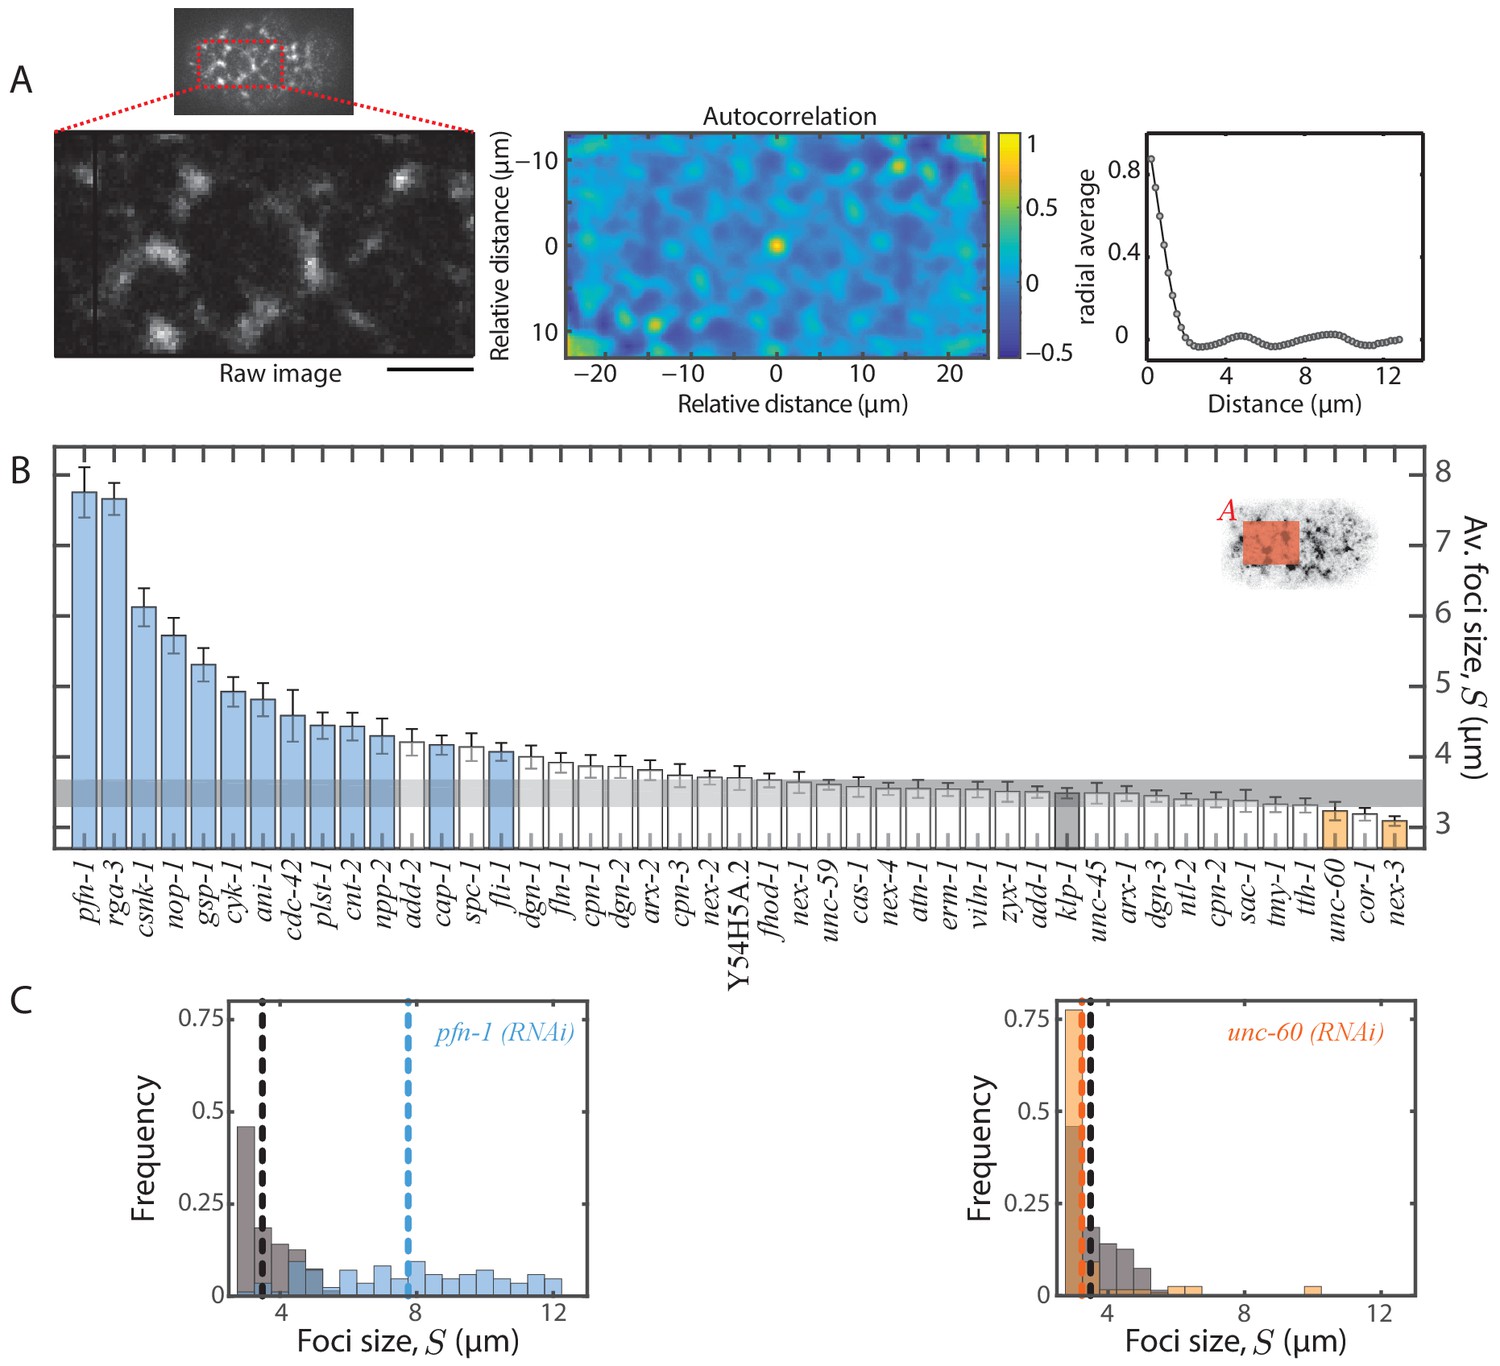
Quantification of myosin foci size.
(A) Representative 2D myosin fluorescence intensity autocorrelation function as a heat map (middle) for the anterior region (left) of a single frame during cortical flow from a klp-1 (RNAi) embryo. Scale bar, 5 µm. Right - radial average of the autocorrelation function. (B) Comparison of mean foci size, . Error bars, SEM; gray bar, negative control, klp-1 (RNAi) condition; gray horizontal bar, error of the mean with 99% confidence for klp-1 (RNAi); cyan, beige bars, significantly different knockdowns with 99% confidence (Wilcoxon rank sum test). Shaded area in the inset represents the region in which the fluorescence intensity autocorrelation was performed in each frame. (C) Representative histograms of determined over time during the cortical flow period. Gray histograms, klp-1 (RNAi) condition; dashed lines, mean foci size. See Figure 4—figure supplement 1 for histograms of significantly different ABPs. See Supplementary file for number of independent embryo samples in each RNAi condition.
Figure 4—figure supplement 1
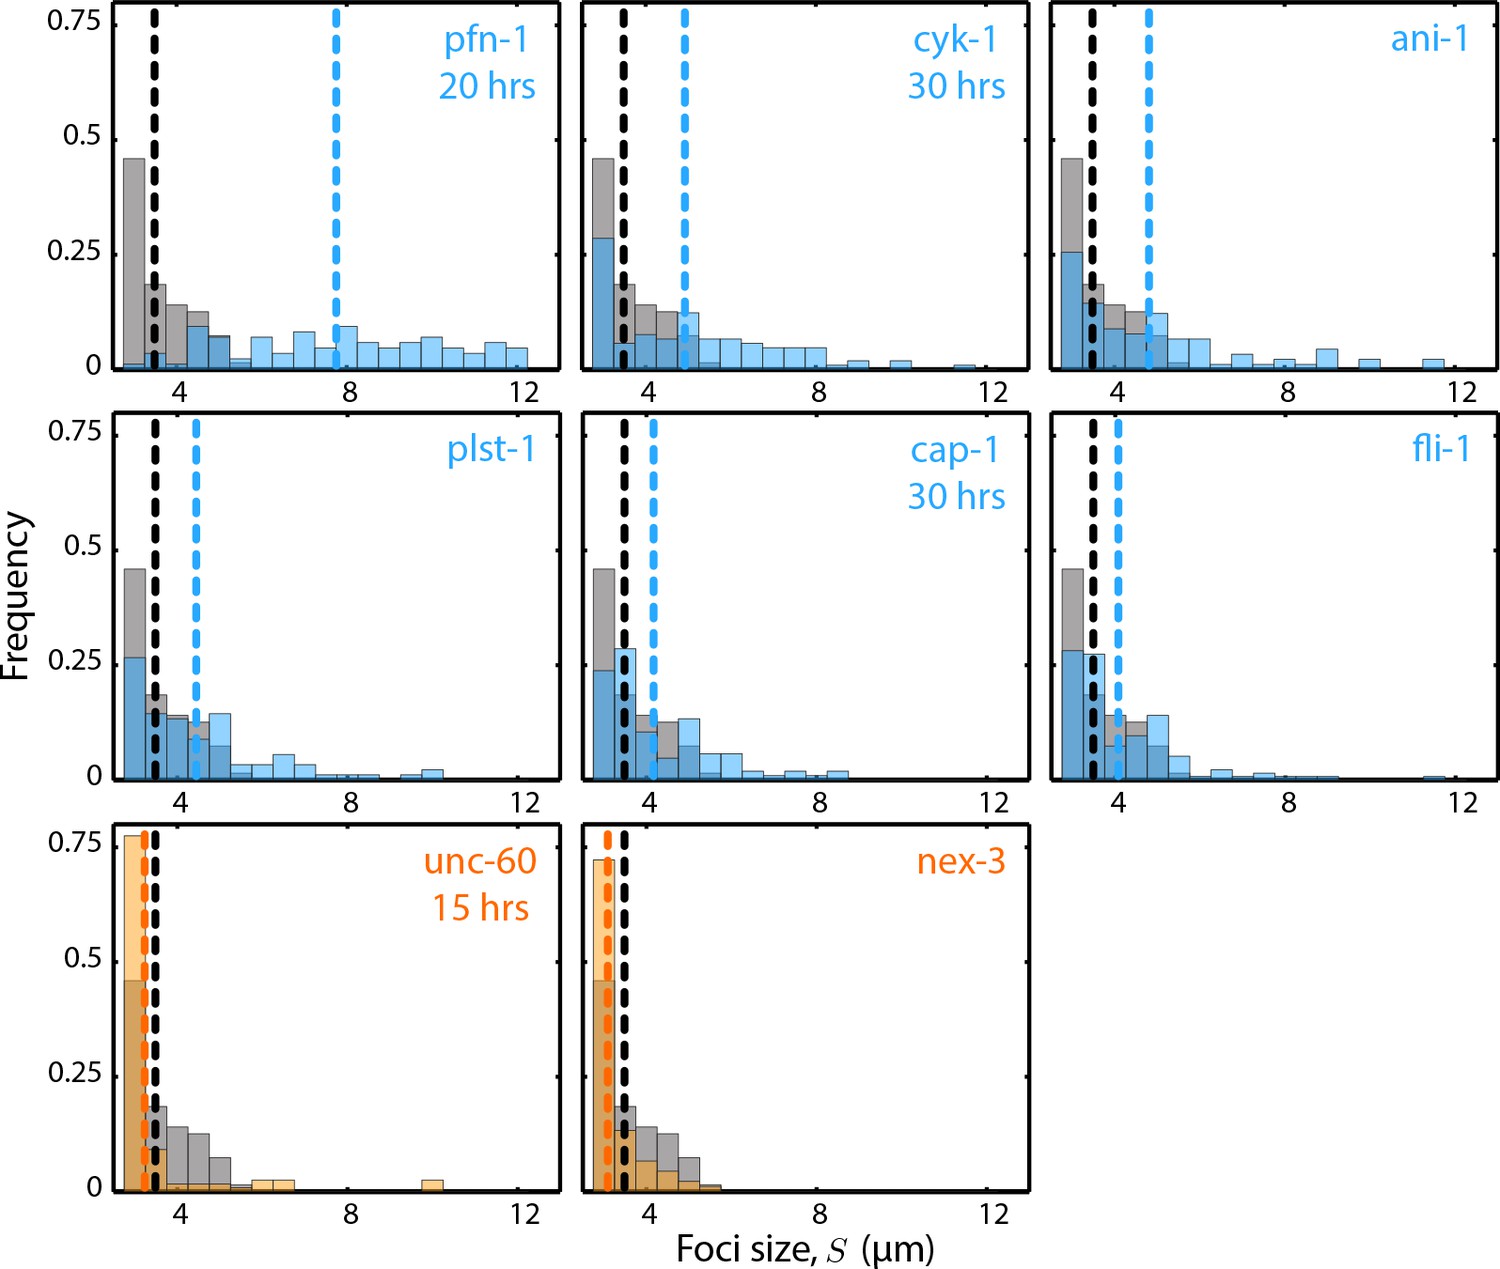
Comparison of mean foci size, .
Each graph presents the foci size histogram for the RNAi condition specified. Only ABP knockdowns that are significantly different from the negative control, klp-1 (RNAi), are shown. Gray histogram, klp-1 (RNAi) condition; dashed lines, mean . The number of hours of RNAi is 40 hrs, unless otherwise stated.
Figure 5 with 1 supplement
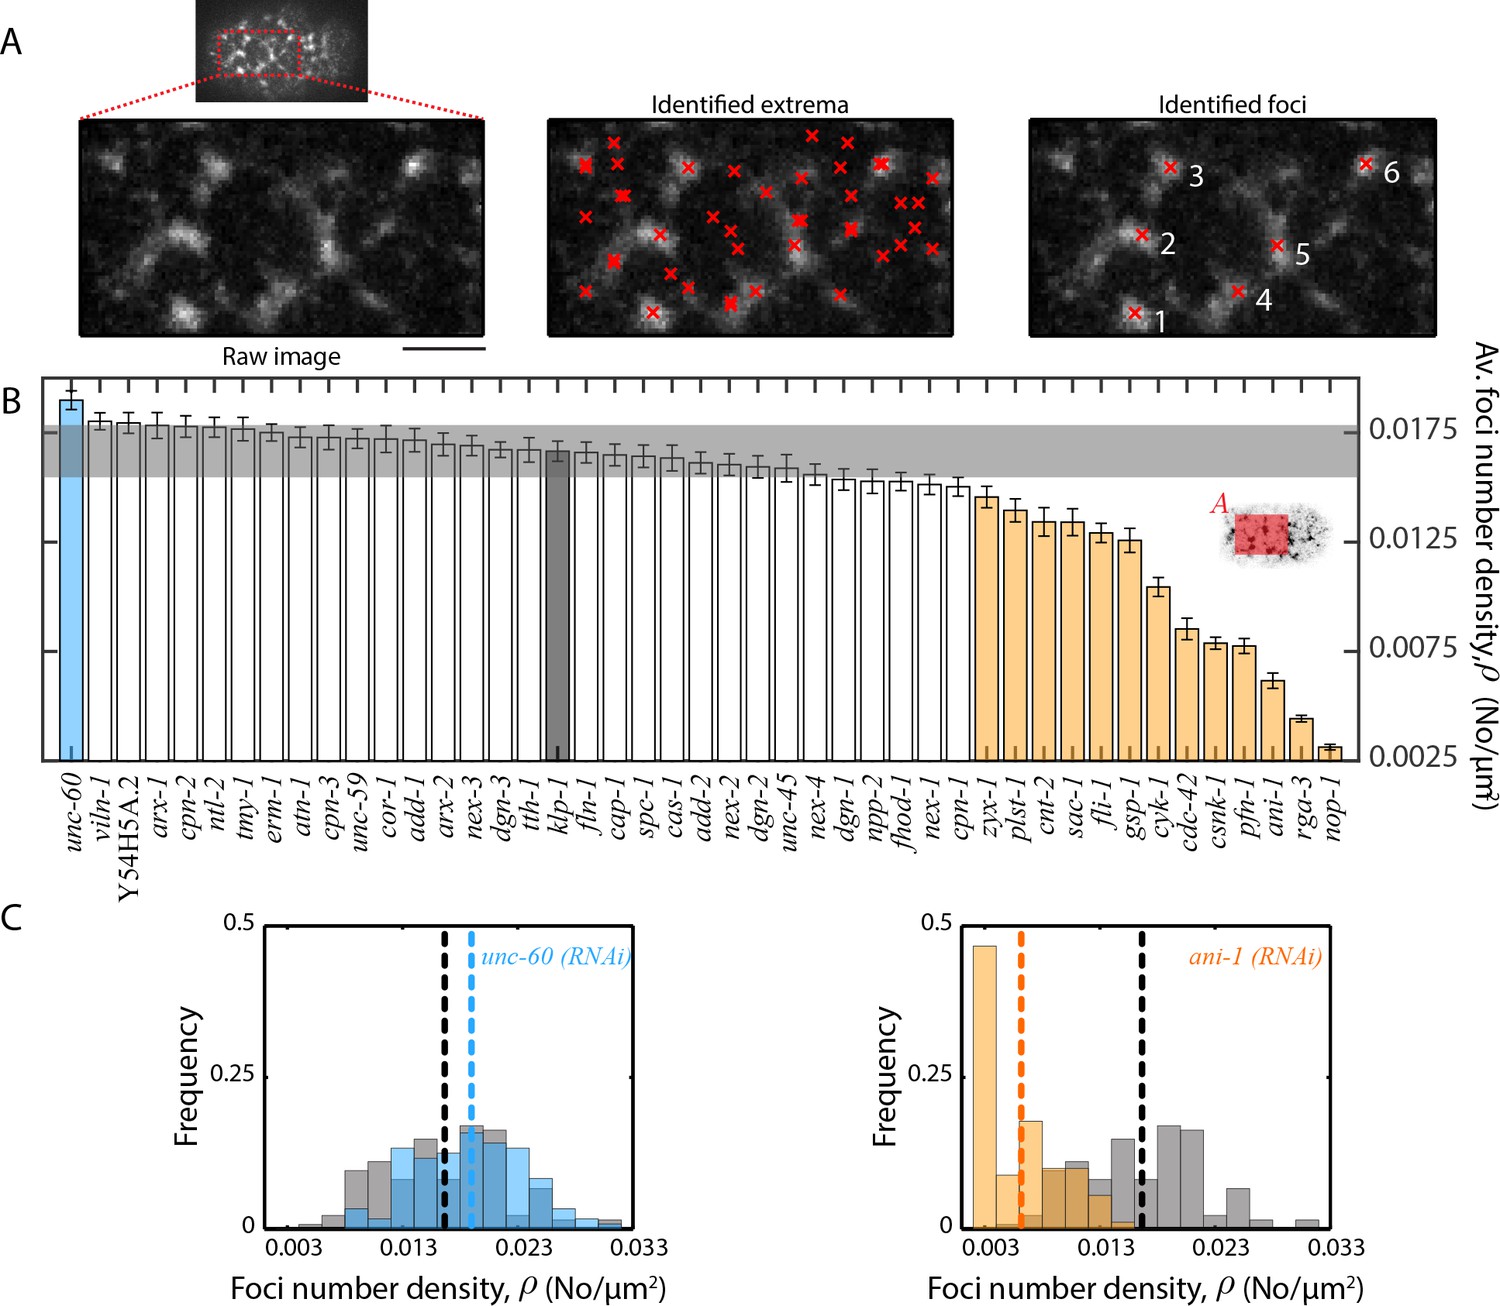
Quantification of myosin foci number density.
(A) Detection of myosin foci (right) by analysis of local changes in fluorescence intensity in the vicinity of identified local extrema (middle) for the anterior region (left) of a single frame during cortical flow from a klp-1 (RNAi) embryo. Scale bar, 5 µm. (B) Comparison of mean foci number density, . Error bars, SEM; gray bar, negative control, klp-1 (RNAi) condition; gray horizontal bar, error of the mean with 99% confidence for klp-1 (RNAi); cyan, beige bars, significantly different knockdowns with 99% confidence (Wilcoxon rank sum test). Shaded area in the inset represents the region that was utilized for foci detection in each frame. (C) Representative histograms of determined over time during the cortical flow period. Gray histograms, klp-1 (RNAi) condition; dashed lines, mean foci number density. See Figure 5—figure supplement 1 for histograms of significantly different ABPs. See Supplementary file for number of independent embryo samples in each RNAi condition.
Figure 5—figure supplement 1
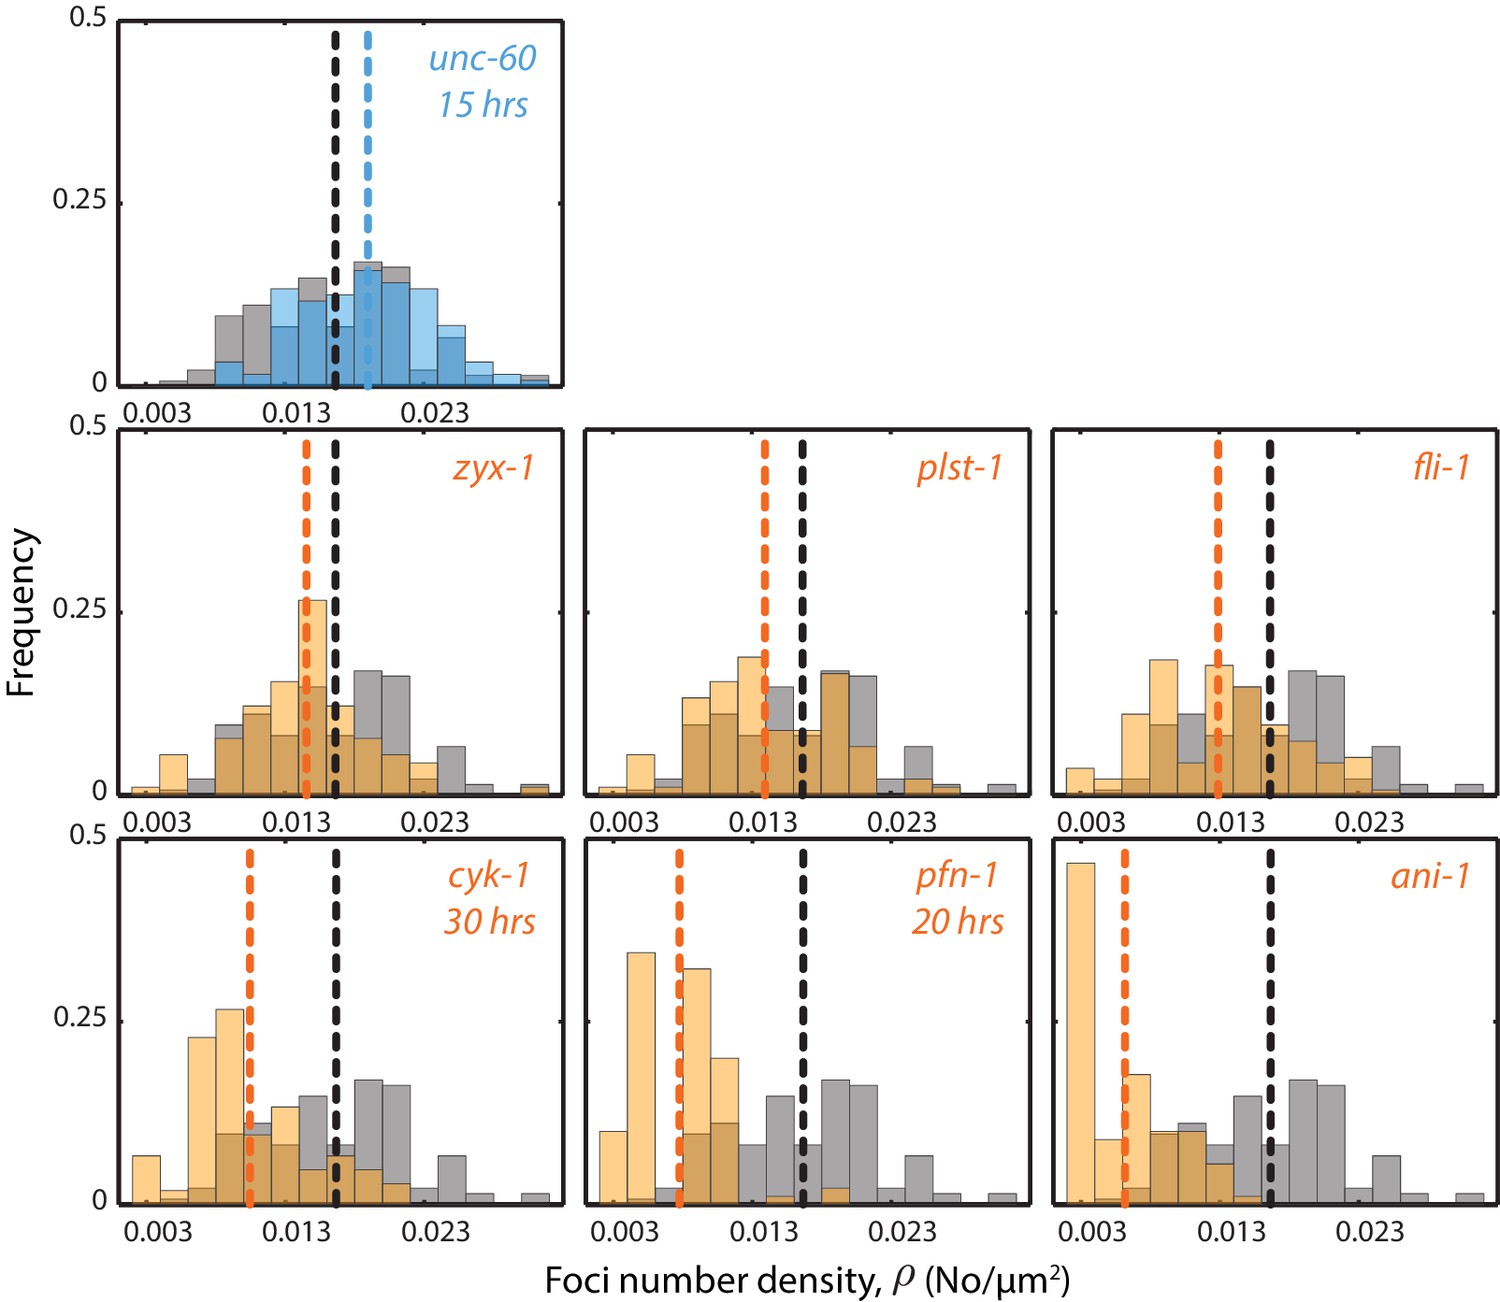
Comparison of mean foci number density, .
Each graph presents the foci number density histogram for the RNAi condition specified. Only ABP knockdowns that are significantly different from the negative control, klp-1 (RNAi), are shown. Gray histogram, klp-1 (RNAi) condition; dashed lines, mean . The number of hours of RNAi is 40 hrs, unless otherwise stated.
Figure 6 with 1 supplement
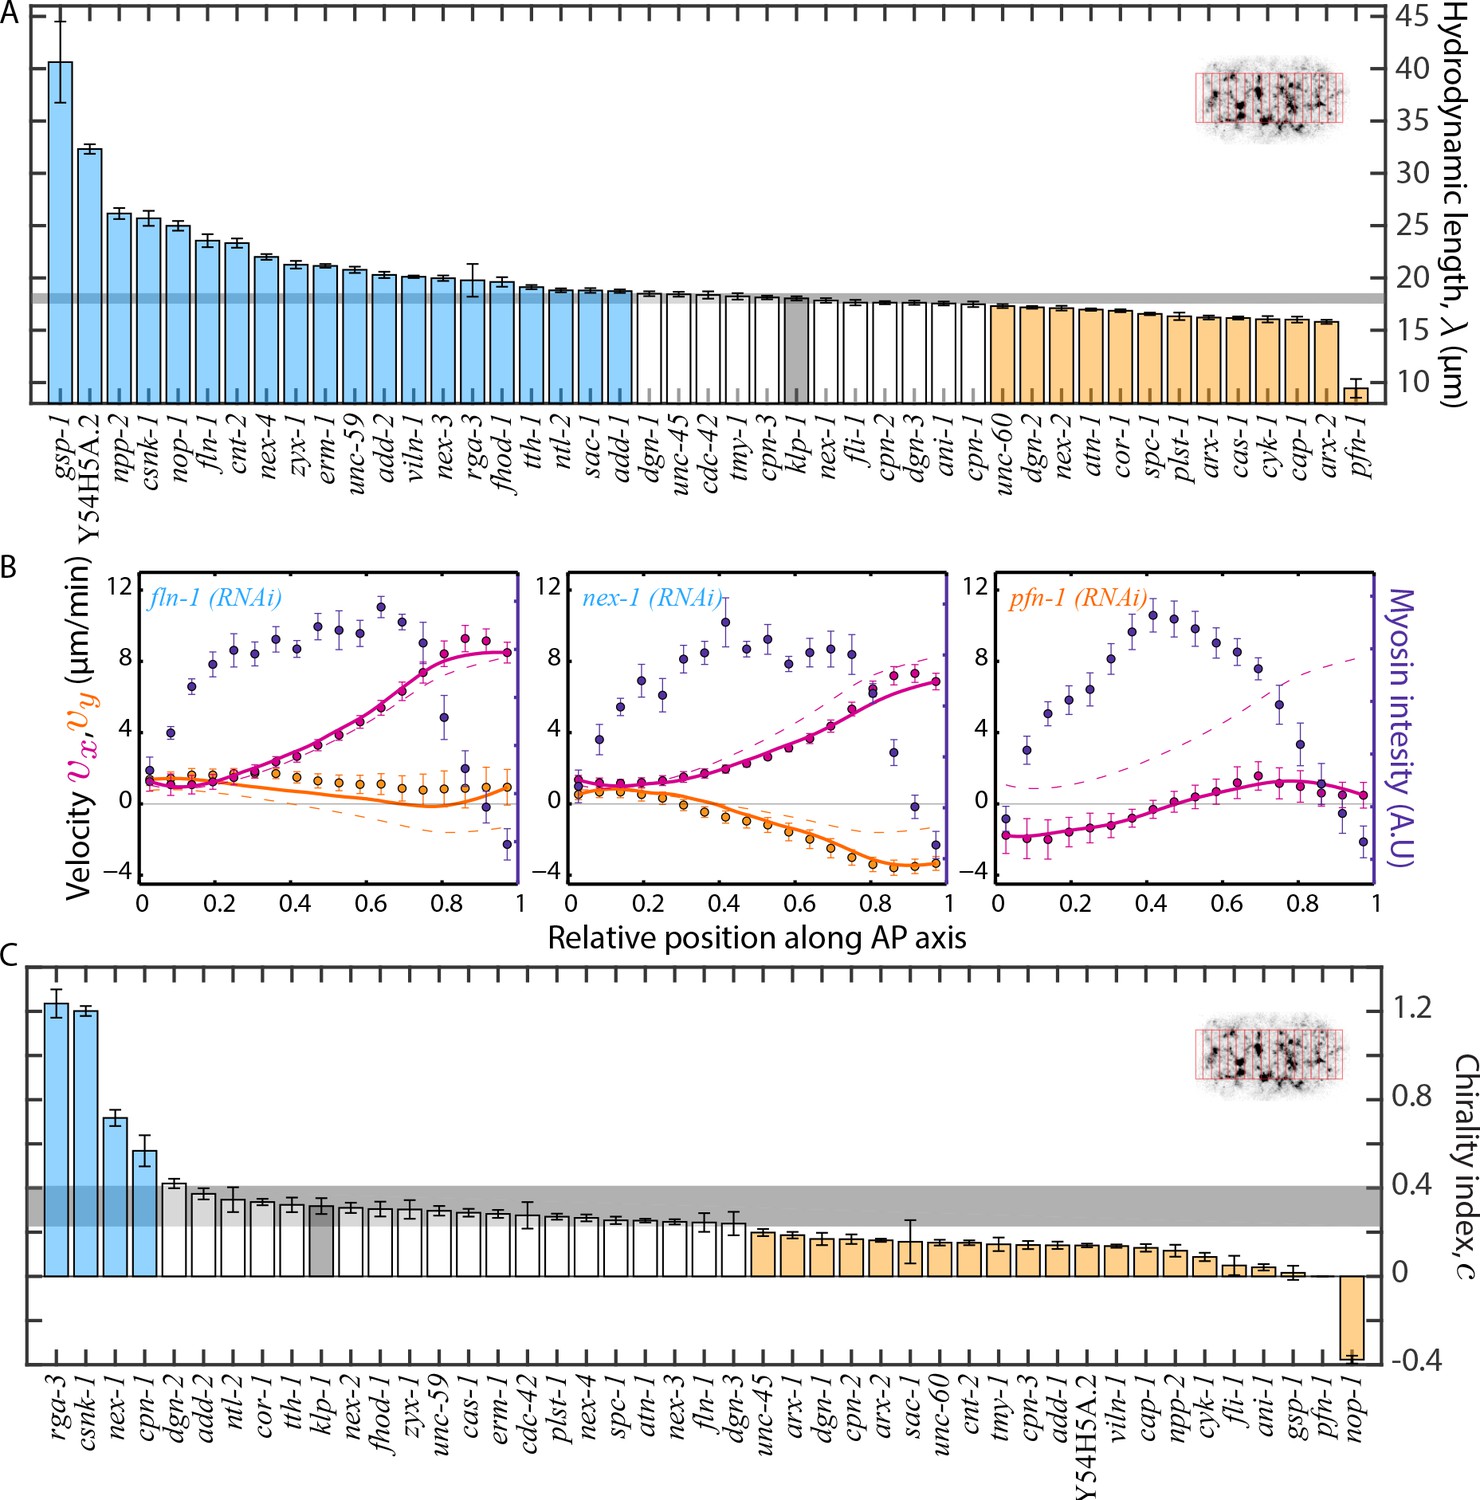
Estimation of physical properties of the cortex.
(A), (C) Comparison of the hydrodynamic length, and chirality index, of the cortex respectively. Error bars, SEM; gray bar, negative control, klp-1 (RNAi) condition; gray horizontal bar, error of the mean with 99% confidence for klp-1 (RNAi); cyan, beige bars, significantly different knockdowns with 99% confidence (significance determined using normal cumulative distribution function in MATLAB). The bins over which spatial average of velocities were determined in each frame are shown in the inset. (B) Average myosin intensity (blue markers) and velocity profiles (magenta markers, AP flow velocity ; beige markers, y-velocity ) along the AP axis for representative RNAi conditions. Error bars, SEM. Magenta and beige curves, respective theoretical velocity profiles. Dashed lines, theoretical velocity profiles for klp-1 (RNAi) condition. See Figure 6—figure supplement 1 for more examples of fit profiles of significantly different ABPs. See Supplementary file for number of independent embryo samples in each RNAi condition.
Figure 6—figure supplement 1
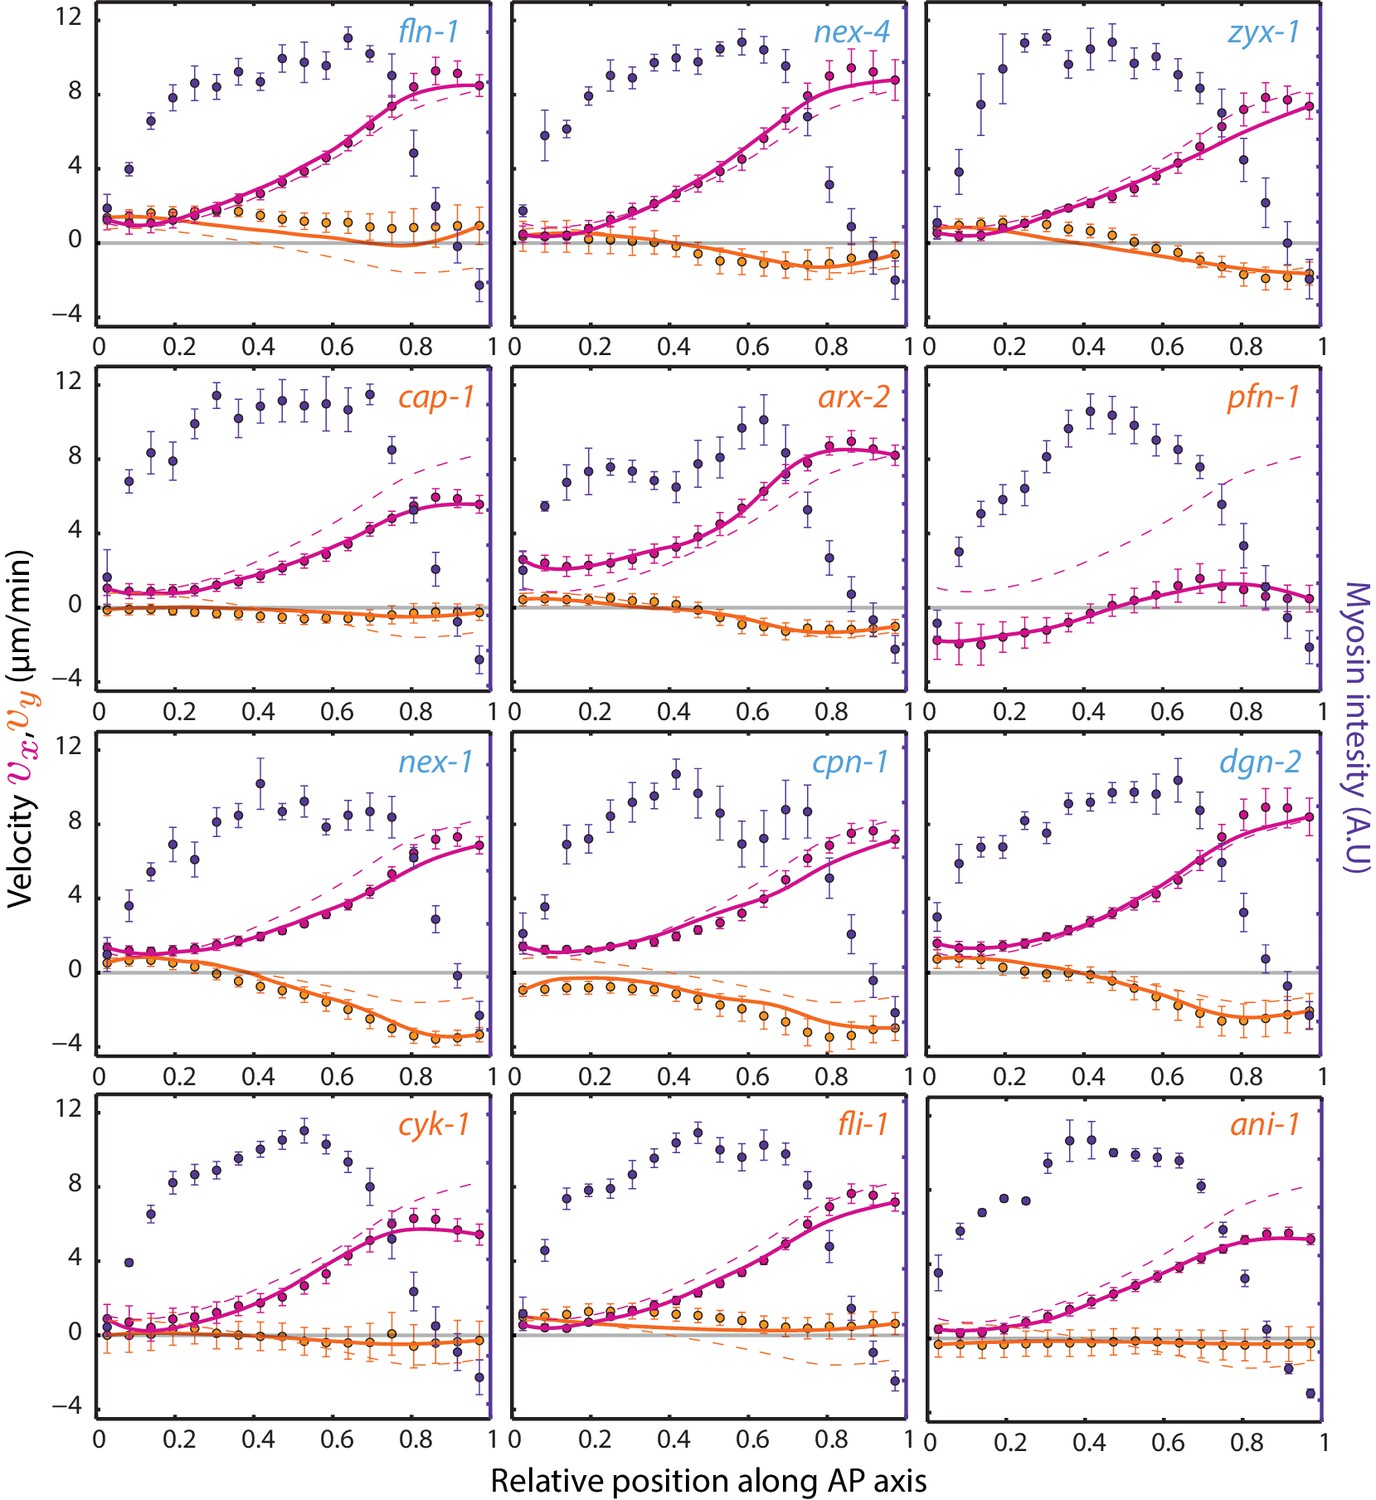
Comparison of hydrodynamic model fit to experimental flow profiles.
Row 1 (row 2) represents the top three ABP knockdowns that resulted in a significantly higher (lower) , and row 3 (row 4) represents the top three ABP knockdowns that resulted in a significantly higher (lower) . Each graph presents the average myosin intensity (blue markers) and velocity profiles (magenta markers, AP flow velocity ; beige markers, -velocity ) along the AP axis for each RNAi condition specified. Error bars, SEM. Magenta and beige curves, respective theoretical velocity profiles. Dashed lines, theoretical velocity profiles of the negative control, klp-1 (RNAi).
Figure 7 with 4 supplements
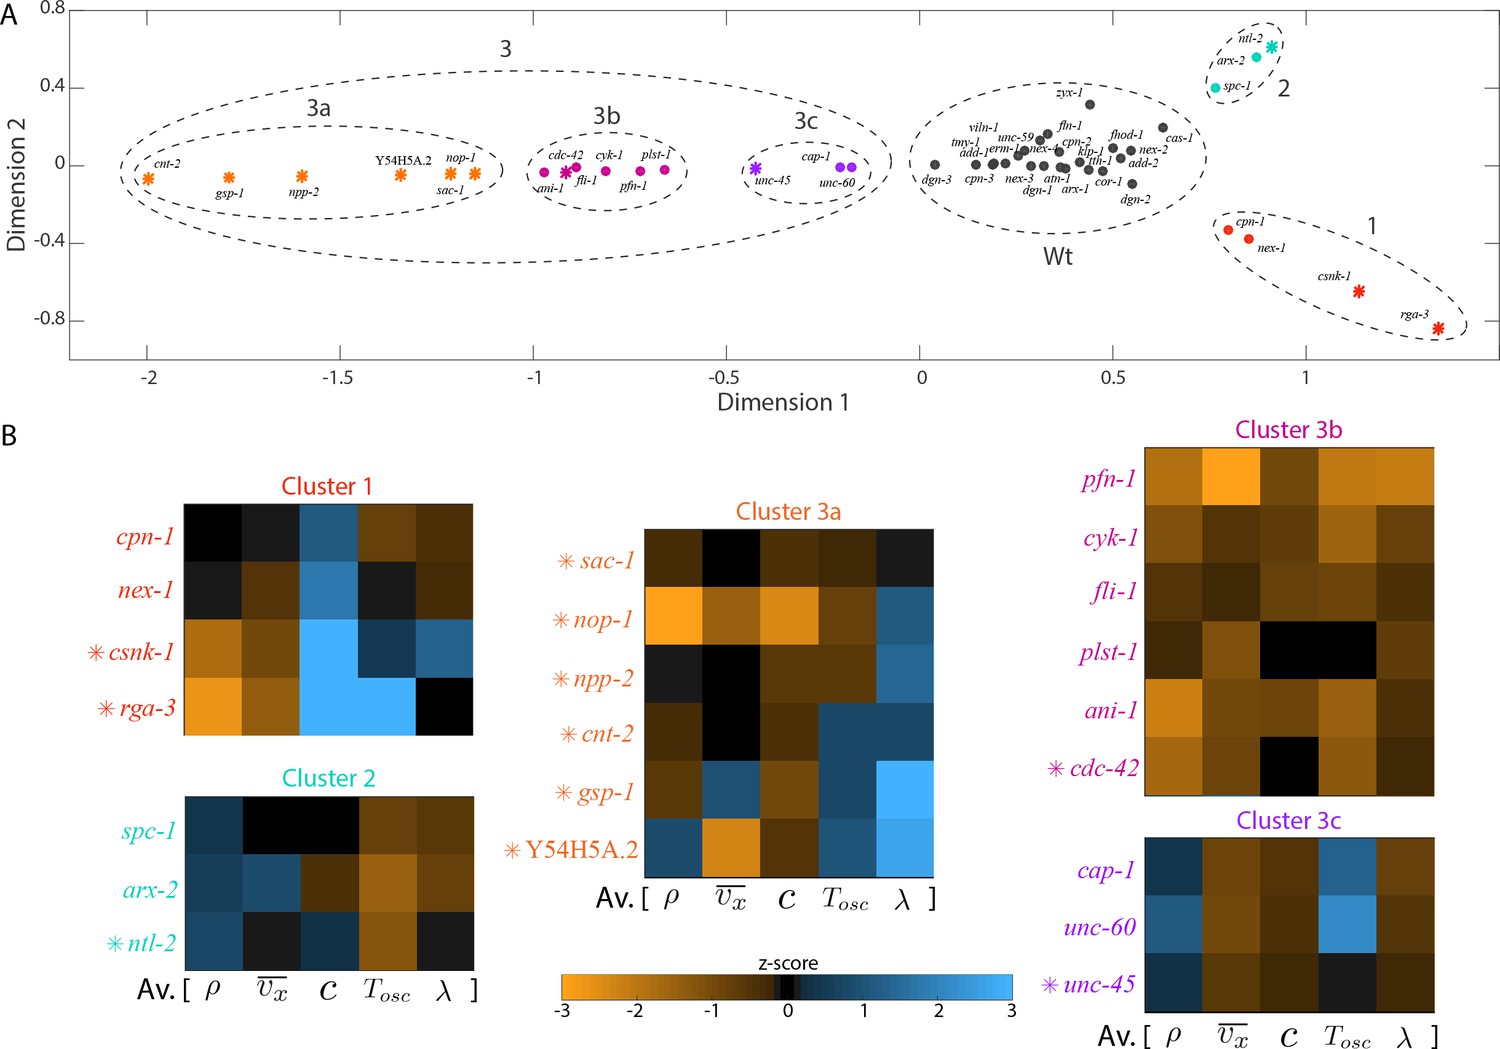
Distinct molecular functions possess similar roles at large-scales.
(A) Non-linear dimensional reduction of the quantitative data set was performed and plotted along dimensions that represent the highest variability. Circular markers, ABPs; star markers, actomyosin regulators; colours represent the different clusters and black represents knockdowns in the same group as the negative control, klp-1 (RNAi); Wt - wild type. See Figure 7—figure supplement 1 for a heat map of the wild type cluster and Figure 7—figure supplement 4 for a correlation of quantifications and the two principal axes of the dimensionally reduced data set. (B) Parameters that were used for dimensional reduction (foci density , AP velocity , chirality index , flow period , hydrodynamic length ) were rearranged and displayed as heat maps for knockdowns that constitute each cluster. Colour bar, z-score. See Figure 7—figure supplement 2 for correlations between different quantifications and Figure 7—figure supplement 3 for visualisation of cytoplasmic actin fluorescence for unc-60 and cap-1 (RNAi) from cluster 3c.
Figure 7—figure supplement 1
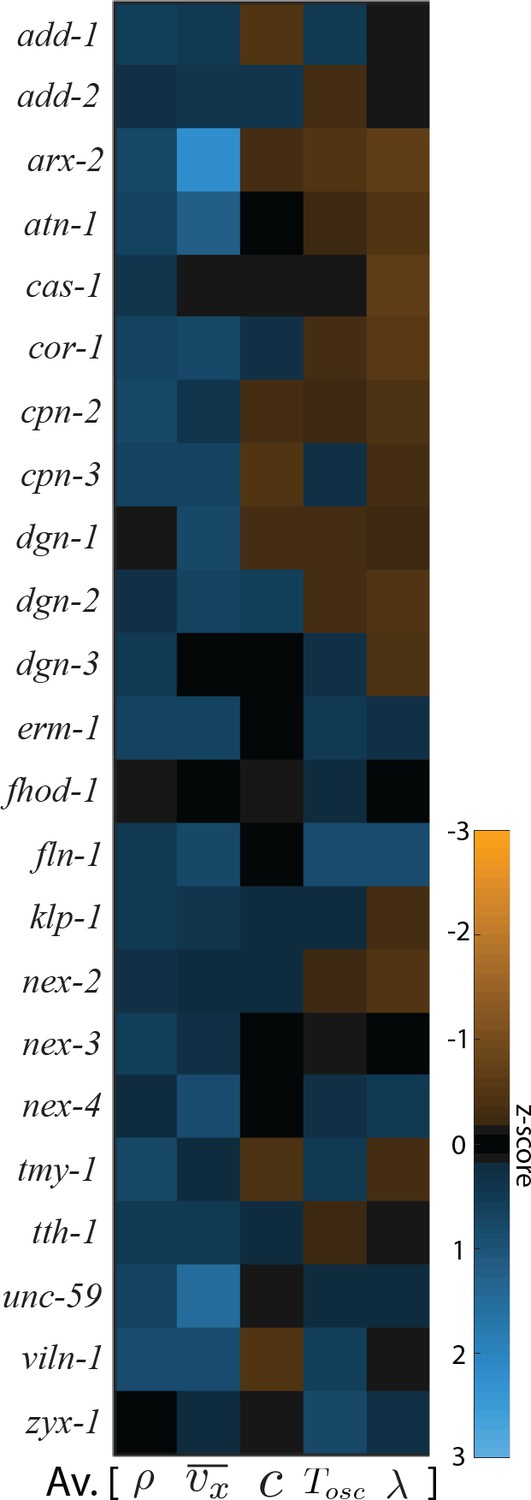
Heat map of proteins part of the wild type cluster.
Parameters that were used for dimensional reduction (foci density , AP velocity , chirality index , flow period , hydrodynamic length ) are displayed as heat maps for knockdowns that constitute the wild type cluster. Colour bar, z-score; klp-1 (RNAi) - negative control.
Figure 7—figure supplement 2
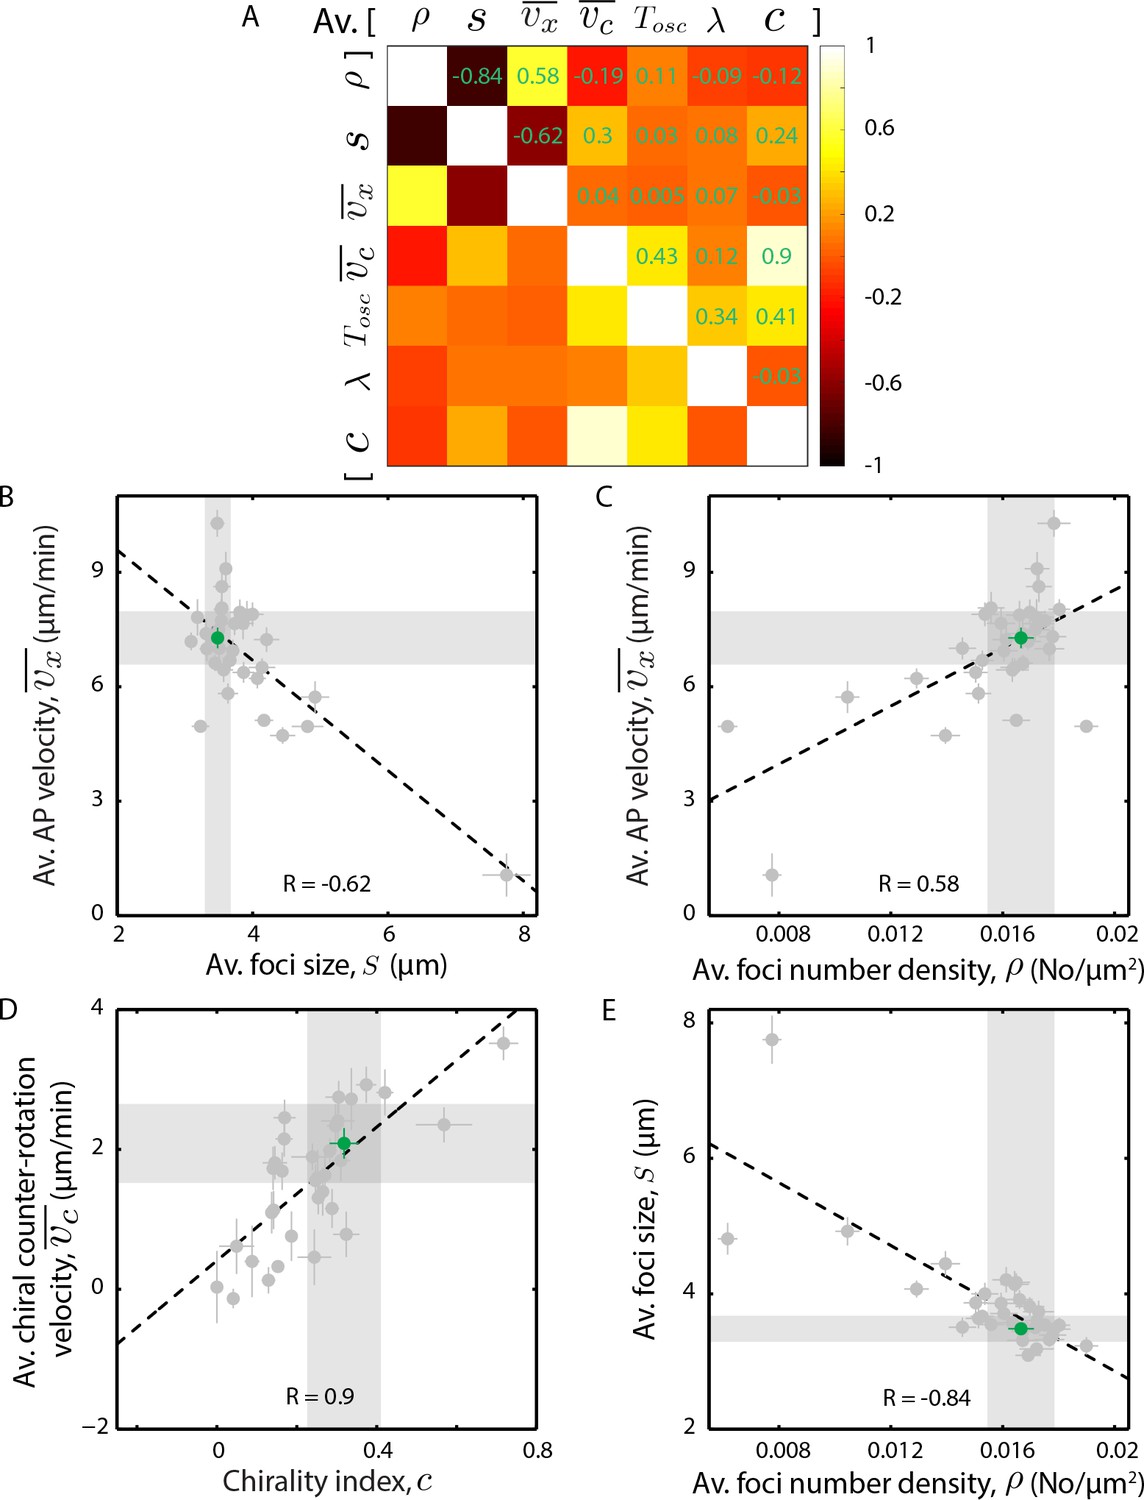
Correlation between quantifications for ABPs.
(A) Pearson’s linear correlation coefficients between pairs of quantifications are shown as a heat map. (B)-(E) Selected pairs of quantifications that were positively or negatively correlated are shown as scatter plots. Circular markers, individual knockdowns; error bars, SEM; green marker, negative control, klp-1 (RNAi); gray bars, error of the mean with 99% confidence for klp-1 (RNAi) condition; dashed line, least squares fit of the data.
Figure 7—figure supplement 3
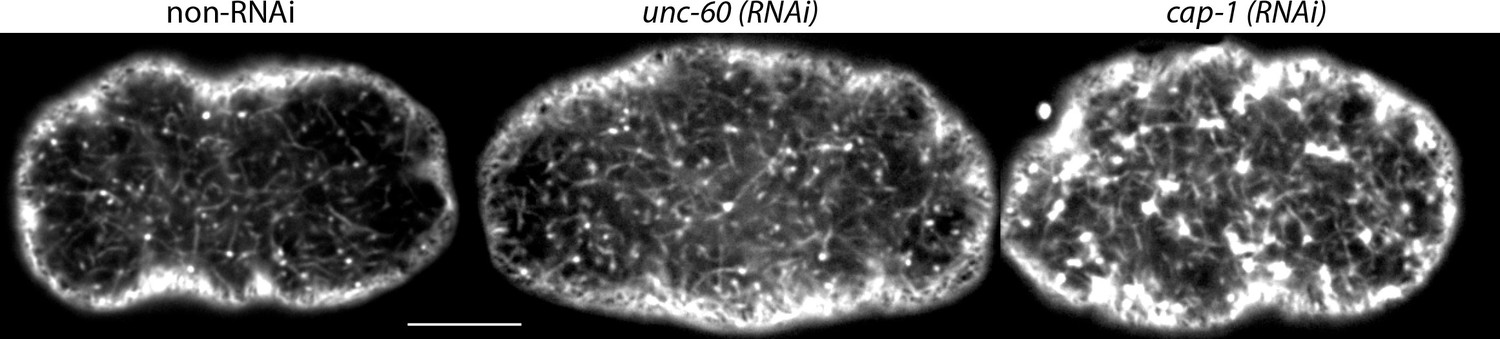
Cytoplasmic actin fluorescence.
SWG007 transgenic line was used to image cytoplasmic actin. A snapshot of the indicated knockdown was performed 2 µm deeper from the cortical region at the start of cortical flows and displayed. An increase in cytoplasmic actin fluorescence was observed in unc-60 and cap-1 (RNAi) conditions compared to the negative control, klp-1 (RNAi). Images are displayed in the same gray-scale dynamic range. Scale bar, 10 µm.
Figure 7—figure supplement 4
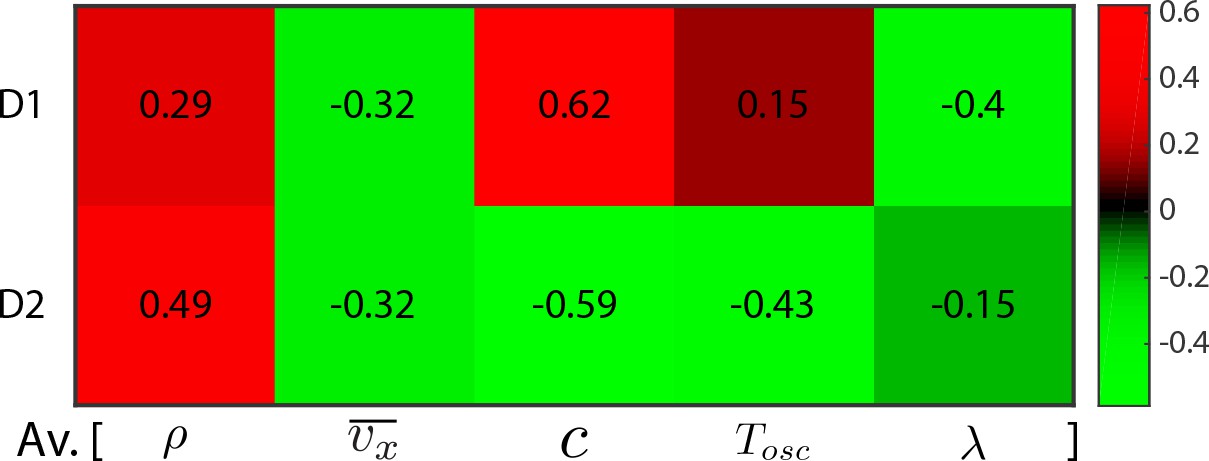
Correlation between quantifications and clustering dimensions.
Correlation between the five quantifications (foci density , AP velocity , chirality index , flow period , hydrodynamic length ) used for clustering and the two principal axes (D1, D2) in the dimensionally reduced data set are shown as a heat map. The Pearson’s linear correlation co-efficient is indicated in each heat map square.
Videos
Video 1
Phenotype - Fast AP flow: Comparison of cortical flow using TH455 transgenic line (NMY-2::GFP is visualized here) between the negative control, klp-1 (RNAi) and arx-1 (RNAi) and unc-59 (RNAi), which led to significantly faster anterior-directed flow velocities.
Movies were acquired with a 5 s frame interval and are being played 75x faster than real time. Scale bar, 10 µm.
Video 2
Phenotype - Fast chiral flow: Comparison of cortical flow using TH455 transgenic line (NMY-2::GFP is visualized here) between the negative control, klp-1 (RNAi) and nex-1 (RNAi) and csnk-1 (RNAi), which led to significantly faster chiral flow velocities.
Movies were acquired with a 5 s frame interval and are being played 75x faster than real time. Scale bar, 10 µm.
Video 3
Phenotype - Slow AP and chiral flow: Comparison of cortical flow using TH455 transgenic line (NMY-2::GFP is visualized here) between the negative control, klp-1 (RNAi) and cap-1 (RNAi), unc-60 (RNAi) and ani-1 (RNAi), which led to significantly slower anterior-directed as well as chiral flow velocities.
Movies were acquired with a 5 s frame interval and are being played 75x faster than real time. Scale bar, 10 µm.
Video 4
Phenotype - Short-range flow: Comparison of cortical flow using TH455 transgenic line (NMY-2::GFP is visualized here) between the negative control, klp-1 (RNAi) and cyk-1 (RNAi), plst-1 (RNAi) and pfn-1 (RNAi), which led to short-range flow.
Movies were acquired with a 5 s frame interval and are being played 75x faster than real time. Scale bar, 10 µm.
Video 5
Pulsatile flow: Cortical flow exhibits pulsatile characteristics in the posterior cortex.
Cortical flow acquired using TH455 transgenic line (NMY-2::GFP is visualized here for the negative control, klp-1 (RNAi)) with a 5 s frame interval. Movie is being played 25x faster than real time. Scale bar, 10 µm.
Additional files
-
Supplementary file 1
Table of ABPs and suppressor proteins.
ABPs and suppressor proteins that were tested as well as those that were discarded are compiled. Common names of the proteins, their orthologous C. elegans gene names, putative functions, number of hours of RNAi and the number of biological replicates performed for each knockdown are indicated. Star indicates ABPs that were also picked up in the suppressor screen previously performed in the Ahringer lab.
- https://doi.org/10.7554/eLife.37677.024
-
Transparent reporting form
- https://doi.org/10.7554/eLife.37677.025
Download links
A two-part list of links to download the article, or parts of the article, in various formats.
Downloads (link to download the article as PDF)
Open citations (links to open the citations from this article in various online reference manager services)
Cite this article (links to download the citations from this article in formats compatible with various reference manager tools)
Morphogenetic degeneracies in the actomyosin cortex
eLife 7:e37677.
https://doi.org/10.7554/eLife.37677


