Bim escapes displacement by BH3-mimetic anti-cancer drugs by double-bolt locking both Bcl-XL and Bcl-2
- Sunnybrook Research Institute, Canada
- University of Toronto, Canada
- McMaster University, Canada
Figures
Figure 1

ABT-263 does not displace Bim from binding to Bcl-XL.
(A) Live cell images of mCer3 and Venus intensities and intensity weighted FLIM images from FLIM-FRET measurements for the interaction between CBcl-XL and VBad. Higher magnification views are shown below with automatically identified Regions Of Interest (ROIs) outlined in yellow. Fluorescence lifetime images are presented in a continuous pseudo-color scale ranging from 3.0 to 4.3 ns. Intensity weighted fluorescence lifetime images were generated using ImageJ, both the contrast and gamma of the intensity image were adjusted so that the mitochondrial area can be easily visualized. Intensity weighted images are used only as an interpretive guide and were not used for any of the calculations reported. (B) Generation of binding curves. Data from more than 8,500 ROIs were binned according to the ratio of Venus to mCer3 intensities; mean (magenta dot) FLIM-FRET efficiency values for each bin were plotted versus the ratio of Venus to mCer3 intensity. The box encloses 50% of the data (25-75th percentiles), lines extend to the 10th and 90th percentiles and the number of ROIs in each bin (minimum 20) is indicated according to the scale at the right. The first bin is at zero and subsequent bins are separated by dotted lines. The means were fitted to a binding curve with a Hill slope for the interaction between CBcl-XL and VBad (blue line) with the 95% confidence interval for the optimal fit of the model to the data using GraphPad Prism shown (blue shaded area). (C) Structural alignment of ABT-263 with BH3 peptides (grey with h2 and h4 residues colored) from the complexes: Bcl-XL:Bim-BH3 (1PQ1, blue), Bcl-XL:Bad-BH3 (2BZW, red), and Bcl-XL:ABT-263 (4QNQ, yellow). ABT-263 and side chains of the key hydrophobic residues (h2 and h4) in the BH3 peptides are shown. (D–F) ABT-263 or mutation of h2 and h4 displaced VBad, VtBid but not VBimEL from CBcl-XL in MCF-7 cells. Binding curves for CBcl-XL and VBH3-proteins: (D) VBad, (E) VtBid, (F) VBimEL. The samples were untreated (black), DMSO solvent control (green), 20 μM ABT-263 (cyan), or BH3-2A mutation in the BH3-protein (red). Representative images are shown below as labeled. Scale bar 10 μm. Curves were generated by fitting the data to a Hill equation; line width shading indicates 95% confidence interval for the fit. Individual points are the average FLIM-FRET efficiencies in corresponding bins (n ranges from 20 to 3000 in each bin combined from three independent experiments as in (B). Cyan lines are truncated because at higher ratios of Venus to mCer3 there is sufficient free BH3-protein to kill the cells. In all figures FLIM-FRET binding curves as shown in Figure 1D–F and figure supplements were fitted from data pooled from three independent experiments. Individual points in FLIM-FRET binding curves indicate the average FLIM-FRET efficiencies in corresponding bins (the number of data points ranges from 20 to 3000 in each bin), the error bars indicate standard error of the mean, and the dotted shadowed area for each curve represents the 95% confidence interval for the fit of the binding curve with a Hill slope to the data as in (b).Truncation of some of the curves is due to a lack of sufficient data at high expression levels of the acceptor proteins. This can be due to induction of apoptosis by the expressed protein or to limited expression of the exogenous protein in the transient transfections.
-
Figure 1—source data 1
Source data fitted to Hill equations demonstrating that ABT-263 displaced tBid and Bad but does not displace Bim from binding to Bcl-XL.
- https://doi.org/10.7554/eLife.37689.004
Figure 2 with 4 supplements
with four supplements: The impact of small-molecule inhibitors and BH3-sequence mutations on the interactions between anti-apoptotic proteins and BH3-only pro-apoptotic proteins.
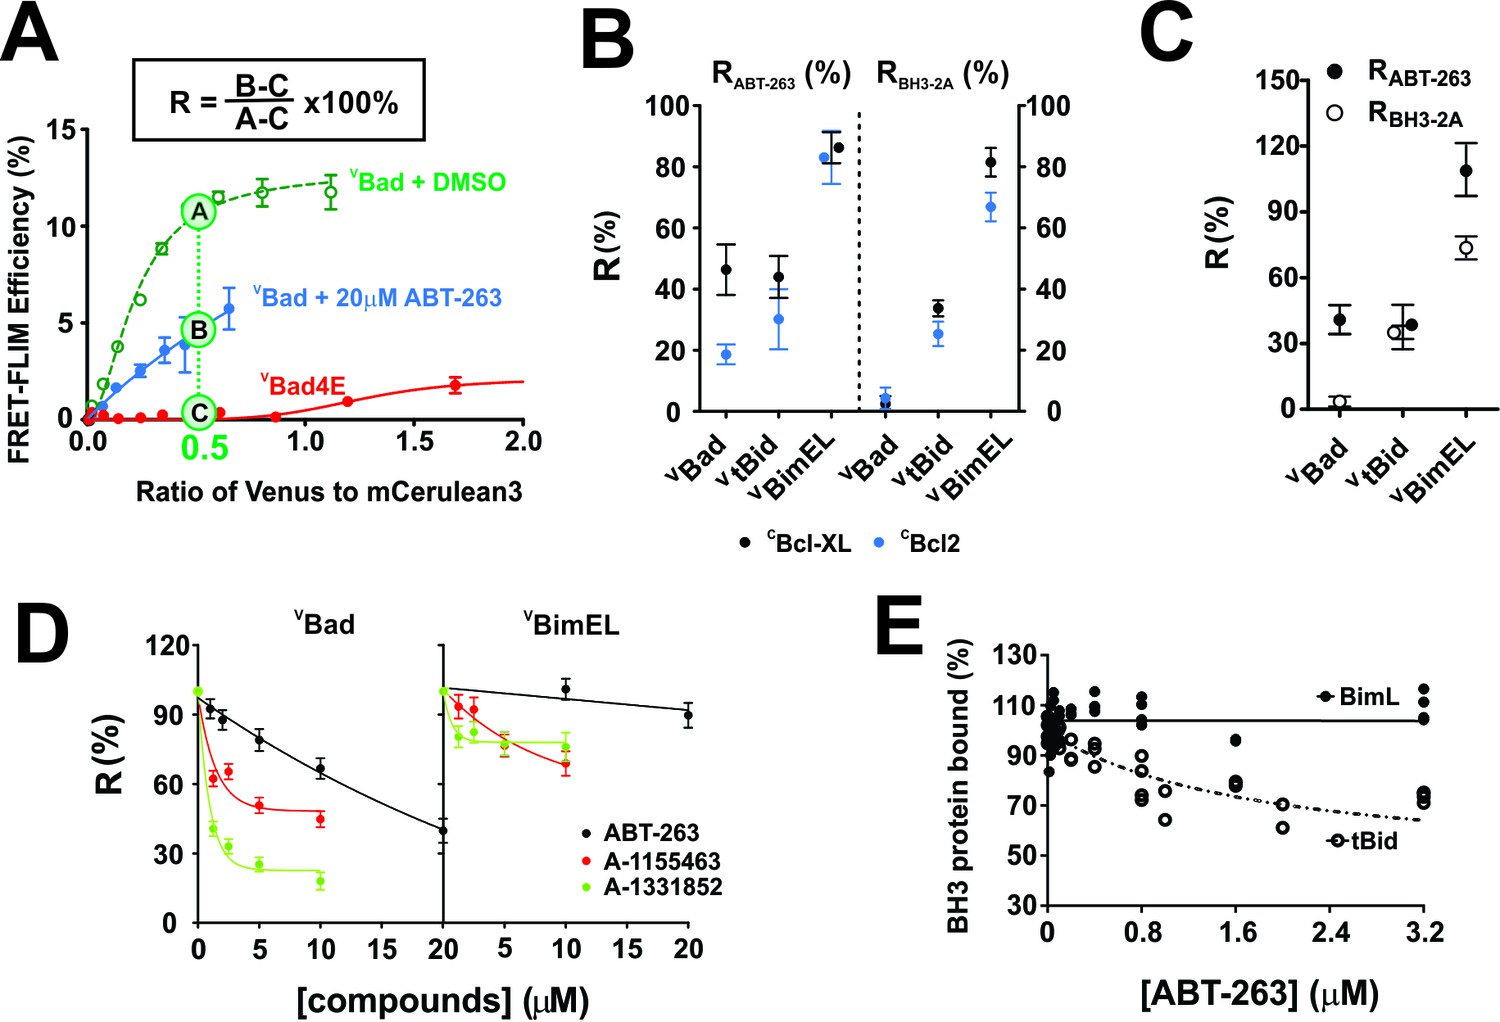
(A) Values of R can be used to define binding interactions from FLIM-FRET data. Sample calculation of RABT-263 for CBcl-XL:VBad binding in MCF-7 cells. To maximize the accuracy and dynamic range of the assay to quantify the impact of ABT-263 on the VBH3-proteins binding to CBcl-XL, we interpolated the FLIM-FRET efficiency from the fitted binding curves at an intensity ratio of Venus to mCer3 of 0.5 (points A, (B and C). The non-binding mutant VBad4E, in which h1, h2, h3 and h4 in the BH3 region were all mutated to glutamic acid, served as a control for FRET due to random collisions (red line, point C) and was subtracted from A and B as background. The signal remaining after the addition of ABT-263 (cyan line, point B) expressed as a percentage of the signal with DMSO added instead of the drug (green line, point A) is defined as RABT-263. (B) RABT-263 and RBH3-2A for binding of the indicated VBH3-proteins to CBcl-XL (black) from binding curves in shown in Figure 1and CBcl-2 (blue) in MCF-7 cells. RBH3-2A is calculated similarly to RABT-263 except the FLIM-FRET efficiency of the mutant is substituted for the value after adding ABT-263. Binned data, binding curves and sample images for Bcl-2 are shown in Figure 2—figure supplement 1. (C) The RABT-263 and RBH3-2A values for CBcl-XL:VBH3 proteins interactions in BMK-DKO cells. Binned data, binding curves and sample images are shown in Figure 2—figure supplement 2. Control experiments showing that the morphology changes that accompany cell death do not change the lifetime values determined by FLIM are shown in Figure 2—figure supplement 3. (D) Bcl-XL inhibitors displace VBad efficiently but VBimEL poorly from CBcl-XL in live cells. The dose-dependent inhibition curves due to the indicated concentrations of ABT-263 (black), and the Bcl-XL inhibitors A-1155463 (red) and A-1331852 (green) shown for CBcl-XL:VBad (left) and CBcl-XL:VBimEL (right) complexes in live MCF-7 cells. R values are ±95% confidence intervals from binned data and binding curves shown in Figure 2—figure supplement 4 (E) ABT-263 displaces tBid (10 nM) but not Bim (10 nM) from Bcl-XL (40 nM) in vitro. Percent of BH3 protein bound to Bcl-XL (BH3 bound %) measured by loss of FRET for Bcl-XL:tBid and Bcl-XL:Bim quantified for purified full-length dye labeled proteins incubated with liposomes and the indicated concentrations of drug. Data are from three experimental replicates, not all points are visible due to overlap. In all figures RABT-263 and RBH3-2A data points for Bcl-XL and Bcl-2 are black and blue respectively.
-
Figure 2—source data 1
Source data for the impact of small-molecule inhibitors and BH3-sequence mutations on the interactions between anti-apoptotic proteins and BH3-only pro-apoptotic proteins.
- https://doi.org/10.7554/eLife.37689.006
Figure 2—figure supplement 1
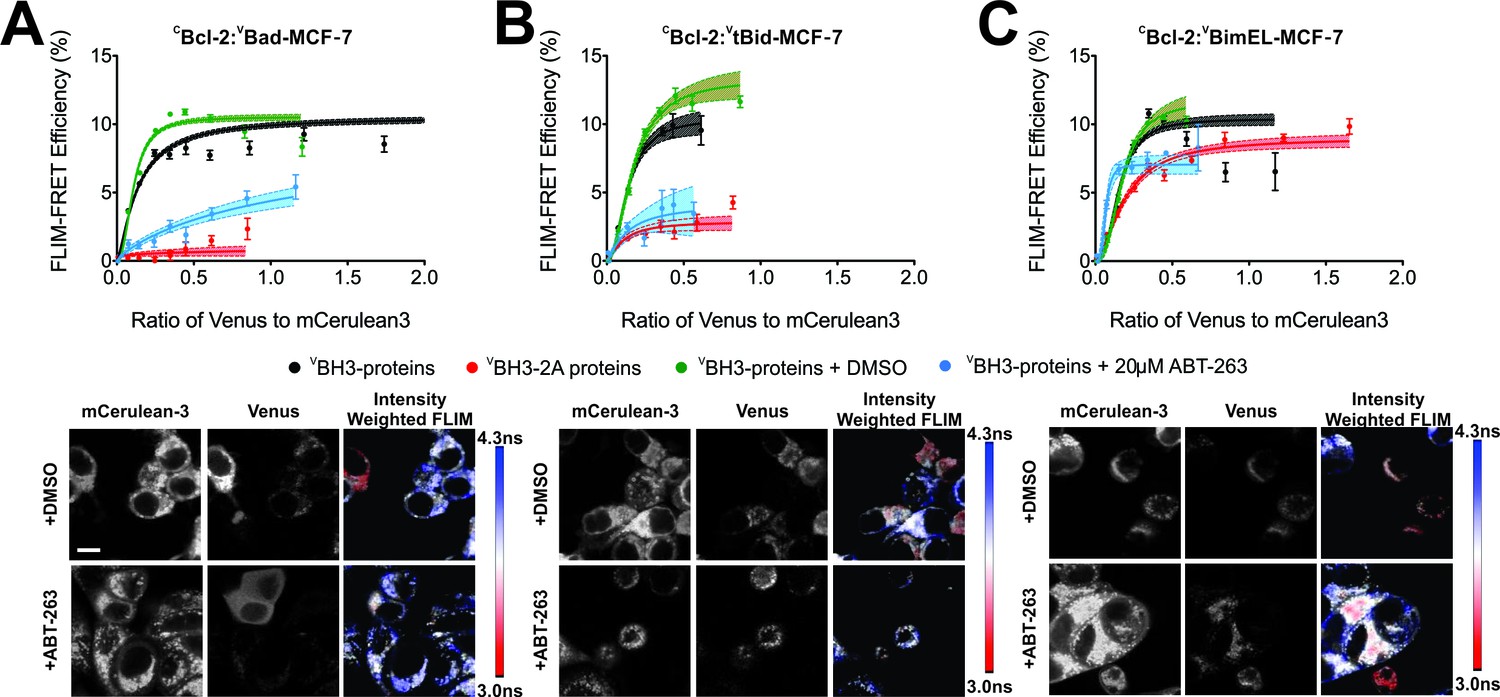
FLIM-FRET binding curves for Bcl-2 binding to BH3 proteins in MCF-7 cells.
(A–C) Both BH3-2A mutation and ABT-263 displace (A) VBad, (B) VtBid but not (C) VBimEL from CBcl-2 in MCF-7 cells. FLIM FRET binding curves are shown above representative images. Scale bar 10 μm. FLIM-FRET binding curves for protein pairs as indicated illustrate the extent of binding for untreated or DMSO treated controls (black and green, respectively), cells treated with 20 μM ABT-263 (blue) or cells expressing BH3-2A mutant BH3-proteins (red). Data points in FLIM-FRET binding curves correspond to the average FLIM-FRET efficiency for binned data (20 < cells/bin < 3,000). Error bars, SEM; shadowed area, 95% confidence interval for the best fit of the model to the data for each binding curve.
-
Figure 2—figure supplement 1—source data 1
Source data fitted to a Hill equation to generate FLIM-FRET binding curves for Bcl-2 binding to BH3 proteins in MCF-7 cells.
- https://doi.org/10.7554/eLife.37689.008
Figure 2—figure supplement 2
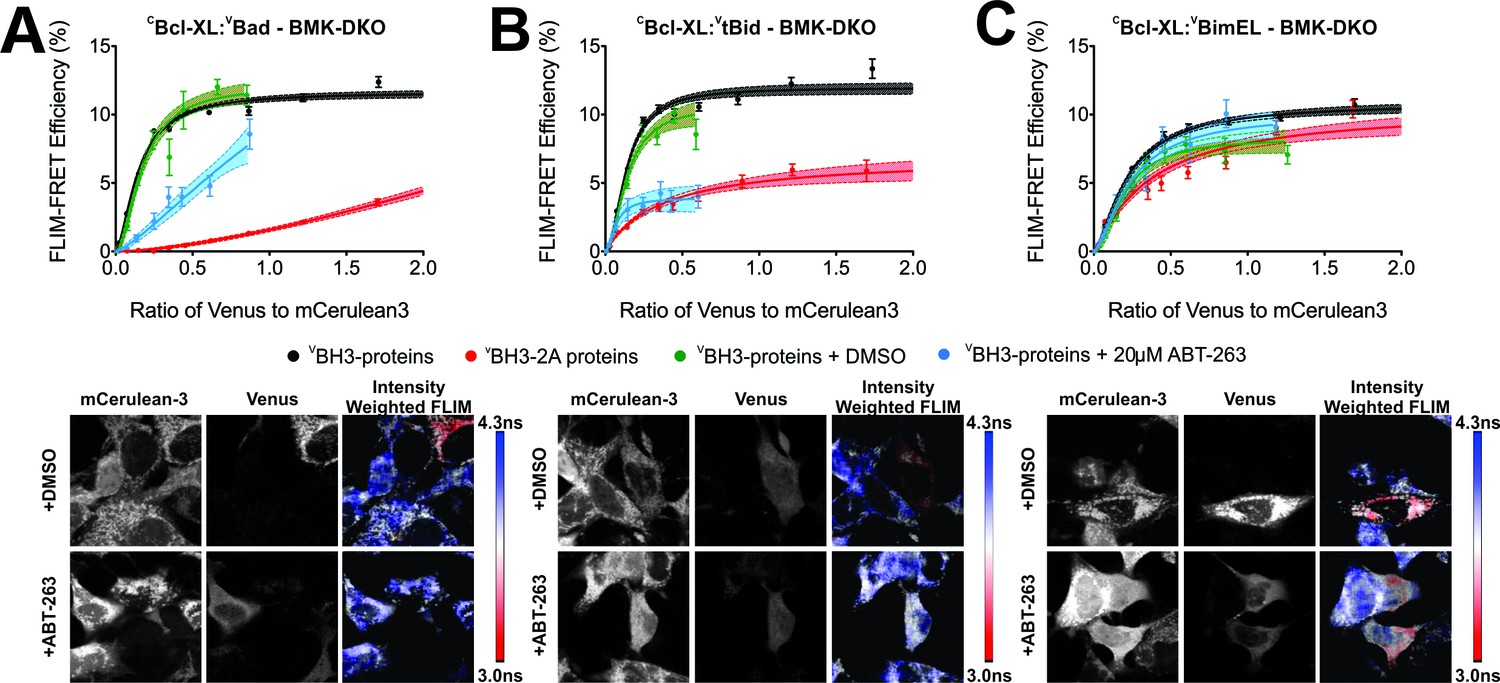
FLIM-FRET binding curves for Bcl-XL binding to BH3 proteins in BMK DKO cells.
(A–C) Both BH3-2A mutation and ABT-263 displace (A) VBad, (B) VtBid but not (C) VBimEL from CBcl-XL in BMK cells in which the genes for Bax and Bak have been deleted (DKO). FLIM FRET binding curves are shown above representative images. Scale bar 10 μm. FLIM-FRET binding curves for protein pairs as indicated illustrate the extent of binding for untreated or DMSO treated controls (black and green, respectively), cells treated with 20 μM ABT-263 (blue) or cells expressing BH3-2A mutant BH3-proteins (red). Data points in FLIM-FRET binding curves correspond to the average FLIM-FRET efficiency for binned data (20 < cells/bin < 3,000). Error bars, SEM; shadowed area, 95% confidence interval for the best fit of the model to the data for each binding curve.
-
Figure 2—figure supplement 2—source data 1
Source data fitted to a Hill equation to generate FLIM-FRET binding curves for Bcl-XL binding to BH3 proteins in BMK DKO cells.
- https://doi.org/10.7554/eLife.37689.010
Figure 2—figure supplement 3
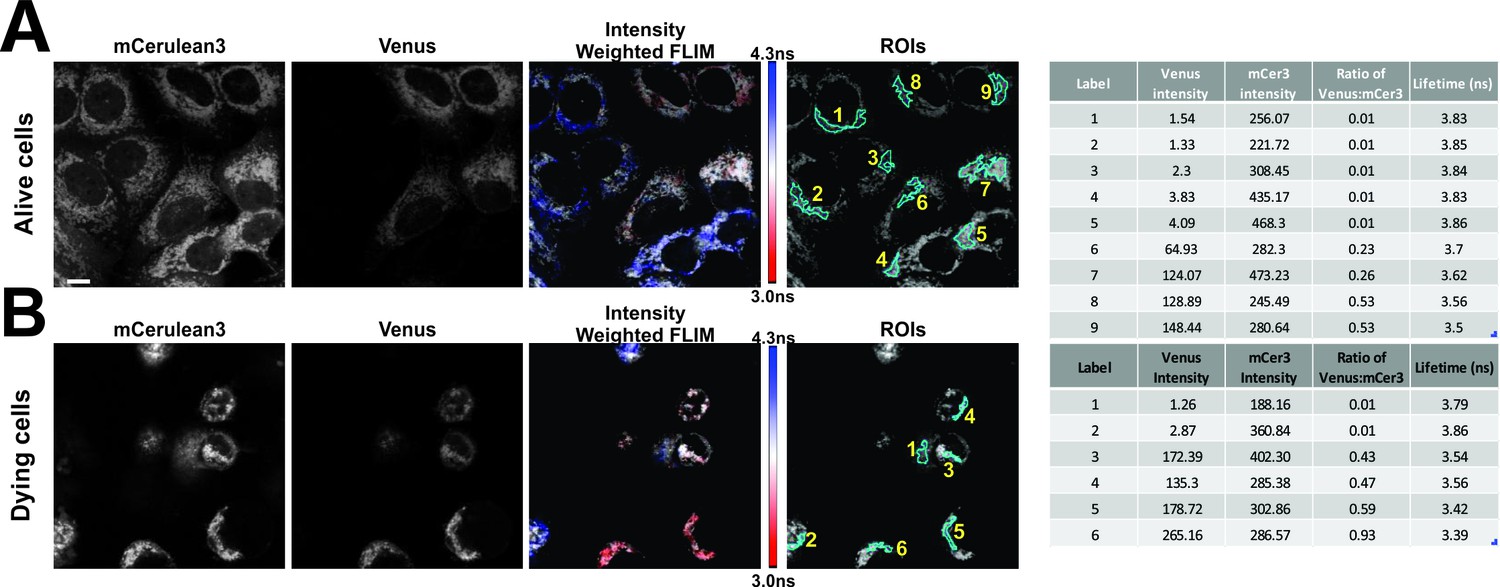
FLIM-FRET measurements for CBcl-XL binding to VBimEL-Bad in alive and dying MCF-7 cells.
Representative micrographs selected showing mCer3 and Venus intensities, Intensity weighted FLIM and selected regions of interest (ROIs) for (A) alive and (B) dying cells. Lifetime determinations for mCer3 for the identified ROIs are presented in tabular form at the left. Ch1 – Venus intensity, Ch2 – mCer3 intensity, ratio of Venus to mCer3 – ratio, Lifetime for ROI – Tau. MCF-7 overexpressing mCer3-Bcl-XL were transiently transfected to express vBimEL-Bad and after treatment with DMSO for >16 hr images of live cells were acquired by imaging adherent flat cells, dying cells (spherical) were imaged from a higher focal plane one hour later due to the time needed to acquire the first set of data.
Figure 2—figure supplement 4
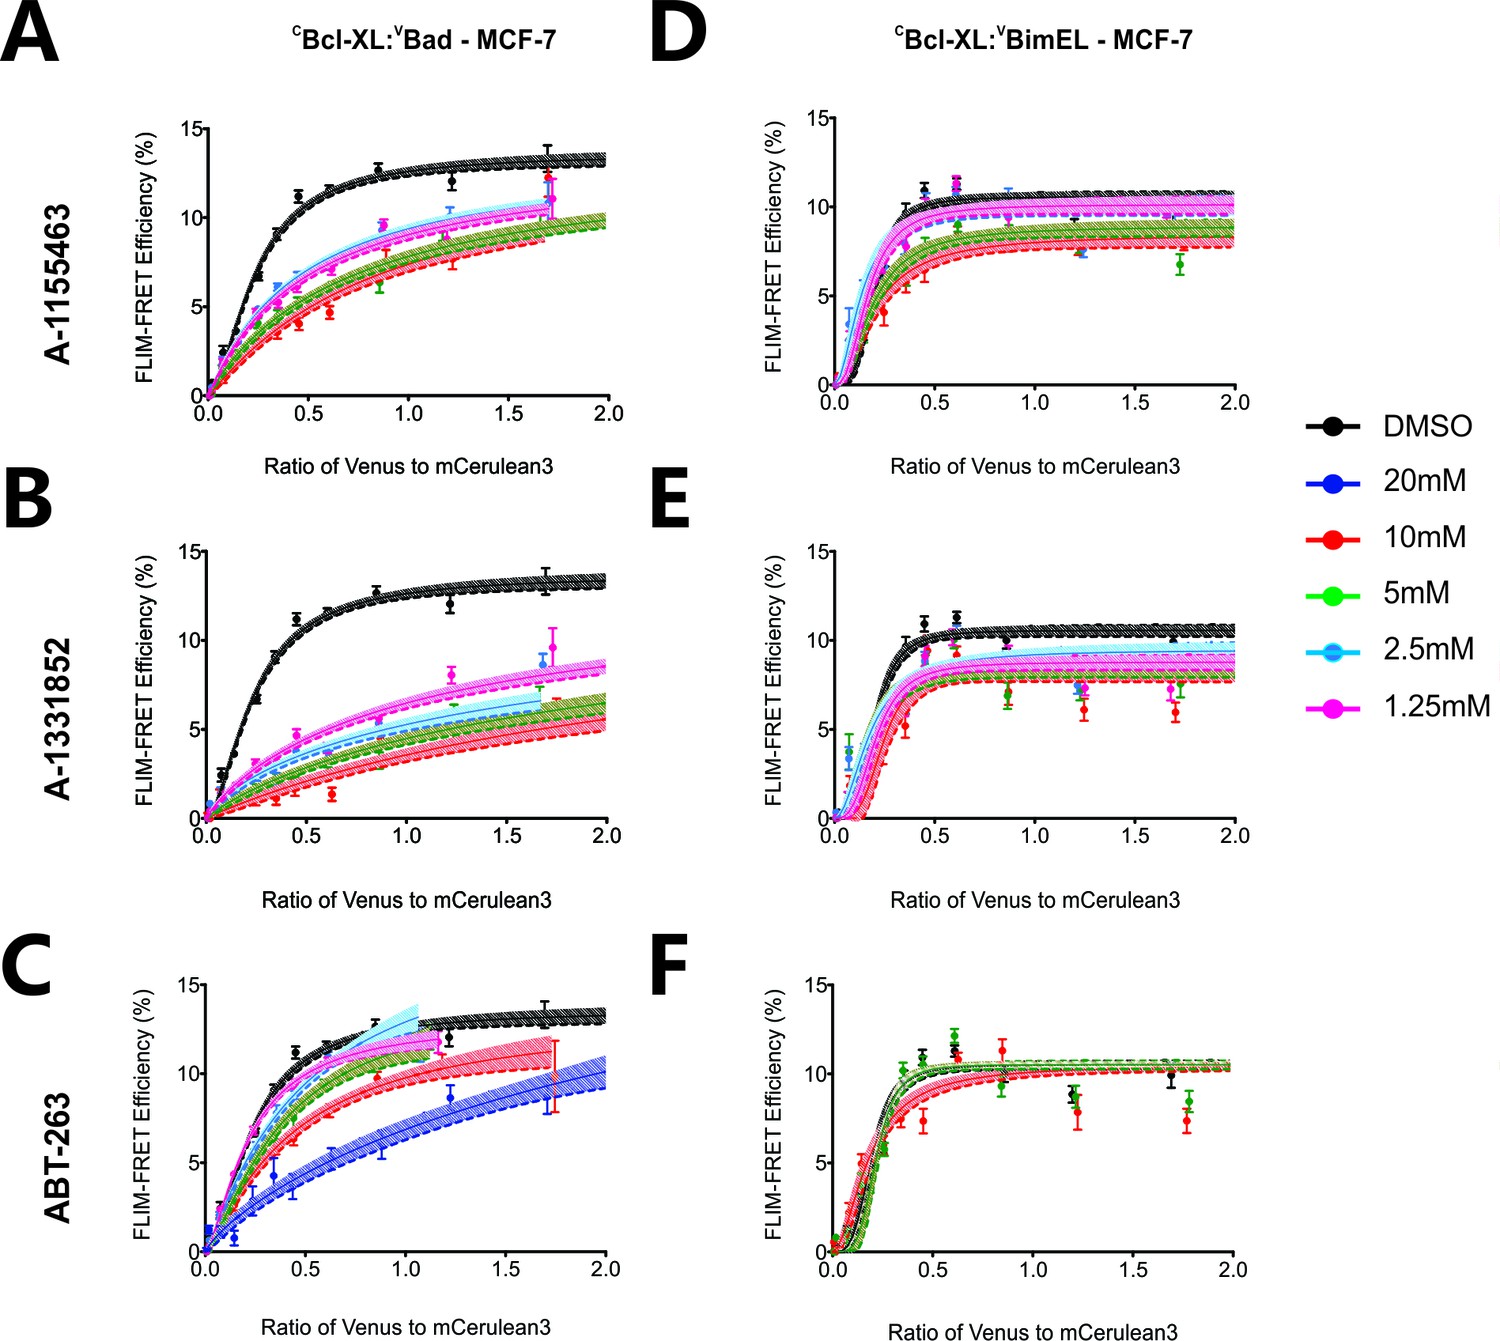
FLIM-FRET binding curves for VBad (left) and VBimEL (right) to CBcl-XL in MCF-7 cells in the presence of different concentrations of BH3-mimetics.
The curves illustrate the extent of binding for DMSO treated controls (black), or cells treated with 1.25 μM (pink), 2.5 μM (light blue), 5 μM (green), 10 μM (red), and 20 μM (dark blue) BH3-mimetics: (a and d) A-1155463, (b and e) A-1331852, and (c and f) ABT-263. Data points in FLIM-FRET binding curves correspond to the average FLIM-FRET efficiency for binned data (20 < cells/bin < 3,000). Error bars, SEM; shadowed area, 95% confidence interval for the best fit of the model to the data.
-
Figure 2—figure supplement 4—source data 1
Source data fitted to a Hill equation to generate FLIM-FRET binding curves for Bad and BimEL to Bcl-XL in MCF-7 cells.
- https://doi.org/10.7554/eLife.37689.013
Figure 3
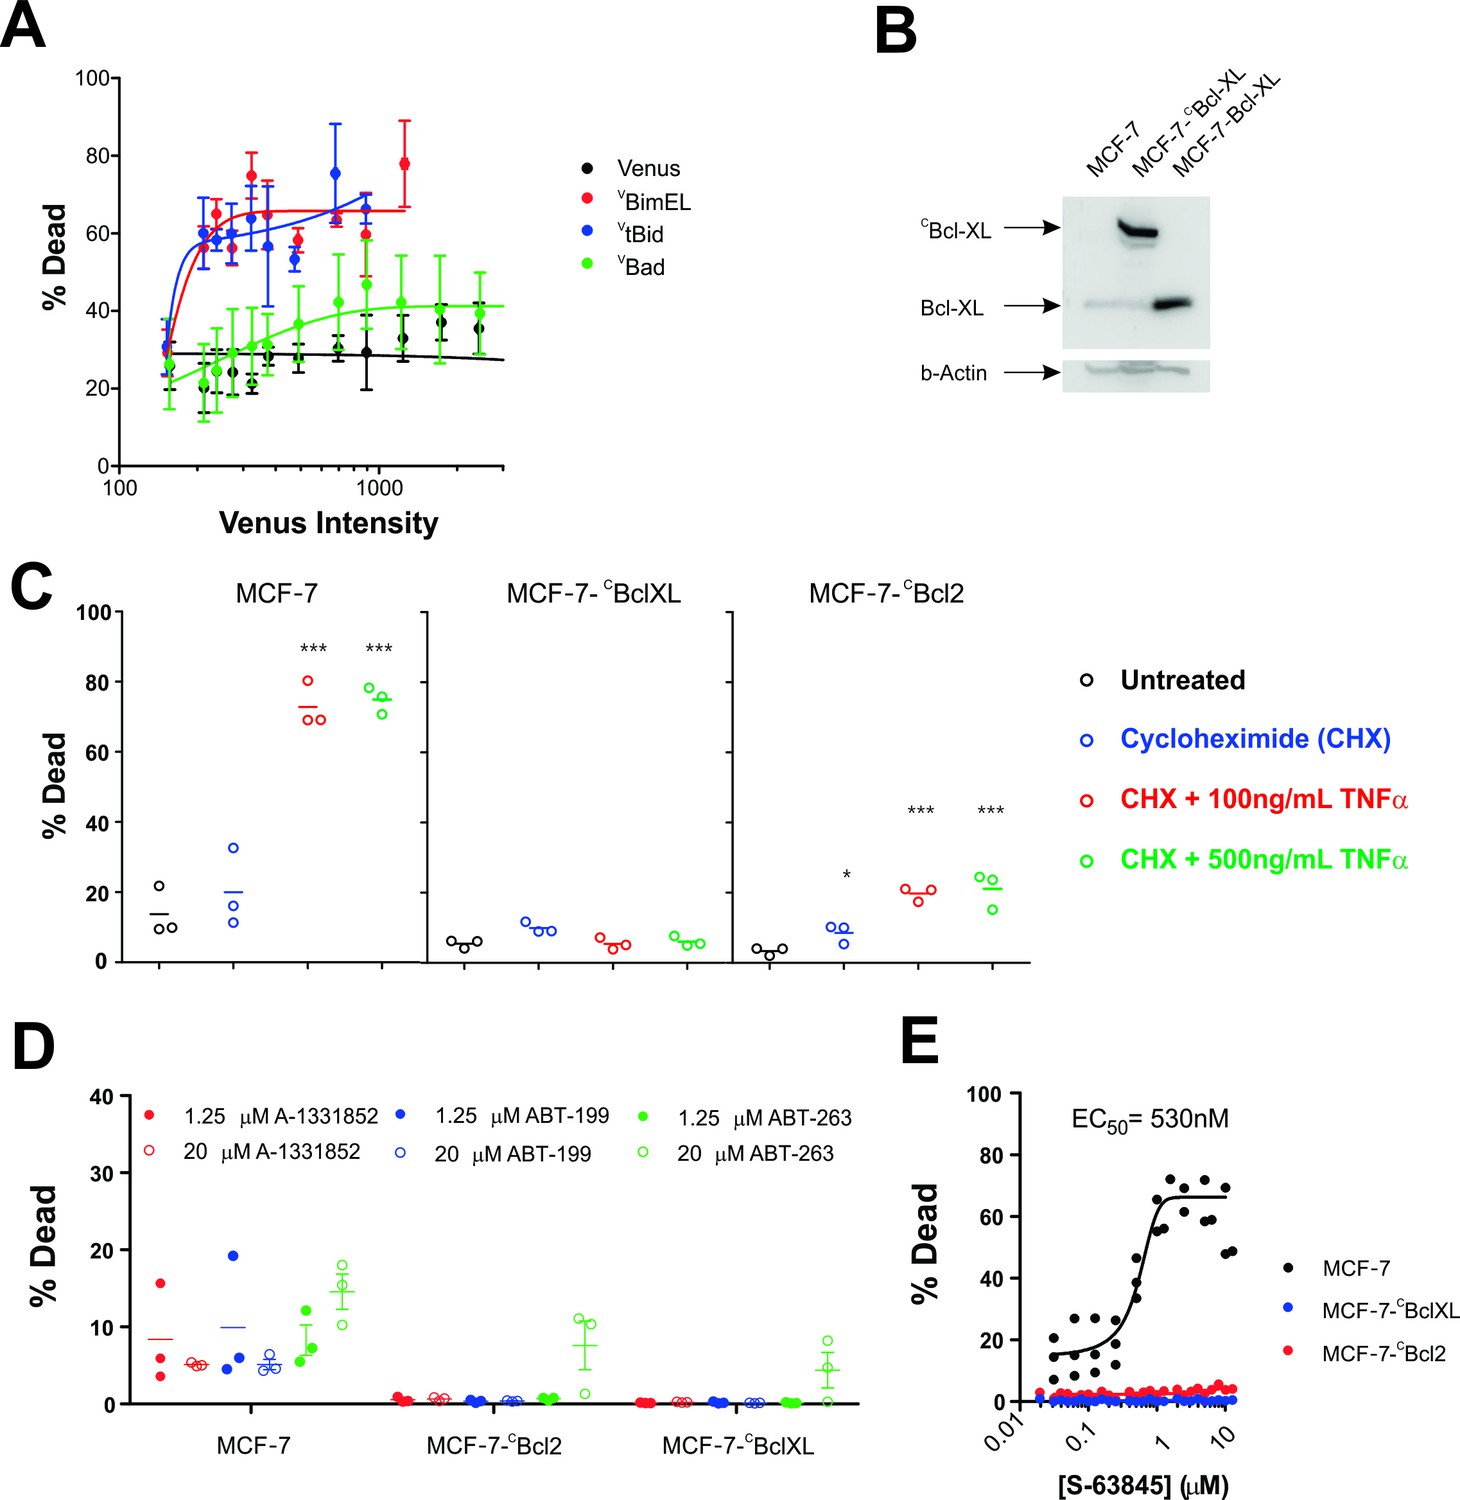
MCF-7 cells are killed by transient expression of BimEL or Bid, are protected by stably expressed Bcl-XL or Bcl-2 and depend on MCL-1 for survival.
(A) Transient expression of exogenous VtBid (blue) and VBimEL (red) killed MCF-7 cells. MCF-7 cells were largely resistant to expression of VBad (green) as the resulting cell death was similar to expression of the control protein Venus (black). Images of individual cells were assessed for apoptosis based on staining with TMRE and the nuclear dye DRAQ five using a multiparametric linear classifier. An increase in the percentage of cells scored as dead or dying (% Dead) as a function of Venus intensity demonstrated that the VtBid and VBimEL fusion proteins retain pro-apoptotic activity. Error bars indicate standard error for three independent replicates. At least 30 cells were analyzed at each point representing a Venus intensity bin. (B) Immunoblotting of lysates from MCF-7 cells (lane 1) and MCF-7 cells expressing exogenous CBcl-XL (lane 2) or Bcl-XL (Lane 3) with an antibody to Bcl-XL demonstrated that the exogenous proteins are at least 20-fold over-expressed compared to endogenous Bcl-XL. The same blot was probed for β-actin as a loading control. (C) Cells classified as dead or dying (% Dead) for 3 cell lines (MCF-7 and MCF-7 expressing either CBcl-XL or CBcl-2), treated with 2 µg/ml cyclohexamide (CHX), or CHX plus TNFα (250 ng/ml and 500 ng/ml) for 24 hr. Data (% Dead) for three independent replicates (circles) and the mean of the replicates (line) are plotted. A one-way ANOVA test was performed with a Dunnett's Multiple Comparison post-test (Graphpad Prism), to compare all treated wells with untreated controls for each cell line. (D) Overexpression of CBcl-2 and CBcl-XL protected cells from BH3-mimetics. Points represent the average percentage of cells classified as dead or dying (% Dead) for individual replicates, with the mean of the replicates indicated by a line. MCF-7 cells and MCF-7 cells expressing either Bcl-2 or Bcl-XL were treated with 1.25 µM (dot) and 20 µM (circle) ABT-199, A-1331852 or ABT-263 as indicated above. Neither selective nor dual inhibition of Bcl-2 and Bcl-XL induced substantial cell death in MCF-7 cell lines (all below 20% Dead) demonstrating these cells are not highly dependent on expression of either of these anti-apoptotic proteins. Nevertheless expression of Bcl-2 or Bcl-XL reduced cell death to barely detectable levels. (E) The MCL-1 inhibitor, S-63845 (Servier) kills MCF-7 (black), but does not kill MCF-7 CBcl-XL (blue) and MCF-7 CBcl-2 (red) cells. An EC50 value of 530 ± 6 nM, was calculated for MCF-7 cells in GraphPad Prism using a non-linear fit of normalized data on a log scale (log(agonist) verses response, and variable slope (four parameters)).
-
Figure 3—source data 1
Multiparametric source data for MCF-7 cell death in response to transient expression of BimEL or Bid and the protection afforded by stably expressed Bcl-XL or Bcl-2 and the dependence of MCF-7 cells on MCL-1 for survival.
- https://doi.org/10.7554/eLife.37689.016
Figure 4 with 1 supplement
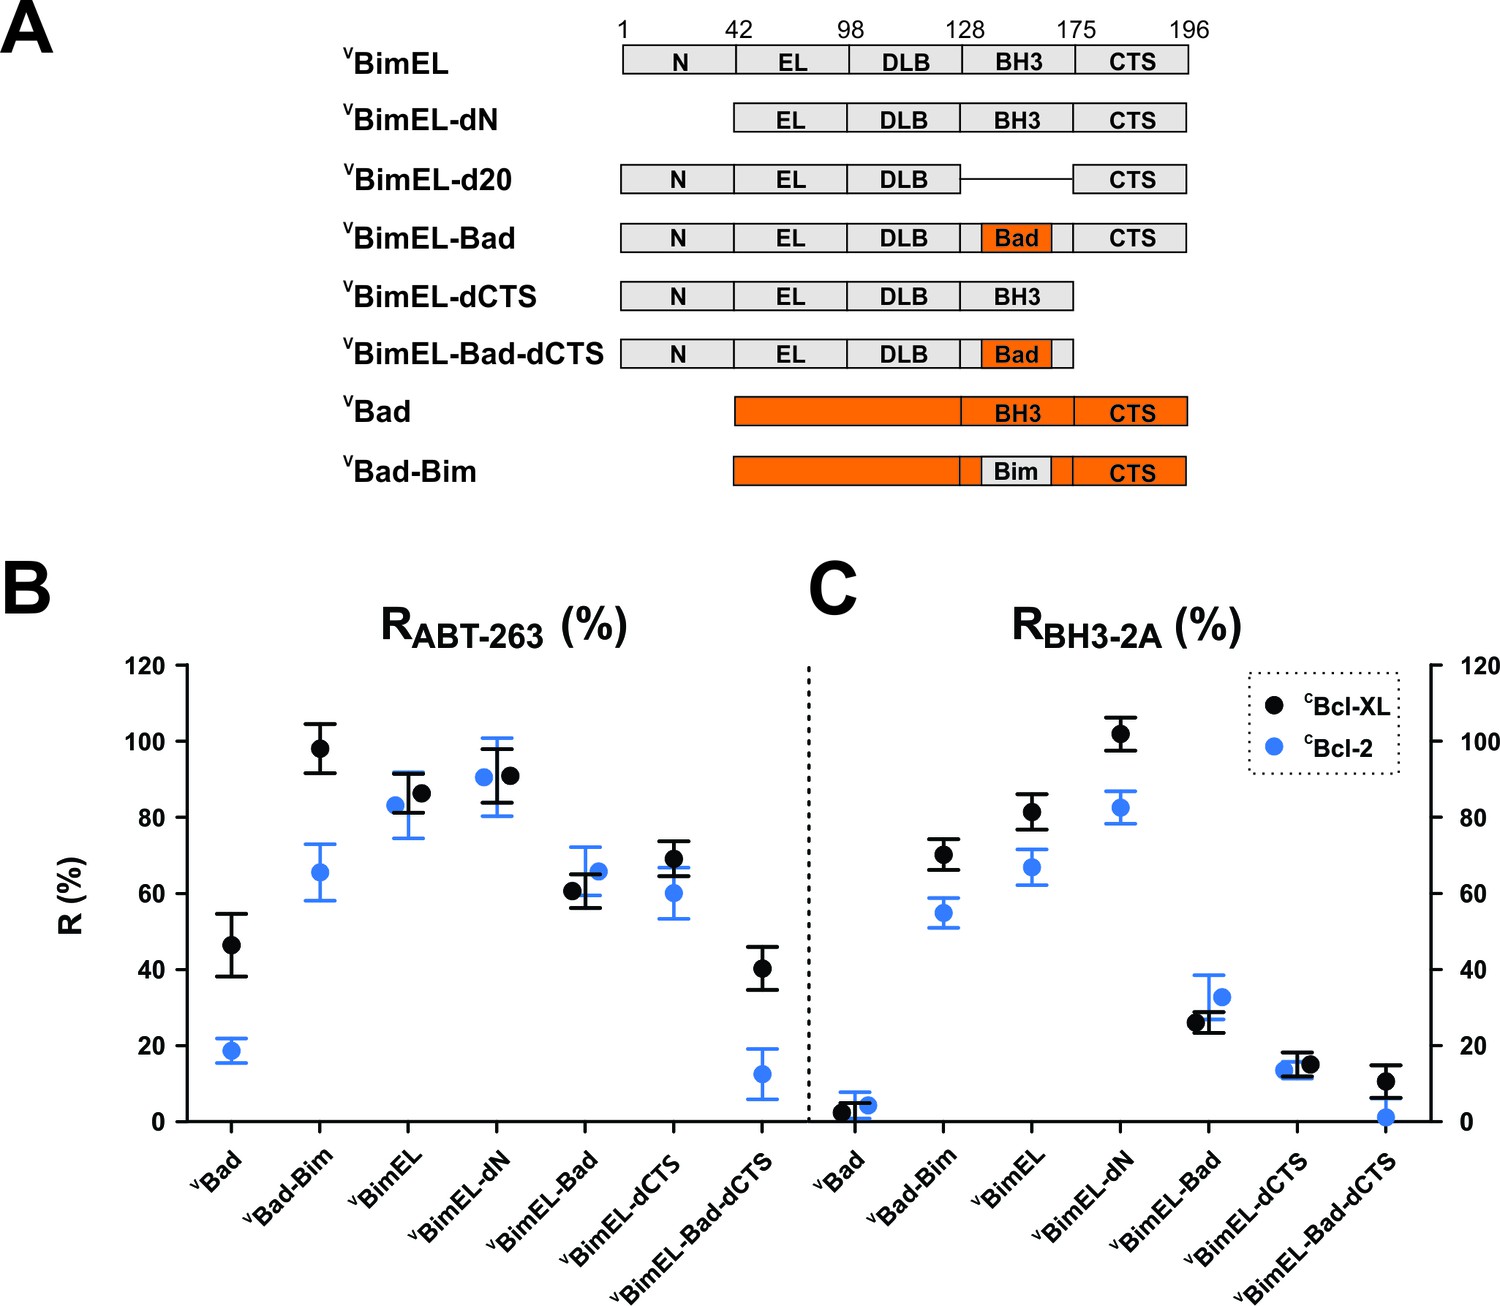
Resistance of CBcl-XL:VBimEL and CBcl-2:VBimEL complexes to ABT-263 is dependent on both the Bim BH3 and the Bim CTS.
(A) Stick diagrams for the different VBimEL constructs expressed in cells. (B) RABT-263 for CBcl-XL:VBH3-protein complexes (black) and CBcl-2:VBH3-protein complexes (blue). (C) RBH3-2A of CBcl-XL:VBH3-protein complexes (black) and CBcl-2:VBH3-protein complexes (blue). Data in (B) and (C) are mean ±95% confidence intervals calculated as in Figure 2 from FLIM-FRET binding curves shown in Figure 4—figure supplement 1. Data for VBad and VBimEL from Figure 2 are included to facilitate direct visual comparisons. All binding data are from Table 1.
-
Figure 4—source data 1
Source data for the calculation of R values for resistance of Bcl-XL:BimEL and Bcl-2:BimEL complexes to ABT-263 for the various mutant BH3 proteins.
- https://doi.org/10.7554/eLife.37689.018
Figure 4—figure supplement 1
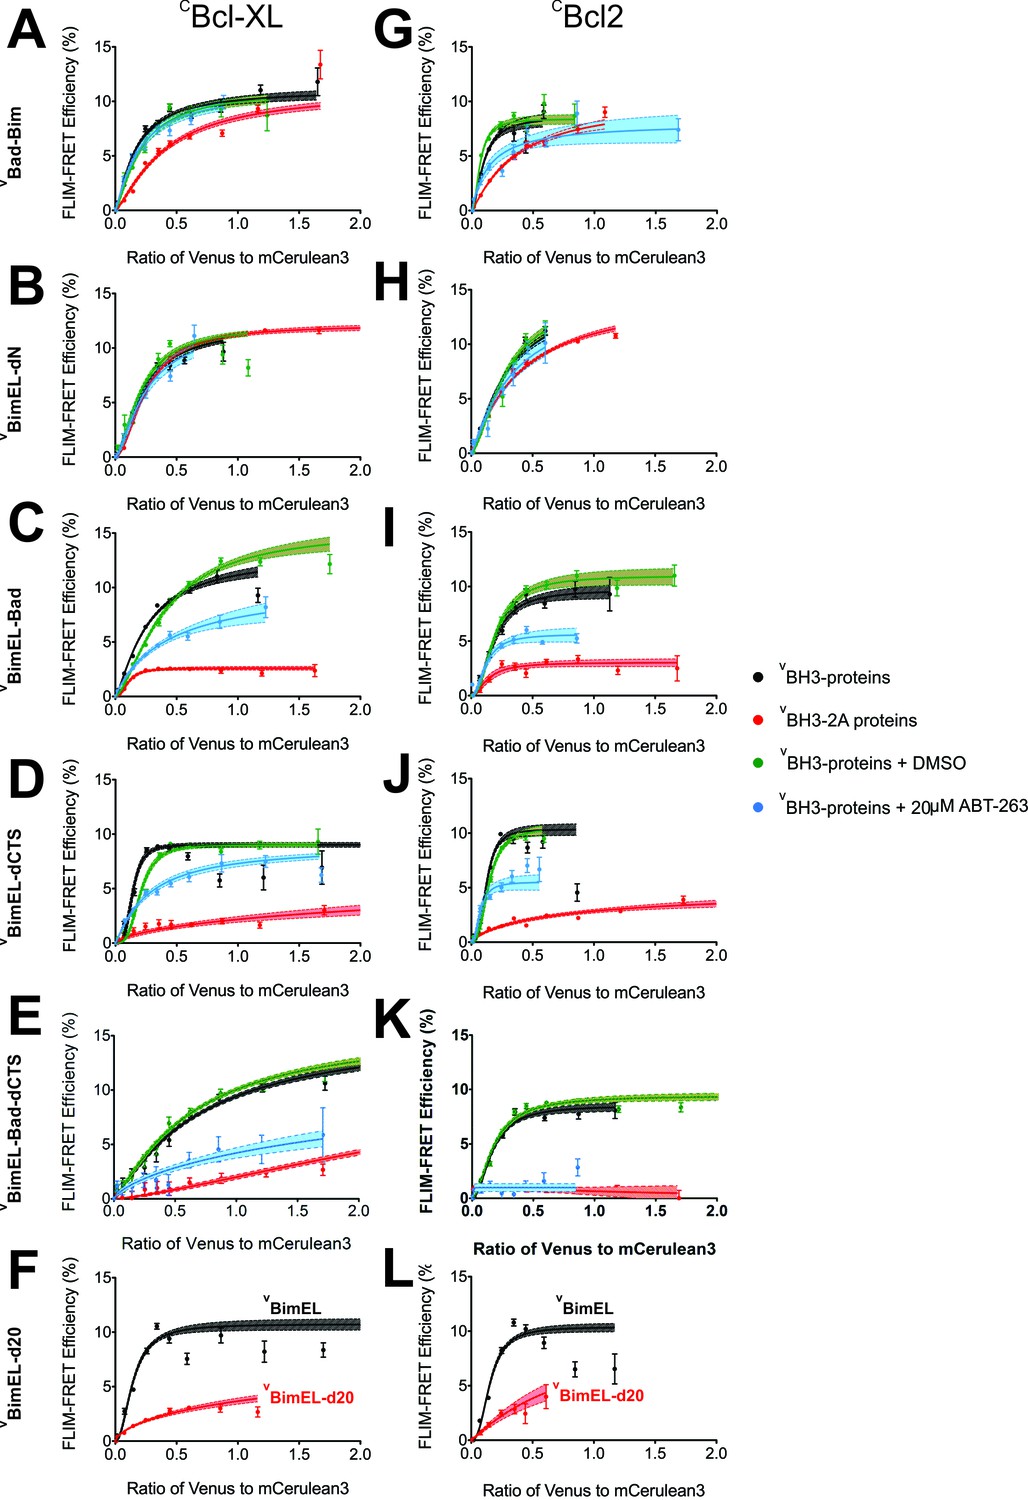
Mutations in the BH3 region and the Bim CTS impair Bim binding to Bcl-XL and Bcl-2.
FLIM-FRET binding curves for the proteins indicated to the left of each row and (A–F) CBcl-XL or (G–L) CBcl-2 in MCF-7 cells illustrate the extent of binding for untreated (black) or DMSO treated controls (green), cells treated with 20 μM ABT-263 (blue) or cells expressing BH3-2A mutant BH3-proteins (red). Data points in FLIM-FRET binding curves correspond to the average FLIM-FRET efficiency for binned data (20 < cells/bin < 3,000). Error bars, SEM; shadowed area, 95% confidence interval for the best fit of the model to the data.
-
Figure 4—figure supplement 1—source data 1
Source data fit to a Hill equation to determine how mutations in the BH3 region and the Bim CTS impair Bim binding to Bcl-XL and Bcl-2.
- https://doi.org/10.7554/eLife.37689.020
Figure 5
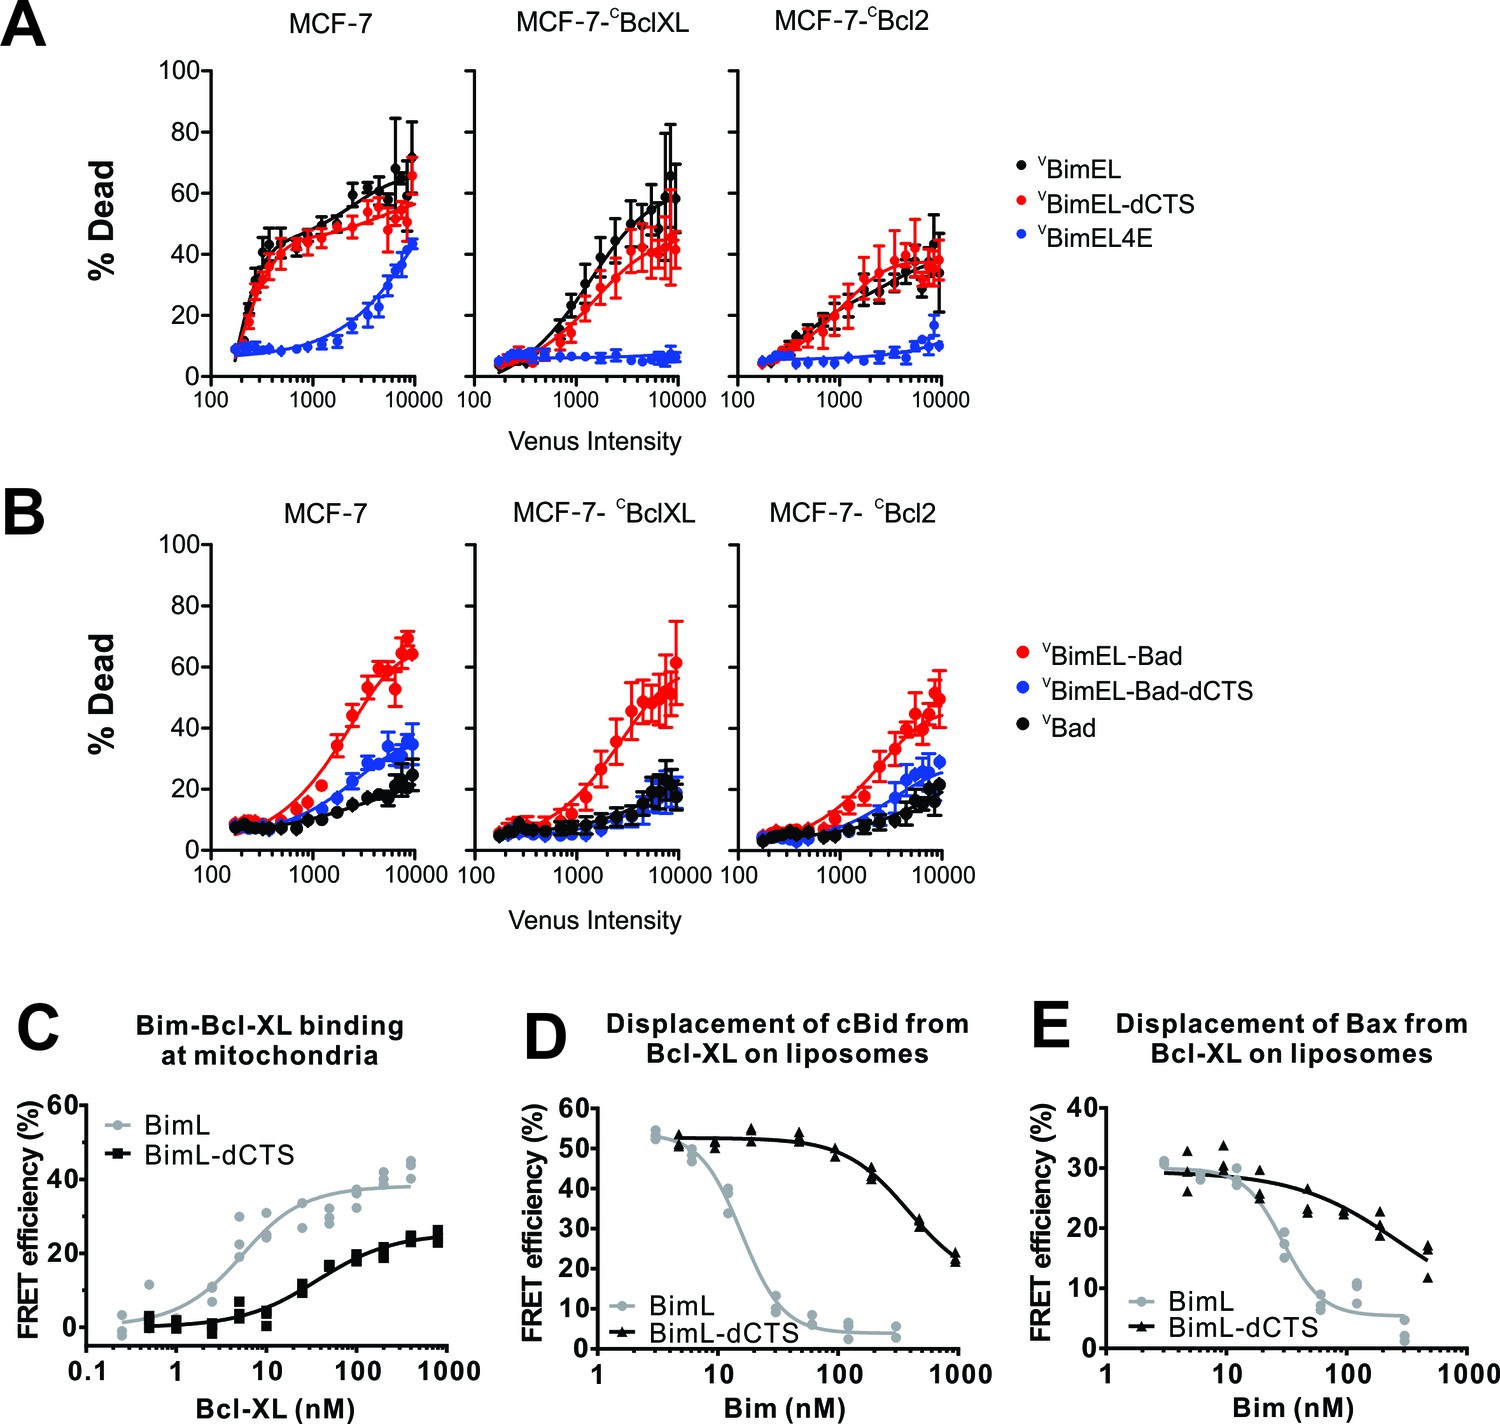
The CTS contributes to Bim mediated inhibition of Bcl-XL and Bcl-2.
The BH3-proteins indicated to the right of the panels were expressed by transient transfection in MCF-7 cells and MCF-7 cells stably expressing either CBcl-XL or CBcl-2, as indicated. Commitment to cell death (% Dead) was assessed for individual cells using a linear classifier trained on both cell and nuclear morphology and TMRE intensity. Venus intensity was used to estimate for individual cells the relative BH3 protein expression and to divide them into bins with similar expression levels. For each bin, the % of cells classified as dead or dying (% Dead) is represented by the means from three replicates (colored dots); bars indicate standard error of the means. (A) Transient expression of pro-apoptotic BH3 proteins killed MCF-7 cells in an expression level dependent manner that was inhibited by exogenous expression of CBcl-XL and CBcl-2 (black lines). Deletion of the CTS of BimEL did not inhibit induction of cell death resulting from expression of BimEL in all 3 cell lines (red lines). High level expression of BimEL-4E killed MCF-7 cells in a manner completely inhibited by exogenous expression of either anti-apoptotic protein (navy blue lines). (B) The BH3 protein VBimEL-Bad that is unable to bind MCL-1 has reduced cell killing activity in MCF-7 cells that depends on the BIM CTS sequence and is poorly inhibited by exogenous expression of Bcl-XL or Bcl-2. Expression level dependent cell death was equivalent for VBimEL-Bad-dCTS and Bad consistent with MCF-7 cells being protected by endogenous MCL-1. (C–E) Interactions of Bcl-XL with BimL, BimL-dCTS, tBid and Bax measured using FRET. Data from three independent experiments are shown as individual points, some of which are not visible due to overlap. (C) The CTS of BimL increases its affinity for Bcl-XL. Binding of 4 nM Alexa568-labeled BimL or BimL-dCTS to the indicated amounts of Alexa647-labeled Bcl-XL was measured by FRET in samples containing mouse liver mitochondria. The resultant apparent Kd values for binding to Bcl-XL by BimL and BimL-dCTS, 3 ± 1 nM and 35 ± 5 nM, respectively are both well below the concentrations of the proteins expressed in cells. (D) The CTS of BimL increases displacement of Bid from Bcl-XL. Binding of cBid to membranes displaces the N-terminal region and the remaining tBid portion containing the BH3 region binds to membranes and anti-apoptotic proteins. Complexes of Alexa568-labeled cBid (4 nM) and Alexa647-labeled Bcl-XL (10 nM) were formed in incubations containing 2.9 nM liposomes. Displacement of cBid from Bcl-XL was measured by loss of FRET between Alexa568-labeled cBid and Alexa647-labeled Bcl-XL upon addition of the indicated concentrations of BimL or BimL-dCTS. (E) The CTS of BimL increases displacement of Bax from Bcl-XL. Bim mediated displacement of Bax from Bcl-XL was measured as in (d) except that complexes between Bcl-XL and Bax were assembled from Alexa568-labeled Bax (10 nM), a Bid mutant that activates Bax but does not bind Bcl-XL (10 nM cBidmt1), Alexa647-labeled Bcl-XL (30 nM), 2.9 nM liposomes and the indicated concentrations of BimL or BimL-dCTS. Because in these reactions 30 nM Bcl-XL was required to bind 10 nM Bax saturably as opposed to the 10 nM Bcl-XL used in (d) the concentrations of BimL and BimL-dCTS needed to displace Bax are higher than for displacement of tBid in experiments with added cBid. The curves are further complicated because the displaced Bax can also bind to BimL and BimL-dCTS. Thus while these data demonstrate that both BimL and BimL-dCTS displace Bax from Bcl-XL the curves are difficult to interpret in terms of binding constants.
-
Figure 5—source data 1
Multiparametric cell death data for the mutants demonstrating that the Bim CTS contributes to Bim mediated inhibition of Bcl-XL and Bcl-2.
- https://doi.org/10.7554/eLife.37689.022
Figure 6 with 1 supplement
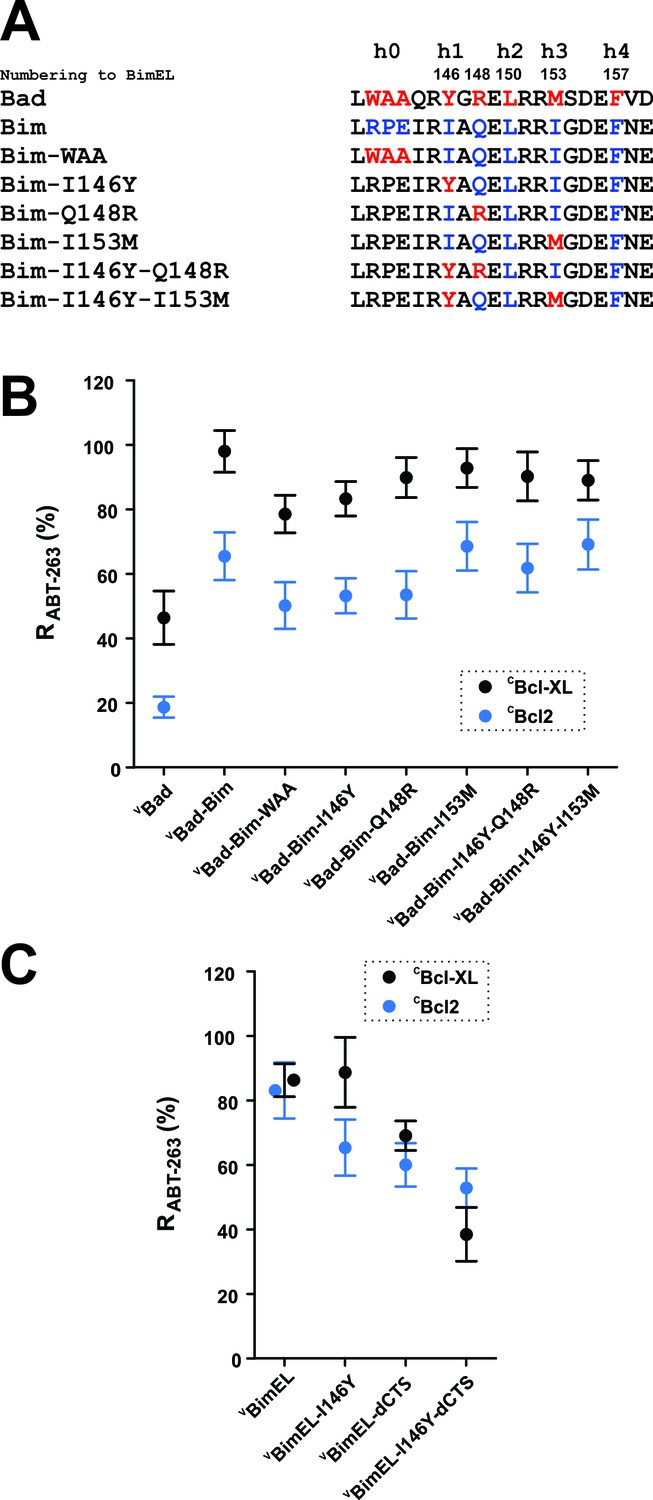
h0 and h1 residues in the Bim BH3 contribute to the resistance of Bcl-XL:Bim complexes to ABT-263.
(A) Sequence alignment of the BH3 regions of Bad and Bim and the sequences of VBad-Bim mutants, residues from Bad (red), Bim (blue). (B) Identification of conserved hydrophobic residues in the Bim BH3 that contributed to RABT-263 for CBcl-XL:VBad-Bim (black) and CBcl-2:VBad-Bim (blue) complexes. The RABT-263 values of CBcl-XL:VBad-Bim and CBcl-2:VBad-Bim complexes from Figure 4b and Table 1 were included to facilitate direct comparison. (C) The BH3 h1 residue I146 contributes to Bim binding to Bcl-2 and Bcl-XL. Substitution of I146 with the corresponding residue from Bad (BimEL-I146Y) decreased RABT-263 for CBcl-XL: VBimEL/VBimEL-dCTS (black) and CBcl-2:VBimEL/VBimEL-dCTS (blue) complexes. Data are mean ±95% confidence intervals calculated from FLIM-FRET binding curves shown in Figure 6—figure supplement 1.
-
Figure 6—source data 1
Source data for the calculation of R values for mutants demonstrating that the h0 and h1 residues in the Bim BH3 contribute to the resistance of Bcl-XL:Bim complexes to ABT-263.
- https://doi.org/10.7554/eLife.37689.024
Figure 6—figure supplement 1
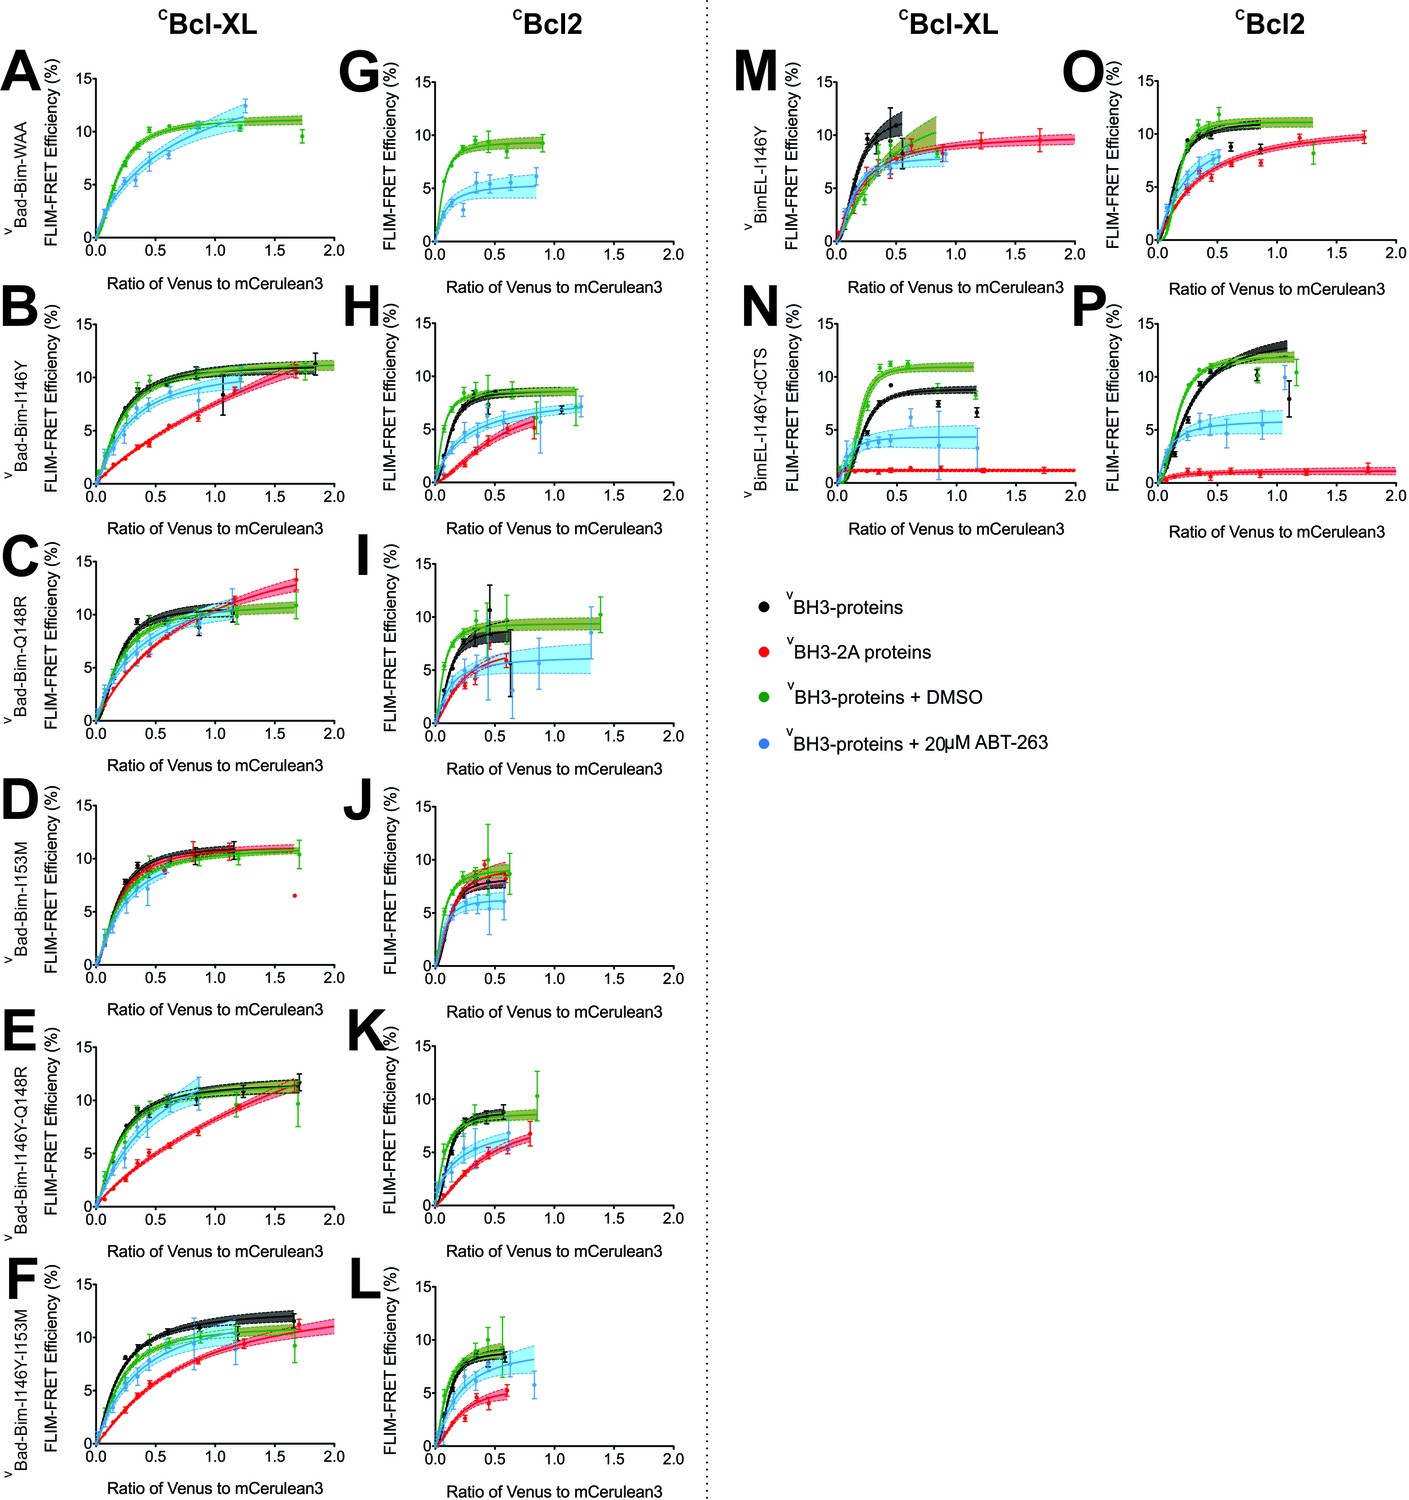
The h0 and h1 residues in the Bim BH3 region contribute to the resistance of Bcl-XL:Bim and Bcl-2:Bim complexes to ABT-263.
(A–L) Binding of VBad-Bim chimeric proteins to CBcl-XL (left) and CBcl-2 (right) in MCF-7 cells. The VBad-Bim chimeric proteins are comprised of VBad with the BH3 region replaced with the corresponding region from Bim. Additional point mutations in the Bim BH3 region are indicated to the left of each pair of panels. (M–P) Impact of I146 on the binding of VBimEL or VBimEL-dCTS to CBcl-XL (left) and CBcl-2 (right) in MCF-7 cells. Additional point mutations in VBimEL are indicated to the left of each pair of panels. The binding curves illustrate the extent of binding of untreated (black) and DMSO treated (green) controls, cells treated with 20 μM ABT-263 (blue) or additional BH3-2A mutation (red). Data points in FLIM-FRET binding curves correspond to the average FLIM-FRET efficiency for binned data (20 < cells/bin < 3,000). Error bars, SEM; shadowed area, 95% confidence interval for the best fit of the model to the data.
-
Figure 6—figure supplement 1—source data 1
Source data fitted to a Hill equation to determine the extent to which residues in the Bim BH3 region contribute to the resistance of Bcl-XL:Bimand Bcl-2:Bim complexes to ABT-263.
- https://doi.org/10.7554/eLife.37689.026
Figure 7 with 1 supplement

The Bim CTS binds to Bcl-XL and Bcl-2 independent of binding to membranes (A) Sequence alignment for the Bim CTS and mutants.
Bim h1-h4, red; arginine residues within the CTS, green; substitutions, blue; numbering is for BimEL. (B) Selected images showing sub-cellular localization of VBimEL-mutants compared to MitoTracker. The scale bar represents 10 μm. (C) Bim binding to Bcl-XL and mitochondria by the Bim CTS are independent. Co-localization (Pearson’s r) for Venus and MitoTracker-Red signals (Red bars), where average ±SEM was calculated using mean Pearson’s r values determined in three independent replicates. At least 150 transiently transfected cells were analyzed across replicates. RABT-263 of CBcl-XL:VBimEL-mutant complexes (black) or CBcl-2:VBimEL-mutant complexes (blue). Data are mean ±95% confidence intervals calculated from FLIM-FRET binding curves shown in Figure 7—figure supplement 1. VBimEL (from Figure 1) and VBim-CTS2A mutant complexes have similar high RABT-263 values although mitochondrial localization for VBim-CTS2A is impaired. VBimEL-L185E, VBimEL-I188E, VBimEL-V192E and VBim-CTS2A are all poorly localized at mitochondria yet have increasing RABT-263 values. (D–E) BimL binding to Bcl-XL is improved by binding to membranes but most resistance to ABT-263 is due to Bim CTS dependent binding to Bcl-XL. Purified Bcl-XL and BimL protein binding in the presence of different concentrations of ABT-263 quantified in vitro using purified full-length proteins with (D) and without (E) liposomes. Control experiments demonstrating efficient binding of BimL to liposomes and Bcl-XL binding data for the Bim mutants are presented in the companion paper (Chi et al., 2019). Data are mean ±SD (n = 3 independent experiments). (F) Mutation of BimEL-L185 to E reduced RABT-263 for CBcl-XL:VBimEL (black) and CBcl-2:VBimEL (blue) complexes. However, additional mutation of I146 did not further reduce RABT-263. Data are mean ±95% confidence intervals calculated from FLIM-FRET binding curves shown in Figure 7—figure supplement 1.
-
Figure 7—source data 1
Source data for the experiments demonstrating that the Bim CTS binds to Bcl-XL and Bcl-2 independent of binding to membranes.
- https://doi.org/10.7554/eLife.37689.028
Figure 7—figure supplement 1

Mutations in the Bim CTS reduce the affinity of binding to Bcl-XL and Bcl-2.
(A–L) FLIM-FRET data for CBcl-XL (left) and CBcl-2 (right) binding to the VBimEL mutants indicated to the left of the panels. Untreated and DMSO treated controls, black and green, respectively. Cells treated with 20 μM ABT-263, blue. Data points in FLIM-FRET binding curves correspond to the average FLIM-FRET efficiency for binned data (20 < cells/bin < 3,000). Error bars, SEM; shadowed area, 95% confidence interval for the best fit of the model to the data.
-
Figure 7—figure supplement 1—source data 1
Source data fitted to a Hill equation to quantify the effects of the indicated mutations in the BimCTS on binding affinities for Bcl-XL and Bcl-2.
- https://doi.org/10.7554/eLife.37689.030
Figure 8
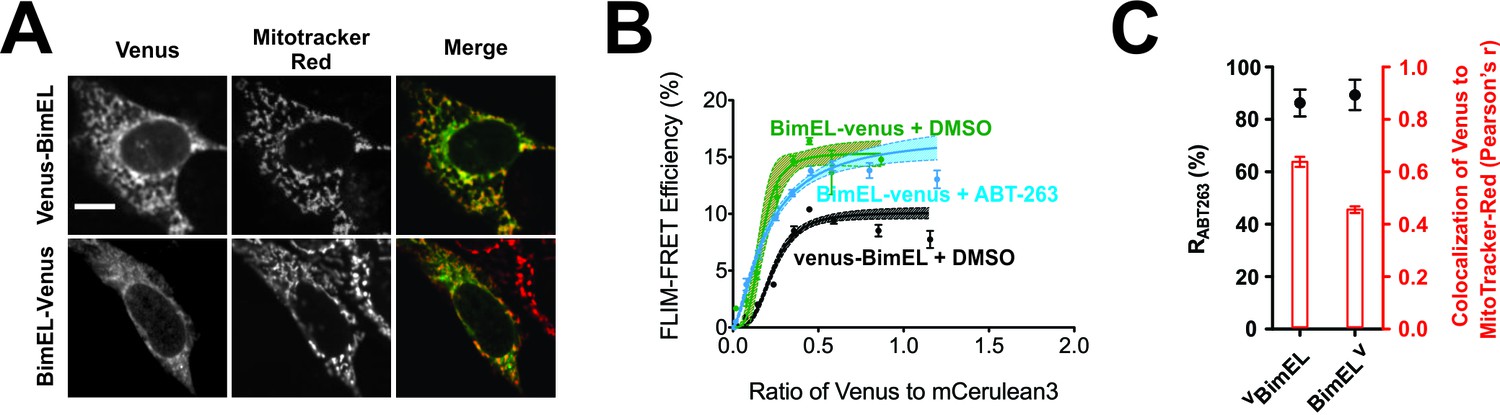
Bim CTS binds with non-transmembrane topology to cellular membranes.
(A) Selected images for sub-cellular localization of VBimEL and BimELV in BMK-DKO cells compared to MitoTracker. The scale bar represents 10 µm. (B) In live cells CBcl-XL binding to BimELV is resistant to ABT-263. FLIM-FRET binding curves for the interactions between CBcl-XL and BimELV in ABT-263 (blue) or DMSO (green) treated BMK-DKO cells expressing CBcl-XL. Binding of CBcl-XL to VBimEL (black) measured in the same three experiments is shown for comparison. Data from ROIs from three independent experiments were combined and used to generate binding curves with 95% confidence intervals as in Figures 1 and 2. (C) Sub-cellular localization of BimELV is impaired compared to VBimEL but ABT-263 resistant binding to CBcl-XL (RABT-263) is unchanged. Colocalization for Venus and MitoTracker-Red was measured in this experiment for manually selected regions of interest from transiently transfected cells expressing VBimEL or BimELV (Pearson’s r, red); Error bars, SEM, n > 30 cells. RABT-263 of CBcl-XL:VBimEL or CBcl-XL:BimELV complexes, black dots. Data are mean ±95% confidence intervals calculated from FLIM-FRET binding curves shown in panel b.
-
Figure 8—source data 1
Source data fitted to a Hill equation demonstrating that BimEL-venus undergoes FRET with mCer3-Bcl-XL.
- https://doi.org/10.7554/eLife.37689.032
Figure 9 with 2 supplements

The Bim CTS binds to the cytoplasmic surface of membranes enabling concomitant binding to Bcl-XL (A–I) Interaction of the Bim CTS with liposomes and Bcl-XL measured using purified recombinant BimL protein.
The amino-acids and positions above the panels indicate the residues in BimL exchanged for single-cysteines for labeling with NBD (numbering for BimEL, subtract 56 for BimL numbering). Top row, (A,D,G) NBD fluorescence changes in response to the addition of (A) Bcl-XL (green), (D) liposomes (red), (G) Bcl-XL and liposomes (black). Larger numbers indicate increased hydrophobicity of the environment of the NBD dye. Middle row, (B,E,H) iodide quenching constants (KSV) for the same mutants and binding partners as above. Smaller KSV values indicate protection from iodide. Data are mean ±95% confidence intervals for linear fitting of the data as shown for exemplar raw quenching data, in Figure 9—figure supplement 1. Lower row, (C,F,I) illustrations of possible interactions of the Bim CTS based on the data above each. (J) Substitution of the L at position185 of BimEL with a charged residue abolishes resistance to ABT-263 while hydrophobic residues are tolerated. RBH3-2A for CBcl-XL:VBimEL complexes from FLIM-FRET binding curves shown in Figure 9—figure supplement 2 were calculated as in Figure 2. Data are mean ±95% confidence intervals for fit of the binding model. (K) Schematic model of the double-bolt locked Bcl-XL:Bim:membrane complex. Bcl-XL, cyan; Bim, purple; membrane, orange. The BH3 region of Bim engages the hydrophobic groove of Bcl-XL. The Bim CTS adopts a conformation in which the two ends bind to the membrane and the central region, particularly residue 185, binds to Bcl-XL. The C-terminus of Bcl-XL also interacts with the membrane (Yao et al., 2015).
-
Figure 9—source data 1
Source data for Interaction of the Bim CTS with liposomes and Bcl-XL measured using purified recombinant full length proteins.
- https://doi.org/10.7554/eLife.37689.034
Figure 9—figure supplement 1
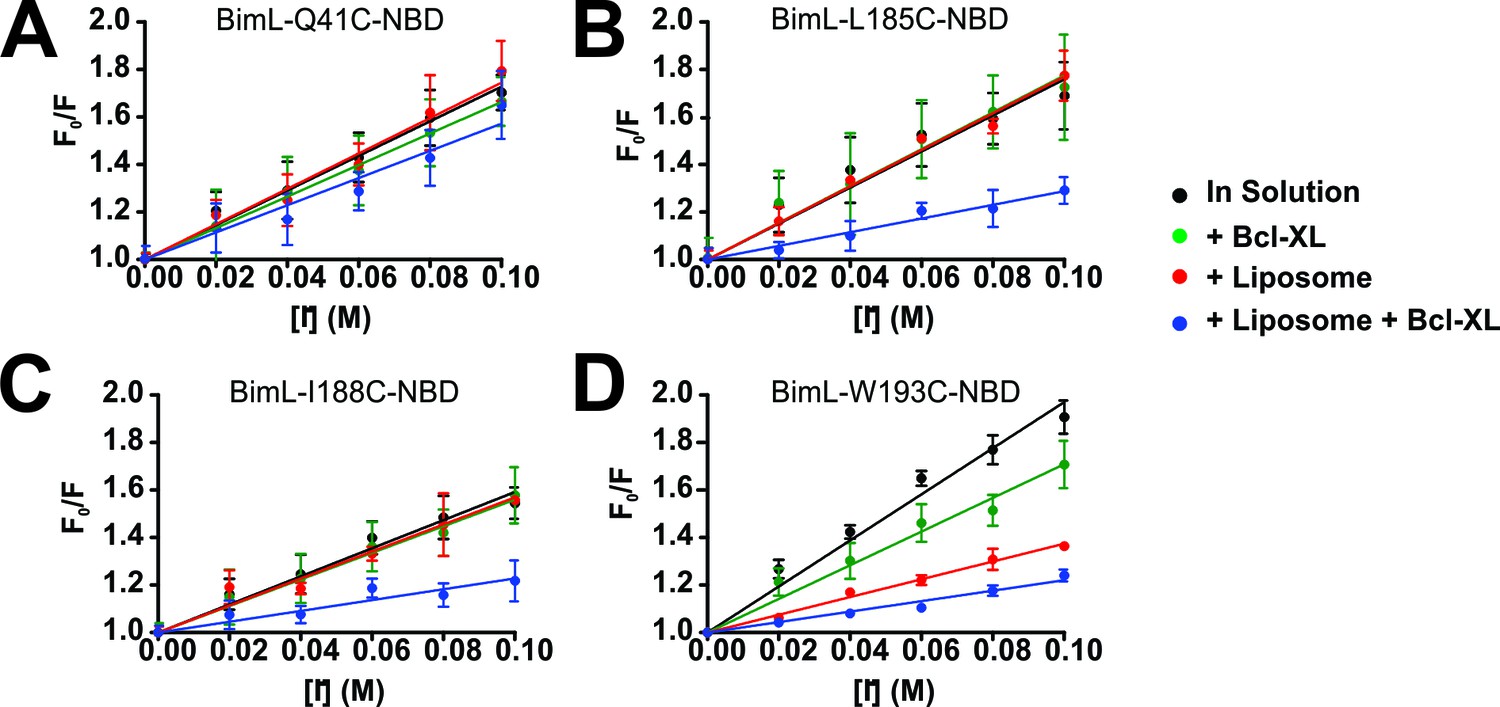
Residues in the Bim CTS are protected from iodide when bound to membranes and Bcl-XL.
(A–D) Representative Stern-Volmer quenching plots for specific residues in Bim. The fluorescence of BimL mutants labeled on the single cysteine with NBD (indicated at the top of each panel) was recorded before (F0) and after (F) incubation with the indicated concentration of iodide. F0/F was plotted against iodide concentration to generate Stern-Volmer quenching plots; error bars, STDEV, n > 3. Stern-Volmer constants (KSV) calculated as the slope of the line of linear best fit for Bim in solution (black) were compared to values for KSV for incubations containing Bim and Bcl-XL (green), Bim and liposomes (red) and Bim, liposomes and Bcl-XL (blue). The plots selected show: (A) the aqueous control Bim Q41C; (B) a residue protected primarily by interaction with the liposome membrane independent from Bcl-XL, Bim W193C; (C–D) two residues protected only when both liposomes and Bcl-XL were added, Bim-L185C and Bim-I188C (to facilitate comparison with other figures the numbering was increased by 56 residues so that the numbers correspond to positions in BimEL).
-
Figure 9—figure supplement 1—source data 1
Source data for Stern-Volmer quwnching plots for representative mutants of Bim.
- https://doi.org/10.7554/eLife.37689.036
Figure 9—figure supplement 2
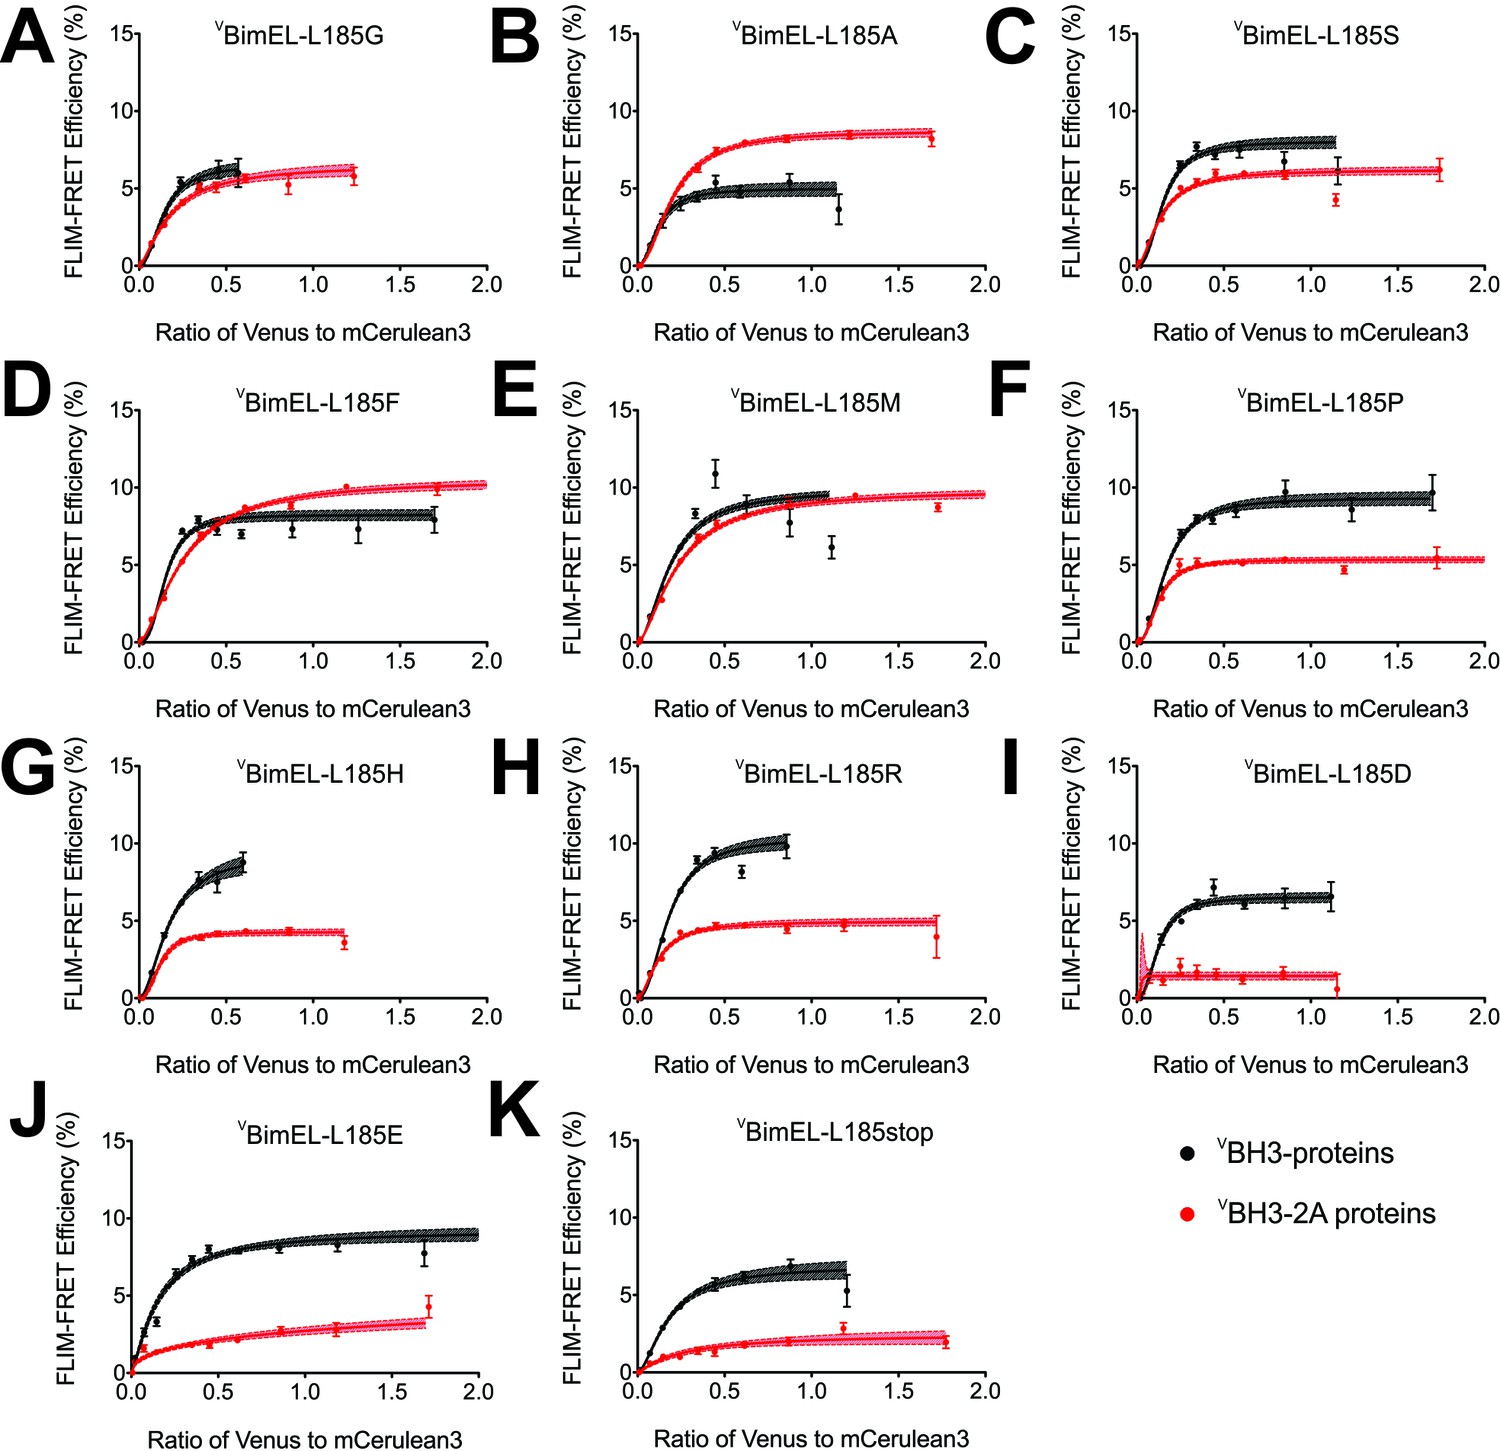
The Bim CTS adopts a non-conventional conformation that allows binding to both membranes and Bcl-XL through hydrophobic interactions.
(A–K) FLIM-FRET binding curves for VBimEL (black) and VBimEL-BH3-2A (red) with the indicated amino acid substitutions for L185 indicate that non-charged amino acids are preferred for binding to CBcl-XL. Substitutions that negatively impact VBimEL-BH3-2A binding to CBcl-XL result in red curves with lower FLIM-FRET efficiencies than the ones obtained for VBimEL (black). The substitution L185A increased VBimEL-BH3-2A binding back to approximately the same as VBimEL WT (red line above black curve). Substitutions with other uncharged amino acids had little impact however, substitution with charged residues dramatically reduced binding of VBim-BH3-2A to CBcl-XL on membranes (compare panels A-E with F-K). Error bars, SEM; (20 < cells/bin < 3,000); shadowed area, 95% confidence interval for the best fit of the model to the data.
-
Figure 9—figure supplement 2—source data 1
Source data fitted to a Hill equation for the mutants illustrating that the Bim-CTS binds both to membranes and to Bcl-XL.
- https://doi.org/10.7554/eLife.37689.038
Author response image 1

ABT199 significantly affects the lifetime of CBcl2.
BMKd3 cells expressing CBcl2 were incubated 24 hours in DMEM media alone (untreated) or media plus DMSO, ABT199 or ABT263. FLIM data was collected on the ISS-Alba, each point represents average lifetime of 10 images collected per replicate (n=3). A one-way ANOVA test was performed in GraphPad Prism, with a Dunnett's Multiple Comparison post-test to compare to the untreated control (*** is p value < 0.0001).
Tables
Table 1
Values of RBH3-2A and RABT-263 for all reported interactions.
https://doi.org/10.7554/eLife.37689.014| Cell lines Constructs | cBcl-XL | cBcl-2 | ||||||
|---|---|---|---|---|---|---|---|---|
| RBH3-2A | RABT-263 | RBH3-2A | RABT-263 | |||||
| Value | 95% CI | Value | 95% CI | Value | 95% CI | Value | 95% CI | |
| vBad | 2.44 | 2.50 | 46.36 | 8.23 | 4.33 | 3.48 | 18.63 | 3.24 |
| vtBid | 33.70 | 2.60 | 43.95 | 6.84 | 25.33 | 3.98 | 30.16 | 9.82 |
| vBimEL | 81.43 | 4.65 | 86.26 | 5.10 | 66.85 | 4.70 | 83.06 | 8.69 |
| vBad-Bim | 70.19 | 4.03 | 97.96 | 6.45 | 54.91 | 3.92 | 65.46 | 7.40 |
| vBimEL-dN | 101.87 | 4.37 | 90.81 | 7.01 | 82.57 | 4.27 | 90.47 | 10.25 |
| vBimEL-Bad | 26.12 | 2.70 | 60.55 | 4.43 | 32.74 | 5.80 | 65.75 | 6.36 |
| vBimEL-dCTS | 15.08 | 3.17 | 69.05 | 4.57 | 13.60 | 2.21 | 60.02 | 6.73 |
| vBimEL-Bad-dCTS | 10.61 | 4.26 | 40.25 | 5.67 | 11.95 | 4.07 | 12.51 | 6.60 |
| vBad-Bim-WAA | ND | ND | 78.51 | 5.81 | ND | ND | 50.15 | 7.22 |
| vBad-Bim-I146Y | 46.56 | 3.20 | 83.24 | 5.34 | 26.78 | 4.21 | 53.17 | 5.43 |
| vBad-Bim-Q148R | 74.45 | 4.24 | 89.82 | 6.21 | 56.94 | 5.46 | 53.46 | 7.33 |
| vBad-Bim-I153M | 96.53 | 4.60 | 92.78 | 6.00 | 102.30 | 8.94 | 68.51 | 7.51 |
| vBad-Bim-I146Y-Q148R | 50.46 | 3.46 | 90.18 | 7.59 | 37.73 | 3.88 | 61.77 | 7.54 |
| vBad-Bim-I146Y-I153M | 56.80 | 3.27 | 88.97 | 6.12 | 42.59 | 4.33 | 69.07 | 7.73 |
| vBimEL-I146Y | 70.99 | 7.58 | 88.66 | 10.85 | 54.17 | 3.49 | 65.32 | 8.72 |
| vBimEL-I146Y-dCTS | 12.29 | 2.89 | 38.45 | 8.31 | 8.57 | 4.03 | 52.86 | 6.02 |
| vBimEL-L185E | 26.68 | 3.62 | 41.85 | 10.24 | 16.09 | 3.87 | 51.02 | 12.29 |
| vBimEL-I146Y-L185E | 19.44 | 4.10 | 40.01 | 8.07 | 5.79 | 9.81 | 36.85 | 8.81 |
| vBimEL-CTS2A | 77.99 | 4.43 | 88.79 | 6.24 | 60.24 | 3.77 | 80.69 | 11.40 |
| vBimEL-I181E | 49.19 | 50.23 | 63.86 | 6.16 | 47.20 | 2.96 | 73.26 | 10.45 |
| vBimEL-L185E | 26.68 | 3.62 | 41.85 | 10.24 | 16.09 | 3.87 | 51.02 | 12.29 |
| vBimEL-I188E | 67.17 | 5.14 | 50.96 | 7.66 | 47.47 | 3.36 | 63.04 | 8.04 |
| vBimEL-V192E | 52.57 | 53.59 | 70.14 | 7.64 | 54.50 | 3.56 | 64.84 | 9.70 |
| vBimEL-L185A | 159.10 | 14.88 | ||||||
| vBimEL-L185D | 20.31 | 5.29 | ||||||
| vBimEL-L185E | 26.16 | 3.57 | ||||||
| vBimEL-L185F | 99.99 | 5.15 | ||||||
| vBimEL-L185G | 86.82 | 7.91 | ||||||
| vBimEL-L185H | 49.10 | 4.50 | ||||||
| vBimEL-L185M | 89.98 | 4.42 | ||||||
| vBimEL-L185P | 58.95 | 3.61 | ||||||
| vBimEL-L185R | 48.08 | 3.33 | ||||||
| vBimEL-L185S | 73.49 | 4.67 | ||||||
| vBimEL-L185stop | 26.87 | 4.94 | ||||||
| BimELv | 89.41 | 5.80 | ||||||
Key resources table
| Reagent type (species) or resource | Designation | Source or reference | Identifiers | Additional information |
|---|---|---|---|---|
| Antibody | antibody to Bcl-XL (Rabbit polyclonal) | PMID: 14681679 | (1:10,000), human, mouse reactivity | |
| Antibody | antibody to Beta-actin (Mouse monoclonal) | Abgent | Cat. #: 8H10D10 | (1:5000), human, rat, mouse reactivity |
| Antibody | Donkey anti-rabbit (polyclonal) | Jackson Immuno Research Laboratories | Cat. #: 711-035-150 | (1:10,000) |
| Antibody | Donkey anti-mouse (polyclonal) | Jackson Immuno Research Laboratories | Cat. #: 711-035-152 | (1:10,000) |
| Cell line (H.sapiens) | MCF-7 | PMID: 3790748 | Dr. Ronald N. Buick (University of Toronto) | |
| Cell line (M. musculus) | Baby Mouse Kidney(BMK)-DKO (Bax and Bak knockout) cells | PMID: 11836241 | Dr. Eileen White (Rutgers University) | |
| Chemical compound, drug | Navitoclax; ABT-263 | Selleckchem | Cat. #: S1001 | in DMSO |
| Chemical compound, drug | A-1155463 | Chemietek | Cat #: CT-A115 | in DMSO |
| Chemical compound, drug | A-1331852 | Chemietek | Cat. #: CT-A115 | in DMSO |
| Chemical compound, drug | S-63845 | Chemietek | Cat. #: 1799633-27-4 | in DMSO |
| Chemical compound, drug | Venetoclax; ABT-199 | Chemietek | Cat. #: CT-A199 | in DMSO |
| Chemical compound, drug | TMRE | ThermoFisher Scientific | Cat. #: T669 | |
| Chemical compound, drug | DRAQ5 | Biostatus, UK | Cat. #: DR05500 | |
| Chemical compound, drug | MitoTracker Red | ThermoFisher Scientific | Cat. #: M22425 | |
| Chemical compound, drug | MitoTracker Green | ThermoFisher Scientific | Cat. #: M7514 | |
| Chemical compound, drug | Alexa 647-maleimide | ThermoFisher Scientific, Molecular probes | Cat. #: A20347 | |
| Chemical compound, drug | Alexa568-maleimide | ThermoFisher Scientific, Molecular probes | Cat. #. A20341 | |
| Chemical compound, drug | NBD | Molecular Probes | Cat. #: D-2004 | |
| Chemical compound, drug | PC (L-α-phosphatidylcholine) | Avanti Polar Lipids | Cat. #:840051C | for making liposomes, used 48% PC |
| Chemical compound, drug | DOPS (1,2-dioleoyl-sn-glycero-3-phospho-L-serine) | Avanti Polar Lipids | Cat. #: 840035C | for making liposomes, used 10% DOPS |
| Chemical compound, drug | PI (L-α-phosphatidylinositol) | Avanti Polar Lipids | Cat. #:840042C | for making liposomes, used 10% PI |
| Chemical compound, drug | PE (L-α-phosphatidylethanolamine) | Avanti Polar Lipids | Cat. #: 841118C | for making liposomes, used 28% PE |
| Chemical compound, drug | TOCL, (18:1 Cardiolipin) | Avanti Polar Lipids | Cat. #: 710335C | for making liposomes, used 4% TOCL |
| Commercial assay or kit | Fugene HD | Promega | Cat. #: E2311 | |
| Commercial assay or kit | TransIT-X2 | Mirus | Cat. #: Mir 6003 | |
| Gene (H. sapiens) | Bax | PMID: 14522999, | GI: L22473.1 | For recombinant protein |
| Gene (H. sapiens) | Bcl-XL | PMID: 18547146 | GI: Z23115.1 | For recombinant protein |
| Gene (H. sapiens) | Bcl-2 | PMID: 22464442 | GI: M14745.1 | For expression of CBcl-2 in cells |
| Gene (H. sapiens) | Bad | PMID: 22464442 | GI: AB451254.1 | For expression of VBad in cells |
| Gene (H. sapiens) | Bcl-XL | PMID: 22464442 | GI: NM_138578.3 | For expression of CBcl-XL in cells |
| Gene (M. musculus) | Bid | PMID: 16642033, PMID: 19062087 | GI: NM_007544.4 | For recombinant protein |
| Gene (M. musculus) | BimL | this paper | GI: AAD26594.1 | This lab, plasmid # 2187, for recombinant BimL purification |
| Gene (M. musculus) | tBid | PMID: 22464442 | GI: NM_007544.4 | for expression of VtBid in cells |
| Gene (M. musculus) | BimEL | PMID: 22464442 | GI: XM_006498614.3 | for expression of VBimEL in cells |
| Other | Cell Carrier-384, Ultra | PerkinElmer | Cat. #: 6057300 | for live cell imaging |
| Other | Non-binding surface, 96-well plate, black with clear bottom | Corning | Cat. #: 3881 | For recombinant protein and liposome assays critical to use non-binding plate |
| Other | Opera Phenix | PerkinElmer | Cat. #: HH14000000 | |
| Other | ISS-Alba | PMID: 25631031 | Custom built by ISS for DWA lab | |
| Software, algorithm | GraphPad Prism | San Diego, California | Version 6 | Scientific graphing program, used to perform statistical analysis |
| Software, algorithm | ImageJ | PMID: 17936939 | MBF - ImageJ for microscopy, Dr. Tony Collins (McMaster University) | FLIM-FRET analysis Macro, in this paper: https://github.com/DWALab/Liu_et_al_2018_eLife |
| Software, algorithm | CellProfiler | PMID: 17269487 | Colocalization analysis, in this paper: https://github.com/DWALab/Liu_et_al_2018_eLife | |
| Transfected Construct | mVenus-pEGFP-C1 | other | GI: KU341334.1 | Dr. Ray Truant (McMaster University). Backbone EGFP-C1 (Clonetech) |
| Transfected Construct | mCerulean3-pEGFP-C1 | PMID: 21479270 | Dr. Mark A Rizzo (University of Maryland). Backbone EGFP-C1 (Clonetech) | |
| Transfected Construct | pSPUTK | Stratagene Santa Clara CA | Cat. #: CB4278654 | Cotransfected to reduce overexpression in live cells |
Additional files
-
Transparent reporting form
- https://doi.org/10.7554/eLife.37689.039
Download links
A two-part list of links to download the article, or parts of the article, in various formats.
Downloads (link to download the article as PDF)
Open citations (links to open the citations from this article in various online reference manager services)
Cite this article (links to download the citations from this article in formats compatible with various reference manager tools)
Bim escapes displacement by BH3-mimetic anti-cancer drugs by double-bolt locking both Bcl-XL and Bcl-2
eLife 8:e37689.
https://doi.org/10.7554/eLife.37689


