The subiculum is a patchwork of discrete subregions
- Howard Hughes Medical Institute, United States
Figures
Figure 1

Overview of the generation, validation, and extension of the transcriptomic landscape of subiculum pyramidal cells.
(A) Two strategies, based upon geography and projections, were used to select cells for scRNA-seq. (B) Single-cell transcriptomes were constructed and analyzed. (C) Subclasses revealed by scRNA-seq were cross-validated and spatially registered by in situ hybridization. (D) Higher order features (e.g. projection classes) were mapped onto subclasses.
Figure 2 with 3 supplements
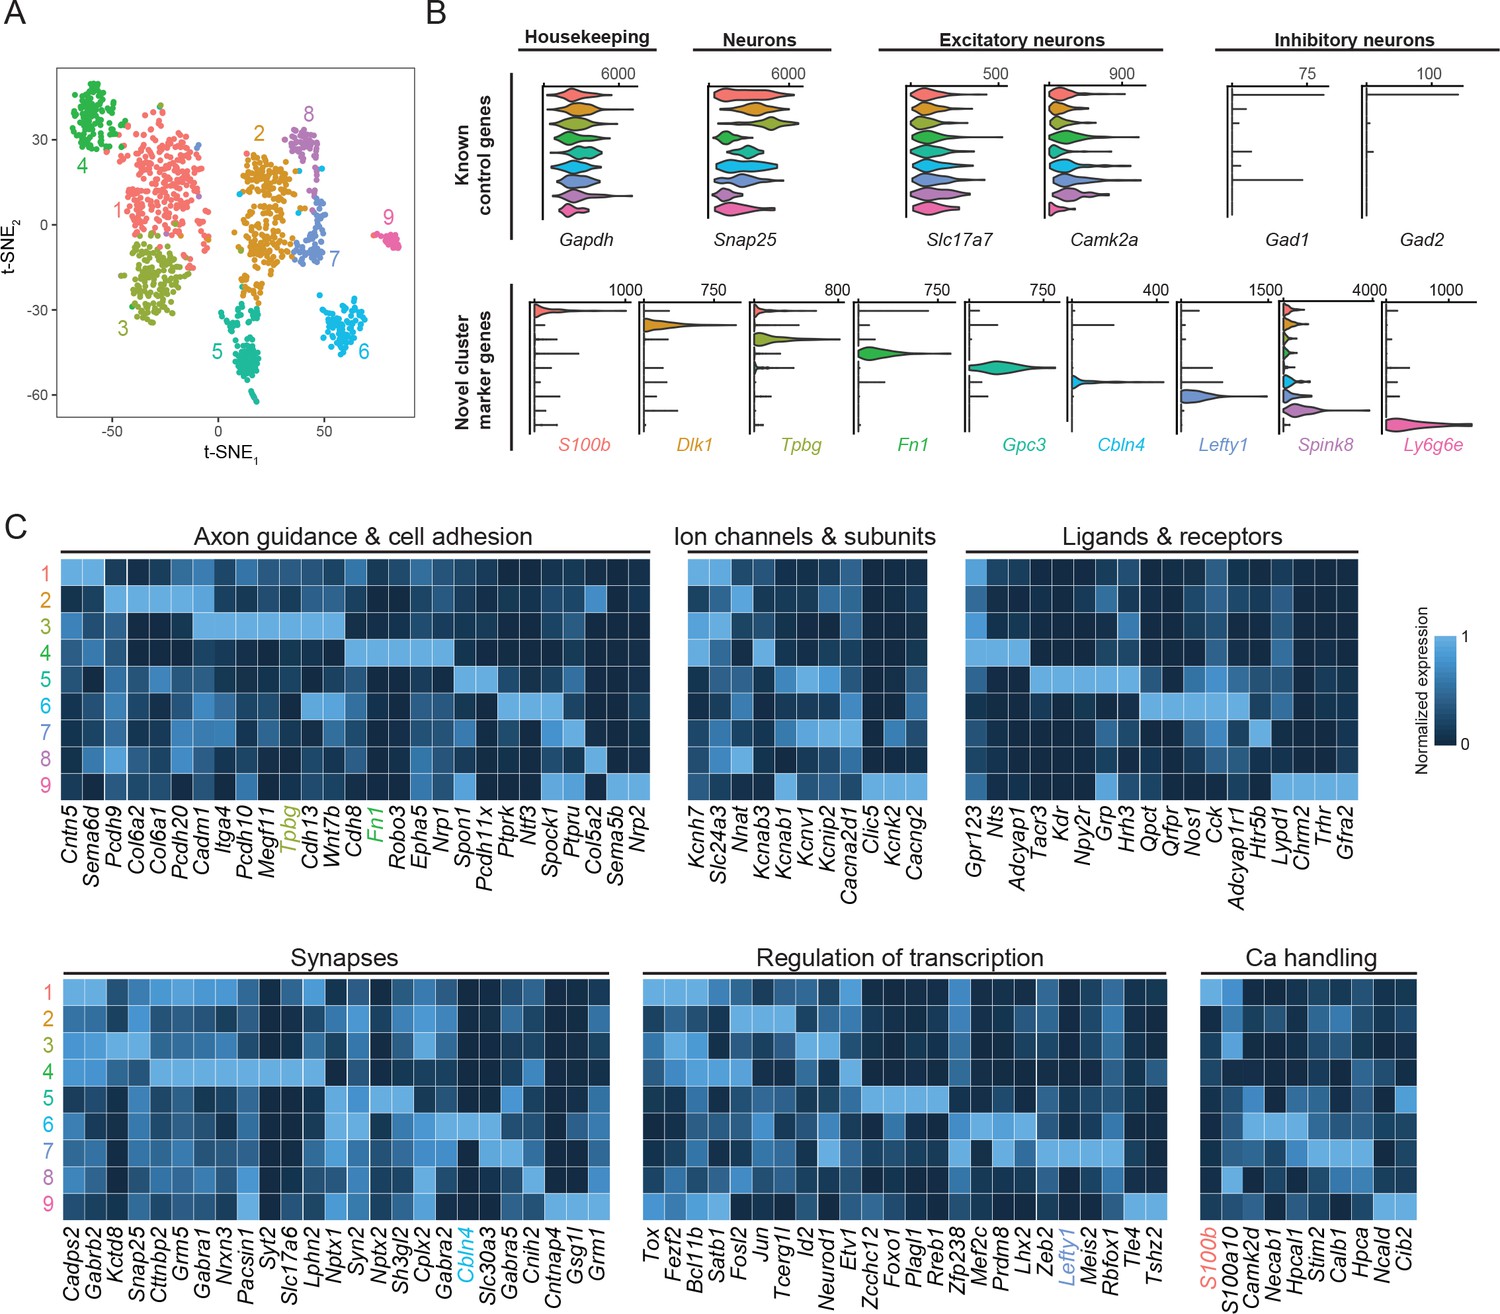
Subiculum pyramidal cells are divisible into transcriptomic subclasses.
(A) Gene expression across cells of the subiculum, visualized by t-SNE. Colors indicate cluster identified by graph-based clustering, with cluster number provided alongside. (B) Expression of control genes and cluster-specific marker genes, summarized across clusters. Results are depicted as violin plots, which illustrate the smoothed distribution of expression across all cells. (C) Heatmap of genes with neuronally relevant ontologies that are enriched or depleted in individual clusters. Marker genes that correspond to specific ontologies are colored according to their respective cluster. Note that some marker genes (specifically Dlk1, Gpc3, Spink8, Ly6g6e) do not correspond to the ontologies shown here.
Figure 2—figure supplement 1
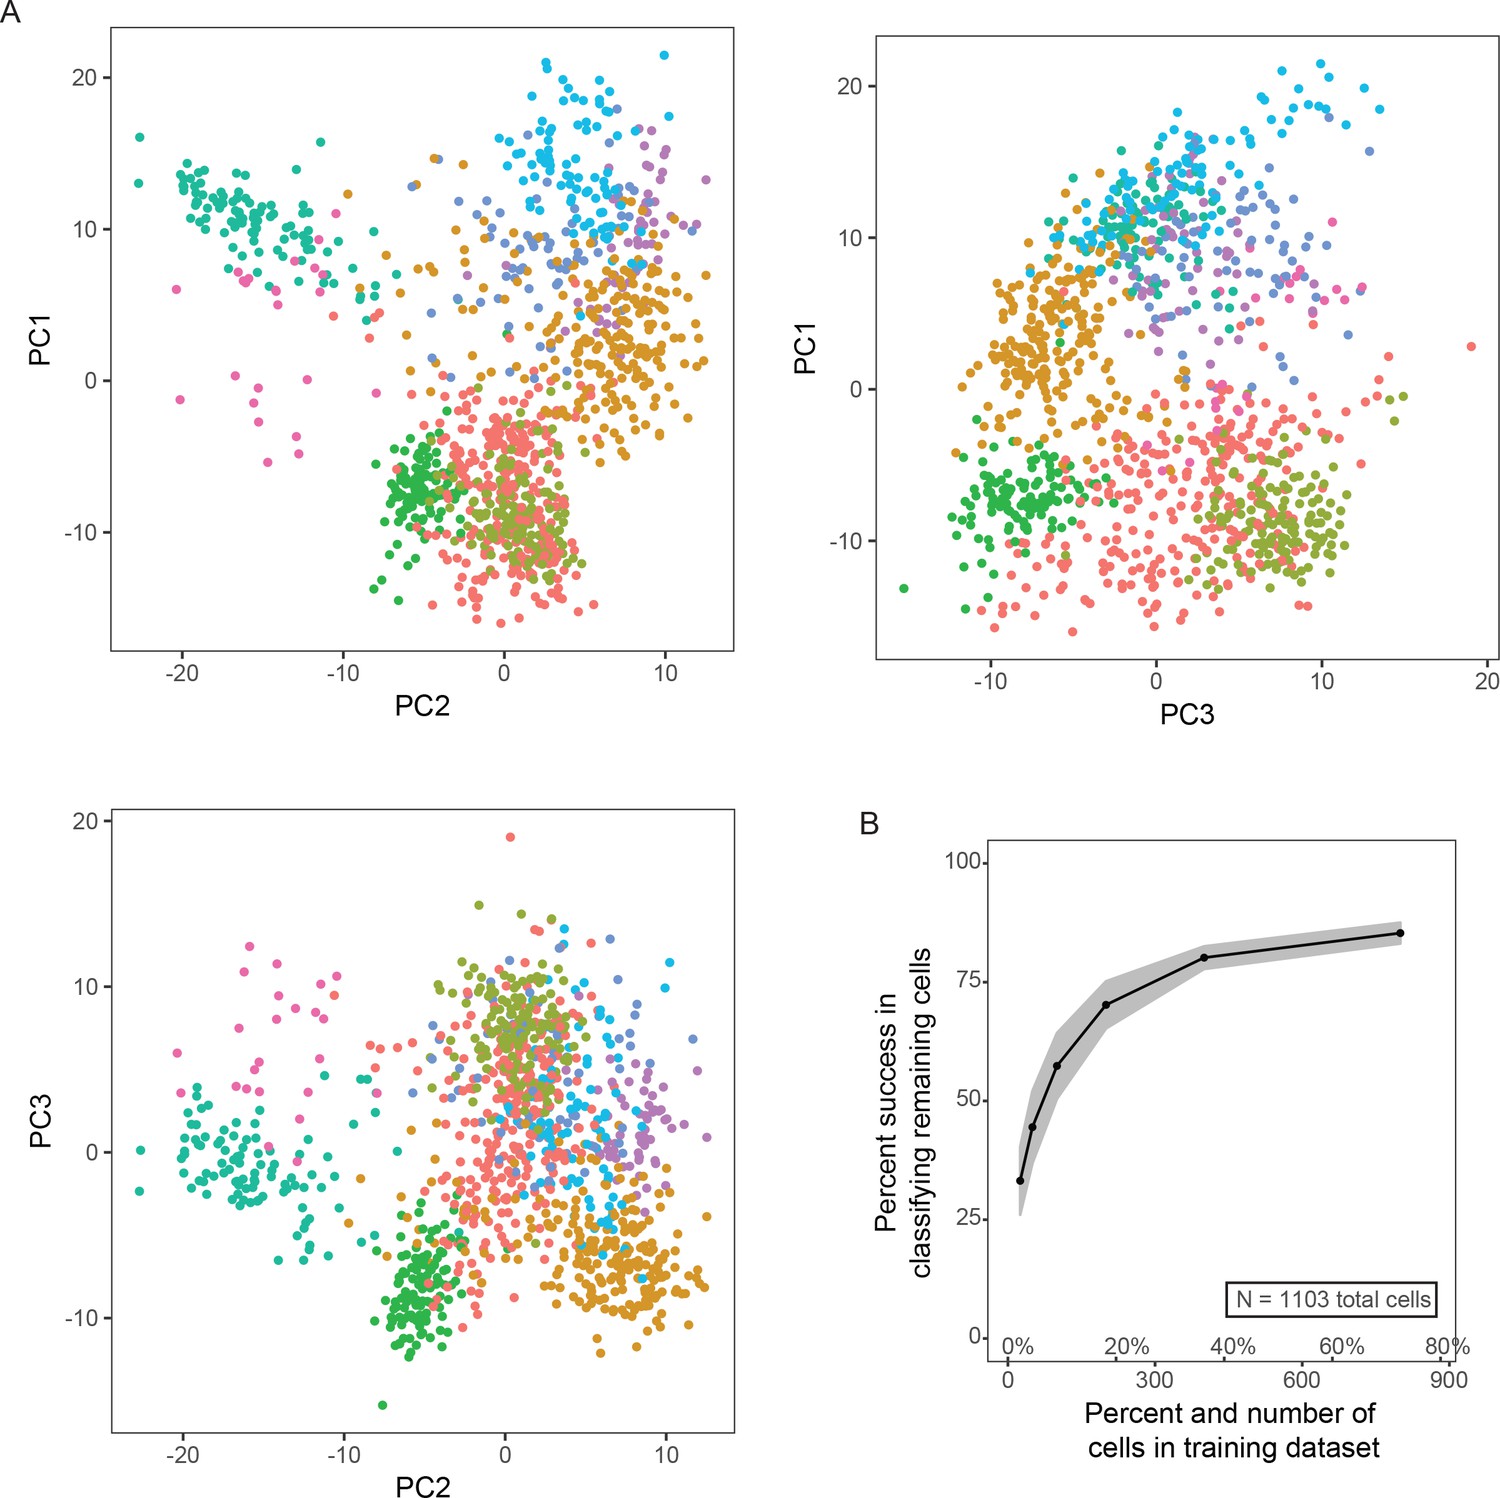
Expanded computational analysis of scRNA-seq data.
(A) Projections onto the first three principal components are shown. (B) Random forest classification effectiveness. Here, for each iteration, a random subset of cells was chosen for classification (number of cells denoted by x-axis), and the remaining cells were used to test robustness of classification. One hundred simulations were run for each x value. Results are depicted as mean ± SD. Typically, misclassified cells reflected cells located on the extrema of clusters and/or cells occupying underrepresented clusters.
Figure 2—figure supplement 2
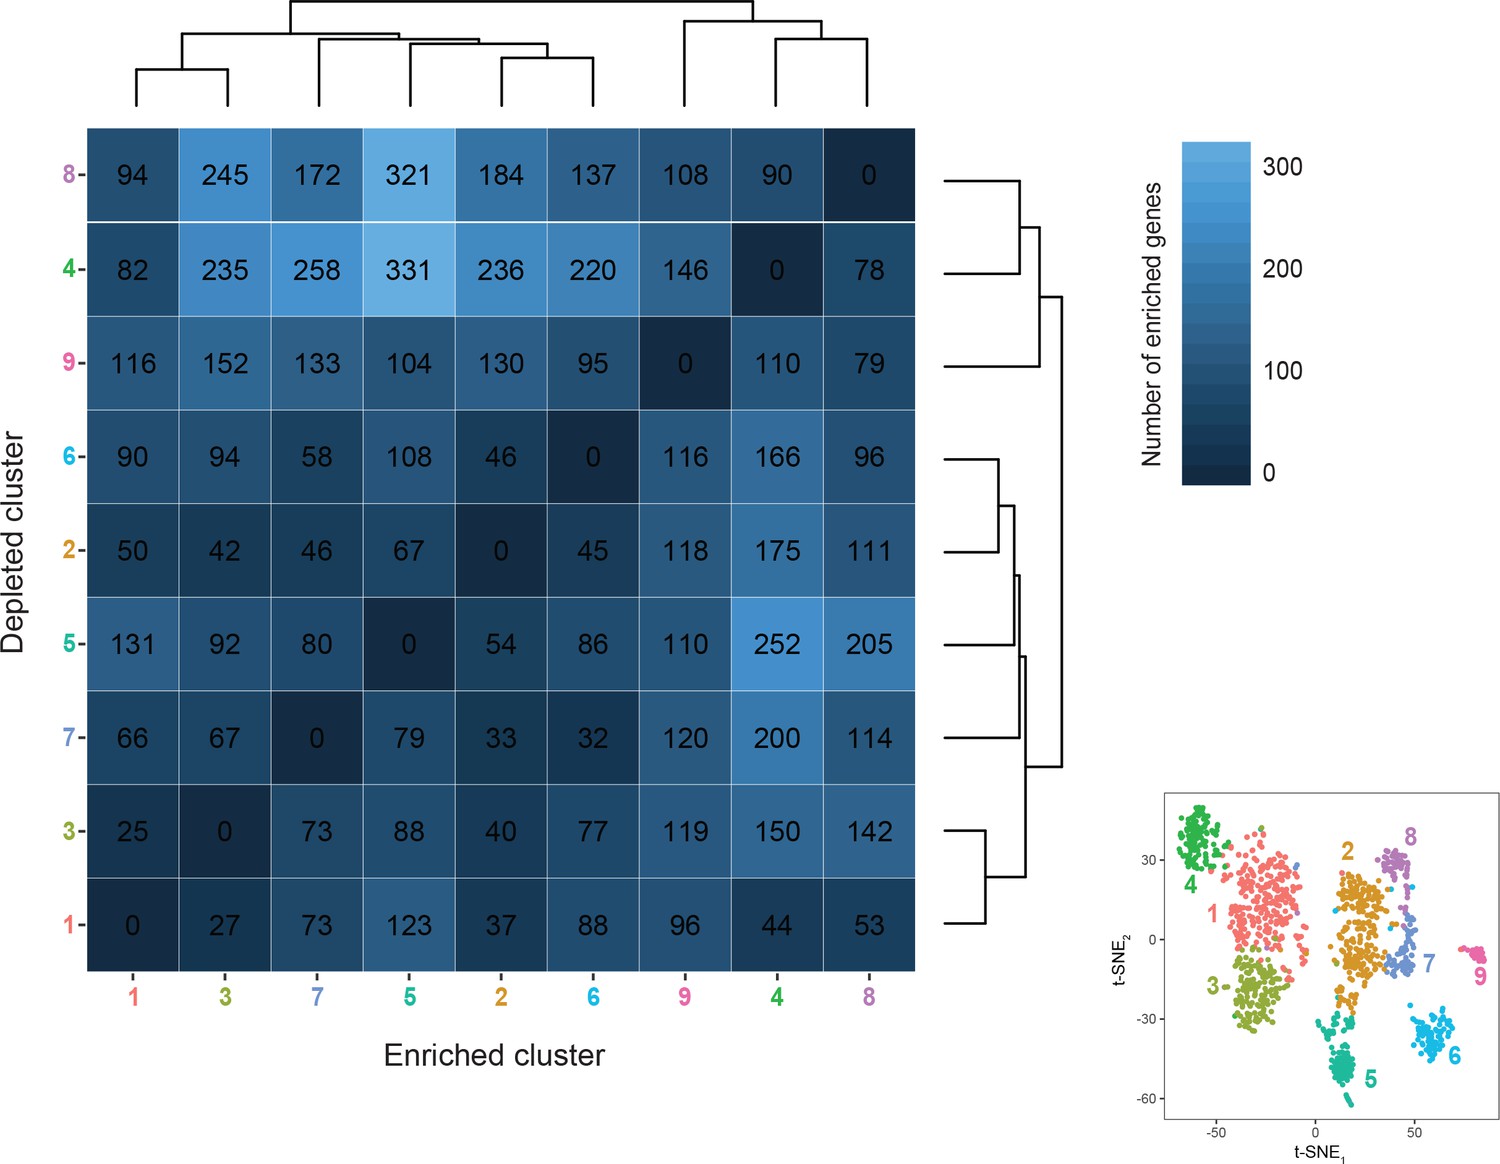
Hierarchical organization and differentially expressed genes.
For each pairwise comparison across clusters, the number of enriched genes (defined as >3 fold enriched on average between the ‘enriched’ cluster relative to the ‘depleted’ cluster and pADJ <0.05) is shown. Matrix is ordered relative to hierarchical relationship of transcriptomes. For reference, t-SNE visualization of clustered transcriptomes is provided.
Figure 2—figure supplement 3
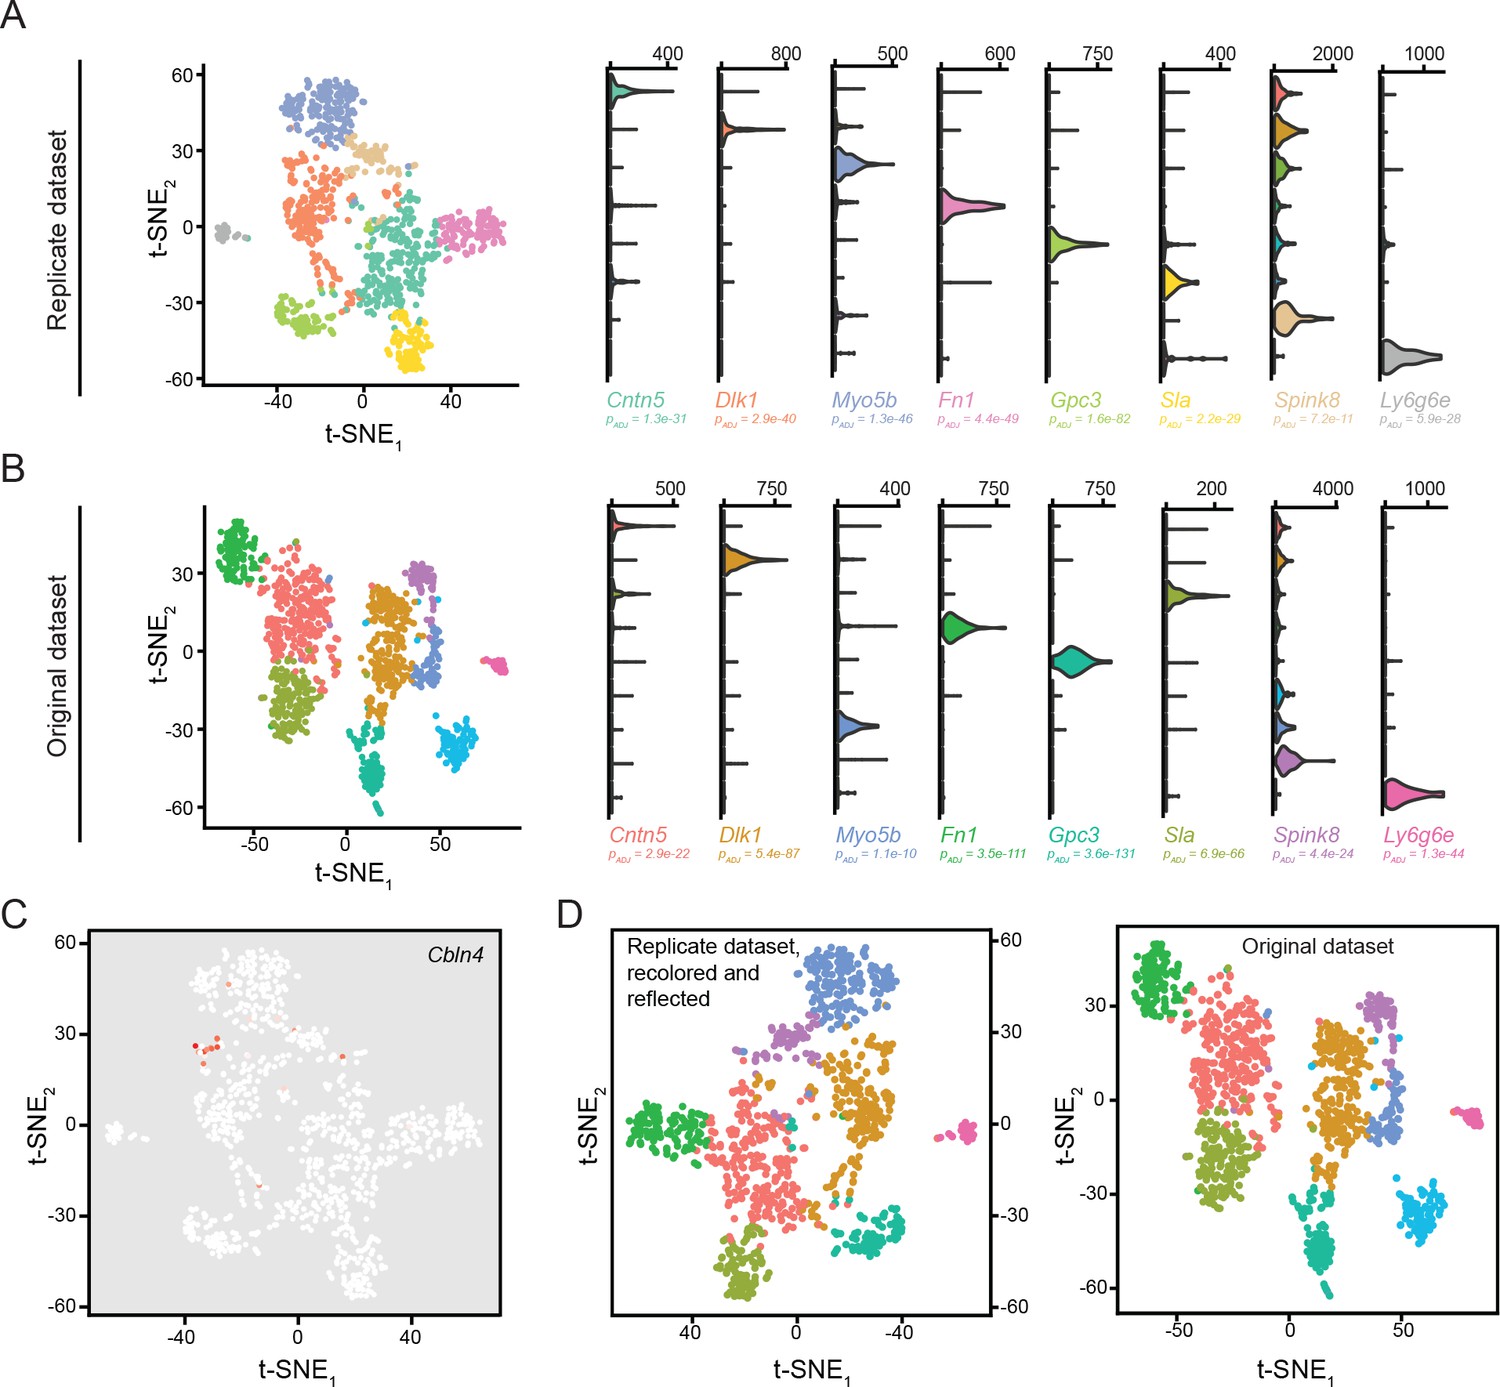
Reproducibility of clusters across biological replicates.
(A) Left: t-SNE visualization of cells and clusters identified in an independent dataset of biological replicates. Right: marker genes associated with eight obtained clusters in replicate dataset. (B) Left: t-SNE visualization of cells and clusters used in main text of manuscript (‘original dataset’). Right: expression of replicate marker genes in the original dataset. (C) Visualization of Cbln4 expression, the sole cluster not captured in the replicate dataset. (D) Left: t-SNE visualization of replicate dataset, reflected in y axis and recolored according to cluster correspondence with original dataset. Right: t-SNE visualization of original dataset, for comparison.
Figure 3 with 4 supplements
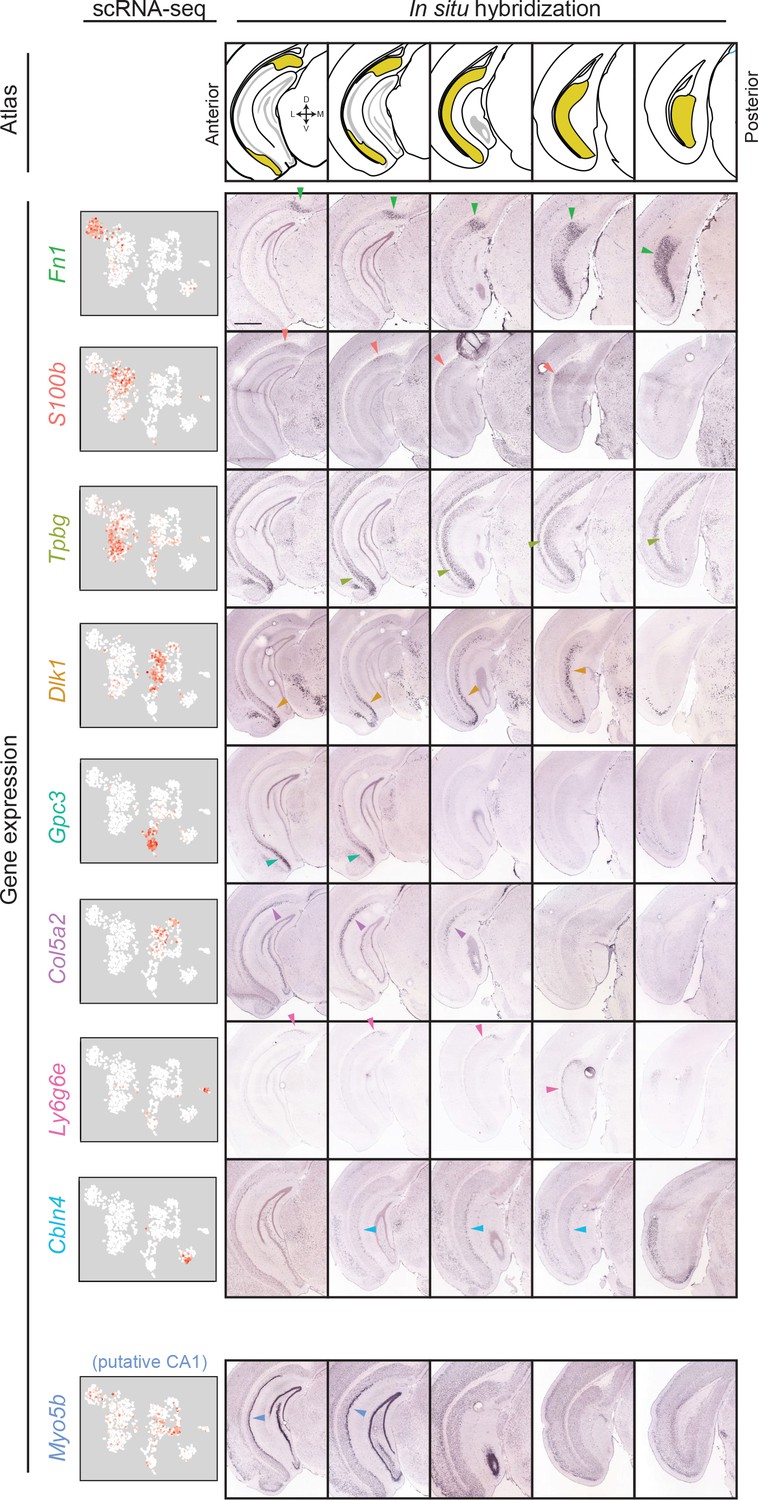
Gene expression clusters map onto distinct spatial domains in the subiculum.
For each transcriptomic cluster, expression of a corresponding marker gene is shown across the anterior-posterior axis of the subiculum. Arrows indicate example regions of dense expression referred to in main text. Atlas images illustrate subiculum colored in yellow (atlas images, here and elsewhere, modified from Paxinos and Franklin, 2004), with cardinal directions corresponding to dorsal, ventral, medial, and lateral directions. scRNA-seq images illustrate expression colored from white to red on a logarithmic scale. Histological images illustrate coronal sections from the Allen Brain Atlas (Lein et al., 2007). Scale bar: 1 mm.
Figure 3—figure supplement 1
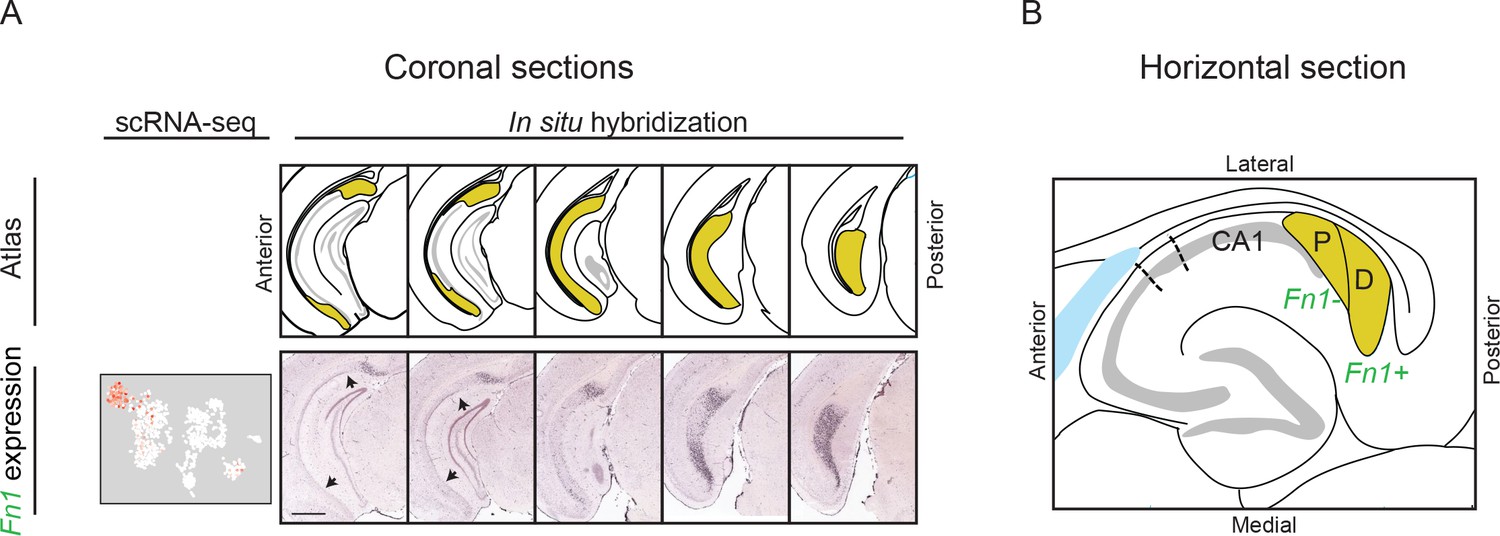
Proximal and distal subiculum, as viewed through coronal and horizontal sections.
(A) Expression of the distal marker Fn1, shown in coronal sections, as in Figure 3. Arrows denote extent of CA1, as assessed through atlas images and tightly packed cell body layer. Note in this plane of sectioning, Fn1 expression is strongest in posterior sections. Also note that in all sections Fn1 expression is spatially removed from CA1. Scale bar: 1 mm. (B) Schematized expression of Fn1 in a horizontal section, dividing the subiculum into proximal (‘P’) and distal (‘D’).
Figure 3—figure supplement 2
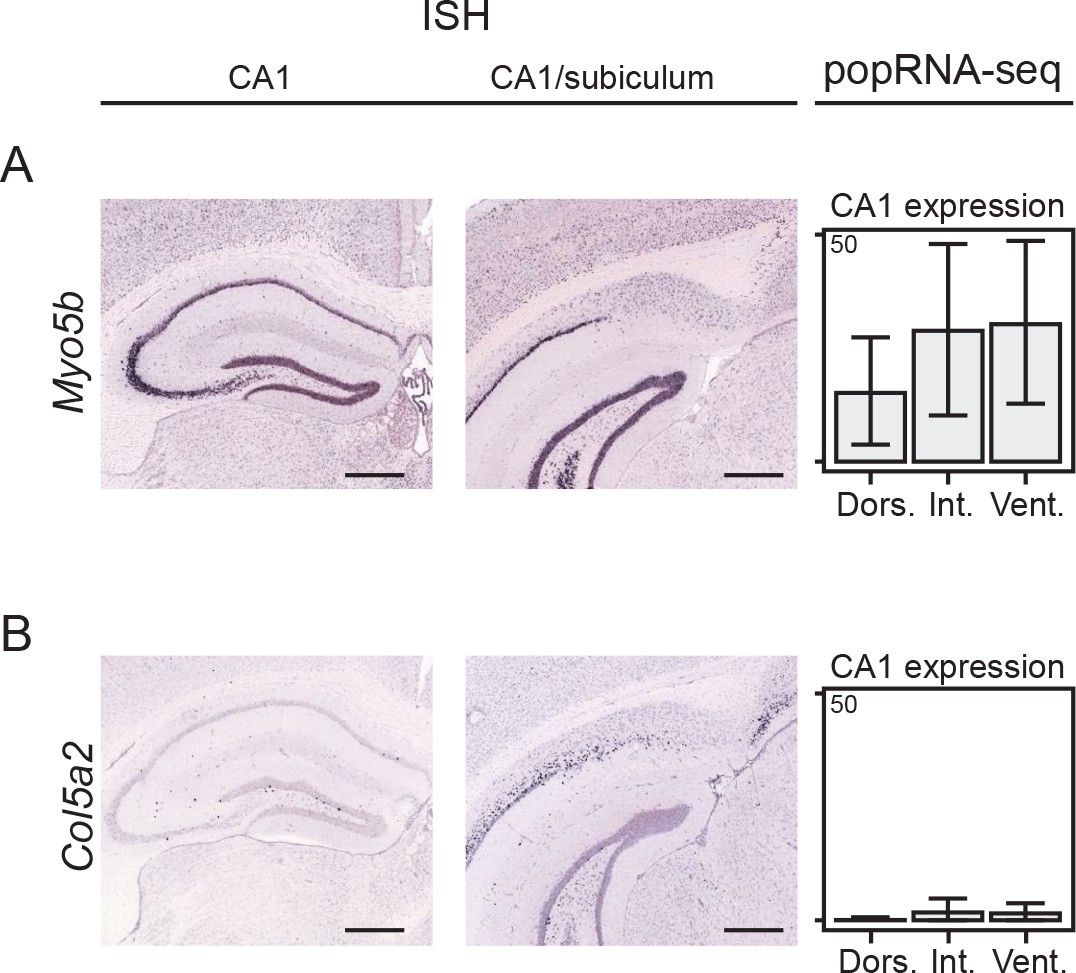
Expression of Myo5b is associated with CA1 pyramidal cells.
(A) Left: ISH showing expression of Myo5b in anterior CA1 pyramidal cells. Middle: as at left, but with more posterior section showing CA1/subiculum boundary. Expression is restricted to the tightly packed pyramidal cell group only, consistent with CA1 expression. Right: expression from population-level RNA-seq in dorsal, intermediate, and ventral CA1 PCs. Units are FPKM (Fragments Per Kilobase of exon per Million reads), with data from Cembrowski et al., 2016b. Scale bars: 500 μm. (B) As in A, but for expression of Col5a2. This gene labels loosely packed cell bodies (putative subiculum) and lacks expression in CA1 cells. Scale bars: 500 μm.
Figure 3—figure supplement 3
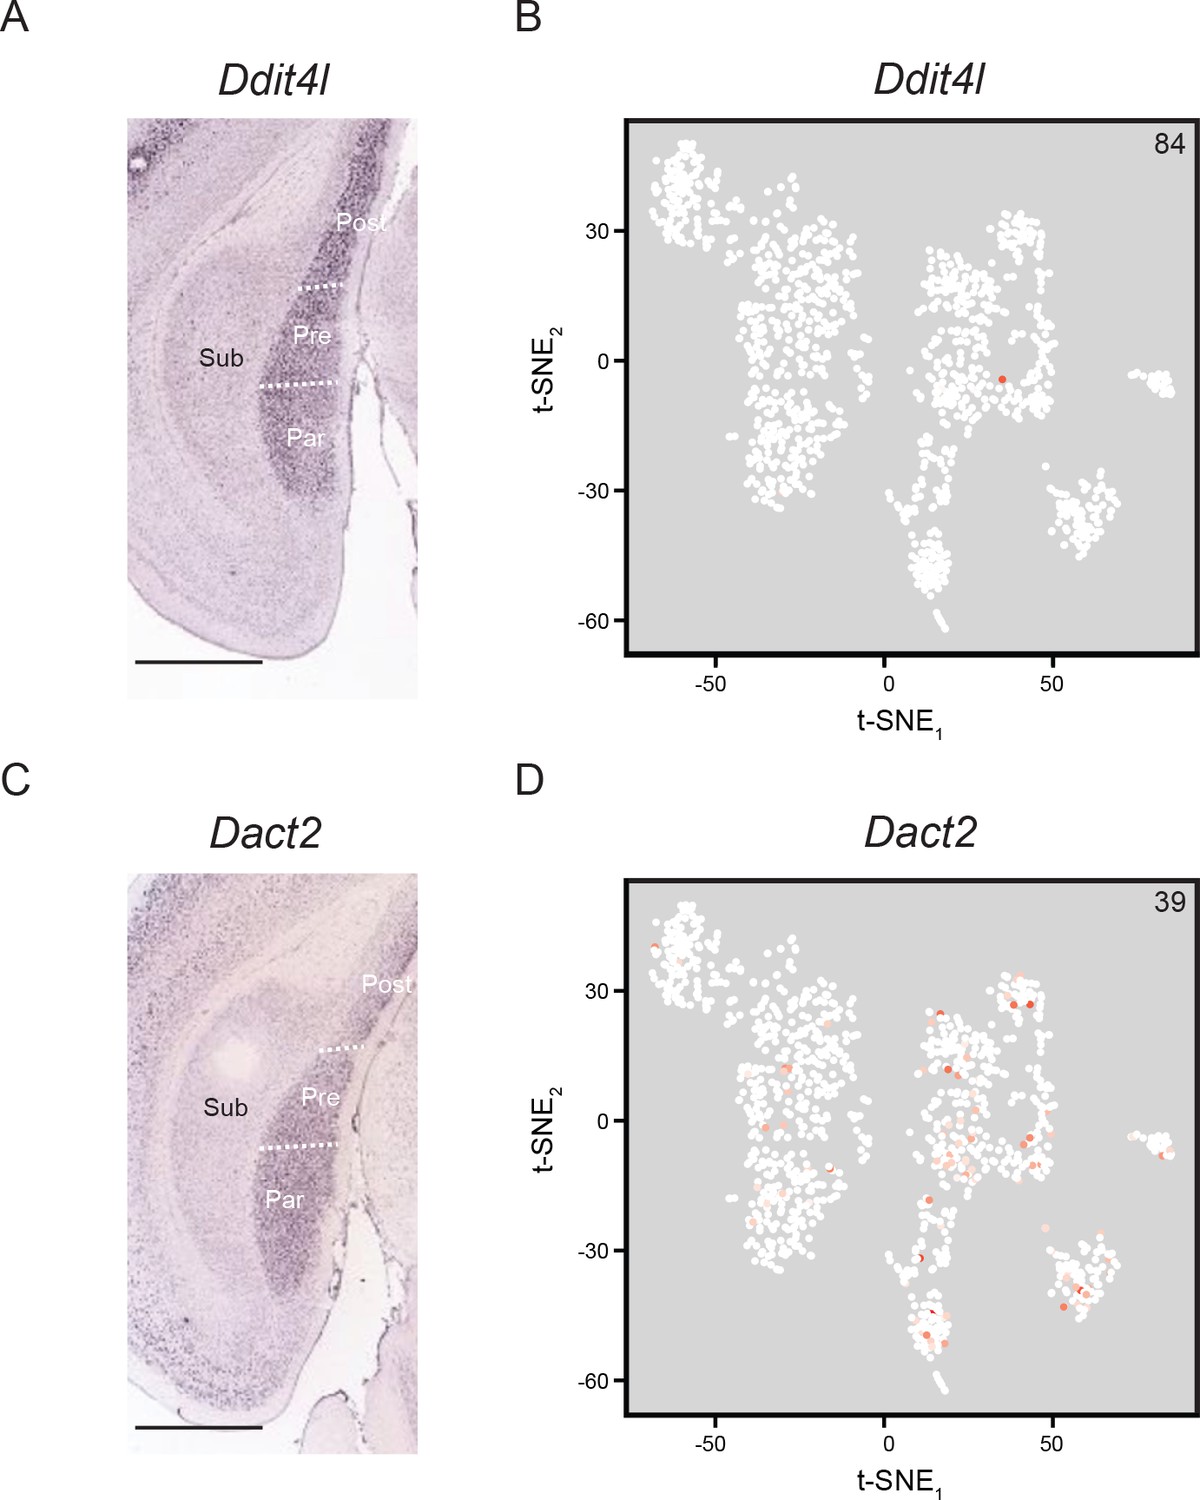
No clusters are associated with genes expressed in parasubiculum, presubiculum, or postsubiculum.
(A) ISH image illustrating expression of Ddit4l in parasubiculum (‘Para’), presubiculum (‘Pre’), and postsubiculum (‘Post’), but not subiculum (‘Sub’). Scale bar: 1 mm. B. Ddit4l is generally not expressed in the scRNA-seq dataset. Inset value denotes maximum CPM in dataset. C,D. As in (A,B), but for the gene Dact2. Scale bar: 1 mm.
Figure 3—figure supplement 4
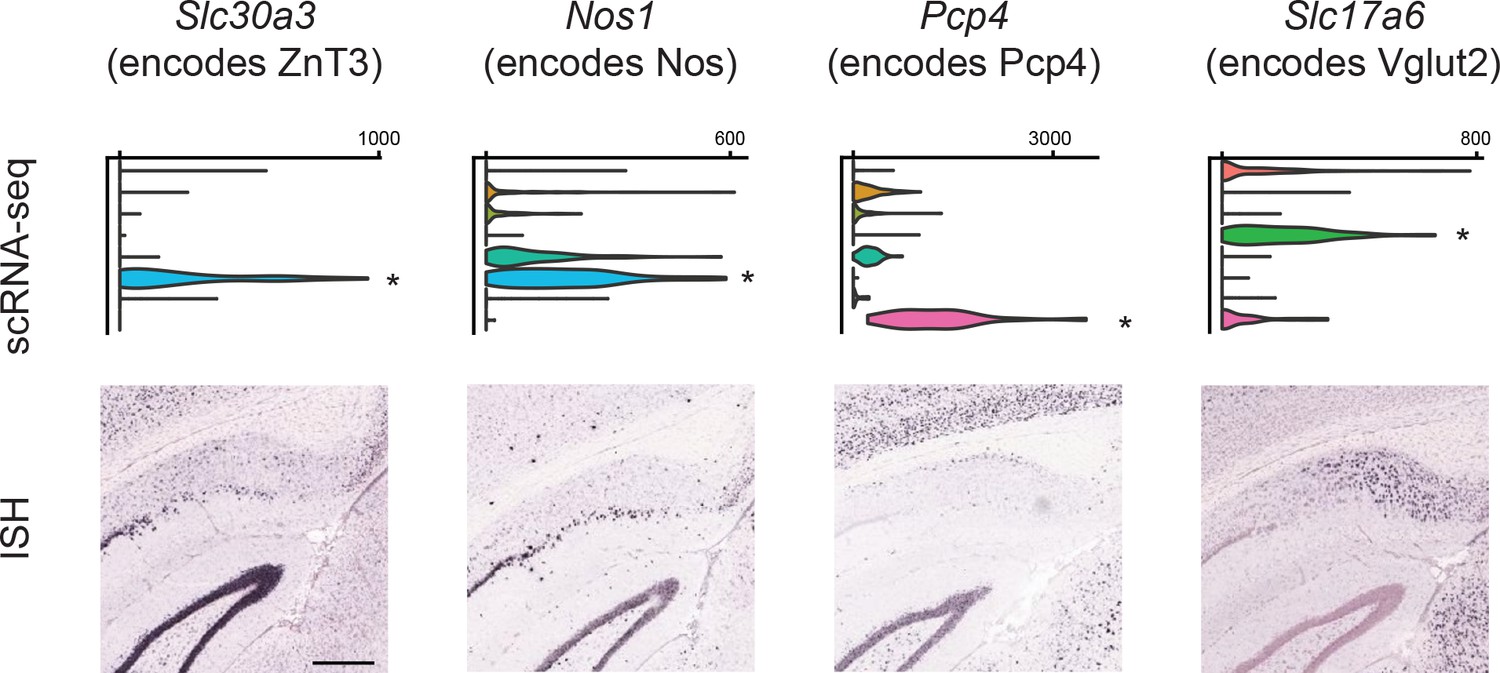
Examination of gene expression associated with immunohistochemically identified subdomains.
Top row: names of four genes, and associated protein products, that have been previously shown to occupy spatial subdomains in the subiculum via immunohistochemistry (Ishihara and Fukuda, 2016). Middle row: scRNA-seq expression for all four genes across subclasses. Bottom row: ISH images for each gene in the dorsal subiculum. Asterisks indicate subclass-specific enrichment, defined as >3 fold enriched on average and pADJ <0.05. Scale bar: 400 μm.
Figure 4
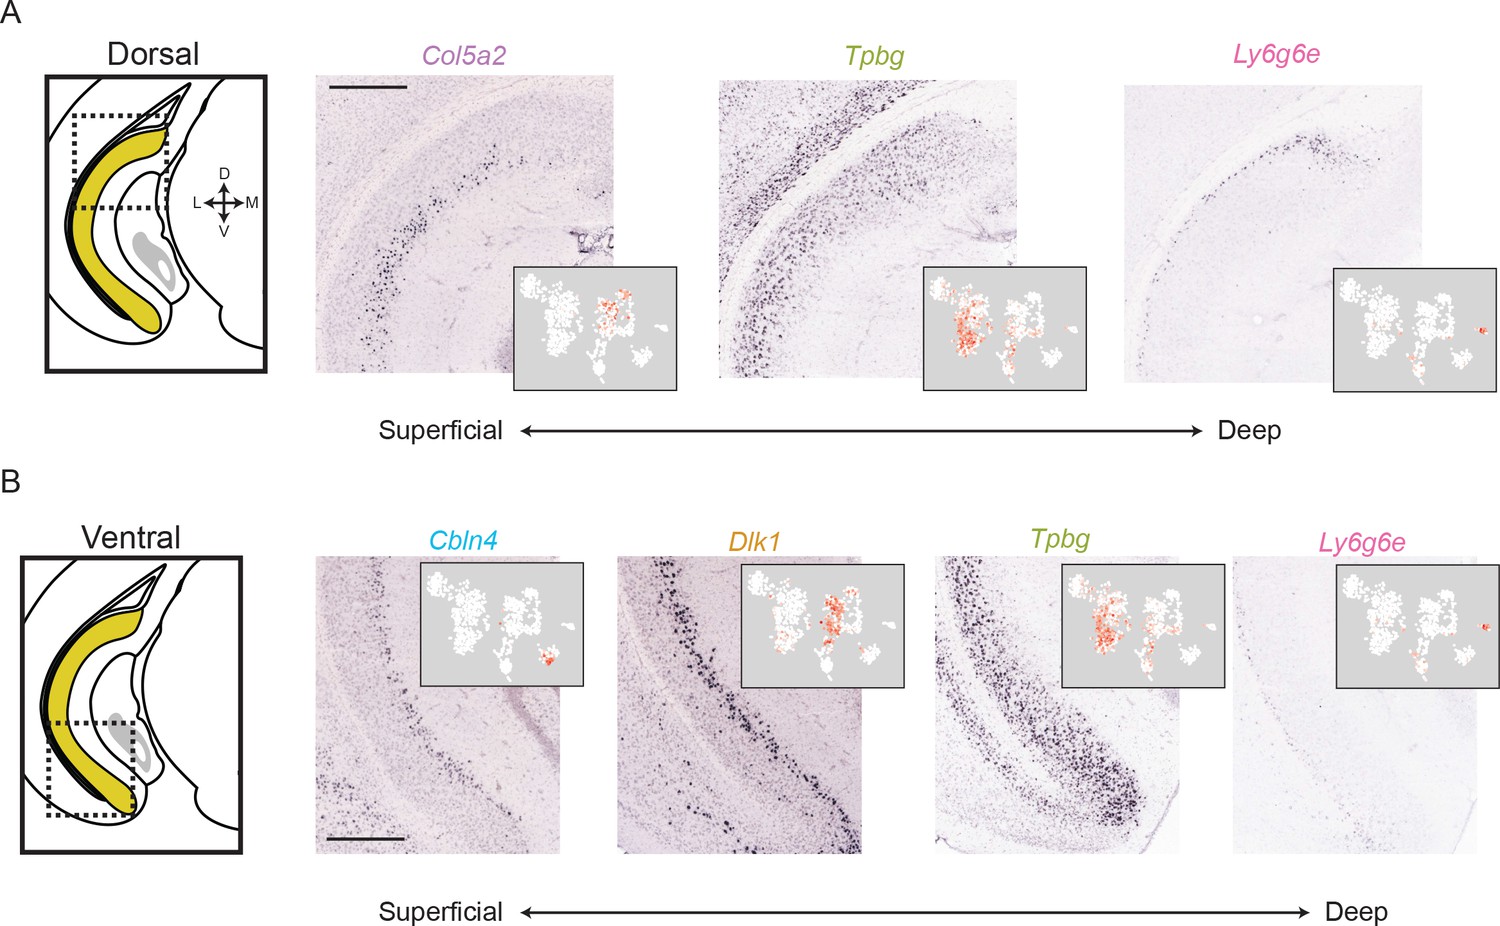
The subiculum can be deconstructed into distinct lamina across the long axis.
(A) For a dorsal region of the subiculum (atlas at left), marker gene expression exhibits a superficial-to-deep lamination pattern. Scale bar: 500 μm. (B). As in A, but for marker gene expression in the ventral subiculum. Scale bar: 500 μm.
Figure 5
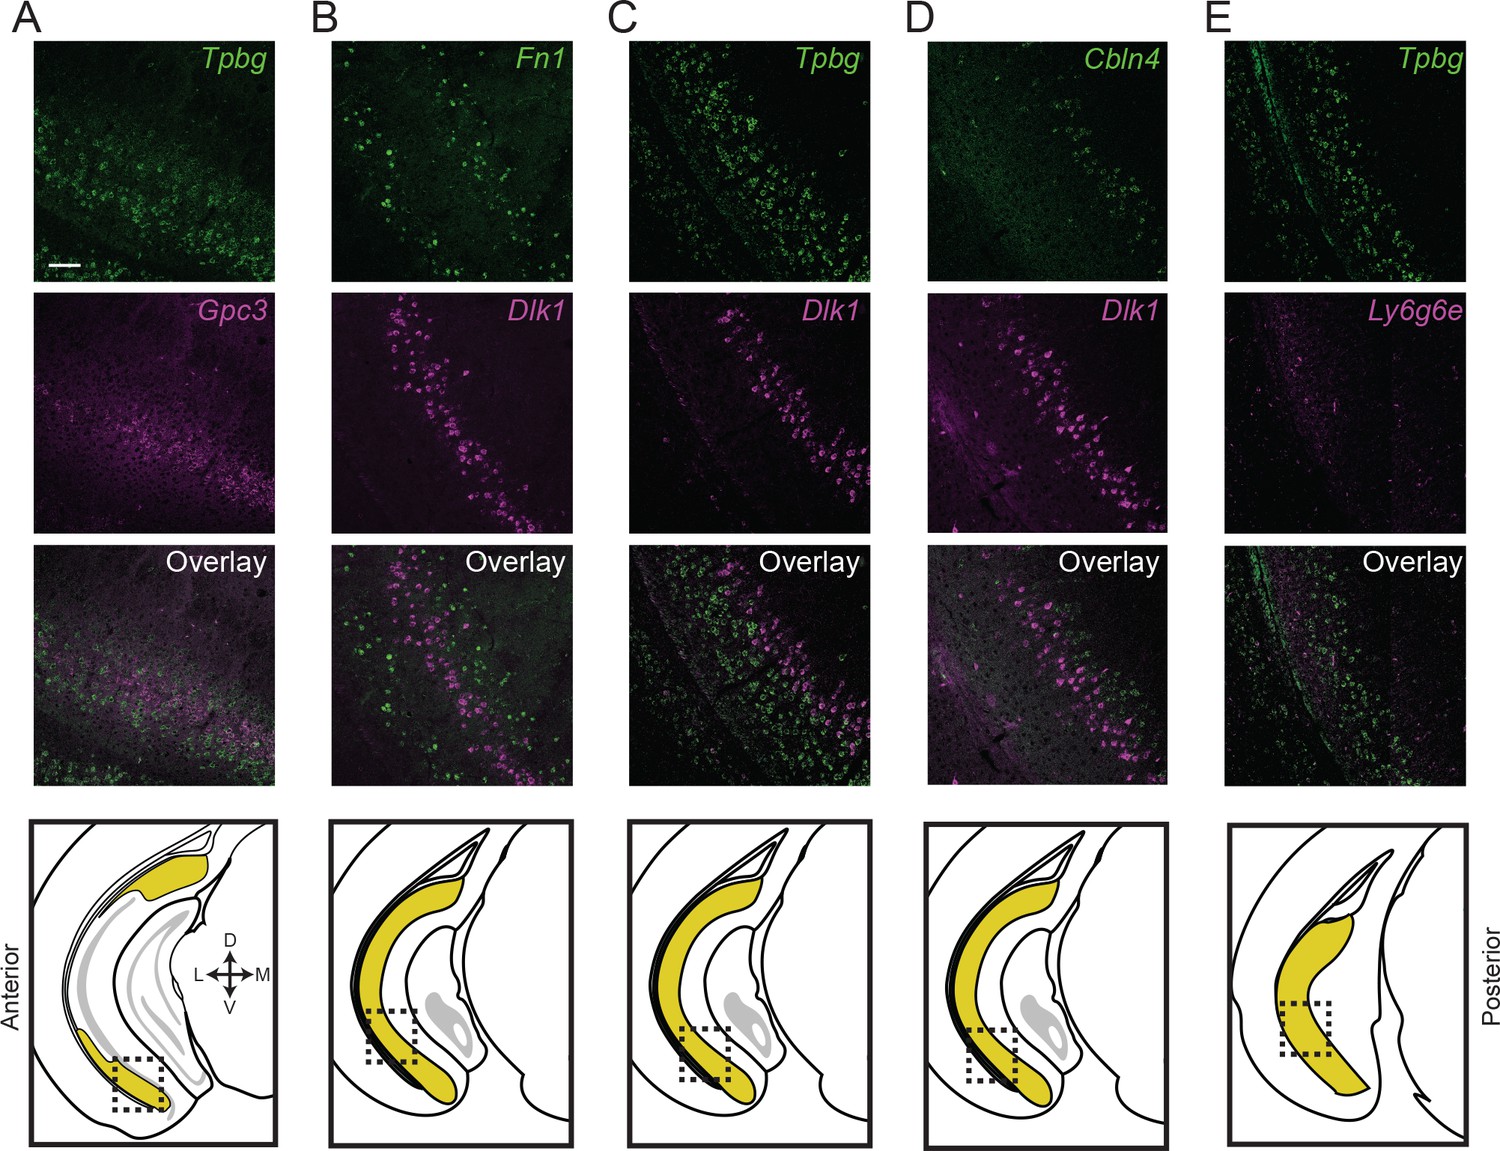
Subiculum subclasses exhibit discrete, abutting boundaries.
(A) Two-color fluorescent ISH detecting expression of Tpbg and Gpc3 marker genes, directly illustrating subiculum subdomains are abutting and non-overlapping. Atlas schematic in lowest row denotes area examined. (B-E) As in (A), but for Fn1 and Dlk1 (B), Tpbg and Dlk1 (C), Cbln4 and Dlk1 (D), and Tpbg and Ly6g6e (E). Scale bars: 100 μm.
Figure 6
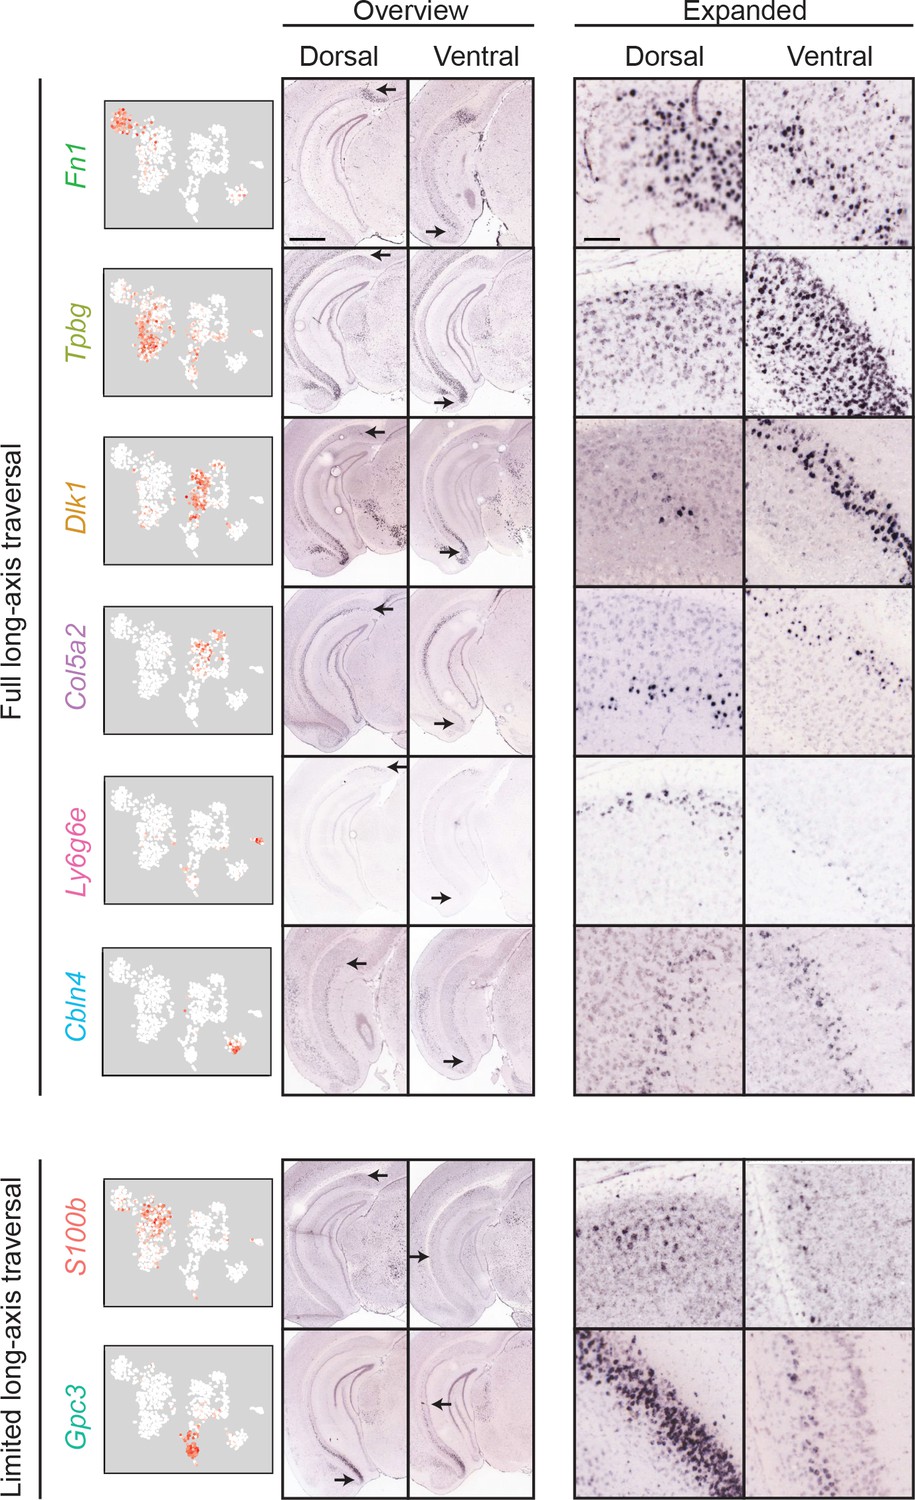
Most clusters span the full extent of the long axis.
First column: scRNA-seq clusters. Second and third columns: for each cluster, the dorsal (second column) and ventral (third column) extent of marker gene expression are indicated. Scale bar: 1 mm. Fourth and fifth columns: expanded illustration of the areas denoted by arrows. Scale bar: 100 μm.
Figure 7
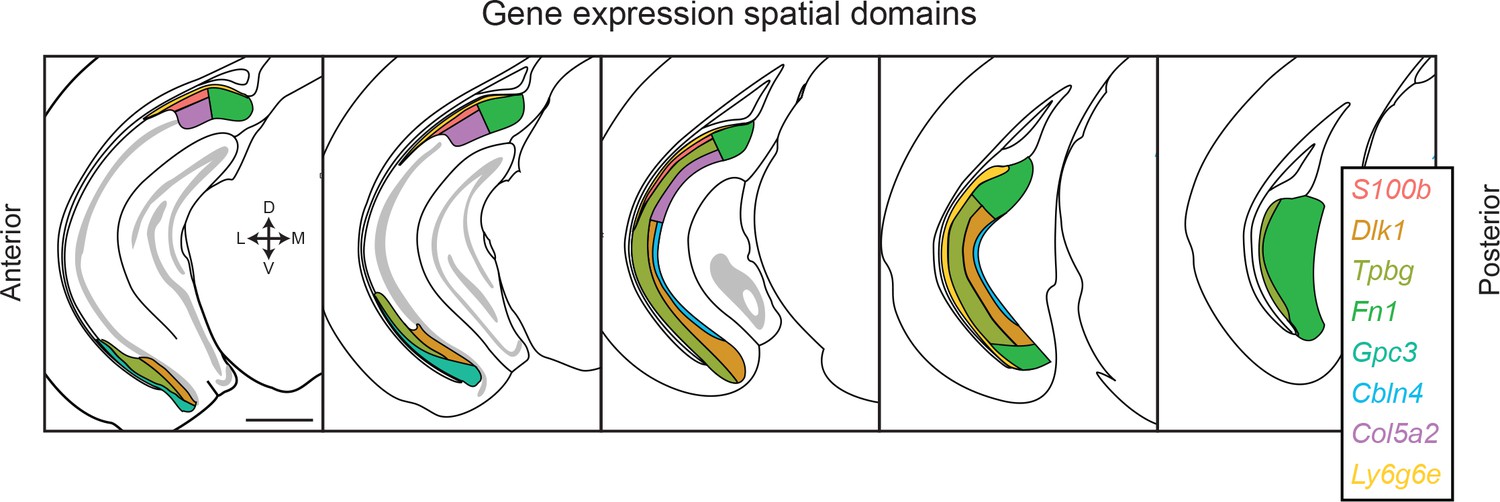
Transcriptomic landscape of the subiculum.
Schematized spatial domains are illustrated for scRNA-seq clusters across the anterior-posterior axis of the subiculum. The subiculum contains transcriptomically heterogeneous subclasses that conform to a complex geometry. Note that coloring convention for Ly6g6e has been changed relative to other figures to differentiate this subclass from the S100b-expressing subclass. Scale bar: 1 mm.
Figure 8 with 2 supplements
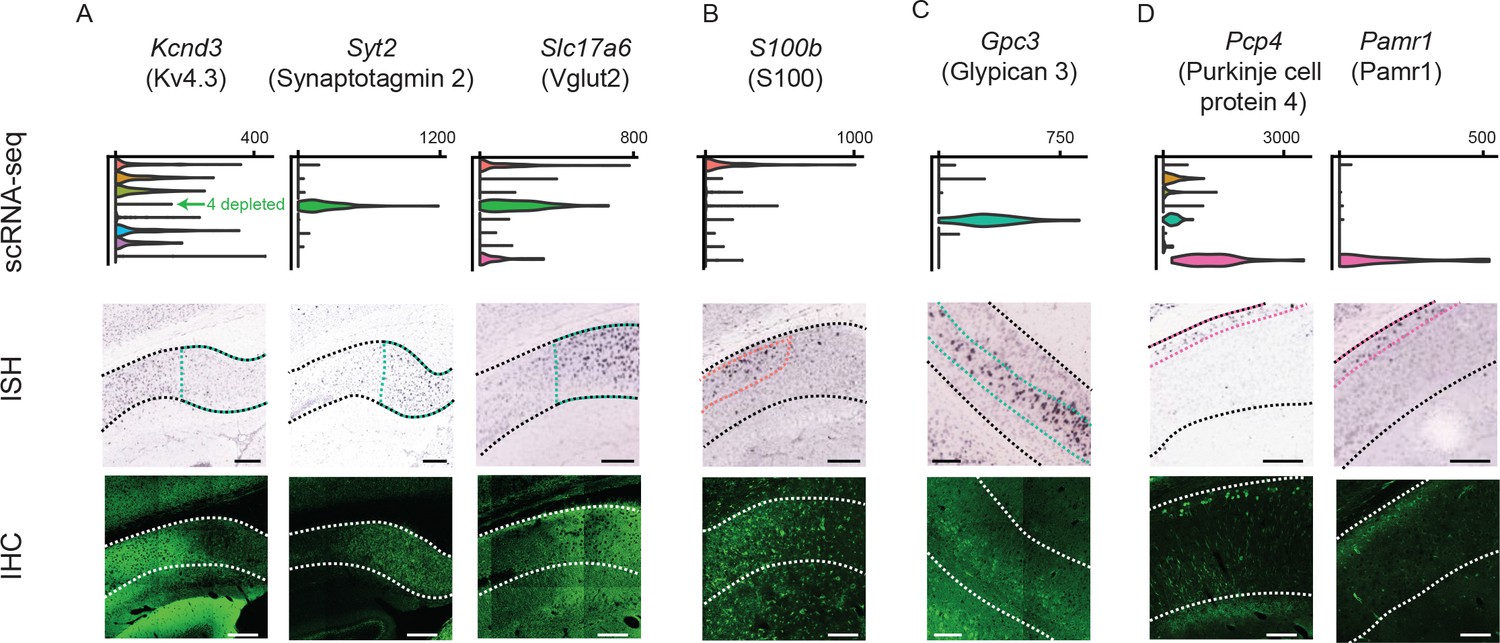
Differentially expressed genes correspond to cluster-specific protein products.
Top row: gene names, along with associated protein products targeted in IHC. Second row: violin plots of genes that were enriched or depleted in specific clusters. Third row: ISH images of corresponding genes. Black dashed lines illustrate extent of pyramidal cell layer. Colored dashed lines denote spatial domain of associated cluster. Fourth row: immunohistochemical detection of protein products. White dashed lines illustrate extent of pyramidal cell layer. (A) Gene products enriched or depleted in the Fn1-expressing cluster (i.e. cluster 4); namely, Kcnd3 (encoding the potassium channel subunit Kv4.3), Syt2 (encoding synaptotagmin 2, involved in exocytosis), and Slc17a6 (encoding Vglut2, mediating glutamate uptake into synaptic vesicles). (B) Results for S100, expressed in the S100b-expressing cluster (i.e. cluster 1). Note that the antibody recognizes S100 (i.e. both S100B and S100A) and thus labels astrocytes as well as neurons. (C) Results for the gene product Gpc3/Gpc3, enriched in the Gpc3-expressing cluster (i.e. cluster 5). (D) Results for the gene products Pcp4/Pcp4 and Pamr1/Pamr1, enriched in the Ly6g6e-expressing cluster (i.e. cluster 9). All scale bars: 200 μm.
Figure 8—figure supplement 1
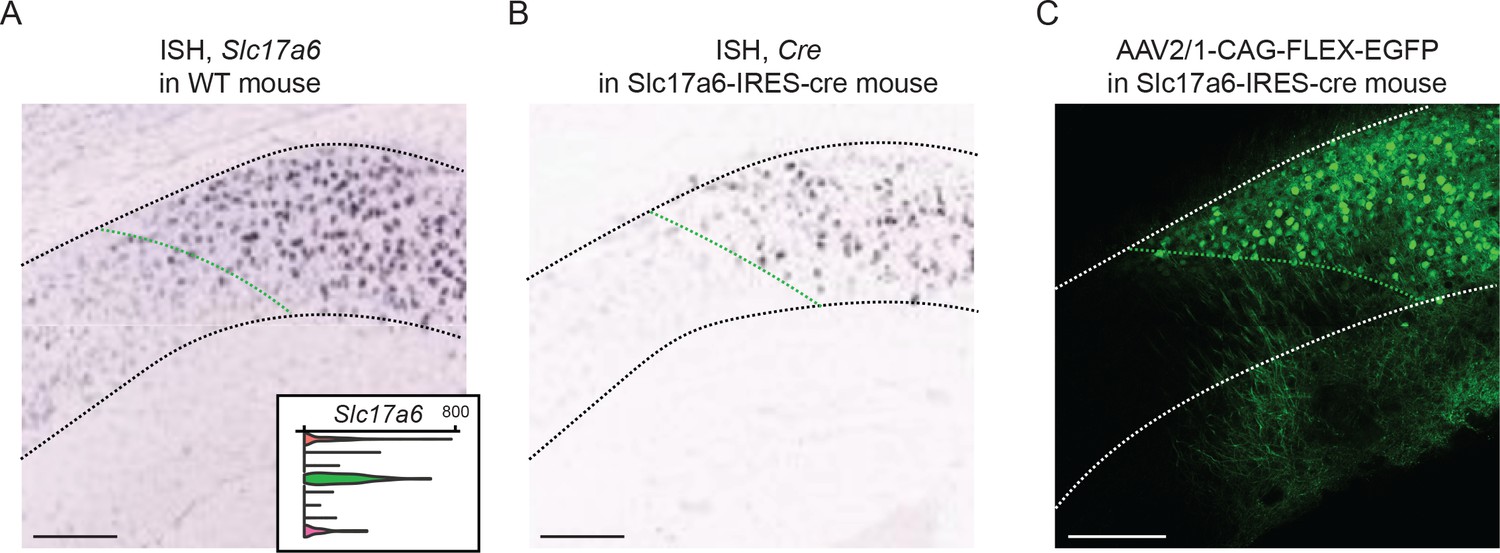
scRNA-seq results guide identification of cluster-specific transgenic mouse line.
(A) ISH image depicting Slc17a6 expression (encoding Vglut2) in the dorsal subiculum of the mouse brain. Expression of this gene is located distally, but not proximally. Insert denotes scRNA-seq results, wherein Slc17a6 is enriched in the green population. Black dashed line denotes pyramidal cell layer. (B) ISH image depicting Cre expression in the Slc17a6-ires-cre transgenic mouse line. Black dashed line denotes pyramidal cell layer. Image from Allen Transgenic Characterization. (C) Viral expression following Cre-dependent AAV2/1-CAG-FLEX-EGFP viral injection into the dorsal subiculum. White dashed line denotes pyramidal cell layer. In all panels, green dashed line denotes approximate boundary associated with Slc17a6-enriched cluster. Scale bars: 200 μm.
Figure 8—figure supplement 2

S100 protein is present in subiculum pyramidal cell bodies and primary dendrites in the proximal subiculum.
Left: Expansion of S100 protein labeled via immunohistochemistry in the spatial domain of cluster 1. In addition to astrocyte labeling (as expected from astrocyte-marking nature of S100), pyramidal cell bodies and primary dendrites are also apparent (examples denoted by large and small arrows, respectively). Right: As in left, but for a region of subiculum distal to the spatial domain of cluster 1. Note the general decrement in fluorescence, as well as lack of neuronal cell bodies and primary dendrites. Scale bars: 50 μm.
Figure 9 with 3 supplements
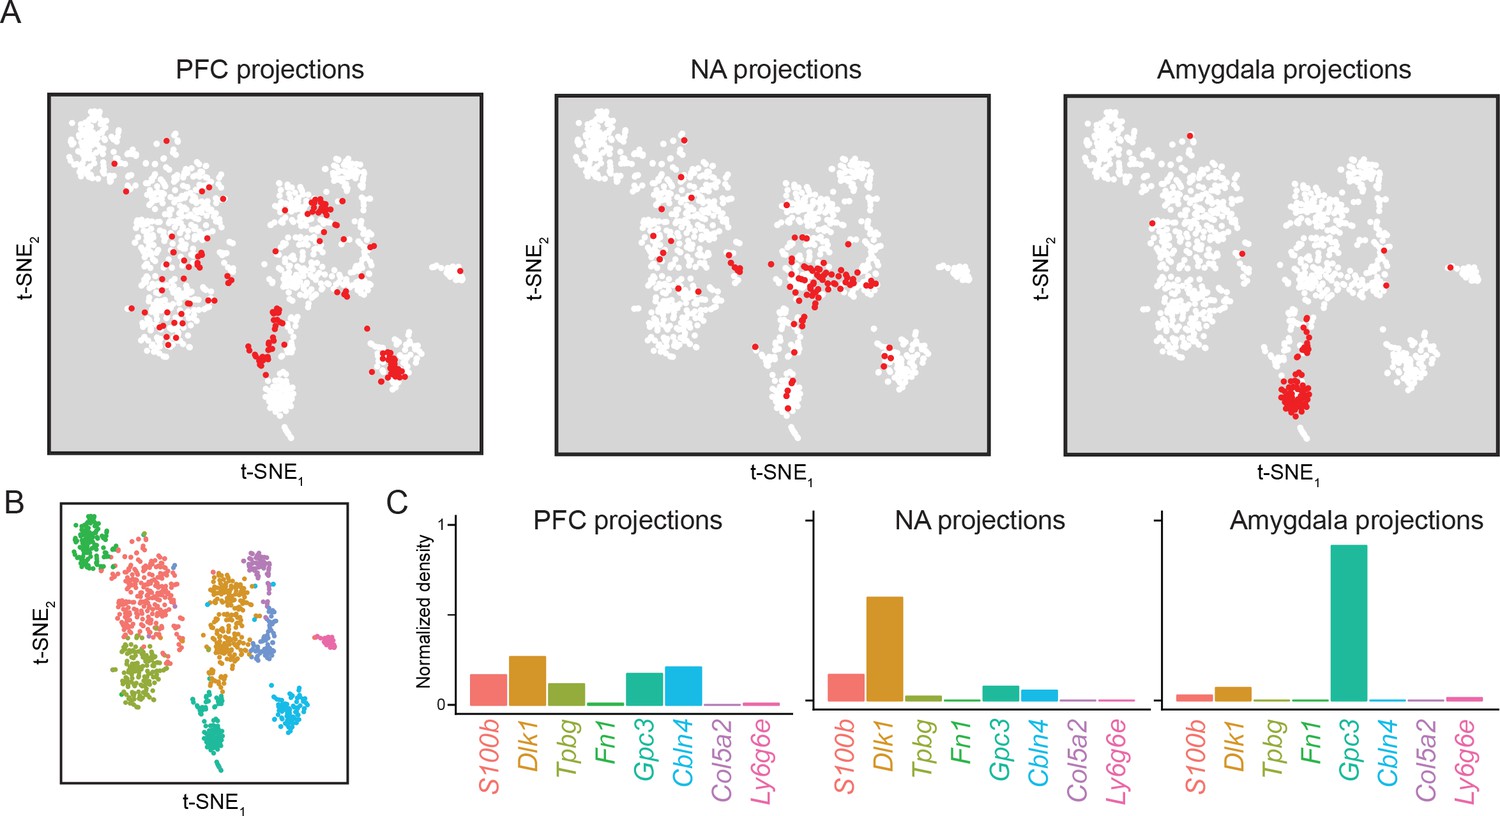
Subiculum transcriptomes based upon downstream projections.
(A) Cells corresponding to three downstream projections (prefrontal cortex, ‘PFC’; nucleus accumbens, ‘NA’; amygdala) are highlighted (red). (B) t-SNE plot of single-cell transcriptomes, illustrating cluster identity (as in Figure 2A). (C) Relative occupancy for each of the transcriptomic clusters, defined as the number of cluster-specific cells divided by the total number of projection cells, is shown for each projection class.
Figure 9—figure supplement 1
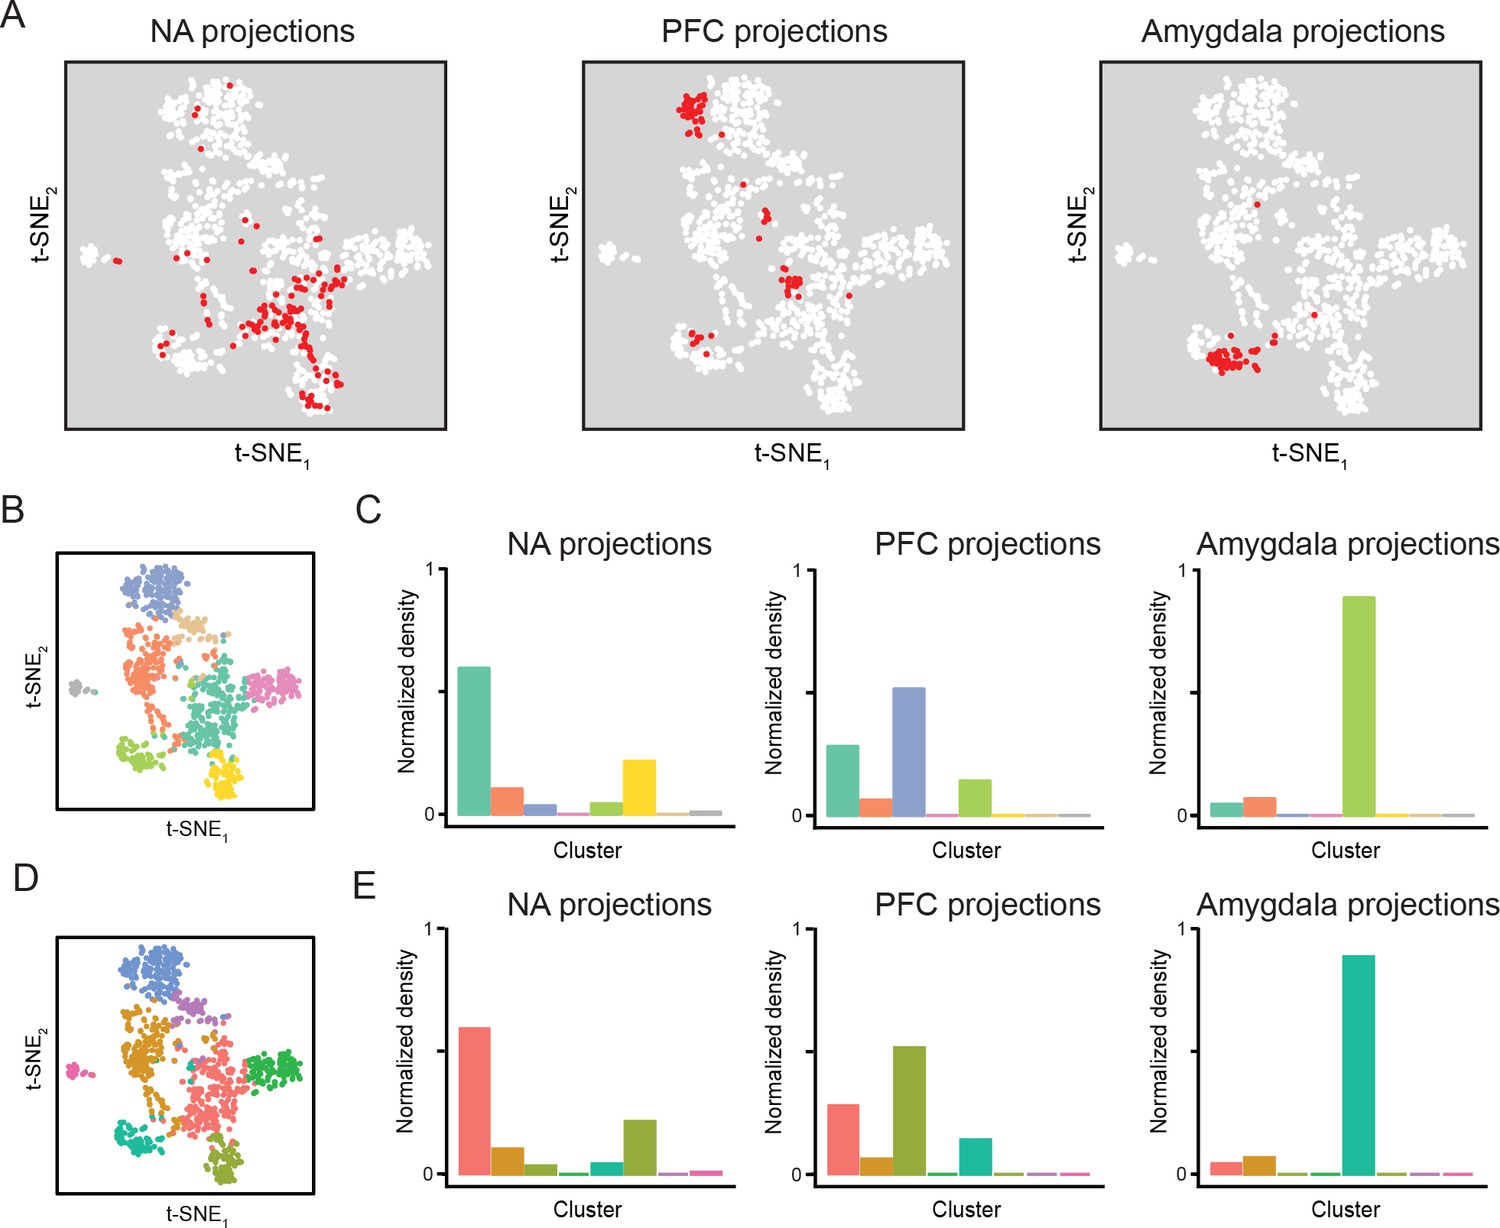
Projection-specific transcriptomes associated with replicate dataset.
(A) In the replicate dataset, cells corresponding to three downstream projections (prefrontal cortex, ‘PFC’; nucleus accumbens, ‘NA’; amygdala) are highlighted (red). (B) t-SNE plot of single-cell transcriptomes, illustrating cluster identity (as in Figure 2A). (C) Relative occupancy for each of the transcriptomic clusters, as in Figure 9C. (D,E) As in (B,C), but with coloring changed to match conventions of original dataset (as in Figure 2—figure supplement 3).
Figure 9—figure supplement 2
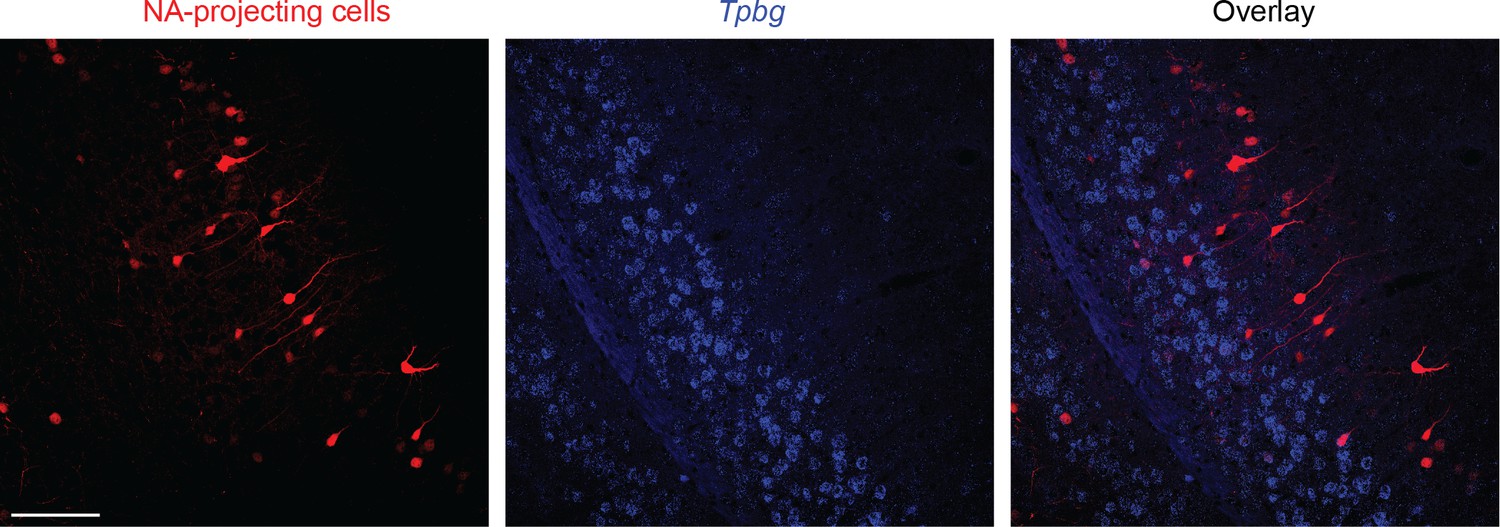
NA-projecting cells are associated with a different lamina than Tpbg-expressing cells.
Left: NA-projecting cells, labeled by AAV-SL1-CAG-tdT (rAAV2-retro: Tervo et al., 2016) following injection into the NA. Middle: expression of Tpbg. Right: overlay. Note that NA-projecting cells largely emerge from more superficial laminae than Tpbg-expressing cells. Overall, 97% of labeled cells were mutually exclusive for Tpbg expression and PFC projections (n = 275 total cells from n = 2 animals). Scale bar: 100 μm.
Figure 9—figure supplement 3
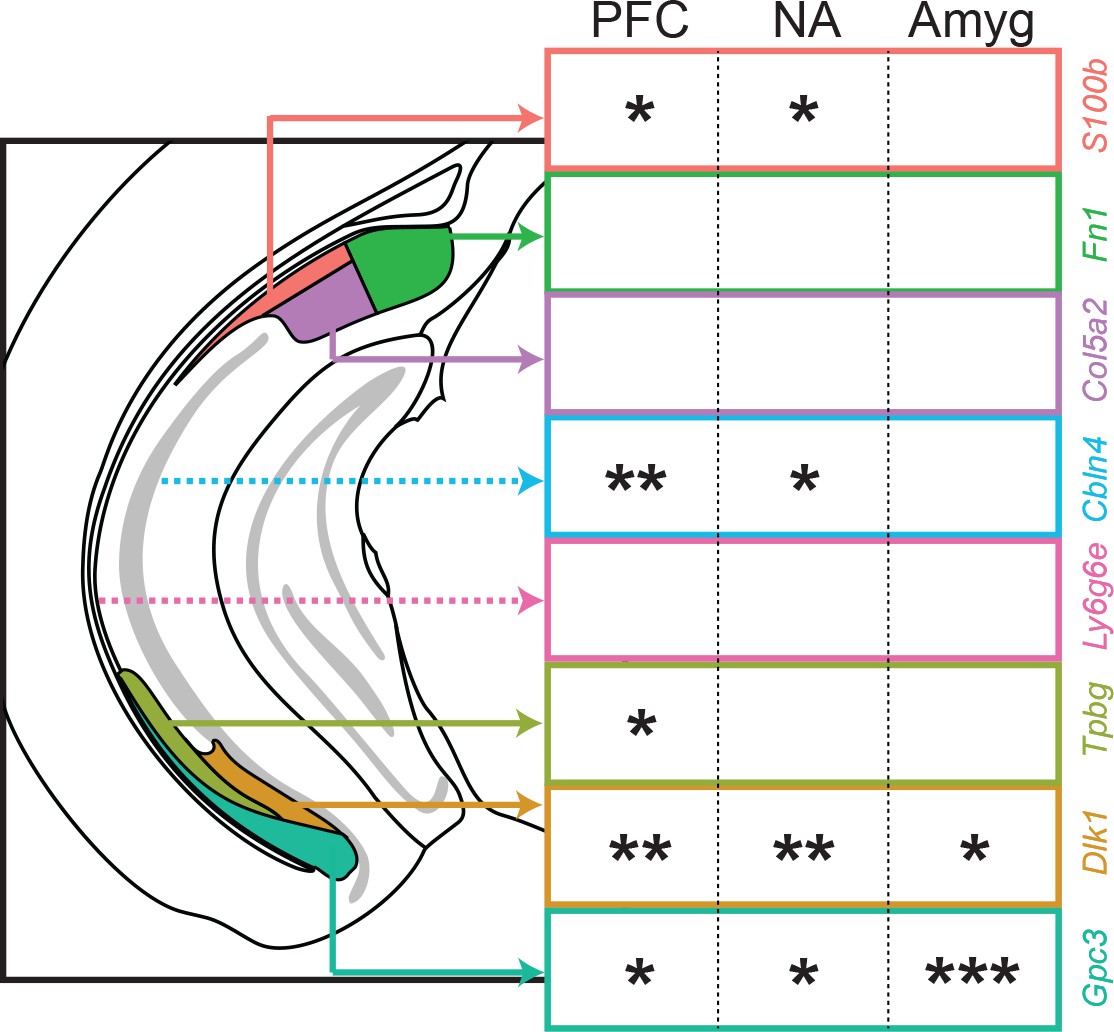
Spatial representation of projection classes.
For the three projection classes examined in this study (PFC, NA, amygdala), projection class strength is shown on a per-subclass basis. Single, double, and triple asterisks denote at least 5%, 20%, and 50% of subiculum projections associated with the corresponding subclass. Dashed lines indicate subclasses with spatial locations at different anterior or posterior sections than that represented in the schematic.
Author response image 1
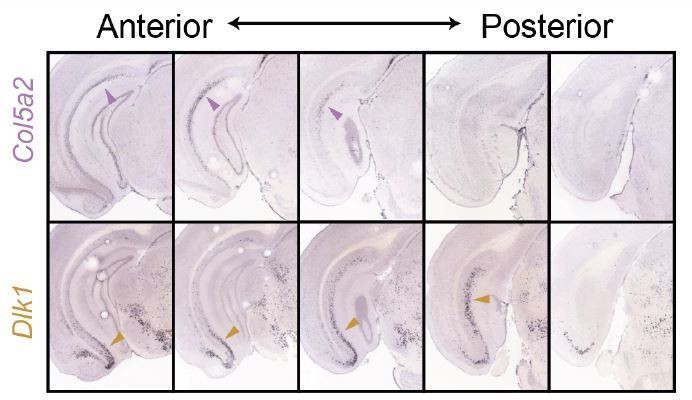
Side-by-side comparison of Col5a2 and Dlk1 across the subiculum.
ISH images from Figure 3 are shown.
Author response image 2
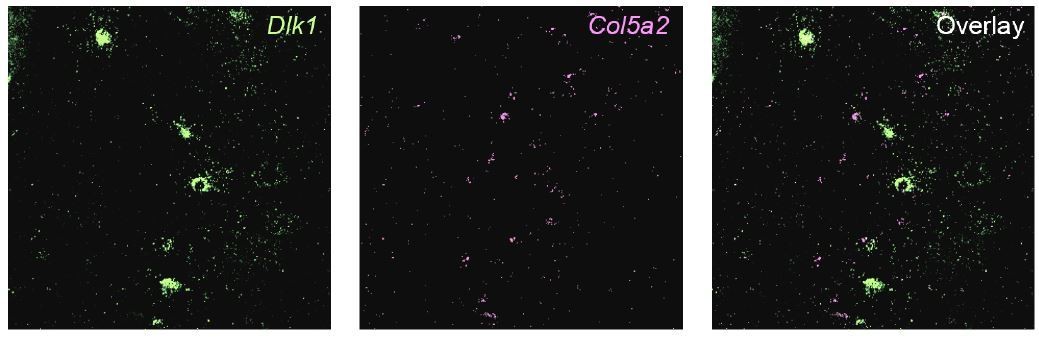
Two-color fISH of Dlk1 and Col5a2.
Representative image of expression of Dlk1 (green) and Col5a2 (magenta) in an intermediate region of the subiculum.
Author response image 3

Robustness of clusters across threshold values.
Each row corresponds to changing the value of a given parameter inherent to the FindVariableGenes call; specifically, x.low.cutoff (top row), x.high.cutoff (middle row), and y.cutoff (bottom row). Values explored are 3-fold decrements (left column) and 3-fold increments (right column) relative to manuscript value (middle column). Left to right, this constitutes nearly an order of magnitude difference in the parameter value. T-SNE visualizations and clustering results are shown for each parameter regime. Colours denote clusters obtained by graph-based approach used in main manuscript, with colouring associated with marker genes in main manuscript. Note, although in principal such lusters may be strongly affected by changes in these cutoff values, in practice they are not: marked stability is present in the number of clusters, the number of cells per cluster, and the marker genes associated with each cluster.
Author response image 4
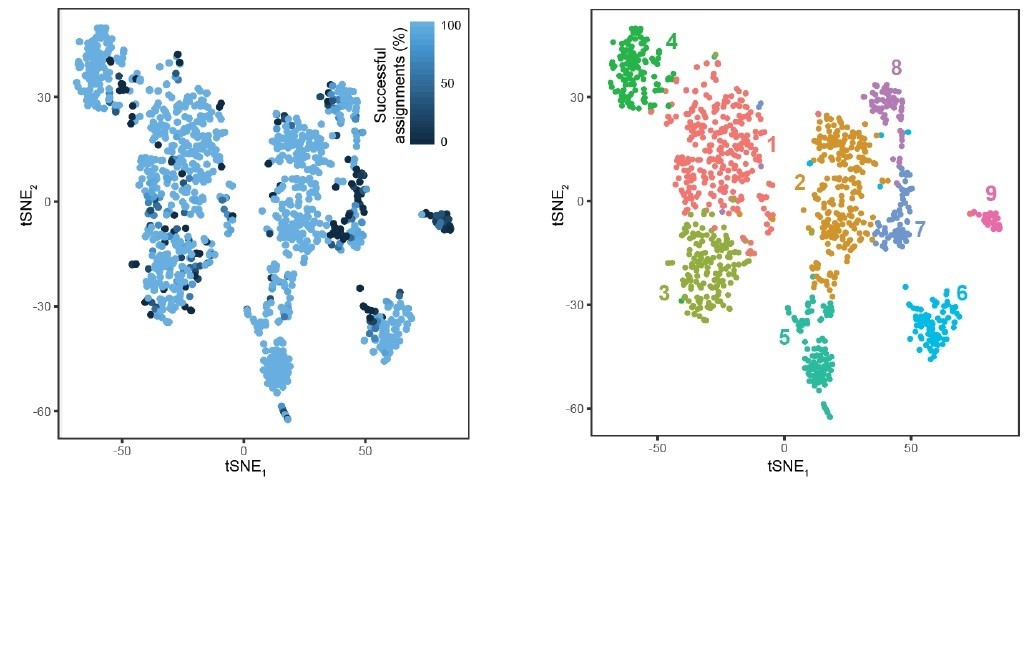
Response Figure 4.
Cellular resolution of cluster assignment. A total of 1000 stochastic simulations were run, wherein for each simulation, 800 cells were stochastically selected for training a random forest classifier and the remaining 303 cells in the dataset were used for testing this classifier (as in Figure 2—figure supplement 1B). Each cell is colored according to the percent of success identifications across test trials. For comparison, cluster designation is provided at right. Most cells exhibited near-perfect assignment for the correct clusters, with misassigned cells typically occupying the extrema of clusters. Notably, cluster 9 typically exhibited poor assignment, likely arising from its small and underrepresented nature in the dataset (24 cells or ∼2% of dataset; conventional random forest classifiers are biased against underrepresented classes). B. For comparison, the tSNE visualization of clusters is provided.
Tables
Key resources table
| Reagent type (species) or resource | Designation | Source or reference | Identifiers | Additional information |
|---|---|---|---|---|
| Strain, strain background (M. musculus) | Vglut2-IRES-Cre | Jackson | RRID: IMSR_JAX:016963 | |
| Antibody | Kv4.3 rabbit polyclonal | Alomone | APC-017; RRID: AB_2040178 | 1:200 |
| Antibody | Syt2 mouse monoclonal | DSHB | RRID: AB_531910 | 1:250 |
| Antibody | Vglut2 mouse monoclonal | Abcam | ab79157, RRID: AB_1603114 | 1:1000 |
| Antibody | S100 rabbit polyclonal | Abcam | ab868, RRID: AB_1603114 | 1:250 |
| Antibody | Gpc3 mouse monoclonal | Millipore | MABC667 | 1:250 |
| Antibody | Pcp4 rabbit polyclonal | Sigma | HPA005792, RRID: AB_1855086 | 1:250 |
| Antibody | Pamr1 rabbit polyclonal | Proteintech | 55310–1-AP, RRID: AB_11232 | 1:250 |
| Sequence-based reagent | Tpbg ISH probe | Advanced Cell Diagnostics | 521061-C3 | |
| Sequence-based reagent | Dlk1 ISH probe | Advanced Cell Diagnostics | 405971-C2 | |
| Sequence-based reagent | Gpc3 ISH probe | Advanced Cell Diagnostics | 418541 | |
| Sequence-based reagent | Fn1 ISH probe | Advanced Cell Diagnostics | 310311 | |
| Sequence-based reagent | Cbln4 ISH probe | Advanced Cell Diagnostics | 428471 | |
| Sequence-based reagent | Ly6g6e ISH probe | Advanced Cell Diagnostics | 506391-C2 | |
| Software, algorithm | R | https://www.r-project.org | SCR_001905 | |
| Software, algorithm | Seurat | https://satijalab.org/seurat/ | SCR_007322 | |
| Software, algorithm | Fiji | https://imagej.net/Fiji | RRID:SCR_002285 | |
| Software, algorithm | Custom scripts | This study | DOI:10.6084/m9.figshare.7140350 | Scripts used to analyze scRNA-seq data |
| Other | Retrobeads | Lumafluor | ‘Overview of subiculum scRNA-seq atlas: construction, validation, and extension’ | |
| Other | AAV-SL1-CAG-tdT | Janelia Viral Core | ‘Higher-order correlates of transcriptomic clusters’ |
Additional files
-
Supplementary file 1
List of cluster-specific enriched genes.
See tableS1.txt.
- https://doi.org/10.7554/eLife.37701.023
-
Supplementary file 2
List of cluster-specific enriched genes in pairwise comparisons.
See tableS2.txt.
- https://doi.org/10.7554/eLife.37701.024
-
Supplementary file 3
List of Allen Mouse Brain Atlas images used in text.
See tableS3.txt.
- https://doi.org/10.7554/eLife.37701.025
-
Transparent reporting form
- https://doi.org/10.7554/eLife.37701.026
Download links
A two-part list of links to download the article, or parts of the article, in various formats.
Downloads (link to download the article as PDF)
Open citations (links to open the citations from this article in various online reference manager services)
Cite this article (links to download the citations from this article in formats compatible with various reference manager tools)
The subiculum is a patchwork of discrete subregions
eLife 7:e37701.
https://doi.org/10.7554/eLife.37701


