The subiculum is a patchwork of discrete subregions
Abstract
In the hippocampus, the classical pyramidal cell type of the subiculum acts as a primary output, conveying hippocampal signals to a diverse suite of downstream regions. Accumulating evidence suggests that the subiculum pyramidal cell population may actually be comprised of discrete subclasses. Here, we investigated the extent and organizational principles governing pyramidal cell heterogeneity throughout the mouse subiculum. Using single-cell RNA-seq, we find that the subiculum pyramidal cell population can be deconstructed into eight separable subclasses. These subclasses were mapped onto abutting spatial domains, ultimately producing a complex laminar and columnar organization with heterogeneity across classical dorsal-ventral, proximal-distal, and superficial-deep axes. We further show that these transcriptomically defined subclasses correspond to differential protein products and can be associated with specific projection targets. This work deconstructs the complex landscape of subiculum pyramidal cells into spatially segregated subclasses that may be observed, controlled, and interpreted in future experiments.
https://doi.org/10.7554/eLife.37701.001Introduction
To interpret the complexity of the brain, neuroscience has sought to deconstruct brain regions and circuits into elemental and interpretable cell types (Zeng and Sanes, 2017). Historically, this deconstruction has employed morphological and electrophysiological approaches, giving rise to the classical cell-type definitions that broadly delineate cells in the brain. Modern neuroscientific tools now enable high-throughput interrogation of complementary modalities, including gene expression and connectivity, to further partition and refine these cell types. Ultimately, a unified deconstruction of the nervous system will require projecting such modern, neurobiologically relevant elaborations onto classical cell types.
The hippocampus of the mammalian brain provides a comprehensively studied brain region to identify such cell-type-specific elaborations and relate them to function. This brain region has been studied extensively for its critical roles in episodic memory (Scoville and Milner, 1957), spatial navigation (O'Keefe and Nadel, 1978), and emotionally motivated behavior (Kjelstrup et al., 2002). To date, evidence is emerging that suggests heterogeneity within classical cell types of the hippocampus may be an important feature for mediating hippocampal computation and function (Cembrowski et al., 2016a; Cembrowski et al., 2016b; Danielson et al., 2016; Igarashi et al., 2014; Knierim et al., 2014; Lee et al., 2015; Lee et al., 2014; Soltesz and Losonczy, 2018; Strange et al., 2014; Thompson et al., 2008).
One of these classical cell types is the pyramidal cell type of the subiculum, which acts as an output from the hippocampus to a wide array of downstream targets (Aggleton and Christiansen, 2015; Naber and Witter, 1998). We recently found that the dorsal pole of the subiculum can be partitioned into distinct proximal and distal subregions (Cembrowski et al., 2018), motivating us to investigate whether additional heterogeneity could be revealed when considering the full spatial extent of the subiculum. Indeed, recent investigations using immunohistochemical labeling argue that the proximal subiculum is composed of a molecular layer and multiple cell body layers, each distinguished by molecular and morphological differences, while the distal subiculum is more uniform (Ishihara and Fukuda, 2016). Additionally, as specific downstream projections and postulated functional contributions change across space in the subiculum (Böhm et al., 2018; Bubb et al., 2017; Ishihara and Fukuda, 2016; Naber and Witter, 1998; O'Mara et al., 2009), understanding subicular organizational rules will likely be critical for a cell-type-specific deconstruction of memory, cognition, and emotion.
Here, we took a multimodal approach to understanding the organizational logic of the subiculum. Using single-cell next-generation RNA sequencing (scRNA-seq), we found that subiculum pyramidal cells could be partitioned into eight subclasses. We were able to register these subclasses in space, uncovering a patchwork landscape of subicular subfields. We subsequently mapped these subfields onto specific protein products and projection targets. We provide these scRNA-seq data, in conjunction with analysis and visualization tools, as a public resource. In total, this work produces a multimodal deconstruction of a key brain region, and will serve as a foundation for continuing to unravel the cell-type-specific rules of cognition.
Results
Overview of subiculum scRNA-seq atlas: construction, validation, and extension
We took two complementary approaches to obtain cells for our subiculum scRNA-seq atlas (overview: Figure 1; initial analysis: Figure 2). In one set of experiments, we microdissected out dorsal, intermediate, and ventral regions of the subiculum from wild-type mice (n = 3 mice total, one mouse per region). We dissociated these subiculum regions and manually selected cells for sequencing. In a second set of experiments, we injected retrograde beads into subiculum targets, labeling specific projection classes of subiculum cells (n = 3 mice total, one mouse per projection class). In these experiments, the subiculum was microdissected and dissociated, and manual selection was used to specifically purify for labeled cells. In both experiments, library preparation, sequencing, and analysis were handled according to previous methods (Cembrowski et al., 2018) (see Materials and methods).

Overview of the generation, validation, and extension of the transcriptomic landscape of subiculum pyramidal cells.
(A) Two strategies, based upon geography and projections, were used to select cells for scRNA-seq. (B) Single-cell transcriptomes were constructed and analyzed. (C) Subclasses revealed by scRNA-seq were cross-validated and spatially registered by in situ hybridization. (D) Higher order features (e.g. projection classes) were mapped onto subclasses.

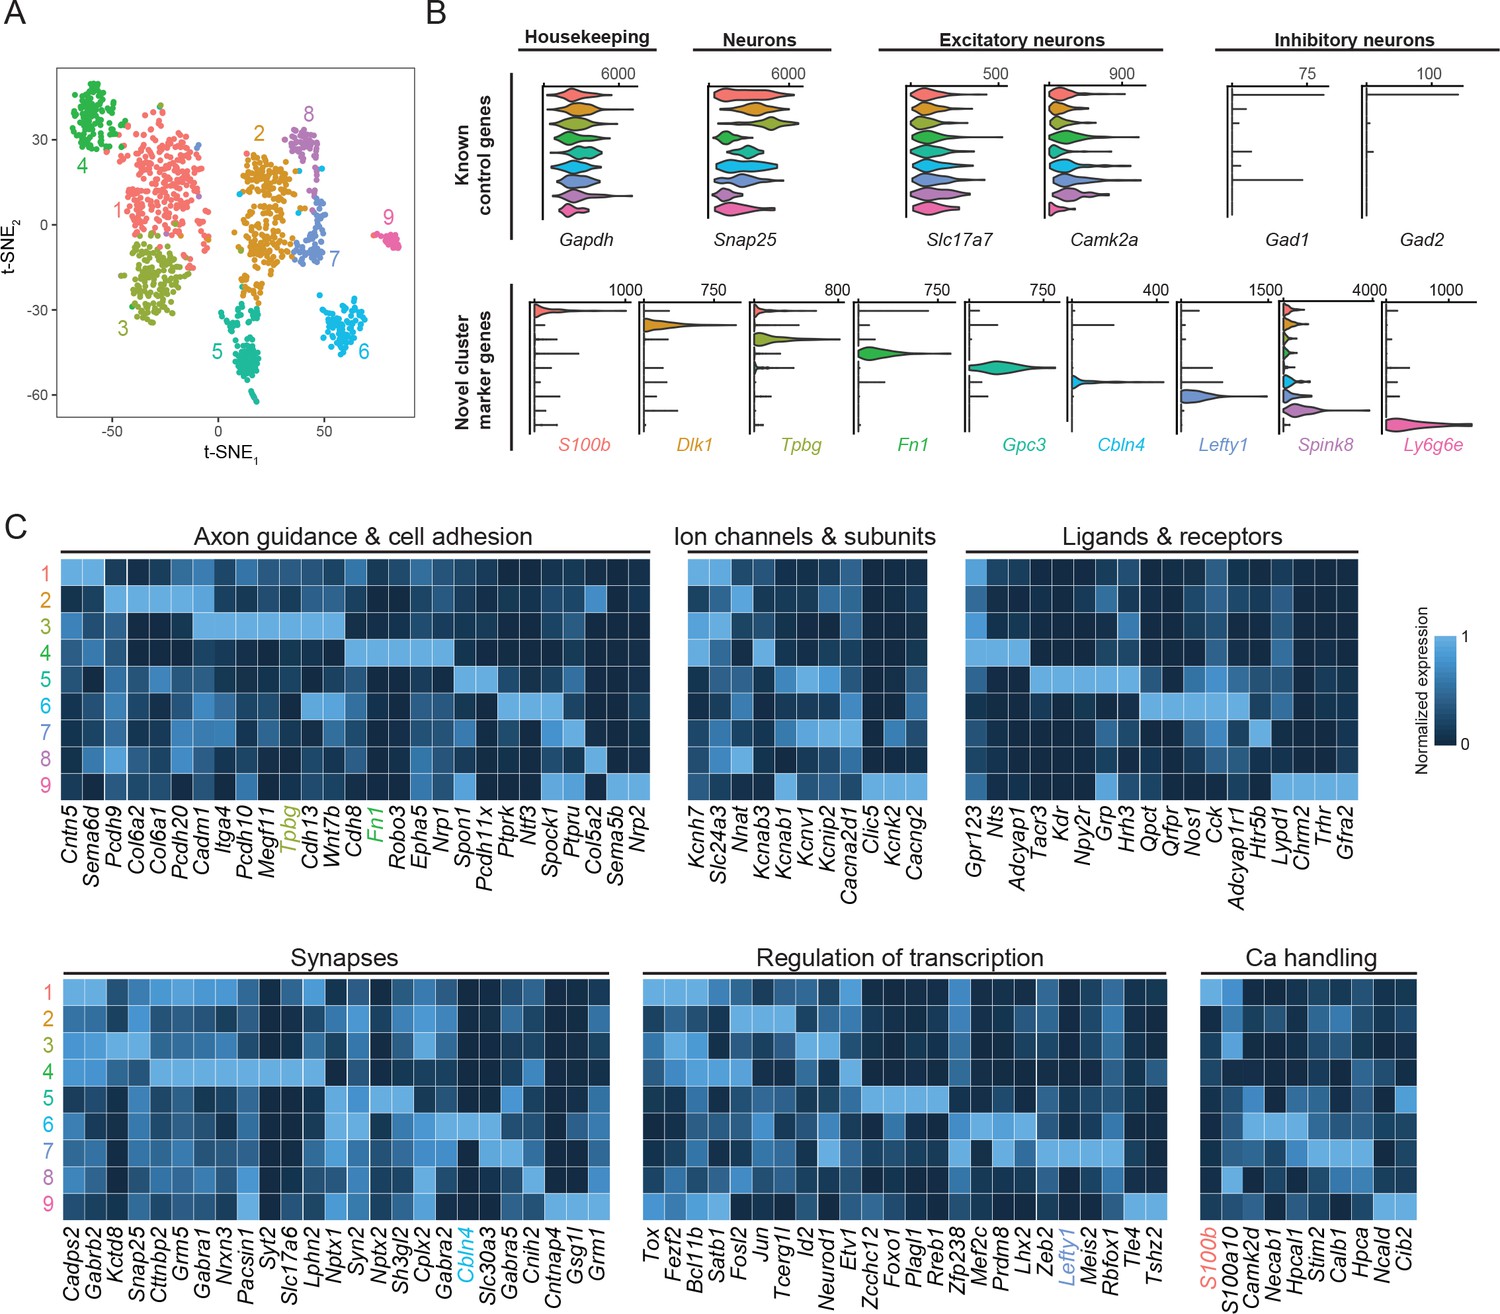
Subiculum pyramidal cells are divisible into transcriptomic subclasses.
(A) Gene expression across cells of the subiculum, visualized by t-SNE. Colors indicate cluster identified by graph-based clustering, with cluster number provided alongside. (B) Expression of control genes and cluster-specific marker genes, summarized across clusters. Results are depicted as violin plots, which illustrate the smoothed distribution of expression across all cells. (C) Heatmap of genes with neuronally relevant ontologies that are enriched or depleted in individual clusters. Marker genes that correspond to specific ontologies are colored according to their respective cluster. Note that some marker genes (specifically Dlk1, Gpc3, Spink8, Ly6g6e) do not correspond to the ontologies shown here.
This approach obtained high-read-depth, high-quality transcriptomes from 1150 cells (5.6 ± 1.0 thousand expressed genes/cell, mean ± SD). Data from these cells, in conjunction with user-friendly analysis and visualization tools, are available on http://hipposeq.janelia.org. To ensure that the results and conclusions of our scRNA-seq analysis were robust and predicted higher order features, we validated predictions from this dataset with additional biological replicates (Figure 2—figure supplement 3) and cross-validated and extended our findings using in situ hybridization (Figures 3–7), immunohistochemistry (Figure 8), and projection mapping (Figure 9).

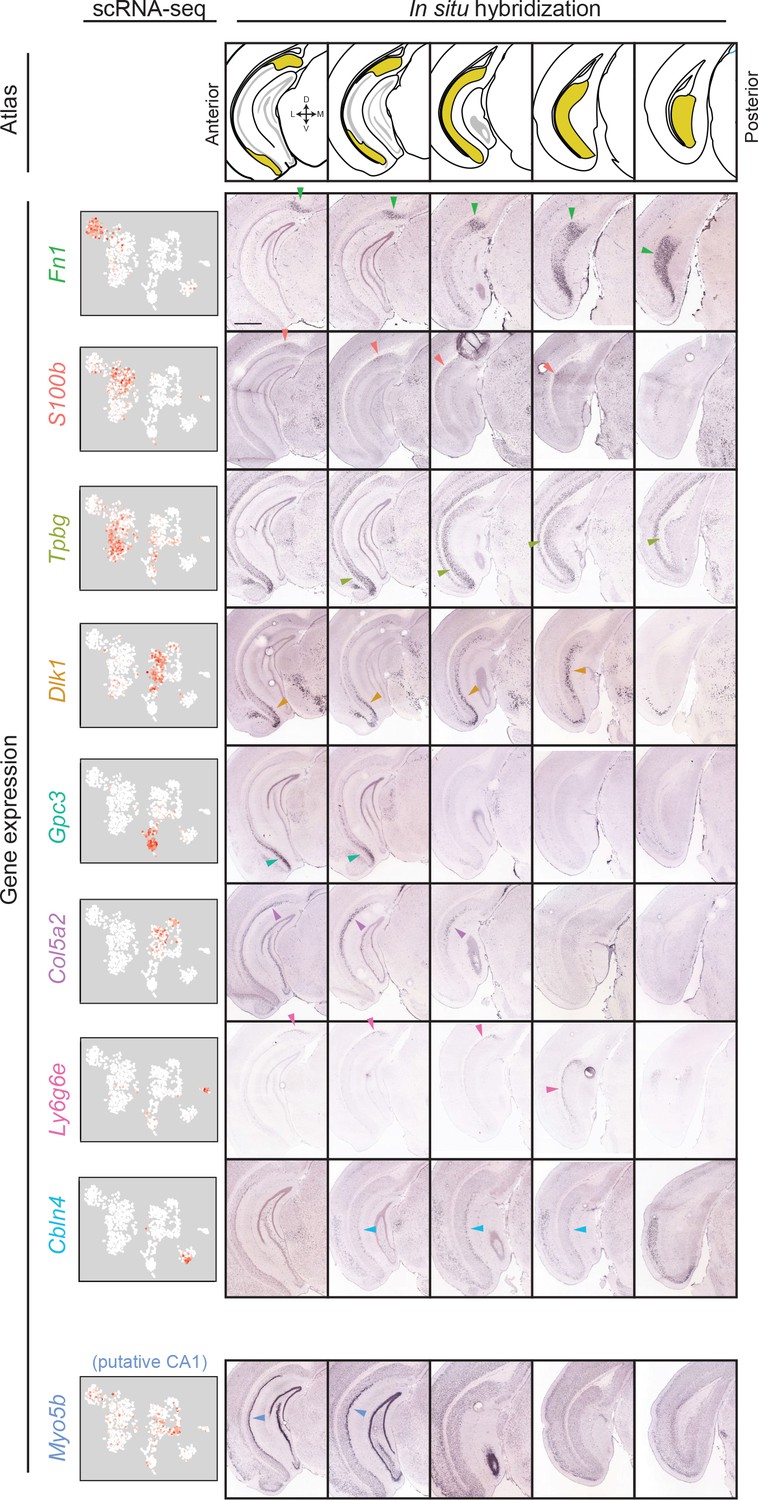
Gene expression clusters map onto distinct spatial domains in the subiculum.
For each transcriptomic cluster, expression of a corresponding marker gene is shown across the anterior-posterior axis of the subiculum. Arrows indicate example regions of dense expression referred to in main text. Atlas images illustrate subiculum colored in yellow (atlas images, here and elsewhere, modified from Paxinos and Franklin, 2004), with cardinal directions corresponding to dorsal, ventral, medial, and lateral directions. scRNA-seq images illustrate expression colored from white to red on a logarithmic scale. Histological images illustrate coronal sections from the Allen Brain Atlas (Lein et al., 2007). Scale bar: 1 mm.

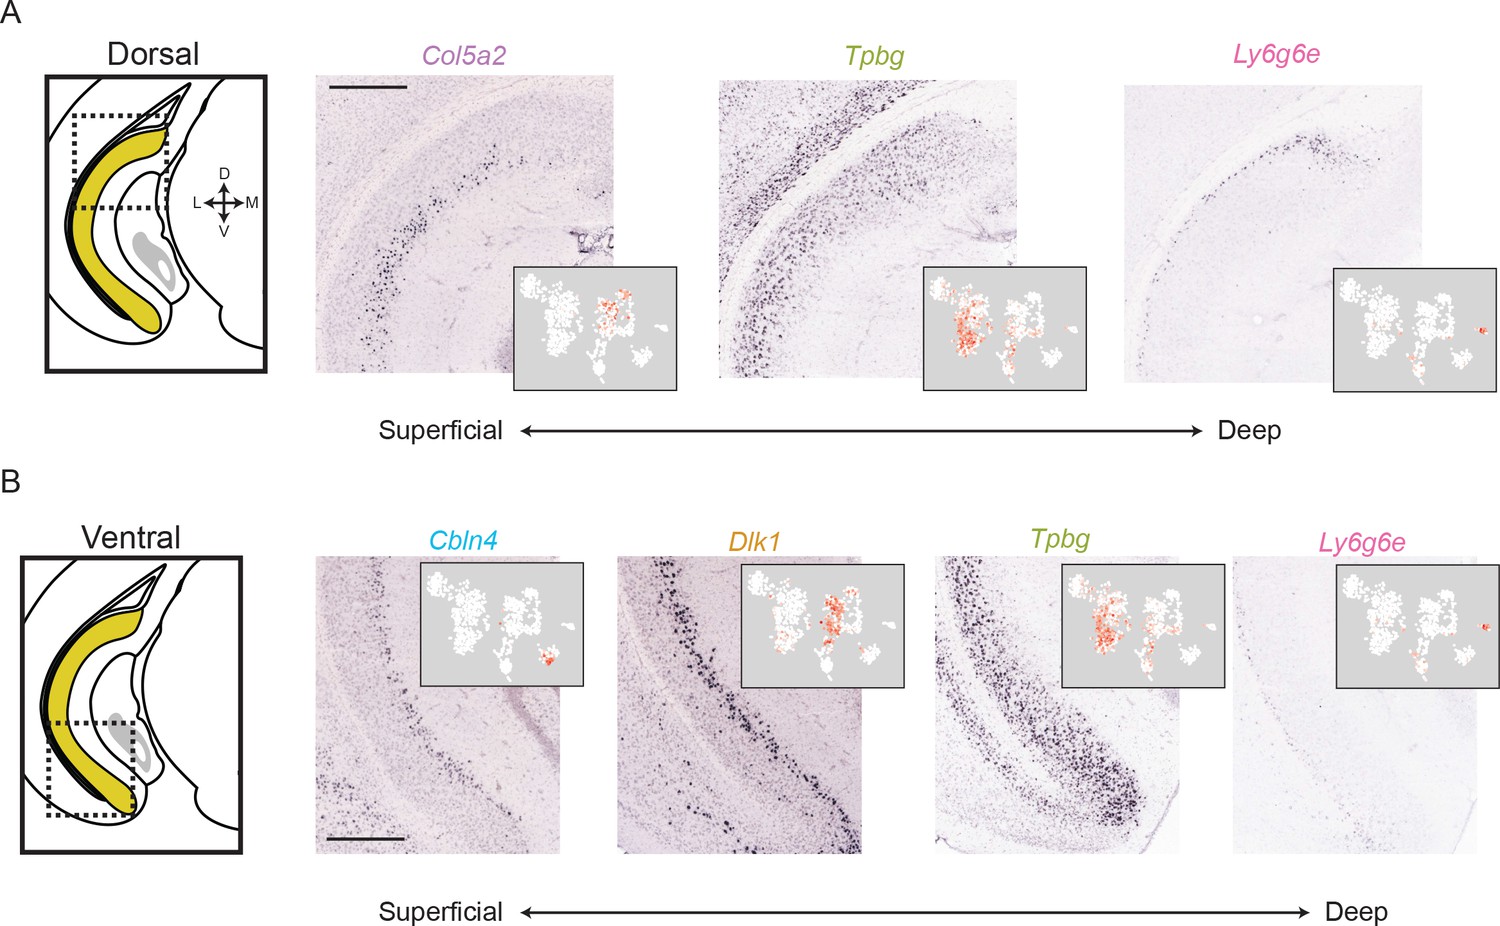
The subiculum can be deconstructed into distinct lamina across the long axis.
(A) For a dorsal region of the subiculum (atlas at left), marker gene expression exhibits a superficial-to-deep lamination pattern. Scale bar: 500 μm. (B). As in A, but for marker gene expression in the ventral subiculum. Scale bar: 500 μm.

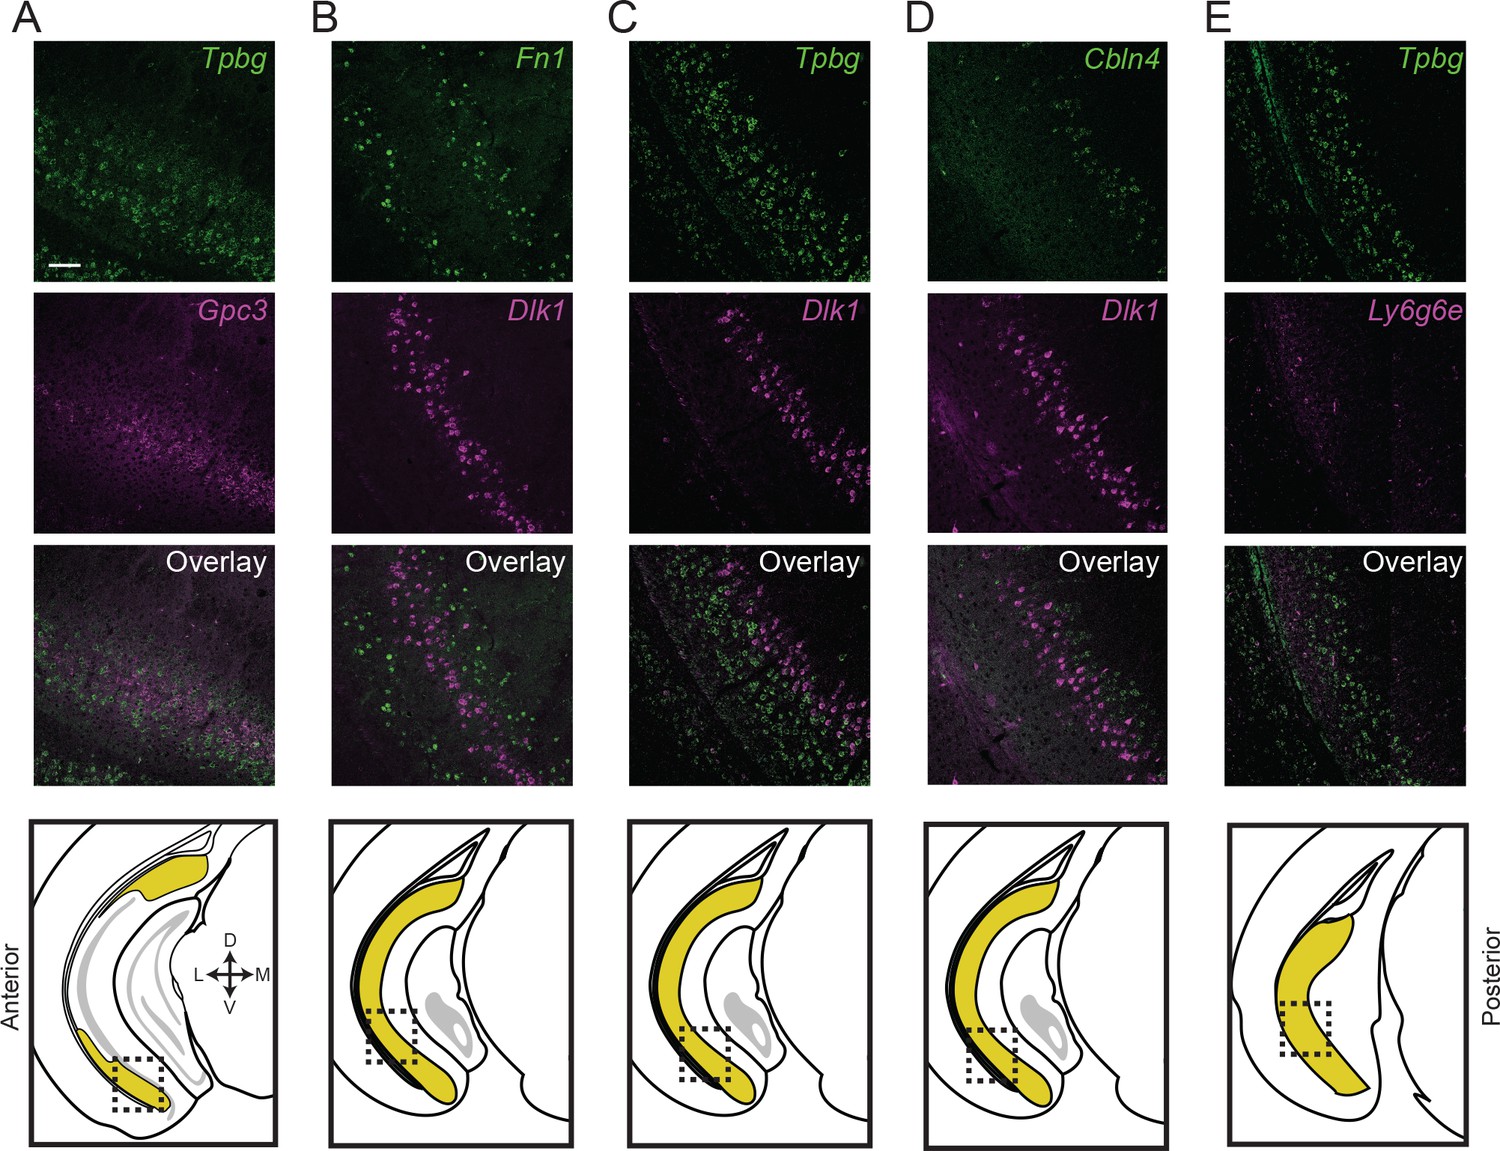
Subiculum subclasses exhibit discrete, abutting boundaries.
(A) Two-color fluorescent ISH detecting expression of Tpbg and Gpc3 marker genes, directly illustrating subiculum subdomains are abutting and non-overlapping. Atlas schematic in lowest row denotes area examined. (B-E) As in (A), but for Fn1 and Dlk1 (B), Tpbg and Dlk1 (C), Cbln4 and Dlk1 (D), and Tpbg and Ly6g6e (E). Scale bars: 100 μm.

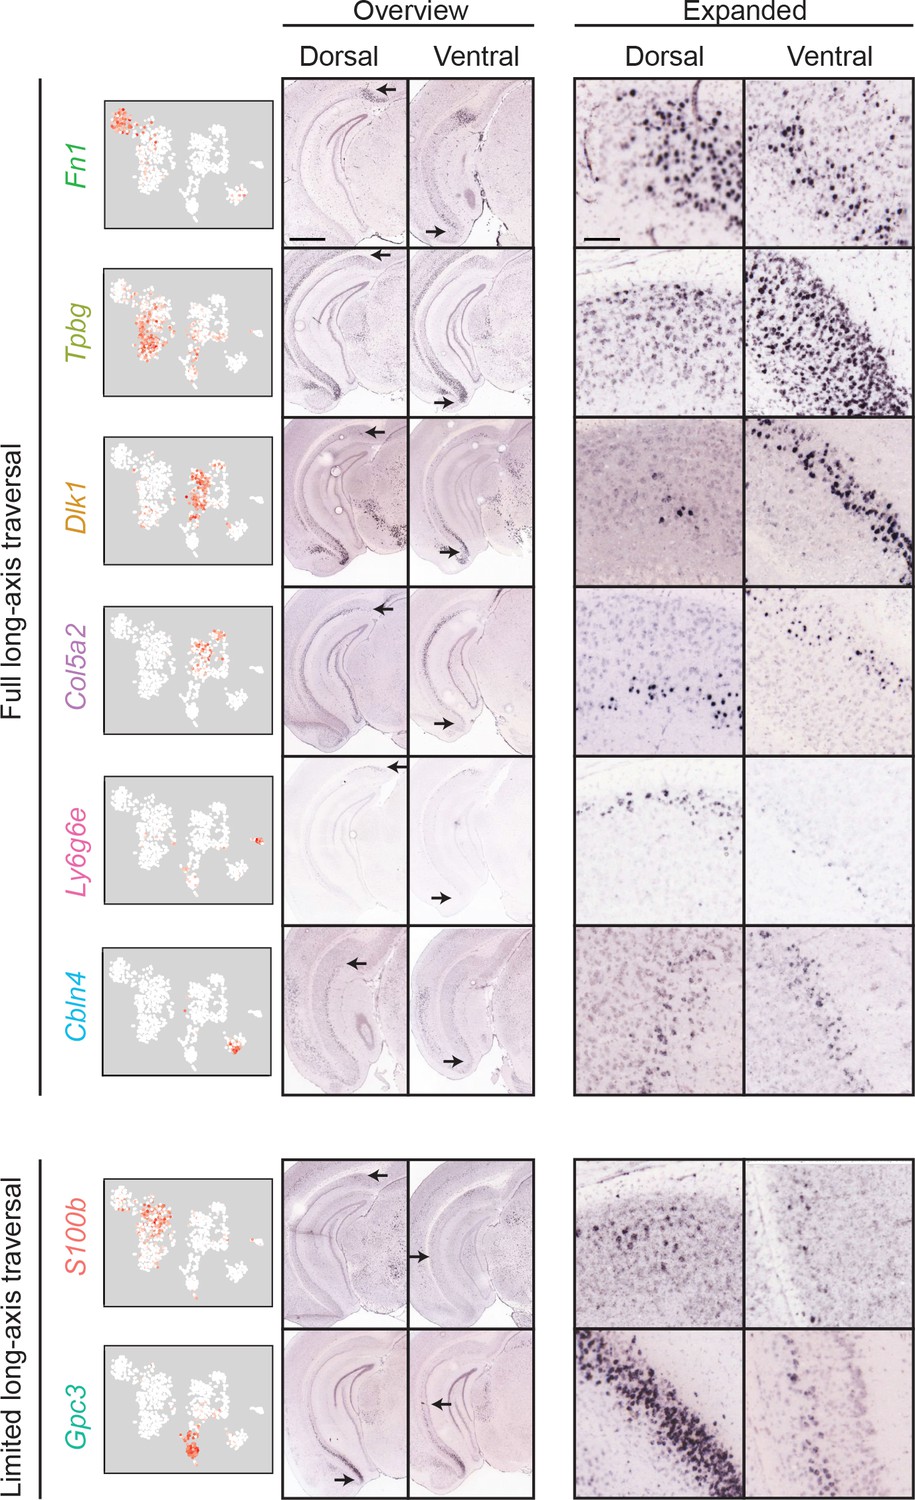
Most clusters span the full extent of the long axis.
First column: scRNA-seq clusters. Second and third columns: for each cluster, the dorsal (second column) and ventral (third column) extent of marker gene expression are indicated. Scale bar: 1 mm. Fourth and fifth columns: expanded illustration of the areas denoted by arrows. Scale bar: 100 μm.

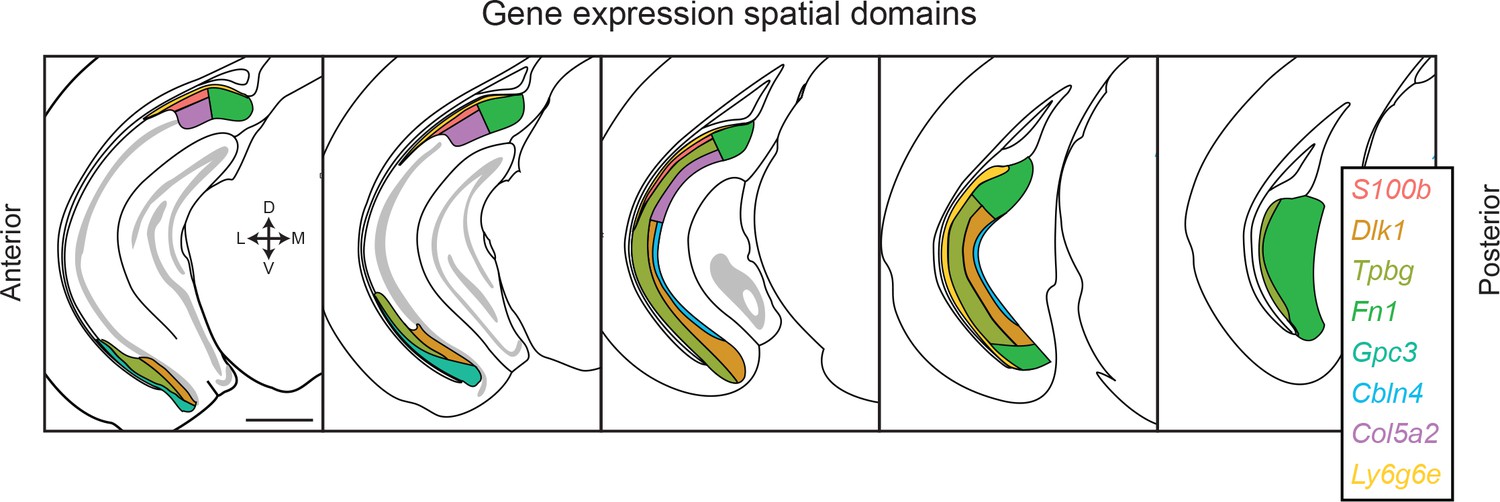
Transcriptomic landscape of the subiculum.
Schematized spatial domains are illustrated for scRNA-seq clusters across the anterior-posterior axis of the subiculum. The subiculum contains transcriptomically heterogeneous subclasses that conform to a complex geometry. Note that coloring convention for Ly6g6e has been changed relative to other figures to differentiate this subclass from the S100b-expressing subclass. Scale bar: 1 mm.

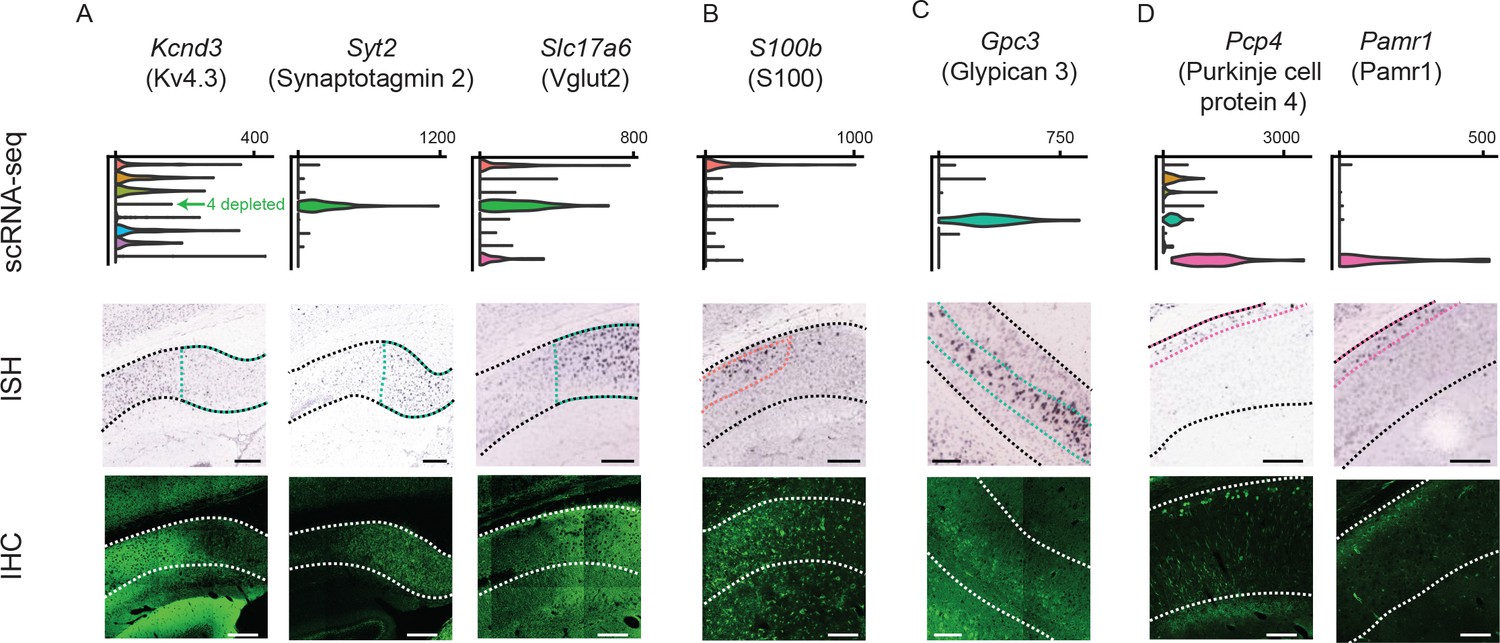
Differentially expressed genes correspond to cluster-specific protein products.
Top row: gene names, along with associated protein products targeted in IHC. Second row: violin plots of genes that were enriched or depleted in specific clusters. Third row: ISH images of corresponding genes. Black dashed lines illustrate extent of pyramidal cell layer. Colored dashed lines denote spatial domain of associated cluster. Fourth row: immunohistochemical detection of protein products. White dashed lines illustrate extent of pyramidal cell layer. (A) Gene products enriched or depleted in the Fn1-expressing cluster (i.e. cluster 4); namely, Kcnd3 (encoding the potassium channel subunit Kv4.3), Syt2 (encoding synaptotagmin 2, involved in exocytosis), and Slc17a6 (encoding Vglut2, mediating glutamate uptake into synaptic vesicles). (B) Results for S100, expressed in the S100b-expressing cluster (i.e. cluster 1). Note that the antibody recognizes S100 (i.e. both S100B and S100A) and thus labels astrocytes as well as neurons. (C) Results for the gene product Gpc3/Gpc3, enriched in the Gpc3-expressing cluster (i.e. cluster 5). (D) Results for the gene products Pcp4/Pcp4 and Pamr1/Pamr1, enriched in the Ly6g6e-expressing cluster (i.e. cluster 9). All scale bars: 200 μm.

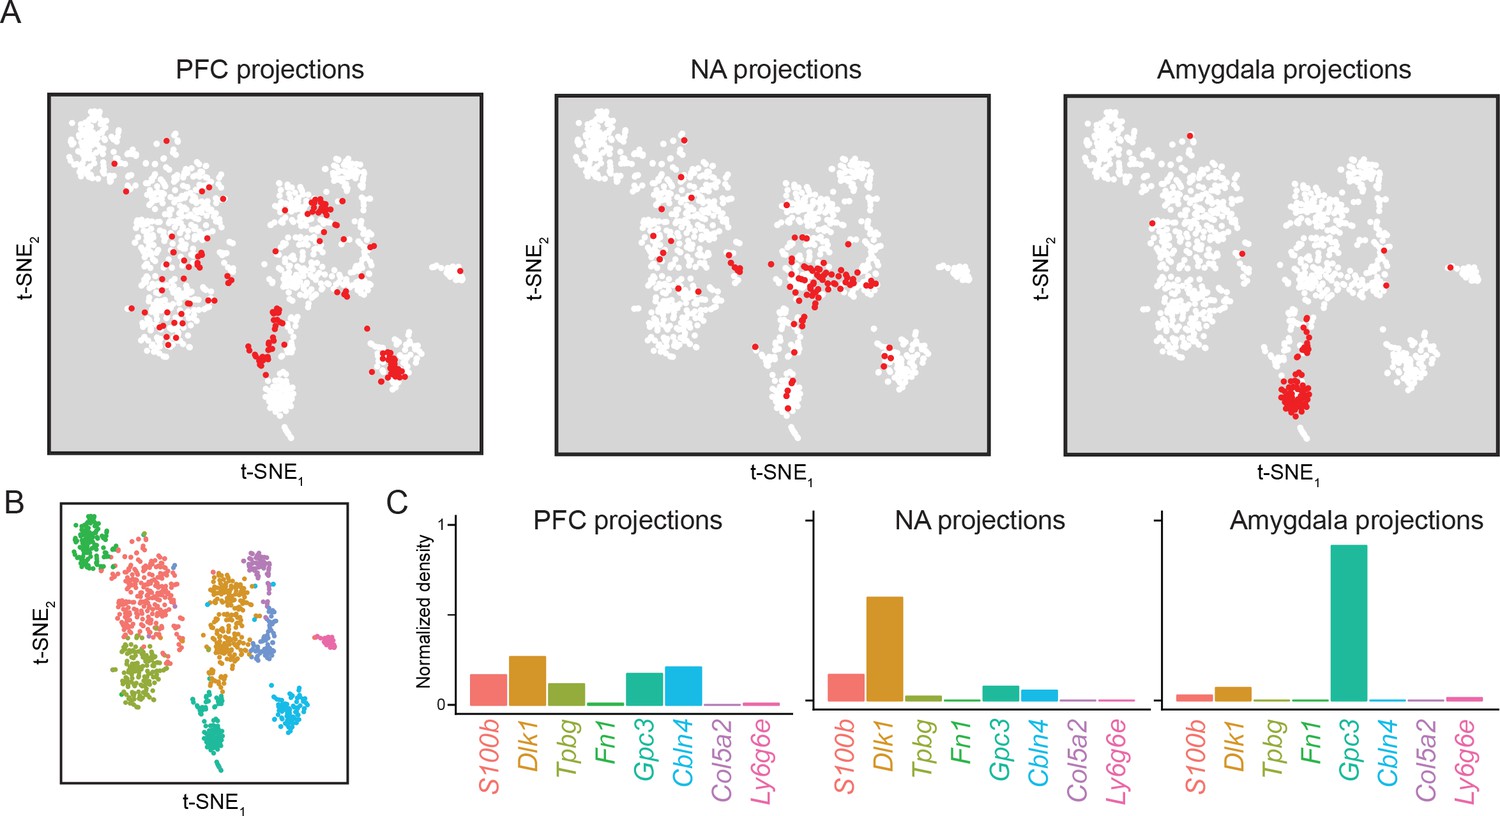
Subiculum transcriptomes based upon downstream projections.
(A) Cells corresponding to three downstream projections (prefrontal cortex, ‘PFC’; nucleus accumbens, ‘NA’; amygdala) are highlighted (red). (B) t-SNE plot of single-cell transcriptomes, illustrating cluster identity (as in Figure 2A). (C) Relative occupancy for each of the transcriptomic clusters, defined as the number of cluster-specific cells divided by the total number of projection cells, is shown for each projection class.
The transcriptomic landscape of the subiculum
To begin, we computationally pooled all of our transcriptomes, analyzing our datasets agnostic to selection method (i.e. unlabeled WT cells vs. labeled projection cells). We performed clustering using a graph-based clustering approach (Satija et al., 2015) (see Materials and methods), and visualized clusters through t-SNE-based nonlinear dimensionality reduction (Figure 2A; see also Figure 2—figure supplement 1A for principal component analysis). From this analysis, nine clusters were identified that expressed marker genes associated with excitatory neurons (e.g. Camk2a, Slc17a7; Figure 2A,B, Figure 2—figure supplement 1; note 14 putative non-neuronal cells and 13 putative interneurons were excluded from analysis, see Materials and methods). These clusters were robust, as using a supervised random forest classifier illustrated that 400 cells (~36% of dataset; 1103 total cells in dataset) were sufficient for ~80% success in predicting cluster identity (Figure 2—figure supplement 1B).
Remarkably, single genes were largely sufficient to delineate individual clusters (Figure 2B). Relatively large subclasses of cells were delineated by the marker genes S100b, Dlk1, Tpbg, and Fn1. Smaller subclasses, putatively corresponding to rarer subclasses of excitatory cells, showed expression of Gpc3, Cbln4, Lefty1, Spink8, and Ly6g6e. In addition to these marker genes, a host of differentially expressed genes that spanned critical neuronal functions were also identified (e.g. axon guidance and cell adhesion, ion channels and associated subunits, ligands and receptors, regulation of transcription, and calcium handling; Figure 2C). On average, a given cluster exhibited enrichment of 50 ± 32 genes relative to the remaining dataset (defined as >3 fold enriched on average and pADJ <0.05; see Materials and methods), and 114 ± 68 genes when restricting analysis to pairwise cluster comparisons (Figure 2—figure supplement 2; Supplementary file 2 and 3). Notably, our analysis did not rely on any of these functional categories a priori, but rather recovered them from an unbiased approach. In total, these results illustrate that gene expression variation within subiculum excitatory cells is extensive, and likely underpins its functional heterogeneity.
Replicate cross-validation
To examine the generalization of these results across biological replicates (i.e. animals), we next examined whether the same clusters were recapitulated across additional mice (n = 5 additional animals in total; see Materials and methods). From these animals, we dissected the subiculum and gathered data from a total of 847 excitatory neurons (5.6 ± 0.8 thousand genes expressed/cell; see Materials and methods). We performed analysis of this dataset identically to our previous dataset, and obtained eight clusters (Figure 2—figure supplement 3A). All eight clusters had marker genes associated with clusters obtained from our original dataset (geometric mean pADJ values for cluster-specific markers = 8.7e-40, cf. pADJ = 4.1e-62 from original dataset; Figure 2—figure supplement 3A,B). The single cluster from original dataset that was missed in the replicate dataset, associated with Cbln4 expression, was detected in a subset of cells that separated in t-SNE space but failed to cluster at our predetermined resolution (Figure 2—figure supplement 3C). Importantly, no new clusters emerged from this replicate dataset, illustrating that our original scRNA-seq dataset accurately predicted subpopulation-specific organization in entirely separate animals (Figure 2—figure supplement 3D).
Spatial deconstruction of the subiculum
The clusters of excitatory neurons likely reflect different subclasses of subiculum pyramidal cells but may also include cell types from neighboring regions (e.g. CA1). To examine the extent to which these clusters corresponded to subiculum subclasses, we next sought to identify spatial patterns associated with each cluster. We identified cluster-specific marker genes for which Allen Mouse Brain Atlas coronal in situ hybridization (ISH) (Lein et al., 2007) images were available, and examined the spatial expression of these marker genes (Figure 3). The marker genes Gpc3, Dlk1, and Tpbg were strongly expressed ventrally in anterior sections, with Dlk1 and Tpbg exhibiting dorsal expression in more posterior sections. Alternatively, Col5a2 and S100b were expressed in disparate populations of dorsal proximal subiculum (i.e., close to CA1), whereas Fn1 was enriched in distal subiculum (i.e. away from CA1) (Cembrowski et al., 2018) (note that in coronal sections, distal subiculum is primarily associated with enrichment in posterior sections; see Figure 3—figure supplement 1). The gene Ly6g6e labeled the deepest layer of cells across the long axis, and Cbln4 corresponding to a layer of cells in the posterior subiculum. Thus, each of these marker genes corresponded to a continuous spatial subregion of the subiculum (Figure 3).
Conversely, expression of Myo5b was enriched in a densely packed group of cells proximal to the CA1/subiculum border (Figure 3, bottom row). Due to the relatively tight cell body packing associated with this label, we postulated that this Myo5b expression might correspond to CA1 pyramidal cells. Consistent with this, expression was seen in more anterior regions of CA1, and CA1 expression of Myo5b was identified in previous RNA-seq datasets (Cembrowski et al., 2016b) (Figure 3—figure supplement 2). Thus, the cluster of cells associated with Myo5b expression likely belonged to CA1 pyramidal cells. Importantly, no other clusters exhibited markers associated with off-target gene expression (e.g. inhibitory neurons, Figure 2B; pre-, para-, or postsubiculum, Figure 3—figure supplement 3).
Previous work has demonstrated that the subPCs can be subdivided into distinct subregions based upon immunohistochemical (IHC) labeling (Ishihara and Fukuda, 2016). Specifically, it was shown that ZnT3, Nos, and Pcp4 (encoded by Slc30a3, Nos1, and Pcp4, respectively) all conformed to specific proximal laminae, whereas Vglut2 (encoding by Slc17a6) corresponded to the distal subiculum. We verified that expression of these genes corresponded to specific subclasses and obeyed the spatial organization expected by IHC (Figure 3—figure supplement 4). Thus, our work recapitulated and extended this previous work by providing whole-genome and quantitative validation into putative subclasses of subPCs, as well as revealing a host of previously unresolved subclasses.
Laminar differences in subiculum identity
Given that we were able to spatially register expression of subPC marker genes across the subiculum, we next investigated these spatial domains in finer detail. We began by studying gene expression associated with subiculum laminae. Inspecting the dorsal subiculum first, we found that Col5a2, Tpbg, and Ly6g6e seemingly corresponded to three distinct laminae, patterning the subiculum in a superficial-to-deep fashion (Figure 4A). Similarly, in the ventral subiculum the combination of Cbln4, Dlk1, Tpbg, and Ly6g6e defined a laminar subiculum organization (Figure 4B).
We sought to directly confirm that this lamina-like organization corresponded to mutually exclusive groups of cells, rather than adhering to continua (Cembrowski and Menon, 2018a). Using two-color ISH, we labeled for the expression of marker genes Tbpg and Gpc3, two genes that were mutually exclusive in scRNA-seq (Figure 3) and seemingly corresponded to abutting lamina in single-color ISH (Figure 4B). Using this strategy, we verified that these laminae corresponded to distinct, abutting but non-overlapping populations of cells (99% of 772 labeled cells exhibited mutual exclusion, n = 2 mice, two sections/mouse; Figure 5A). Similar reciprocal laminar organization could be identified for additional marker genes and associated subclasses (Fn1 vs. Dlk1: 98% of 457 labeled cells exhibited mutual exclusion, Figure 5B; Tpbg vs. Dlk1: 97% of 801 labeled cells exhibited mutual exclusion, Figure 5C; Cbln4 vs. Dlk1: 98% of 489 labeled cells exhibited mutual exclusion, Figure 5D; Tpbg vs. Ly6g6e: 93% of 733 labeled cells exhibited mutual exclusion, Figure 5E; all statistics represent results from n = 2 mice, two sections/mouse). In total, these findings illustrated the discretely separated nature of multiple scRNA-seq clusters, and revealed that the subiculum exhibited abutting laminae that corresponded to transcriptomically distinct subclasses.
Most transcriptomic subclasses span the long axis
As long-axis heterogeneity may underlie the complex functionality of the hippocampus (Strange et al., 2014), we next considered whether transcriptomic cell classes traversed the long axis (Cembrowski et al., 2016a; Cembrowski et al., 2016b; Thompson et al., 2008). For each cluster, we identified the dorsal and ventral extremes of associated marker gene expression. This analysis revealed that most clusters (6/8) exhibited marker gene expression that traversed most or all of the hippocampal long axis (Figure 6, top). The only exceptions to this rule were transcriptomic clusters associated with S100b and Gpc3, which respectively spanned the dorsal and ventral halves of the subiculum (Figure 6, bottom). Thus, in total, the transcriptomically identified subclasses of subPCs produced a complex geometry that exhibited heterogeneity in the dorsal-ventral, superficial-deep, and proximal-distal axes (Figure 7; see also Figure 3—figure supplement 1). However, given that most subclasses traversed the dorsal-ventral axis, the primary axes of variation were superficial-deep and proximal-distal (Witter, 2006).
Higher order correlates of transcriptomic clusters
Having combined scRNA-seq and ISH to deconstruct the transcriptomic landscape of the subiculum, we next sought to understand to what extent transcriptomic subclasses covaried with higher-order properties. First, using immunohistochemistry (IHC), we examined to what extent transcript-level differences corresponded to differential protein products. We found that Kv4.3, a potassium channel pore-forming subunit encoded by Kcnd3, was depleted in distal subiculum (i.e. the Fn1-associated cluster 4) (Figure 8A, left). Conversely, this region was enriched for synaptotagmin-2 (a calcium sensor that mediates vesicular release, encoding by Syt2) and Vglut2 (a glutamate transporter encoded by Slc17a6) (Figure 8A, middle and right) (Ishihara and Fukuda, 2016). Interestingly, we also found that the Slc17a6 expression could be exploited for subclass-specific access of the distal subiculum in transgenic mice (Vong et al., 2011), providing direct evidence that our transcriptomic work can be leveraged to target and manipulate specific cell types (Figure 8—figure supplement 1) (see also Cembrowski et al., 2018; Yamawaki et al., 2018).
Individual marker genes were also sufficient to delineate protein products in other clusters. Interestingly, the calcium peptide S100, typically used as an astrocyte marker, was found in dendrites and cell bodies of the cluster associated with marker gene S100b (Figure 8B; see Figure 8—figure supplement 2 for expansion). Glypican 3, encoded by Gpc3, was located ventrally and corresponded to a specific lamina (Figure 8C). The proteins Purkinje Cell Protein 4 (Ishihara and Fukuda, 2016) and Pamr1, both associated with markers of deep subiculum neurons, exhibited deep lamina-specific enrichment. In total, our scRNA-seq dataset identified multiple spatially restricted proteins, including many important for neuronal functionality (e.g. intrinsic excitability, calcium handling, synaptic transmission).
Finally, we specifically examined our datasets that were obtained based upon projection targets (Figure 1). These datasets included three projection targets: the prefrontal cortex (PFC), nucleus accumbens (NA), and amygdala. Each of these datasets represent projection-specific fluorophore-tagged cells that were selectively obtained by manual selection (see Materials and methods). Cells from these projections were differentially distributed across transcriptomic clusters (Figure 9; see also Figure 9—figure supplement 1 for replicate cross-validation). Broadly, both PFC and NA projections tended to be relatively diffusely spread across clusters, although each projection was notably absent from specific subpopulations (e.g. NA projections were Tpbg-negative; see Figure 9—figure supplement 2). In contrast, amygdala-projecting cells were largely associated with a single dedicated transcriptomic subclass (86% of amygdala-projecting cells were within the Gpc3 cluster, relative to 8% and 17% of NA- and PFC-projecting cells). Some transcriptomic subpopulations were completely devoid of projections for all surveyed downstream regions (e.g. Ly6g6e and Col5a2 clusters; see Figure 9—figure supplement 3 for overview), suggesting that they may correspond to other extrahippocampal projections (Cembrowski et al., 2018) and/or function as local excitatory neurons (Xu et al., 2016).
Discussion
In this study, we examined the organizational rules underlying heterogeneity within the pyramidal cell population of the subiculum. Using scRNA-seq, we identified widespread differential expression of genes within this canonical neuronal type, and mapped this heterogeneity onto specific subclasses of cells. Using in situ hybridization, we identified that these subclasses exhibited mutually exclusive, abutting spatial domains within the subiculum. Furthermore, we found that these transcriptomic classes correlate with protein products and downstream projection targets. Thus, the subiculum can be deconstructed into subfields of principal cells that covary in multiple properties. We have publicly hosted these scRNA-seq data, in conjunction with analysis and visualization tools, to facilitate further study of gene expression and cell types within the subiculum.
The subiculum as a laminar and columnar structure
From previous cellular- and circuit-level studies, different conclusions have been reached as to the ultimate spatial organization of the subiculum. In one study employing immunohistochemistry, it was demonstrated that several proteins exhibit different laminar-like spatial domains within the subiculum that covary with morphological differences (Ishihara and Fukuda, 2016). These findings are suggestive of a laminar organization being present in the subiculum; however, it is challenging to extrapolate governing organizational schemes based on the patterning of a select few markers. In addition, such marker-based approaches do not resolve the overall extent of heterogeneity between putative subclasses, nor guarantee that all potential subclasses are resolved.
Reinforcing the laminar nature of subiculum heterogeneity, complementary circuit-tracing experiments have demonstrated superficial-deep differences in axonal projections (Ishizuka, 2001; Witter, 2006). Interestingly, such work has also revealed heterogeneity the proximal-distal axis, which is recapitulated by differences in electrophysiological properties (Cembrowski et al., 2018; Jarsky et al., 2008; Kim and Spruston, 2012). In combination, this previous work demonstrates that multiple organizational schemes may be present in the subiculum (laminar and columnar differences), but it is unclear to what extent they can be rectified and ultimately interpreted according to distinct subclasses of cells.
The scRNA-seq approach used here, providing an unbiased and complete (i.e. whole genome) method of assessing a feature of the nervous system, illustrates that both laminar and columnar organizational schemes are simultaneously present and reflect intrinsically heterogeneous subclasses of pyramidal cells. In the proximal subiculum (e.g. proximal to Fn1-expressing cells, which define the most distal subclass; see Figure 3—figure supplement 1), transcriptomically discrete subclasses of cells occupy abutting laminae (Figures 5 and 7). In the distal subiculum, gene expression tends to be relatively homogeneous (although note a lamina of Tpbg-expressing cells in posterior subiculum: Figures 3 and 7). Thus, the subiculum can be deconstructed into proximal and distal subdomains, with further laminar organization predominantly found in proximal subiculum (as previously proposed by Ishihara and Fukuda, 2016).
To what extent does our work unambiguously resolve the subclass-specific landscape of the subiculum? Here, we directly demonstrated the discrete pairwise separation of five clusters (Figure 5), and the overall nonoverlapping nature of these clusters can be inferred from their relative spatial ordering. Taking these results in combination with previous in situ hybridization (Cembrowski et al., 2018), this demonstrates the existence of at least six discretely separable subclasses of subiculum pyramidal cells. Although not examined directly, it is possible that some remaining scRNA-seq clusters may comprise opposite extremes of a continua. On the other hand, there may be additional subiculum subclasses that may be revealed with greater cell number or sequencing depth. As a result, the eight scRNA-seq subclasses resolved here likely represent an approximation (and potentially, a lower bound) as to the ultimate number of true biological subclasses of subiculum pyramidal cells.
Transcriptomic heterogeneity as a predictor of functional heterogeneity
Understanding how heterogeneity within the hippocampus underpins function has conventionally been studied by comparing across classical hippocampal cell types (e.g. Kaifosh and Losonczy, 2016; Neunuebel and Knierim, 2014). Complementing this body of across-cell-type work, recent transcriptomic research has illustrated that heterogeneity within each classical hippocampal cell type is also prominent. This heterogeneity encompasses both discrete and continuous variation across dorsal-ventral, proximal-distal, and superficial-deep axes (Cembrowski et al., 2016a; Cembrowski et al., 2018; Cembrowski et al., 2016b; Habib et al., 2016; Thompson et al., 2008). As higher order cellular, circuit, and functional features also vary in related ways (Cembrowski and Spruston, 2018b, in review; Danielson et al., 2016; Knierim et al., 2006; Lee et al., 2015; Lee et al., 2014; Soltesz and Losonczy, 2018; Strange et al., 2014), this suggests that transcriptomic identity can be coherently aligned with specialized functionality (Cembrowski et al., 2018; Yamawaki et al., 2018).
It follows that the transcriptomically defined subclasses identified in this study likely vary according to higher-order structure and function. This postulate is further underscored by several complementary lines of evidence. For example, there is widespread differential expression of genes associated with neuronally relevant ontologies (Figure 2C). Additionally, in the case of broadly defined proximal-distal cell classes in the dorsal subiculum, dissociable higher order structural and functional correlates have been previously identified (Cembrowski et al., 2018). Finally, for several of the transcriptomic classes identified in this study, transcriptomic identity covaries with protein products (Figure 8) and projection target (Figure 9). In combination, these lines of evidence indicate that the transcriptomic classes identified here correspond to functionally differentiable and relevant subclasses of subPCs.
How can such function be identified? In this study, we identified that subPCs can be deconstructed into a collection of discretely separated subclasses based upon disparate gene expression. This approach exploited gene expression heterogeneity as a means of cellular classification and spatial registration. As a consequence, this analysis was performed agnostic to the functional correlates of these genes; however, this work will help to provide a necessary foundation for assessing functional relevance in multiple ways. First, many of the differentially expressed genes in this study are associated with known functional roles in neuronal populations (Figure 2C). Consequently, these findings enable specific hypotheses to be generated and tested across subclasses. Second, as these subclasses can covary with projection target (Figure 9), these predictions can be investigated and understood at the level of neuronal circuits. Third, our analysis provides individual genes as markers (Figures 2 and 3) that will enable these questions to be addressed at a subclass-specific resolution (e.g. via transgenic mice; Figure 8—figure supplement 1). In total, this work will facilitate the coherent interrogation of molecular, cellular, and circuit properties of the specific subclasses of the subiculum.
Single-cell Hipposeq, a public resource for hippocampal scRNA-seq
Due to the data-rich nature of our subiculum scRNA-seq dataset, there are many additional features that can be mined and analyzed in further studies. To facilitate the extended use of these data, we have publicly hosted our scRNA-seq data in conjunction with corresponding analysis and visualization tools. This augments earlier population-level RNA-seq data hosted by our laboratory (‘Hipposeq’: Cembrowski et al., 2016b), providing an accessible and intuitive single-cell extension for dissecting the structural and functional heterogeneity of the subiculum. Thus, our work here provides both an immediate and long-term framework with which subiculum subclasses can be interpreted, targeted, and manipulated in future studies.
Materials and methods
Reagent type (species) or resource | Designation | Source or reference | Identifiers | Additional information |
---|---|---|---|---|
Strain, strain background (M. musculus) | Vglut2-IRES-Cre | Jackson | RRID: IMSR_JAX:016963 | |
Antibody | Kv4.3 rabbit polyclonal | Alomone | APC-017; RRID: AB_2040178 | 1:200 |
Antibody | Syt2 mouse monoclonal | DSHB | RRID: AB_531910 | 1:250 |
Antibody | Vglut2 mouse monoclonal | Abcam | ab79157, RRID: AB_1603114 | 1:1000 |
Antibody | S100 rabbit polyclonal | Abcam | ab868, RRID: AB_1603114 | 1:250 |
Antibody | Gpc3 mouse monoclonal | Millipore | MABC667 | 1:250 |
Antibody | Pcp4 rabbit polyclonal | Sigma | HPA005792, RRID: AB_1855086 | 1:250 |
Antibody | Pamr1 rabbit polyclonal | Proteintech | 55310–1-AP, RRID: AB_11232 | 1:250 |
Sequence-based reagent | Tpbg ISH probe | Advanced Cell Diagnostics | 521061-C3 | |
Sequence-based reagent | Dlk1 ISH probe | Advanced Cell Diagnostics | 405971-C2 | |
Sequence-based reagent | Gpc3 ISH probe | Advanced Cell Diagnostics | 418541 | |
Sequence-based reagent | Fn1 ISH probe | Advanced Cell Diagnostics | 310311 | |
Sequence-based reagent | Cbln4 ISH probe | Advanced Cell Diagnostics | 428471 | |
Sequence-based reagent | Ly6g6e ISH probe | Advanced Cell Diagnostics | 506391-C2 | |
Software, algorithm | R | https://www.r-project.org | SCR_001905 | |
Software, algorithm | Seurat | https://satijalab.org/seurat/ | SCR_007322 | |
Software, algorithm | Fiji | https://imagej.net/Fiji | RRID:SCR_002285 | |
Software, algorithm | Custom scripts | This study | DOI:10.6084/m9.figshare.7140350 | Scripts used to analyze scRNA-seq data |
Other | Retrobeads | Lumafluor | ‘Overview of subiculum scRNA-seq atlas: construction, validation, and extension’ | |
Other | AAV-SL1-CAG-tdT | Janelia Viral Core | ‘Higher-order correlates of transcriptomic clusters’ |
Experimental procedures were approved by the Institutional Animal Care and Use Committee at the Janelia Research Campus (protocols 14–118 and 17–159). Mice were housed on a 12 hr light/dark cycle with ad libitum food and water access.
scRNA-seq data generation and analysis
Request a detailed protocolAn initial single-cell RNA-seq dataset (5.6 ± 1.0 thousand expressed genes/cell, mean ± SD) was generated according to a previously published protocol (Cembrowski et al., 2018). In brief, for animals used in geography-based datasets (dorsal, intermediate, and ventral), mature (>8 weeks) male C57BL/6 mice were used. In these animals, coronal sections were made, and microdissection of the corresponding geographical regions was performed (n = 1 biological replicate, that is animal, for each region). Microdissected regions were dissociated, and manual purification (Hempel et al., 2007) was used to obtain cells. For animals used in projection-based datasets (PFC, NA, and amygdala; n = 1 biological replicate, that is animal, for each region), red or green retrograde beads (Lumafluor, Naples, FL) were injected bilaterally at 200 nL/depth as follows: PFC: A/P, M/L, D/V 2.0, 0.25, (-2.5,–2.25); NA: 2.0, 1.0, (-5.0,–3.8); amygdala: −0.5, 2.8, (-5.0,–4.0). One injection site along the anterior-posterior axis was selected for each site to avoid potential off-target effects associated with injecting large volumes of the brain. Fluorescent cells in the intermediate and ventral subiculum were targeted for manual purification according to previous methods (Cembrowski et al., 2016a), with 175, 139, and 71 cells obtained for the NA, PFC, and amygdala, respectively. To validate this initial scRNA-seq dataset, a second scRNA-seq was constructed and analyzed independently (n = 884 cells, with 5.6 ± 0.8 thousand genes expressed/cell). This dataset contained unlabeled cells selected at random across the full extent of the subiculum (n = 2 biological replicates; i.e., mice), as well as projection-specific datasets (n = 2, 1, and one biological replicates from the NA, PFC, and amygdala, respectively, with n = 116, 64, and 44 labeled projection cells obtained for each respective projection).
For all datasets, library preparation, sequencing, and initial count-based quantification (Dobin et al., 2013; Trapnell et al., 2009) was performed according to previous methods (Cembrowski et al., 2018); note that the dorsal subiculum dataset was previously published and publicly available as part of this earlier work. For some datasets, barcodes that could not be demultiplexed were mapped to known barcodes using maximally parsimonious substitutions. No blinding or randomization was used for the construction or analysis of this dataset. No a priori sample size was determined for the number of animals or cells to use; note that previous methods have indicated that several hundred cells from a single animal is sufficient to resolve heterogeneity within the subiculum (Cembrowski et al., 2018).
Computational analysis was performed in R (RRID:SCR_001905) (R Development Core Team, 2008) using a combination of Seurat (RRID:SCR_007322) (Satija et al., 2015) and custom scripts (Cembrowski et al., 2018). Cells with <10,000 total counts were excluded from analysis (n = 60 of 1190 initial cells). For all remaining cells, counts were converted to Counts Per Million (CPM) for subsequent analysis. Putative non-neuronal cells (n = 14) were eliminated from the dataset by rejecting cells that exhibited CPM < 250 for Snap25, a pan-neuronal marker. Putative interneurons (n = 13) were eliminated from the dataset by rejecting cells that exhibited CPM > 100 for Gad1, an interneuron marker. Variable genes (n = 5376) used for PCA were obtained with Seurat via FindVariableGenes(mean.function = ExpMean, dispersion.function = LogVMR, x.low.cutoff = 0.0125, x.high.cutoff = 3, y.cutoff = 0.5). Clusters were obtained with Seurat via FindClusters(reduction.type = ‘pca’, dims.use = 1:10, resolution = 0.6). In general, these parameters produced clusters that were robust (e.g. Figure 2—figure supplement 1b) and cross-validated by other methodologies (e.g. Figures 3, 4, 5, 7, 8 and 9) (Cembrowski and Spruston, 2017). This requirement of multimodal consistency produces a conservative but well-validated approach to identify subclasses. Hierarchical clustering of clusters was obtained with Seurat via BuildClusterTree(). Subclass-specific enriched genes (Figure 2—figure supplement 2) were obtained with Seurat via FindMarkers(), retaining genes that were at least 3-fold enriched in the target population (the ‘enriched cluster’, relative to the ‘depleted cluster’) and obeyed pADJ < 0.05, where is the pADJ is adjusted p value from Seurat based on Bonferroni correction. Functionally relevant differentially expressed genes (Figure 2C) were obtained using FindMarkers(), allowing for both cluster-specific enriched and depleted genes obeying pADJ < 0.05. t-SNE visualization (van der Maaten and Hinton, 2008) used perplexity = 30, with 1000 iterations (sufficient for convergence) on the default seed. Qualitatively similar results were obtained for other seed values.
When plotting gene expression using t-SNE, color ranges from white (zero expression) to red (maximal expression), plotted logarithmically. For random forest classification (ClassifyCells() in Seurat), random subsets of graph-based clustered cells were taken (n = 50, 100, 200, 400, or 800 cells; n = 100 random subsets for each number of cells), and used to predict the cluster identities of the remaining cells in the dataset.
Raw and processed scRNA-seq datasets have been deposited in the National Center for Biotechnology Information (NCBI) Gene Expression Omnibus under GEO: GSE113069. All analysis scripts are publicly available (DOI:10.6084/m9.figshare.7140350) (Cembrowski and Spruston, 2018c).
In situ hybridization
Request a detailed protocolAll chromagenic ISH images were obtained from the publicly available Allen Mouse Brain Atlas (AMBA) (Lein et al., 2007) (Supplementary file 3). To cross-validate marker genes associated with scRNA-seq clusters, we identified AMBA coronal image sets for genes that exhibited minimal off-target expression in scRNA-seq datasets. To cross-validate expression of Myo5b in CA1 cells in RNA-seq, previous population-level RNA-seq was used (Cembrowski et al., 2016b).
All multicolor fluorescent ISH processing was performed according to previous protocols (Cembrowski et al., 2016a). All probes were purchased from Advanced Cell Diagnostics (Hayward, CA) and were as follows: Tpbg (521061-C3), Dlk1 (405971-C2), Gpc3 (418541), Fn1 (310311), Cbln4 (428471), Ly6g6e (506391-C2). For combining ISH with circuit mapping, AAV-SL1-CAG-tdTomato (rAAV2-retro: Tervo et al., 2016) was injected into the NA, with the same coordinates used in retrobead injections (200 nL/site; note that retrobeads were not used due to bead labeling being lost during ISH processing). For quantifying colocalization of two-color ISH, cell bodies were counted across at least two optical sections from two animals, with the degree of overlap quantified as the number of colabeled cells divided by the total number of labeled cells in either channel.
Immunohistochemical and transgenic mouse validation
Request a detailed protocolMale mice (>=2 mice/antibody) were deeply anesthetized with isoflurane and perfused with 0.1M phosphate buffer (PB) followed by 4% paraformaldehyde (PFA) in PB. Brains were dissected and post-fixed in 4% PFA overnight. For most experiments, brain sections (50 – 100 μm) were made using a vibrating tissue slicer (Leica VT 1200S, Leica Microsystems, Wetzlar, Germany; where noted, some experiments used cryostat-sectioned tissue (Leica 3050S, Leica Microsystems, Wetzlar, Germany). Antibodies used in this study were as follows: on rabbit antibody to Kv4.3 (1:200, APC-017, Alomone; RRID: AB_2040178), mouse antibody to Syt2 (1:250, znp-1, DSHB; RRID: AB_531910; performed on cryosectioned tissue), mouse antibody to Vglut2 (1:1000, ab79157, Abcam; RRID: AB_1603114), rabbit antibody to S100 (1:250, ab868, Abcam; RRID: AB_1603114), mouse antibody to Gpc3 (1:250, MABC667, Millipore), rabbit antibody to Pcp4 (1:250, HPA005792, Sigma; RRID: AB_1855086), rabbit antibody to Pamr1 (1:250, 55310–1-AP, Proteintech; RRID: AB_11232034).
Immunohistochemistry was performed on free-floating sections. All tissues were washed five times (5 min each) in PBS and then incubated in blocking buffer (5% NGS in 0.3% Triton-PBS; Kv4.3 and Vglut2 IHC additionally used 2% BSA) for 1 hr at room temperature. Tissue was subsequently incubated in primary antibody at 4°C for one to two nights, washed five times (5 min each) in 0.3% Triton-PBS, and detected by Alexa Fluor secondary antibodies (Thermo Scientific Inc., Waltham, MA) by incubating at room temperature for 1 – 2 hr. Sections were subsequently washed in PBS five times (5 min each), mounted, and coverslipped with mounting media containing DAPI (H-1200, Vector Laboratories, Burlingame, CA).
For investigating cell-type-specific access predicted by scRNA-seq, Slc17a6-IRES-cre (i.e. Vglut2-IRES-cre; RRID: IMSR_JAX:016963) (Vong et al., 2011) male mice (n = 4) were injected with AAV2/1-CAG-FLEX-EGFP (Janelia Virus Services) in the subiculum (A/P −3.6, M/L 2.5; D/V −2.5 and −1.5 with 80 nL/depth). Mice were sacrificed at least 3 weeks later for histological examination of viral expression.
Fluorescence imaging
Request a detailed protocolAll histological images were acquired with a 20x objective using confocal microscopy (LSM 880, Carl Zeiss Microscopy, Jena, Germany). Single optical sections are shown, with the relevant regions tiled in XY dimensions as needed. In some cases, channels were postprocessed in Fiji (RRID:SCR_002285) (Schindelin et al., 2012), with brightness adjustments applied to the entire image and/or pseudocoloring.
Data availability
Raw and processed scRNA-seq datasets have been deposited in the National Center for Biotechnology Information (NCBI) Gene Expression Omnibus under GEO: GSE113069.
-
NCBI Gene Expression OmnibusID GSE113069. The subiculum is a patchwork of discrete subregions.
-
NCBI Gene Expression OmnibusID GSE100449. Dissociable structural and functional hippocampal outputs via distinct subiculum cell classes.
References
-
BookThe subiculum: the heart of the extended hippocampal systemIn: O'Mara S, Tsanov M, editors. The Connected Hippocampus. Elsevier. pp. 65–82.https://doi.org/10.1016/bs.pbr.2015.03.003
-
Routes to, from and within the subiculumCell and Tissue Research 373:557–563.https://doi.org/10.1007/s00441-018-2848-4
-
Hippocampal–diencephalic–cingulate networks for memory and emotion: An anatomical guideBrain and Neuroscience Advances 1:239821281772344.https://doi.org/10.1177/2398212817723443
-
Continuous variation within cell types of the nervous systemTrends in Neurosciences 41:337–348.https://doi.org/10.1016/j.tins.2018.02.010
-
Within-cell-type variability is the norm: lessons from pyramidal cell types in the HippocampusNature Reviews.
-
STAR: ultrafast universal RNA-seq alignerBioinformatics 29:15–21.https://doi.org/10.1093/bioinformatics/bts635
-
Laminar organization of the pyramidal cell layer of the subiculum in the ratThe Journal of Comparative Neurology 435:89–110.https://doi.org/10.1002/cne.1195
-
Distribution of bursting neurons in the CA1 region and the subiculum of the rat hippocampusThe Journal of Comparative Neurology 506:535–547.https://doi.org/10.1002/cne.21564
-
Functional correlates of the lateral and medial entorhinal cortex: objects, path integration and local-global reference framesPhilosophical Transactions of the Royal Society B: Biological Sciences 369:20130369.https://doi.org/10.1098/rstb.2013.0369
-
Roles for the subiculum in spatial information processing, memory, motivation and the temporal control of behaviourProgress in Neuro-Psychopharmacology and Biological Psychiatry 33:782–790.https://doi.org/10.1016/j.pnpbp.2009.03.040
-
BookThe Mouse Brain in Stereotaxic Coordinates, Compact (Second edition)Amsterdam; Boston: Elsevier Academic Press.
-
SoftwareR: A language and environment for statistical computingR Foundation for Statistical Computing.
-
Spatial reconstruction of single-cell gene expression dataNature Biotechnology 33:495–502.https://doi.org/10.1038/nbt.3192
-
Fiji: an open-source platform for biological-image analysisNature Methods 9:676–682.https://doi.org/10.1038/nmeth.2019
-
Loss of recent memory after bilateral hippocampal lesionsJournal of Neurology, Neurosurgery & Psychiatry 20:11–21.https://doi.org/10.1136/jnnp.20.1.11
-
Functional organization of the hippocampal longitudinal axisNature Reviews Neuroscience 15:655–669.https://doi.org/10.1038/nrn3785
-
TopHat: discovering splice junctions with RNA-SeqBioinformatics 25:1105–1111.https://doi.org/10.1093/bioinformatics/btp120
-
Visualizing High-Dimensional data using t-SNEJournal of Machine Learning Research 9:2579–2605.
-
Connections of the subiculum of the rat: topography in relation to columnar and laminar organizationBehavioural Brain Research 174:251–264.https://doi.org/10.1016/j.bbr.2006.06.022
-
Noncanonical connections between the subiculum and hippocampal CA1Journal of Comparative Neurology 524:3666–3673.https://doi.org/10.1002/cne.24024
-
Neuronal cell-type classification: challenges, opportunities and the path forwardNature Reviews Neuroscience 18:530–546.https://doi.org/10.1038/nrn.2017.85
Decision letter
-
Laura ColginReviewing Editor; The University of Texas at Austin, Center for Learning and Memory, United States
-
Gary L WestbrookSenior Editor; Vollum Institute, United States
In the interests of transparency, eLife includes the editorial decision letter and accompanying author responses. A lightly edited version of the letter sent to the authors after peer review is shown, indicating the most substantive concerns; minor comments are not usually included.
Thank you for sending your article entitled "The subiculum is a patchwork of discrete subregions" for peer review at eLife. Your article has been evaluated by three peer reviewers, one of whom is a member of our Board of Reviewing Editors, and the evaluation has been overseen Gary Westbrook as the Senior Editor.
This paper was submitted as a Tools and Resources contribution and thus should not just serve to provide evidence of cell type heterogeneity in the subiculum. The contribution attempts to go further in providing markers that can be used to manipulate specific cell types in the subiculum, thereby potentially providing a valuable resource that would allow experiments that are not currently possible. However, without sufficient validation of the different classes of subiculum cells, other researchers may hesitate to use such a resource. As is apparent in the reviews, all reviewers had concerns about the lack of a sufficient number of biological replicates. We recommend that results should be replicated across multiple animals (i.e., at least 2 animals, preferably 3). Please also address reviewer 2 and 3's concerns about validation of the clusters (e.g., more detailed in situ hybridization for multiple target mRNAs in the same section and/or immunostaining). The reviews are provided in their entirety below.
Reviewer #1:
This is an interesting study that reports molecularly and anatomically distinct subgroups of cells in the subiculum, some of which are shown to project to different targets. These findings are important because they will allow for novel experiments in the future that test the functional consequences of manipulations of different of different types of hippocampal output (e.g., test the effects of subiculum projections to amygdala using Gpc3 as a cell-specific marker). However, there are some points that remain to be clarified.
1) The term "biological replicate" seems misleading because the authors seem to report that cells from only one animal were analyzed for each region. Is this standard to only use one animal for each region? It seems as though this resource would be most significant to other researchers if the reproducibility of these clusters across animals was demonstrated.
2) In the Discussion, the authors state that they were "agnostic to the functional correlates" of the genes that serve to differentiate cell clusters. However, this should perhaps be explained earlier in the text, specifically in the section of the Results that describes Figure 2. Otherwise, readers may naturally wonder whether these gene expression patterns provide insights about functions of different cell groups.
Reviewer #2:
Cembrowski and colleagues have used single cell RNA-seq to profile pyramidal neurons in the subiculum. They discover that there are 8 or 9 discrete cell types that span and tile the dorsal/ventral, proximal/distal, and superficial/deep axis of the subiculum. This is the most comprehensive analysis of the subiculum to date and of high quality and value. The authors have shared the data through addition to http://hipposeq.janelia.org – a searchable database that already includes data from many cell types in the hippocampus and is of significant value to the community. Finally, the authors use retro beads injected into the PFC, NA, and amygdala to identify subiculum pyramidal neuron that project to these regions and performed some preliminary analysis of these subtypes. This study uses methods and analyses previously developed/used by the Spruston lab to perform a comparable analysis of CA1/CA2/CA3/and DG.
1) The text should be clarified as to whether there are 8 or 9 clusters of cell types.
2) Can any of the clusters be validated with immunostaining or transgenic mouse lines?
3) In the final Results section describing projection specific-correlates of transcriptomic clusters, it is difficult to evaluate the strength of the data. How many neurons were labeled/profiled in each projection class? How complete was the coverage of the target area? The Materials and methods section indicates retro beads and AAV-SL1-CAG-tdTomato were used to label projections but in the Results section, it seems like just beads were used. This should be clarified. A visual for how the projection neurons map onto the spatial domains described in Figure 6 and layers in Figure 4, would be useful.
Reviewer #3:
In this study, Cembrowski et al. performed deep sequencing of RNA from manually isolated neurons from the subiculum. They identified clusters of neurons most of which were extended throughout the dorso-ventral span of the subiculum with variation in the antero-posterior (or proximo-distal) axis. The results confirm and extend previous observations of differences between the proximal and distal subiculum. The authors go on to show that projections of subicular neurons to the nucleus accumbens and amygdala might map onto their transcriptional identity.
The potential general interest of the study is that single-cell RNAseq is relatively new and has yet to be applied to the subiculum, which is an interesting brain area because of its roles in memory. The technique is powerful in that it can identify neurons based on transcriptional signatures and when combined with projection and positional identities it can provide a convincing picture of cell diversity in a brain area. The limitations of the present study are that the claimed conceptual advances are over-stated and that the utility of the resource is compromised by a lack of replicates and limited validation.
1) While the marker genes identified will be useful, layer topography and distinctions in the proximo-distal axis of the subiculum were already largely known. For example, Ishihara and Fukuda (Neuroscience, 2016) have provided strong evidence for a layered molecular organization of the subiculum (nicely summarised in Figure 15 of their paper) and already provide good evidence for the main conclusion expressed in the title of the present study. While their study is very briefly mentioned, its convincing, important and original contributions are not sufficiently acknowledged. They should be outlined in the Introduction and the present data should be compared more directly with their results in the Discussion. It is particularly important to clarify whether the protein markers they identify (e.g. NOS, PCP4, ZnT3) are useful markers at the mRNA level based on the present data. It may also be interesting to address whether the subiculum is analogous to the deep layers of the isocortex or neocortex.
2) The major potential contribution of the present study will likely be for groups wanting to investigate how gene expression patterns in each of the identified subclasses relate to neuronal function or signaling cascades. For this, we find a biological replicate of 1 is not sufficient. There is a real concern here that the results are not definitive, and the study may mislead rather than benefit future work. Since the authors invested effort in making the dataset public, biological replicates would enhance the reliability of their study once it goes in the public domain.
3) There seems to be an overlap in expression of the marker genes expressed by neurons projecting to each target area (Figure 7). For example, neurons projecting to the PFC express nearly all genes enhanced in all clusters, which weakens the conclusion that distinct transcriptional identities map onto projection choice. Similarly, NA and amygdala projection neurons express both Dlk1 and Gpc3, albeit at different proportions. Perhaps with more animals sampled, the level of expression of marker genes will appear more even or more different? We suggest to either increase the number of animals in the sequencing assay, or to perform immunostaining / in situs to find out whether neurons projecting to each area are positive for subclass markers.
4) Selected genes in 5 out of the 8 clusters identified are lamina-specific, but some genes even though they belong to separate clusters seem to be expressed in an overlapping manner. For example, Cbln4 looks like it is in the same lamina as Dlk1 from single in-situs (Figure 4B). If the authors want to show this gene really marks a distinct class, they need to perform fluorescent ISH for this gene and Dlk1. For the same reason, Col5a and Dlk1, which are depicted as non-overlapping in Figure 6, need validation with double ISH. Also, Tpbg is depicted as restricted to the ventral half of the subiculum, even though it appears to be expressed more dorsally (Figure 3). A diagram indicating which genes are expressed in which lamina may also be helpful – this is hard to see in Figure 6.
5) In the Abstract, the claim "the subiculum pyramidal cell population can be deconstructed into eight discretely separable subclasses" is difficult to justify based on the data. There is no test of discreteness in the analysis and the t-SNE plots suggest that the suggested subclasses overlap / are contiguous.
6) Choices made in setting up the analysis pipeline, and the consequences of different choices, are not sufficiently explained. For example, to what extent does changing the cutoff thresholds in FindVariableGenes affect the subsequent clustering? To what extent is clustering affected by the resolution parameter? In generating the t-SNE plots what were the perplexity values and how many steps were used? Several sub-classes do not appear particularly well separated in the t-SNE plots. It may be that optimising perplexity or steps gives a better indication of separation, or it may be that they are not separable even with t-SNE.
7) Figure 4C-E and Figure 7—figure supplement 1 require quantification of the numbers of cells and numbers of biological replicates.
8) Figure 2—figure supplement 1B suggests that approximately 20-25% of cells are not classifiable. Does this population overlap across simulation runs? If so, what happens to the cell classification if these cells are excluded? For example, are the groupings cleaner?
9) For reproducibility, the main analysis code should be made available alongside the study. When doing so it would be helpful to make explicit the random number seeds used by Seurat and the version of Seurat used. When we used Seurat to analyze the dataset we obtained different, although qualitatively similar, plots to those in the manuscript. We guess this is because of differences in seeding but cannot know for sure. The methods should also make clear whether key analyses were repeated with different seeds and whether similar results were obtained.
[Editors' note: further revisions were requested prior to acceptance, as described below.]
Thank you for resubmitting your work entitled "The subiculum is a patchwork of discrete subregions" for further consideration at eLife. Your revised article has been favorably evaluated by Gary Westbrook as Senior Editor, a Reviewing Editor, and one reviewer.
Summary:
The manuscript has been improved but there are some remaining issues that need to be addressed before acceptance, as outlined below. Please note that the remaining comments only require text revisions, not additional analyses or experiments. Specifically, we would like a clearer explanation of relevance to prior work and a softening of the conclusion that there are definitely eight separate subregions.
Essential revisions:
1) The revisions do more to acknowledge previous work by Ishihara and Fukuda. However, this previous work is still not credited sufficiently. This doesn't affect the validity of the conclusions, nor the strong case for publishing the study, but a more scholarly approach to recognizing previous work would reflect well on the authors and the journal. We have some suggestions.
Introduction, third paragraph, acknowledges Ishihara and Fukuda, but their contribution is not made sufficiently clear here. Perhaps state, "Recent investigations using immunohistochemical labeling argue that the proximal subiculum is composed of a molecular layer and multiple cell body layers, each distinguished by molecular and morphological differences, while the distal subiculum is more uniform (Ishihara and Fukuda, 2016)."
Discussion, subsection “The subiculum as a laminar and columnar structure”, last paragraph. It's important to be clear here that prior evidence for and articulation of the idea that "the subiculum can be deconstructed into proximal and distal subdomains, with further laminar organization predominantly found in proximal subiculum" was provided in the previous study by Ishihara and Fukuda. We agree that the present results further refine their model, but as written the text could easily be interpreted as taking credit for ideas previously proposed by Ishihara and Fukuda. Also, the implication in the first paragraph of the aforementioned subsection, that Ishihara and Fukuda's scheme was based only on protein labeling is incorrect, as they also took account of neuronal morphology, something the present study doesn't do.
2) We're not convinced by the conclusion that the analysis supports the existence of eight discrete cell classes. It seems pretty clear that some of the cell classes are distinct (e.g. groups labeled by Cbln4 vs. Dlk1), but while others can be grouped, the possibility that rather than being discrete classes they reflect a split along a continuum, or overlapping classes, is not convincingly addressed (e.g. S100b vs. Tpbg).
First, it's not clear how the algorithm used for clustering provides evidence for groups being generated by discrete as opposed to continuous distributions. As the authors recognize this is a difficult problem. Clustering algorithms will group some continuous distributions into clusters, but this is not evidence that the distributions were in fact discrete. Rather than under-sampling, which doesn't address the problem convincingly, a more rigorous statistical approach is required to support the conclusion that there are eight discrete groups. Previous comments about the interpretation of the tSNE plots must not have been sufficiently clear. They of course don't test for discreteness. Rather, a typical concern is that tSNE can give an exaggerated sense of distances between data points, whereas here even when visualizing the data using tSNE plots the groups appear contiguous.
Second, the new data in Figure 5 are nice, but their interpretation requires clarification. Each comparison is between groups that appear well separated by the clustering algorithm (cf. Figure 2A) and the conclusion that the groups labeled in Figure 5 are distinct seems very reasonable. However, the clusters in Figure 2A that appear contiguous (e.g. S100b and Tpbg, Dlk1 and Lefty1, Dlk1 and Gpc3, etc.) are not validated in Figure 5. Thus, Figure 5 doesn't support the idea that all eight proposed cell groups are discretely separable, as there is no evidence here that the adjacent groups of cells from Figure 2A are separable.
Third, the argument that ~80% successful classification with a random forest validates the groupings is not by itself convincing. For genuinely discrete classes wouldn't you expect the RF to do a little better? Are the misclassified cells randomly distributed, or are errors more systematic? For example, are all groups misclassified at the same rate, or is the error rate higher for particular groups? Are some types of error over-represented, e.g. does S100b misclassify as Tpbg, and vice -versa, at higher rates than other pairings? What error rates would you expect given alternative hypotheses that some groups, e.g. S100b and Tpbg, represent a split along a continuum, rather than discrete classes?
These problems could easily be addressed by avoiding use of "discrete" as a conclusion, e.g. in the title, in the Abstract, and multiple other parts of the manuscript, by discussing the potential ambiguities, and by being open to the possibility that some, although clearly not all, of the groupings may not be discrete. Along the same lines, the idea that there are eight groups would be better phrased as a suggestion rather than a definitive conclusion.
https://doi.org/10.7554/eLife.37701.036Author response
Reviewer #1:
This is an interesting study that reports molecularly and anatomically distinct subgroups of cells in the subiculum, some of which are shown to project to different targets. These findings are important because they will allow for novel experiments in the future that test the functional consequences of manipulations of different of different types of hippocampal output (e.g., test the effects of subiculum projections to amygdala using Gpc3 as a cell-specific marker). However, there are some points that remain to be clarified.
1) The term "biological replicate" seems misleading because the authors seem to report that cells from only one animal were analyzed for each region. Is this standard to only use one animal for each region? It seems as though this resource would be most significant to other researchers if the reproducibility of these clusters across animals was demonstrated.
The reviewer makes an excellent comment. As a point of background, in previous work (e.g., Cembrowski et al., 2016; Cembrowski et al., 2016), we have found that animal-to-animal variability is minimal (correlation coefficient typically ~0.99 across biological replicates). This, in conjunction with the robust in situ hybridization cross-validation in our original manuscript (which uses different animals and methodologies), suggesting that our work resolved general organizational principles, rather than being animal-specific.
Nevertheless, as the reviewer notes, a demonstration the reproducibility of these clusters across animals would provide direct evidence for this general organization. To this end, we have performed sequencing of additional mice; i.e., additional biological replicates. These results include two new biological replicates for each hippocampal region, as well as additional replicates for projections; in total, our revised manuscript now includes single-cell RNA-seq data from 11 animals.
We approached this new dataset as an independent test of our original submission: employing the same experimental and computational approaches as in our original manuscript, we independently generated and analyzed this new dataset, and compared the results to our original dataset. Critically, the clusters identified in our initial submission give a near-perfect registration to the clusters in our newly acquired dataset (see new “Replicate cross-validation” subsection and Figure 2—figure supplement 3). This consistency across biological replicates, in conjunction with the histological validation presented in our original manuscript and augmented in our revision, provides strong evidence that we have uncovered robust subclasses of subiculum neurons.
2) In the Discussion, the authors state that they were "agnostic to the functional correlates" of the genes that serve to differentiate cell clusters. However, this should perhaps be explained earlier in the text, specifically in the section of the Results that describes Figure 2. Otherwise, readers may naturally wonder whether these gene expression patterns provide insights about functions of different cell groups.
Done. We now discuss functional correlates in the Results section associated with Figure 2.
Reviewer #2:
[…] 1) The text should be clarified as to whether there are 8 or 9 clusters of cell types.
We thank the reviewer for emphasizing this clarification. Our scRNA-seq dataset identifies 9 clusters, one of which we ultimately determine corresponds to CA1 pyramidal cells. As such, we identity 8 clusters of subiculum neurons. We have rephrased the subsection “Spatial deconstruction of the subiculum” to explicitly clarify this point.
2) Can any of the clusters be validated with immunostaining or transgenic mouse lines?
We thank the reviewer for this suggestion, which we have now addressed.
For immunostaining, we have identified seven protein products that are enriched in subclasses of subiculum pyramidal cells, correctly predicted from our scRNA-seq data. The functional correlates of these protein products span many neuronally critical functions, including intrinsic electrophysiological properties (e.g., Kv4.3 channels), synaptic transmission (e.g., Vglut2 and synaptotagmin-2), and calcium handling (e.g., S100 and Pcp4). This provides strong evidence that our scRNA-seq accurately predicts differential protein products, which in turn likely underpin functional differences in subiculum subclasses. This work now constitutes the new Figure 8 in our revised manuscript.
For transgenic mouse lines, we have identified that our scRNA-seq work can be used to accurately identify mouse lines that yield subclass-specific access. Specifically, our scRNA-seq identified subclass-specific expression of Slc17a6. We show that this differential expression leads to Cre expression in Slc17a6-expressing subclass, and that this can be used to selectively access this population with Cre-dependent viruses. This work now constitutes our new Figure 8—figure supplement 1 in our revised manuscript.
3) In the final Results section describing projection specific-correlates of transcriptomic clusters, it is difficult to evaluate the strength of the data. How many neurons were labeled/profiled in each projection class?
We now provide these numbers in the Materials and methods for both our initial dataset as well as our new replicate dataset.
How complete was the coverage of the target area?
For each downstream target, we selected one injection site located along the anterior-posterior axis. This strategy was specifically chosen to avoid potential off-target labeling associated with injecting large volumes of the brain (which may result in spillover into spatially adjacent downstream targets, or in the case of the amygdala, into the subiculum itself). This naturally reduces the coverage of the downstream region (we estimate we cover ~10-20% of the downstream region using this strategy), but avoids confounds of off-target effects. We now note this in the Materials and methods.
The Materials and methods section indicates retro beads and AAV-SL1-CAG-tdTomato were used to label projections but in the Results section, it seems like just beads were used. This should be clarified.
Retrobeads were used for the targeted harvesting of cells for scRNA-seq, as our previous work has shown that retrobeads do not affect gene expression (Cembrowski et al., 2016). For post hocISHvalidation, AAV-SL1-CAG-tdTomato was used, as retrobead labeling is lost during ISH processing. This is now noted in the Materials and methods.
A visual for how the projection neurons map onto the spatial domains described in Figure 6 and layers in Figure 4, would be useful.
Done. This now comprises Figure 9—figure supplement 3.
Reviewer #3:
[…] The potential general interest of the study is that single-cell RNAseq is relatively new and has yet to be applied to the subiculum, which is an interesting brain area because of its roles in memory. The technique is powerful in that it can identify neurons based on transcriptional signatures and when combined with projection and positional identities it can provide a convincing picture of cell diversity in a brain area. The limitations of the present study are that the claimed conceptual advances are over-stated and that the utility of the resource is compromised by a lack of replicates and limited validation.
As discussed at the very beginning of our response, we have increased our biological replicates for scRNA-seq, and also have greatly expanded our cross-validation with additional in situhybridization, immunohistochemistry, transgenic mouse lines, and comparisons to previous literature. We hope that this helps to ease the reviewer’s concerns about limited validation.
We respectfully disagree that our conceptual advances are overstated. We state our case for this below (see comment 1), and hope that by better framing of our results here and in the revised manuscript, our conceptual advance is more apparent relative to previous work.
1) While the marker genes identified will be useful, layer topography and distinctions in the proximo-distal axis of the subiculum were already largely known. For example, Ishihara and Fukuda (Neuroscience, 2016) have provided strong evidence for a layered molecular organization of the subiculum (nicely summarised in Figure 15 of their paper) and already provide good evidence for the main conclusion expressed in the title of the present study. While their study is very briefly mentioned, its convincing, important and original contributions are not sufficiently acknowledged. They should be outlined in the Introduction and the present data should be compared more directly with their results in the Discussion.
This is an excellent point. We agree with the reviewer’s point that Ishihara and Fukuda indeed make an important and original contribution that we did not sufficiently acknowledge. As such, we have incorporated additional references and comparisons to this work in our Introduction, Results, and Discussion.
However, it is important to note the scope of the Ishihara and Fukuda paper, which is based upon IHC detection of a select few proteins. Examining a small number of markers can be suggestive of an underlying organization – of which Ishihara and Fukuda very elegantly provide evidence – but cannot definitely resolve the underlying organization. Indeed, we have previously shown that bias introduced by examining only a few markers can fundamentally misidentify the underlying organizational scheme (Cembrowski et al., 2016). Thus, we would argue that “good evidence for the main conclusion” is an overreach of the previous work. In our revised manuscript, we have sought to reinforce the insight of Ishihara and Fukuda’s paper while also emphasizing how our work provides much stronger and comprehensive evidence for a discrete subclass organization.
It is particularly important to clarify whether the protein markers they identify (e.g. NOS, PCP4, ZnT3) are useful markers at the mRNA level based on the present data.
We now include this analysis in Figure 3—figure supplement 4. As expected from protein-level work, Nos, Pcp4, and Slc30a3 (encoding ZnT3) all correspond to specific laminae in the proximal subiculum.
It may also be interesting to address whether the subiculum is analogous to the deep layers of the isocortex or neocortex.
We agree that this is a very compelling line of inquiry; however, we feel that a formal discussion is premature at this point. Our paper is primarily focused on the transcriptomic organization of the subiculum; the corresponding organization in the neocortex – especially across neocortical regions – is still very much under-resolved. As such, it is difficult to make a comparison while missing crucial features of one the comparative elements.
2) The major potential contribution of the present study will likely be for groups wanting to investigate how gene expression patterns in each of the identified subclasses relate to neuronal function or signaling cascades. For this, we find a biological replicate of 1 is not sufficient. There is a real concern here that the results are not definitive, and the study may mislead rather than benefit future work. Since the authors invested effort in making the dataset public, biological replicates would enhance the reliability of their study once it goes in the public domain.
The reviewer’s point is well-taken. As discussed in the very beginning of our response, as well as in our response to reviewer 1’s first comment, we have expanded the biological replicates for all scRNA-seq datasets. The results of this dataset recapitulate our initial findings, and are part of our new Figure 2—figure supplement 3 and Figure 9—figure supplement 1.
3) There seems to be an overlap in expression of the marker genes expressed by neurons projecting to each target area (Figure 7). For example, neurons projecting to the PFC express nearly all genes enhanced in all clusters, which weakens the conclusion that distinct transcriptional identities map onto projection choice. Similarly, NA and amygdala projection neurons express both Dlk1 and Gpc3, albeit at different proportions.
We certainly agree that there is not a perfect one-to-one relationship between projection classes and transcriptomic subclass in general. However, we do show that such a relationship can indeed exist for specific projections (e.g., the amygdala). In our revised manuscript, we have modified our wording to better reflect the different types of transcriptomic organizational principles that can apply to projection classes.
Perhaps with more animals sampled, the level of expression of marker genes will appear more even or more different? We suggest to either increase the number of animals in the sequencing assay, or to perform immunostaining / in situs to find out whether neurons projecting to each area are positive for subclass markers.
As requested, we have doubled the number of animals (i.e., biological replicates) used for sequencing each of the projection subclasses. These new replicates recapitulate the general organizational principles of our original dataset (as described in the previous paragraph) and now constitute our new Figure 9—figure supplement 1.
4) Selected genes in 5 out of the 8 clusters identified are lamina-specific, but some genes even though they belong to separate clusters seem to be expressed in an overlapping manner. For example, Cbln4 looks like it is in the same lamina as Dlk1 from single in-situs (Figure 4B). If the authors want to show this gene really marks a distinct class, they need to perform fluorescent ISH for this gene and Dlk1.
Done. As predicted by our scRNA-seq, using ISH we now show directly that these are adjacent but non-overlapping subclasses (new Figure 5D).
With this ISH successfully performed, in the spirit of having a complete examination of all ventral marker genes, we also performed a new ISH experiment examining Ly6g6e and Tpbg expression (new Figure 5E). As expected from our scRNA-seq work, these genes are associated with different laminae. We thank the reviewer for motivating us to perform this comprehensive examination of marker genes.
For the same reason, Col5a and Dlk1, which are depicted as non-overlapping in Figure 6, need validation with double ISH.
The adjacency between Col5a2 and Dlk1, as illustrated from both ISH (Figure 4) and the associated schematic (current Figure 7; previously Figure 6), is minimal. This is best exemplified when comparing Col5a2 and Dlk1 side-by-side; note that where both genes are expressed within the same section, they tend to respectively occupy dorsal and ventral poles.
Critically, the dorsal vs. ventral enrichments alone provide a strong illustration that Col5a2 and Dlk1 are expressed in different populations.
To illustrate this within the same tissue sections, we next performed two-color fISH. As would be expected from minimal adjacency (Author response image 1), we found it challenging to find a local region that contained robust expression of both genes. We show an example from the intermediate subiculum (Author response image 2). Importantly, even when quantifying intermediate regions (i.e., ignoring poles in which expression is completely dominated by one gene, Author response image 1), we found that 84% of cells (n = 212 cells total from 2 animals) exhibited mutually exclusive expression of either Dlk1 or Col5a2 (note that Col5a2 expression is primarily nuclear). This reinforces that Dlk1 and Col5a2 are markers for distinct populations of cells.

Side-by-side comparison of Col5a2 and Dlk1 across the subiculum.
ISH images from Figure 3 are shown.

Two-color fISH of Dlk1 and Col5a2.
Representative image of expression of Dlk1 (green) and Col5a2 (magenta) in an intermediate region of the subiculum.
Also, Tpbg is depicted as restricted to the ventral half of the subiculum, even though it appears to be expressed more dorsally (Figure 3).
We thank the reviewer for pointing this out, and have now revised this figure.
A diagram indicating which genes are expressed in which lamina may also be helpful – this is hard to see in Figure 6.
We have slightly modified the coloring convention here to help interpret of this figure.
5) In the Abstract, the claim "the subiculum pyramidal cell population can be deconstructed into eight discretely separable subclasses" is difficult to justify based on the data. There is no test of discreteness in the analysis and the t-SNE plots suggest that the suggested subclasses overlap / are contiguous.
We indeed have a test for the discrete separation of clusters, examining the robustness of clusters upon downsampling (Figure 2—figure supplement 1B). This analysis illustrates that clusters are well separated, as using ~1/3 of our dataset was sufficient for ~80% success in predicting cluster identity. Such algorithms generally fail when clusters are not well-separated; the proper classification of our dataset despite a 70% downsampling is a strong indicator of effective separation.
Regarding the statement “t-SNE plots suggest that the suggested subclasses overlap / are contiguous”, this is a misinterpretation of t-SNE. t-SNE uses nonlinear dimensionality reduction to effectively balance local and global distances, and thus the distance between clusters cannot be taken as a measure of discreteness. Moreover, t-SNE is solely a visualization procedure, with clustering performed independently of this visualization. The robustness-to-downsampling analysis we discuss above is a stronger measure of separation.
Finally, the gold standard of putative discrete separation is cross-validation by in situhybridization to show nonoverlapping populations. We had multiple examples of this in our original manuscript, and have since augmented this with additional validation (see Figure 5, including the specific pairings sought in comment 3 above).
6) Choices made in setting up the analysis pipeline, and the consequences of different choices, are not sufficiently explained.
In general, this point reflects one of the broad challenges of “Big Data” in the transcriptomics community – how does one choose parameters inherent to analysis? To date, there is no well principled “one-size-fits-all” approach to choosing parameters. Our approach – philosophically and practically – has always been to analyze our data to the depth that it can be successfully validated by other techniques. As we hope the reviewer will appreciate, in our revised manuscript we have cross-validated our results extensively with single- and multicolor fluorescence in situhybridization as well as via immunohistochemistry. We also now provide a more formal phrasing of our general approach described above.
For example, to what extent does changing the cutoff thresholds in FindVariableGenes affect the subsequent clustering?
The clusters that we obtained were robust to these changes. For example, three-fold changes up or down in any the thresholds associated with this analysis (x.low.cutoff: minimal average expression, x.high.cutoff: maximal average expression, y.cutoff: minimum dispersion) return largely identical clusters, as shown in Author response image 3.

Robustness of clusters across threshold values.
Each row corresponds to changing the value of a given parameter inherent to the FindVariableGenes call; specifically, x.low.cutoff (top row), x.high.cutoff (middle row), and y.cutoff (bottom row). Values explored are 3-fold decrements (left column) and 3-fold increments (right column) relative to manuscript value (middle column). Left to right, this constitutes nearly an order of magnitude difference in the parameter value. T-SNE visualizations and clustering results are shown for each parameter regime. Colours denote clusters obtained by graph-based approach used in main manuscript, with colouring associated with marker genes in main manuscript. Note, although in principal such lusters may be strongly affected by changes in these cutoff values, in practice they are not: marked stability is present in the number of clusters, the number of cells per cluster, and the marker genes associated with each cluster.
We now explicitly mention this robustness formally in our Materials and methods.
We hasten to note that, in addition to the above robustness (a measure of internal consistency of our original RNA-seq dataset), in our revised manuscript we also have multiple measures of the more stringent test of externalconsistency with other datasets. Specifically:
1) The clusters obtained in our original dataset map onto clusters generated in a new biological replicate dataset (new Figure 2—figure supplement 3);
2) The clusters obtained in our original dataset map onto discrete subclasses confirmed by in situhybridization (newly expanded Figure 5);
3) The clusters obtained in our original dataset map onto predicted protein products (new Figure 8).
To what extent is clustering affected by the resolution parameter?
Changing the resolution parameter naturally controls the degree of “lumping” vs. “splitting”. The value we used in our manuscript produces a set of clusters that are consistent with multiple cross-validations. Further splitting leads to clusters that harder to cross-validate, which may emerge due to oversplitting or may reflect more nuanced biology. We have erred on the side of being conservative in our calls, requiring that all clusters be supported by both RNA-seq data and in situhybridization. We now explicitly mention this formally in our Materials and methods.
In generating the t-SNE plots what were the perplexity values and how many steps were used?
We used a standard value of perplexity (=30), and 1000 iterations which were sufficient for convergence. We now list these in the Materials and methods.
Several sub-classes do not appear particularly well separated in the t-SNE plots. It may be that optimising perplexity or steps gives a better indication of separation, or it may be that they are not separable even with t-SNE.
As we noted above (point 5), the idea that clusters need to be well-separated in t-SNE space for discrete separation is a misinterpretation of t-SNE. Changing parameters in t-SNE, which is solely a visualization procedure and has nothing to do with formal clustering per se, will not change any clustering results. We have both analytical controls (Figure 2—figure supplement 1B) and extensive histological cross-validation (newly expanded Figure 5) that directly illustrate clusters that appear “close” in t-SNE space are indeed discretely separated.
7) Figure 4C-E and Figure 7—figure supplement 1 require quantification of the numbers of cells and numbers of biological replicates.
In our previous version of the manuscript, these quantifications were provided in-line within the Results section (number of cells) as well as in the associated Materials and methods (number of biological replicates). In our revised version, for ease of readability we have combined these details in the Results section for Figure 5 (previously Figure 4) or the legend for Figure 9—figure supplement 2 (previously Figure 7—figure supplement 1).
8) Figure 2—figure supplement 1B suggests that approximately 20-25% of cells are not classifiable. Does this population overlap across simulation runs?
We have performed this analysis and include the results as Author response image 4. As would be expected, most cells that are misclassified typically occupy the extremes of clusters, and do exhibit overlap across runs. Smaller clusters (e.g., cluster 9) also tended to exhibit higher rates of misclassification, owing to smaller representation in the overall dataset (note that minority class prediction is a general challenge for machine-learning algorithms).

Response Figure 4.
Cellular resolution of cluster assignment. A total of 1000 stochastic simulations were run, wherein for each simulation, 800 cells were stochastically selected for training a random forest classifier and the remaining 303 cells in the dataset were used for testing this classifier (as in Figure 2—figure supplement 1B). Each cell is colored according to the percent of success identifications across test trials. For comparison, cluster designation is provided at right. Most cells exhibited near-perfect assignment for the correct clusters, with misassigned cells typically occupying the extrema of clusters. Notably, cluster 9 typically exhibited poor assignment, likely arising from its small and underrepresented nature in the dataset (24 cells or ∼2% of dataset; conventional random forest classifiers are biased against underrepresented classes). B. For comparison, the tSNE visualization of clusters is provided.
If so, what happens to the cell classification if these cells are excluded? For example, are the groupings cleaner?
Certainly, elimination of these cells would help to separate groupings, as by definition one is removing points that have ambiguous classification. However, such a post hoc elimination of undesired data points is not a statistically well-principled way to approach analysis. We would prefer not to mask any cells from our analysis in this way, and instead have expanded upon misclassification in Figure 2—figure supplement 1.
9) For reproducibility, the main analysis code should be made available alongside the study.
We have an established track-record of providing all code associated with each of our published RNA-seq studies. All code used in this study will be available upon acceptance, as stated in both our original and revised manuscripts.
When doing so it would be helpful to make explicit the random number seeds used by Seurat and the version of Seurat used. When we used Seurat to analyze the dataset we obtained different, although qualitatively similar, plots to those in the manuscript. We guess this is because of differences in seeding but cannot know for sure. The methods should also make clear whether key analyses were repeated with different seeds and whether similar results were obtained.
Where the reviewer refers to “seed” here, we assume that this is a reference to t-SNE, which is the only element of our analysis pipeline that contains stochasticity and is shaped by seeding. We used the default seed for our t-SNE visualization, and have run this visualization with multiple seeds and have obtained qualitatively similar results. This is now stated explicitly in the Materials and methods section.
[Editors' note: further revisions were requested prior to acceptance, as described below.]
Essential revisions:
1) The revisions do more to acknowledge previous work by Ishihara and Fukuda. However, this previous work is still not credited sufficiently. This doesn't affect the validity of the conclusions, nor the strong case for publishing the study, but a more scholarly approach to recognizing previous work would reflect well on the authors and the journal. We have some suggestions.
Introduction, third paragraph, acknowledges Ishihara and Fukuda, but their contribution is not made sufficiently clear here. Perhaps state, "Recent investigations using immunohistochemical labeling argue that the proximal subiculum is composed of a molecular layer and multiple cell body layers, each distinguished by molecular and morphological differences, while the distal subiculum is more uniform (Ishihara and Fukuda, 2016)."
Discussion, subsection “The subiculum as a laminar and columnar structure”, last paragraph. It's important to be clear here that prior evidence for and articulation of the idea that "the subiculum can be deconstructed into proximal and distal subdomains, with further laminar organization predominantly found in proximal subiculum" was provided in the previous study by Ishihara and Fukuda. We agree that the present results further refine their model, but as written the text could easily be interpreted as taking credit for ideas previously proposed by Ishihara and Fukuda.
We now explicitly note that this was previously proposed by Ishihara and Fukuda.
Also, the implication in the first paragraph of the aforementioned subsection, that Ishihara and Fukuda's scheme was based only on protein labeling is incorrect, as they also took account of neuronal morphology, something the present study doesn't do.
We now note that Ishihara and Fukuda analyzed neuronal morphology.
2) We're not convinced by the conclusion that the analysis supports the existence of eight discrete cell classes.
Although all computational and experimental results we have obtained are consistent with the existence and discrete separation of these 8 classes, it is possible in principle that some continua may exist between specific subclasses. As the following 3 points raised by the reviewer below ultimately culminate in “These problems could easily be addressed by [several means of improvement]”, we keep the rest of our response to the end of this section.
It seems pretty clear that some of the cell classes are distinct (e.g. groups labeled by Cbln4 vs. Dlk1), but while others can be grouped, the possibility that rather than being discrete classes they reflect a split along a continuum, or overlapping classes, is not convincingly addressed (e.g. S100b vs. Tpbg).
First, it's not clear how the algorithm used for clustering provides evidence for groups being generated by discrete as opposed to continuous distributions. As the authors recognize this is a difficult problem. Clustering algorithms will group some continuous distributions into clusters, but this is not evidence that the distributions were in fact discrete. Rather than under-sampling, which doesn't address the problem convincingly, a more rigorous statistical approach is required to support the conclusion that there are eight discrete groups. Previous comments about the interpretation of the tSNE plots must not have been sufficiently clear. They of course don't test for discreteness. Rather, a typical concern is that tSNE can give an exaggerated sense of distances between data points, whereas here even when visualizing the data using tSNE plots the groups appear contiguous.
Second, the new data in Figure 5 are nice, but their interpretation requires clarification. Each comparison is between groups that appear well separated by the clustering algorithm (cf. Figure 2A) and the conclusion that the groups labeled in Figure 5 are distinct seems very reasonable. However, the clusters in Figure 2A that appear contiguous (e.g. S100b and Tpbg, Dlk1 and Lefty1, Dlk1 and Gpc3, etc.) are not validated in Figure 5. Thus, Figure 5 doesn't support the idea that all eight proposed cell groups are discretely separable, as there is no evidence here that the adjacent groups of cells from Figure 2A are separable.
Third, the argument that ~80% successful classification with a random forest validates the groupings is not by itself convincing. For genuinely discrete classes wouldn't you expect the RF to do a little better? Are the misclassified cells randomly distributed, or are errors more systematic? For example, are all groups misclassified at the same rate, or is the error rate higher for particular groups? Are some types of error over-represented, e.g. does S100b misclassify as Tpbg, and vice -versa, at higher rates than other pairings? What error rates would you expect given alternative hypotheses that some groups, e.g. S100b and Tpbg, represent a split along a continuum, rather than discrete classes?
These problems could easily be addressed by avoiding use of "discrete" as a conclusion, e.g. in the title, in the Abstract, and multiple other parts of the manuscript.
In our revised manuscript, we have now removed the word “discrete” as it refers to the scRNA-seq results, and use this word to reference our work only in cases where we have explicitly confirmed discreteness via cross-validation (e.g., in situhybridization). We have kept this word in the title of our work because it is an accurate representation of our body of work as a whole – even if some scRNA-seq subclasses do actually exist in a continuum, they will nonetheless be discretely separated from other subclasses (as well as be in the minority of all subclasses; see new Discussion paragraph).
By discussing the potential ambiguities, and by being open to the possibility that some, although clearly not all, of the groupings may not be discrete. Along the same lines, the idea that there are eight groups would be better phrased as a suggestion rather than a definitive conclusion.
In our revised Discussion we have now included an additional paragraph on the interpretation of our scRNA-seq-derived subclasses. This paragraph covers the possibility of discrete vs. continuous subtypes, as well as the total number of subtypes of subiculum pyramidal cells.
https://doi.org/10.7554/eLife.37701.037Article and author information
Author details
Funding
Howard Hughes Medical Institute
- Mark S Cembrowski
- Lihua Wang
- Andrew L Lemire
- Monique Copeland
- Salvatore F DiLisio
- Jody Clements
- Nelson Spruston
The funders had no role in study design, data collection and interpretation, or the decision to submit the work for publication.
Ethics
Animal experimentation: Experimental procedures were approved by the Institutional Animal Care and Use Committee at the Janelia Research Campus (protocols 14-118 and 17-159).
Senior Editor
- Gary L Westbrook, Vollum Institute, United States
Reviewing Editor
- Laura Colgin, The University of Texas at Austin, Center for Learning and Memory, United States
Version history
- Received: April 19, 2018
- Accepted: October 27, 2018
- Accepted Manuscript published: October 30, 2018 (version 1)
- Version of Record published: November 9, 2018 (version 2)
Copyright
© 2018, Cembrowski et al.
This article is distributed under the terms of the Creative Commons Attribution License, which permits unrestricted use and redistribution provided that the original author and source are credited.
Metrics
-
- 5,237
- Page views
-
- 866
- Downloads
-
- 48
- Citations
Article citation count generated by polling the highest count across the following sources: Crossref, Scopus, PubMed Central.
Download links
Downloads (link to download the article as PDF)
Open citations (links to open the citations from this article in various online reference manager services)
Cite this article (links to download the citations from this article in formats compatible with various reference manager tools)
Further reading
-
- Neuroscience
Postsynaptic mitochondria are critical for the development, plasticity, and maintenance of synaptic inputs. However, their relationship to synaptic structure and functional activity is unknown. We examined a correlative dataset from ferret visual cortex with in vivo two-photon calcium imaging of dendritic spines during visual stimulation and electron microscopy reconstructions of spine ultrastructure, investigating mitochondrial abundance near functionally and structurally characterized spines. Surprisingly, we found no correlation to structural measures of synaptic strength. Instead, we found that mitochondria are positioned near spines with orientation preferences that are dissimilar to the somatic preference. Additionally, we found that mitochondria are positioned near groups of spines with heterogeneous orientation preferences. For a subset of spines with a mitochondrion in the head or neck, synapses were larger and exhibited greater selectivity to visual stimuli than those without a mitochondrion. Our data suggest mitochondria are not necessarily positioned to support the energy needs of strong spines, but rather support the structurally and functionally diverse inputs innervating the basal dendrites of cortical neurons.
-
- Neuroscience
Several discrete groups of feeding-regulated neurons in the nucleus of the solitary tract (nucleus tractus solitarius; NTS) suppress food intake, including avoidance-promoting neurons that express Cck (NTSCck cells) and distinct Lepr- and Calcr-expressing neurons (NTSLepr and NTSCalcr cells, respectively) that suppress food intake without promoting avoidance. To test potential synergies among these cell groups we manipulated multiple NTS cell populations simultaneously. We found that activating multiple sets of NTS neurons (e.g., NTSLepr plus NTSCalcr (NTSLC), or NTSLC plus NTSCck (NTSLCK)) suppressed feeding more robustly than activating single populations. While activating groups of cells that include NTSCck neurons promoted conditioned taste avoidance (CTA), NTSLC activation produced no CTA despite abrogating feeding. Thus, the ability to promote CTA formation represents a dominant effect but activating multiple non-aversive populations augments the suppression of food intake without provoking avoidance. Furthermore, silencing multiple NTS neuron groups augmented food intake and body weight to a greater extent than silencing single populations, consistent with the notion that each of these NTS neuron populations plays crucial and cumulative roles in the control of energy balance. We found that silencing NTSLCK neurons failed to blunt the weight-loss response to vertical sleeve gastrectomy (VSG) and that feeding activated many non-NTSLCK neurons, however, suggesting that as-yet undefined NTS cell types must make additional contributions to the restraint of feeding.