Parvovirus minute virus of mice interacts with sites of cellular DNA damage to establish and amplify its lytic infection
- Christopher S. Bond Life Sciences Center, United States
- School of Medicine, University of Missouri-Columbia, United States
- MU Informatics Institute, University of Missouri-Columbia, United States
Figures
Figure 1
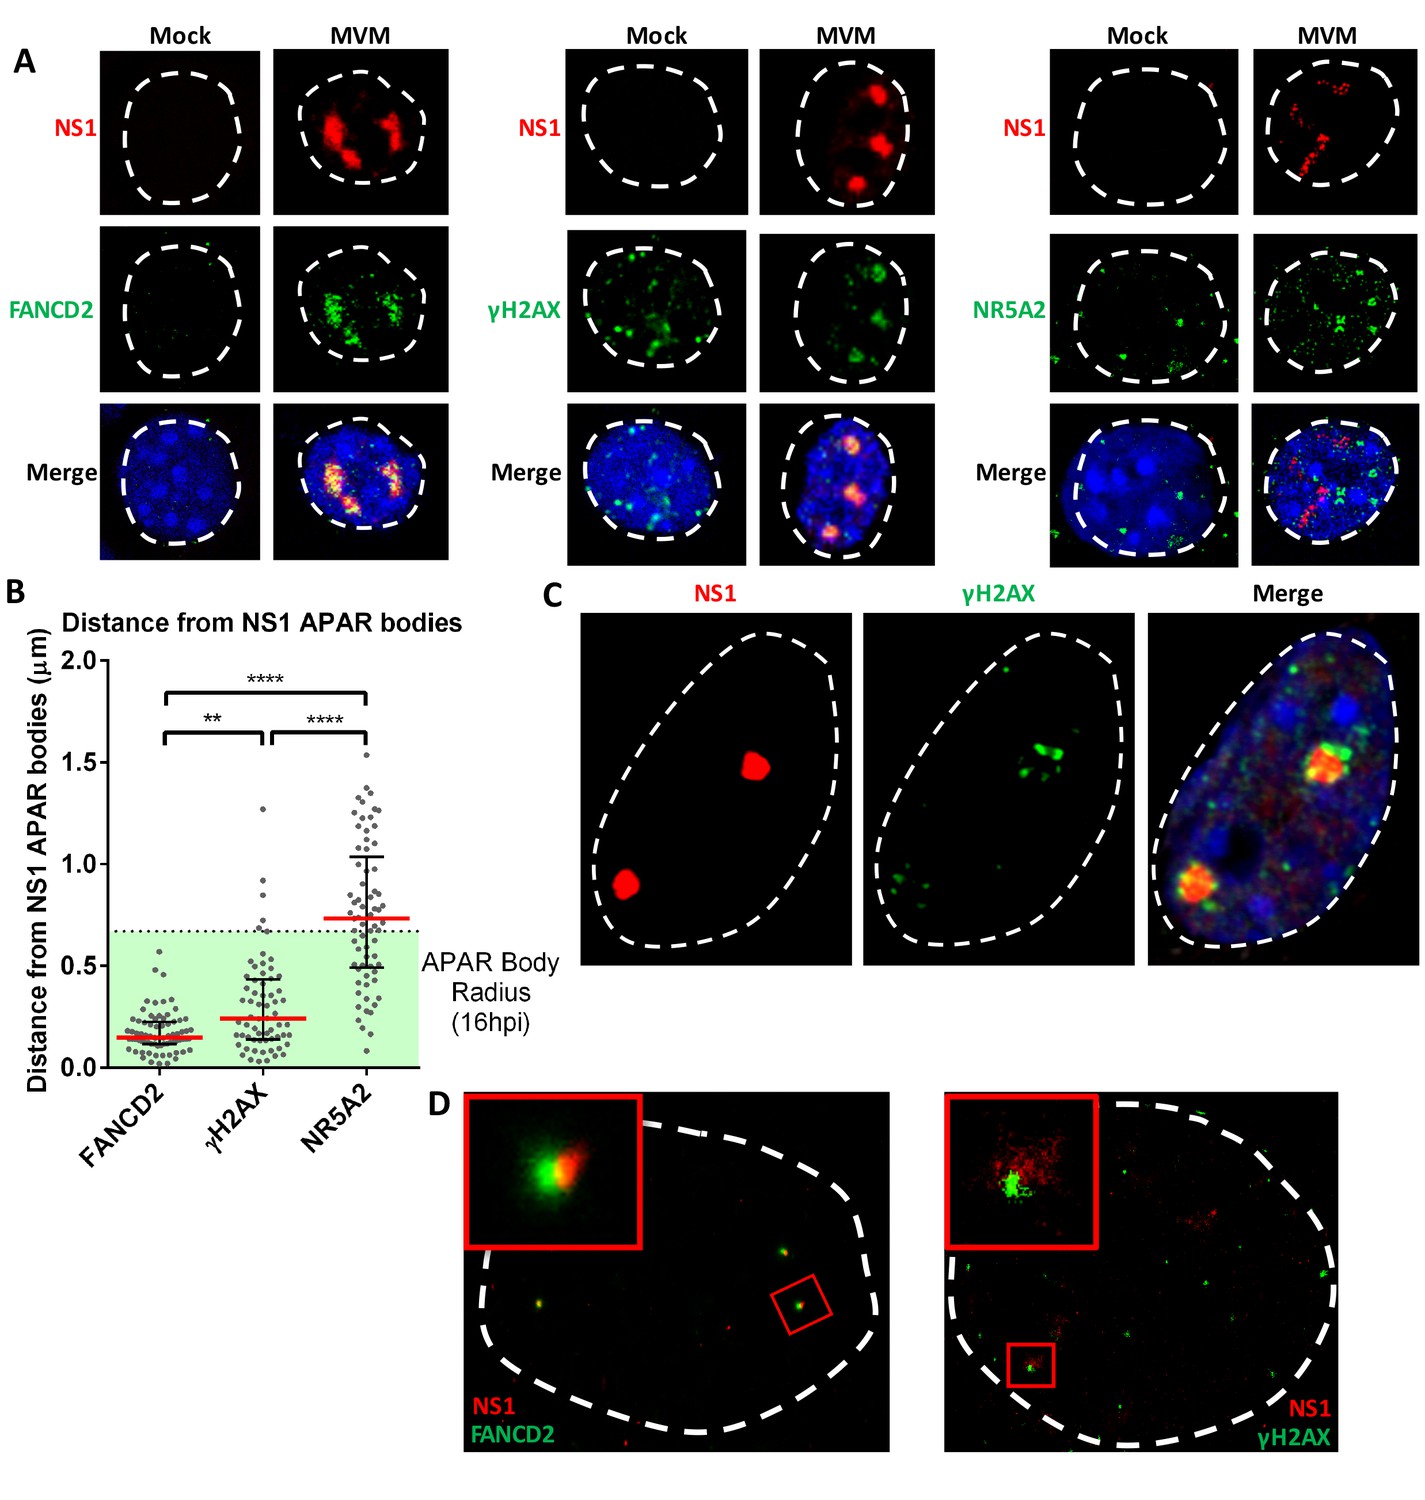
The replicating MVM genome associates with cellular sites undergoing DNA damage.
(A) Representative confocal images of Mock versus MVM infected murine A9 cells at 16 hpi, probing MVM-NS1 (red) and the DDR factors FANCD2 and γ-H2AX, and the irrelevant transcription factor NR5A2 (green), quantified in (B). Blue corresponds to DAPI staining. Nuclear border is indicated by dashed white line. (B) The distances between NS1 and indicated DDR proteins were calculated from deconvolved confocal z-stacks using Huygens and ImageJ programs (described in Materials and methods), and the non-associated transcription factor NR5A2 was used as a negative control. Results are represented as grey scatterplots from three independent infections, with the median value of the dataset depicted by a red line. Black error bars represent the interquartile range of the dataset. The radius of APAR bodies were calculated by measuring the diameter of APAR bodies from multiple fields from three independent infections at 16 hpi imaged using confocal microscopy and deconvolved using Huygens software. The radius of APAR body was calculated by dividing the median diameter by 2, and is represented as a dashed horizontal line. Significant differences are denoted as *p<0.05, **p<0.005 and ****p<0.0005 (one-way ANOVA, multiple comparisons). (C) Representative image of an APAR body at 16 hpi imaged using a super-resolution Airyscan imaging platform, where NS1 (red) stains the APAR body and γ-H2AX (green) stains for DNA damage. DAPI stains the nuclear border, demarcated by a white dashed line. (D) Super-resolution GSD-STORM imaging of MVM-APAR bodies at 16 hpi and cellular DDR markers, including FANCD2 (left) and γ-H2AX (right). The nuclear borders are demarcated by a dashed white line and were identified by brightfield imaging (not shown). The inset shows magnifications of the APAR bodies (red) and the respective DDR protein (green).
Figure 2 with 2 supplements

The MVM genome associates with distinct sites on the cellular genome.
(A) Top Schematic of the V3C-seq assay showing how MVM- host cell genomic proximity is frozen by crosslinking, followed by digesting (with HindIII) and intramolecularly ligating to generate novel MVVM-host cell DNA hybrids. This DNA library is subjected to a second round of digestion with a frequently-digesting 4 base-pair endonuclease (NlaIII), before circularizing and generating a sequencing library of all hybrid fragments that associate with the MVM genome. Bottom Detailed schematic of the duplex form of MVMp genome containing the primary restriction enzyme site (HindIII) with its associated inverse PCR primer (blue arrow), and the secondary restriction enzyme site (NlaIII) with its associated inverse PCR primer (orange arrow) utilized for circularization. The single stranded version of the genome is depicted in solid black line and complementary strand in dotted black line. (B) Associations of the MVM genome with sites on the cellular DNA mapped using V3C-seq assays are presented. Representative examples of murine chromosome 17 (top) and chromosome 19 (bottom) are shown for three timepoints post-infection: 12 hpi (red), 16 hpi (blue) and 20 hpi (green). The data represents an average of at least 2 independent experiments with y-axis values reflecting the reads per million (rpm) sequence reads averaged over 5 contiguous fragments (as described in Materials and methods). The y-axis scale is from 1 to 6 rpm, whereas the x-axis is 95 Mb for chromosome 17 (top) and 61 Mb for chromosome 19 (bottom). Large genomic regions that associate with MVM, termed Virus Associated Domains (VADs), are shown by red boxes, but this indication is not meant to restrict this nomenclature to regions of this size. (C) Genomic regions spanned by V3C-seq peaks greater than 5 total reads were selected, and the common regions between different timepoints were intersected using BEDTools (see Materials and methods). In the Venn diagrams on the left panel, the red set represents genomic regions that were covered by 12 hpi, blue represents 16 hpi and green represents 20 hpi. The regions common to 12 and 16 hpi are shown in purple (top), while 16 and 20 hpi are in yellow (bottom). The percent of genomic regions that are common are depicted in the intersected set. Statistical significance of the overlap was computed using Jaccard analysis on BEDtools (right panels, red crosses) between the top ten thousand V3C-seq peaks at 12, 16 and 20 hpi timepoints, with control comparisons permuted by determining the extent of overlap with a randomly generated peak file containing domains of equivalent V3C-seq peaks (represented by black squares). (D) 3C-qPCR was performed on synchronized murine A9 cells infected with MVM with an MOI of 5 for 16 hr, as described in Materials and methods, and then analyzed with the viewpoint on the MVM genome. The association of MVM with a HindIII site in the Chr19 VAD (at position 19qA) was quantified relative to nearest neighbor interactions of contiguous HindIII fragments on the Ercc3 locus. 3C-qPCR analysis was performed in (E), parasynchronized NIH-3T3 cells infected for 12 and 16 hr with MVMp, and (F), EL4 cells with MVMi, assayed from the MVM viewpoint. Association was tested with four VADs (10qC1, 19qA, 15qE1 and 17qA3.3) and a negative control site on Chromosome 17 (17qE1.1). Data is presented as mean SEM of three independent experiments.
Figure 2—figure supplement 1
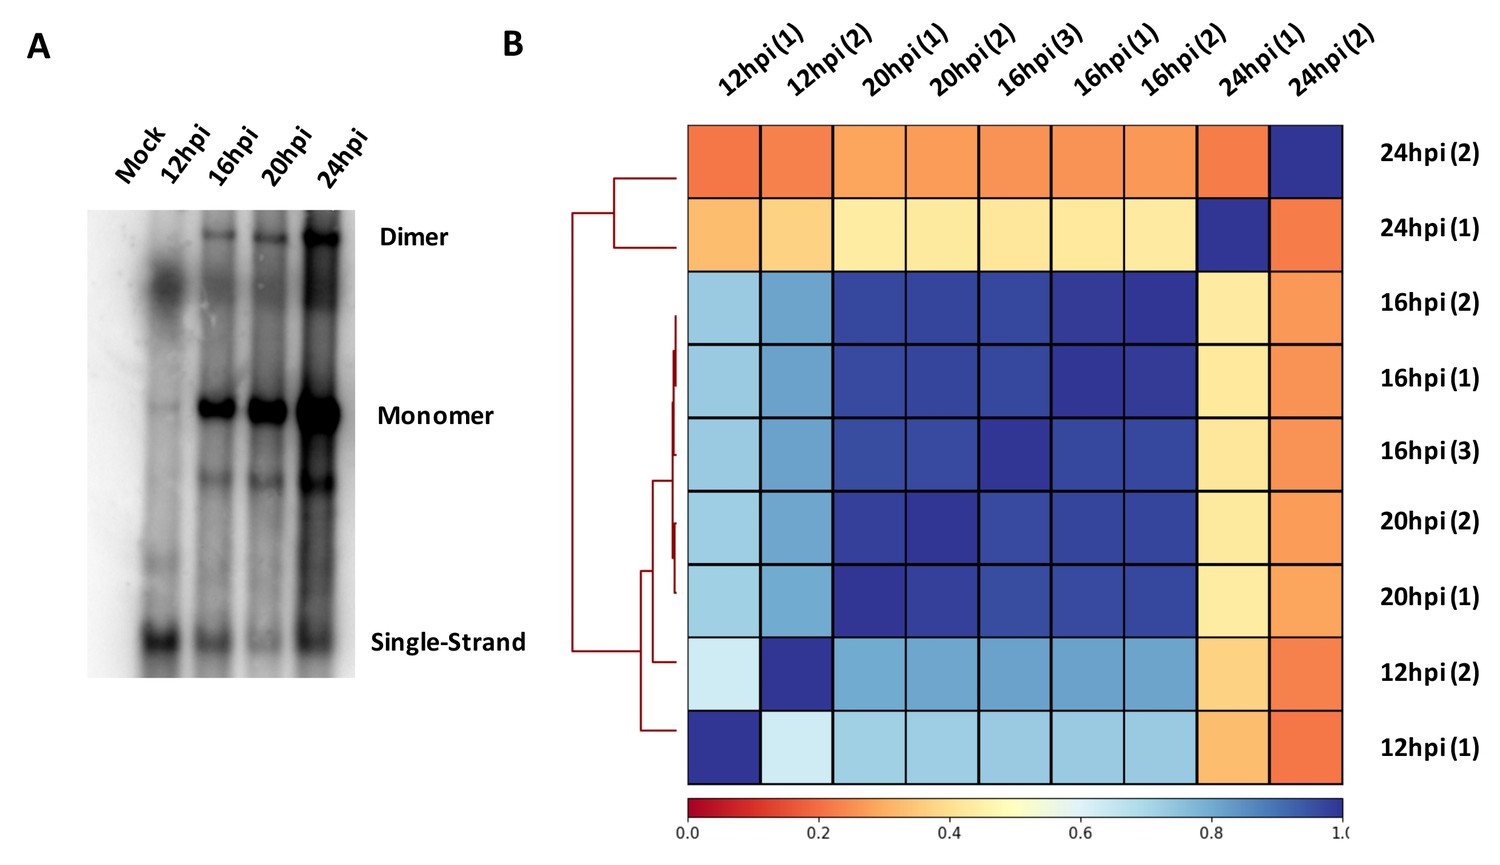
MVM replication during viral infection and correlation of V3C-seq interaction sites.
(A) MVM replication over the timecourse of viral infection in parasynchronized murine A9 cells. A9 cells were infected at an MOI of 5. Cells were harvested at the indicated timepoints and Southern blot was performed as described in Materials and methods. DNA content was measured by nanodrop and equal amount of DNA was loaded in each well. The blot was hybridized with radiolabeled MVM probe and single stranded DNA, and replicative intermediates monomer and dimer forms are indicated on the right. (B) MVM interaction sites on the mouse genome across independent replicates at different timepoints were compared pairwise, and presented in the form of a clustered heatmap of Spearman correlation coefficients on the Galaxy server (Afgan et al., 2016; Ramírez et al., 2016). The timepoints and experimental replicate are indicated on the X and Y axes. Blue squares designate high correlation and red squares designate low correlation, and the spectrum of colors to correlation is shown below the heatmap.
Figure 2—figure supplement 2
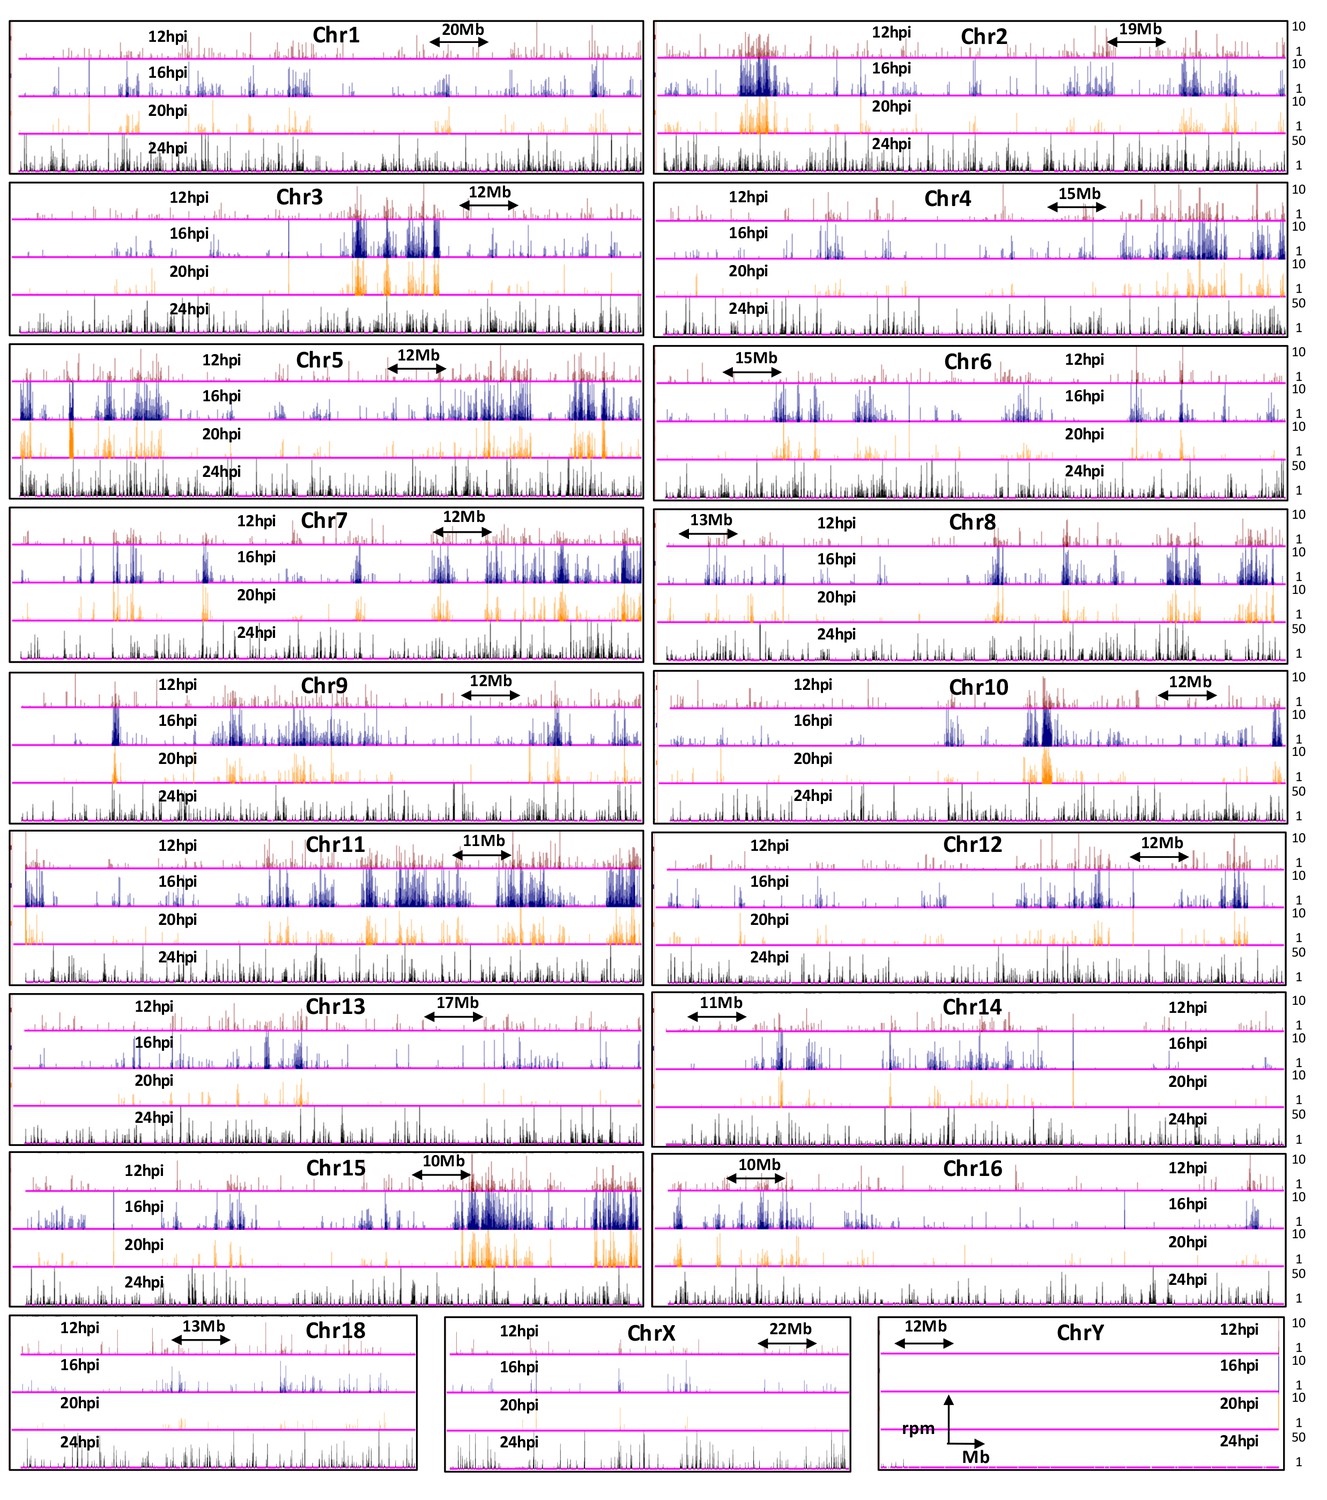
Genome browser snapshots of MVM interaction sites on all chromosomes in the mouse genome.
12 hpi (red), 16 hpi (blue), 20 hpi (orange) and 24 hpi (black) timepoints are shown. The y-axis values are depicted on the right hand side. Since MVM interaction at 24 hpi did not show a characteristic distribution and had high rpm values (consistent with overwhelming levels of MVM replication in the host cell nucleus), it was not used for quantile normalization of interaction sites at 12, 16 and 20 hpi. Chromosomes 17 and 19 are presented in Figure 2B.
Figure 3 with 2 supplements

The MVM genome initiated infection at sites of cellular DNA damage that in mock infected cells also exhibited DNA damage as the cells cycled through S-phase, and as infection progressed, localized to additional sites of induced damage.
(A) Representative quantile normalized ChIP-seq plots of γ-H2AX binding to the cellular genome on Chromosome 17 (top) and Chromosome (19). The tracks represent γ-H2AX ChIP-seq peaks in A9 cells that are mock infected at 12 hr post release (green), MVM infected at 16 hpi (blue), 20 hpi (yellow), and HU treated A9 cells 12 hr (maroon). V3C-seq peaks at 16 hpi are also shown at the bottom for comparison (blue). Red rectangle denotes VAD sites, and y-axis values for ChIP-seq peaks have been restricted from 0 to 5 reads per million. (B) The EPIC-called ChIP-seq peaks at different timepoints for MVM infection were analyzed for coincident γ-H2AX binding using BEDTools (Quinlan and Hall, 2010), and the resulting distances covered on the genome were plotted on Venn Diagrams as percentage of total coverage. Statistical significance of the overlap was determined using Jaccard analysis on BEDtools (far right, red crosses), with a control comparison permuted by determining the extent of overlap with a randomly generated peak file with domains of equivalent size as ChIP-seq peaks (represented as black squares). (C) γ-H2AX peaks from ChIP-seq experiments were intersected with VAD peaks identified in Figure 1C for the corresponding timepoints (Mock γ-H2AX was intersected with 12 hpi). The percentage of total regions that coincided were calculated and plotted for VAD-associated γ-H2AX peaks (designated as ‘V3C-positive’), and γ-H2AX associated VAD-peaks. (D) Heatmap of MVM association with DNA damaged sites were generated using DeepTools on the Galaxy server (Afgan et al., 2016; Ramírez et al., 2016). The average V3C enrichment on 1 Megabase around γ-H2AX positive sites were determined and plotted as shown.
Figure 3—figure supplement 1
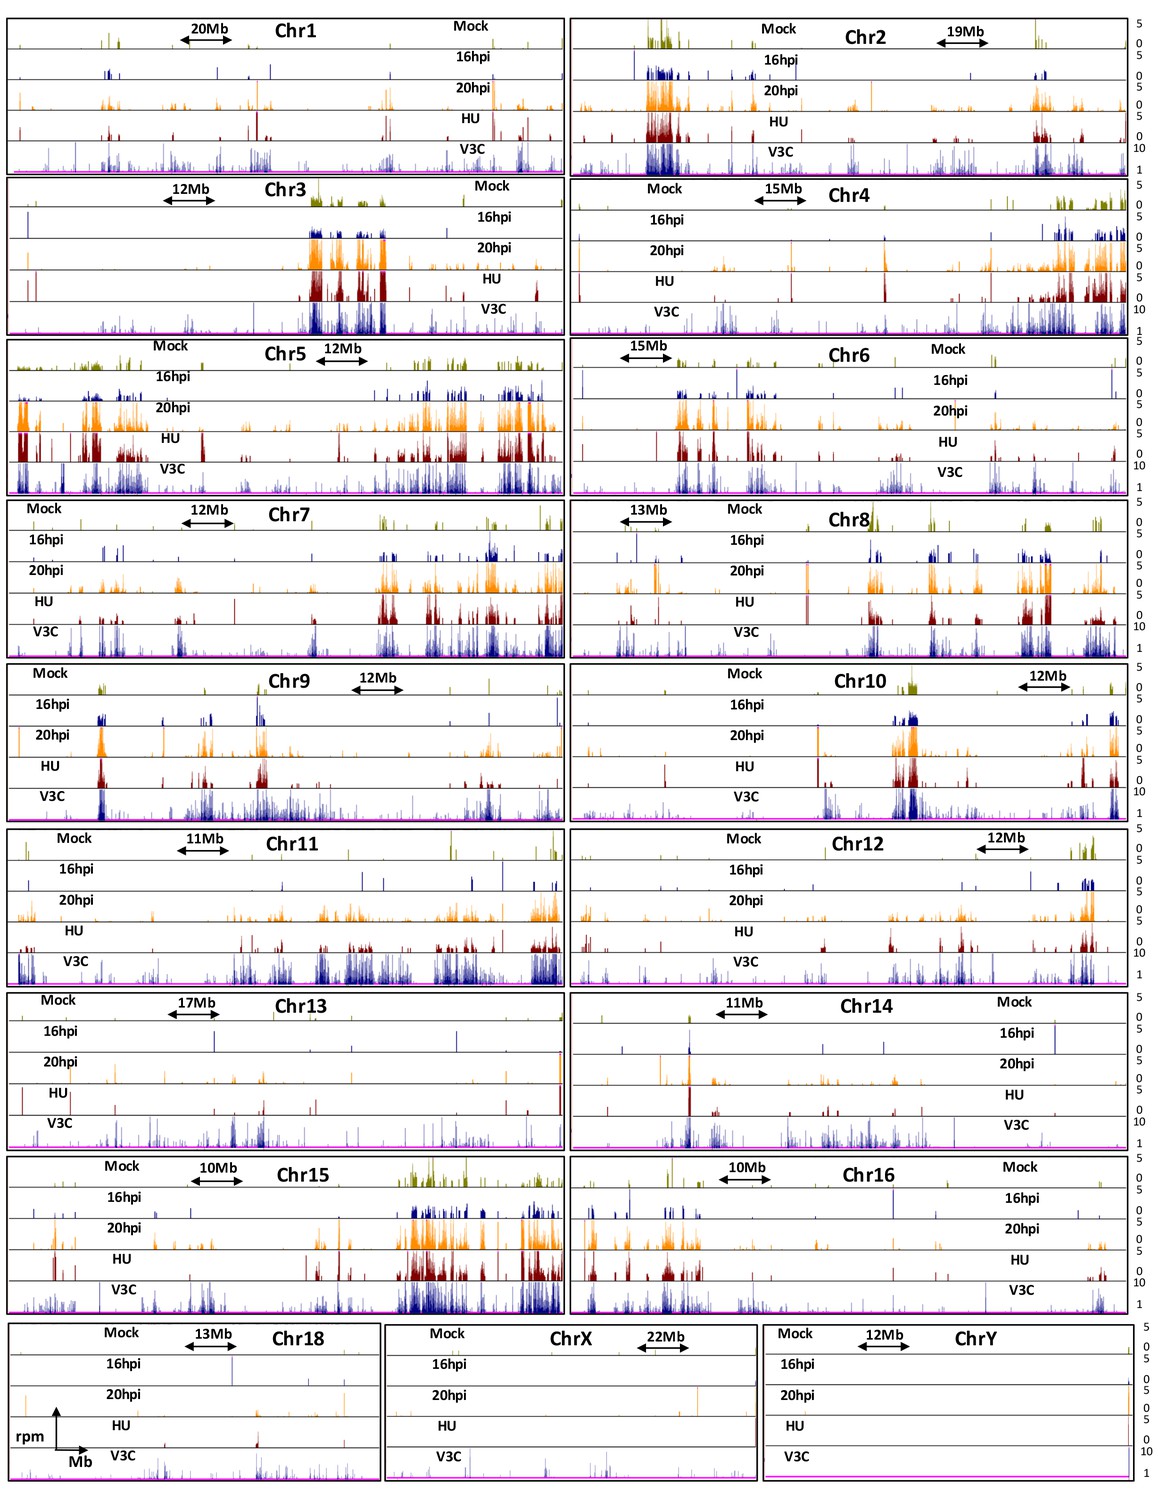
Genome browser snapshots of γ-H2AX occupancy over the entire mouse genome at different timepoints of MVM infection.
Occupancy in mock infected and HU treated cells is also shown. Chromosomes 17 and 19 are presented in Figure 3A. γ-H2AX binding at the different timepoints and treatments are compared with MVM interaction sites at 16 hpi assayed by V3C-seq.
Figure 3—figure supplement 2
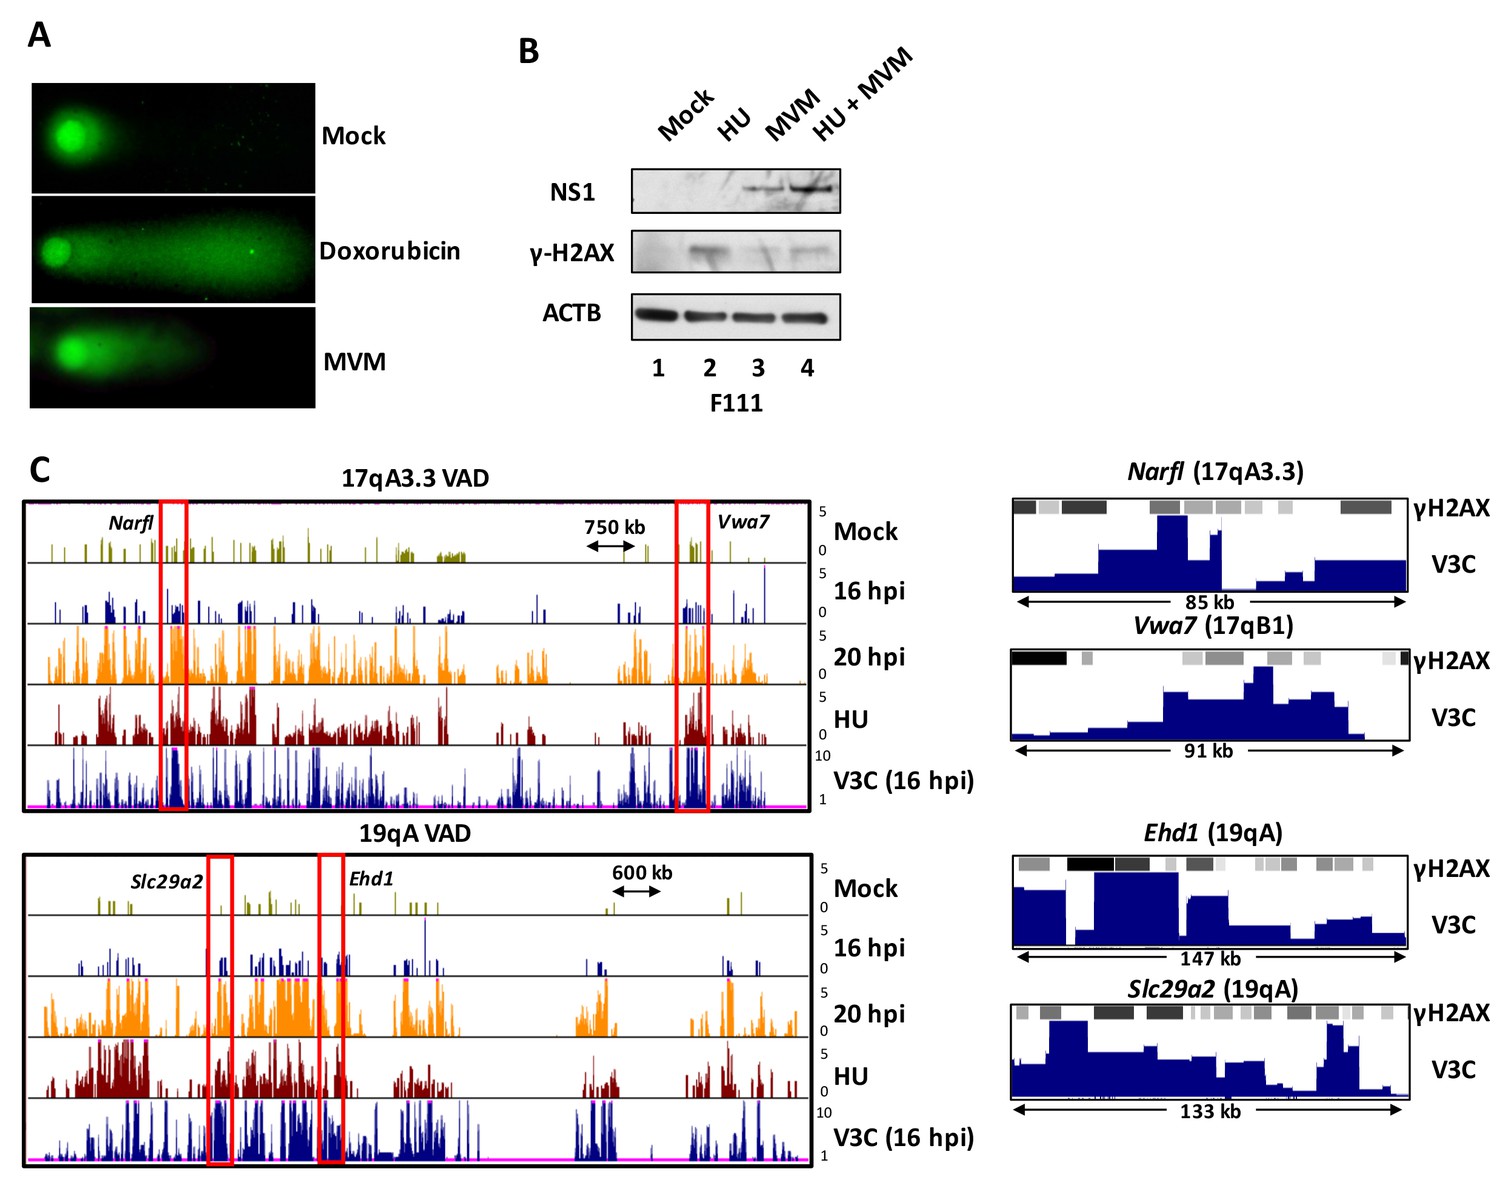
MVM DNA damage interactions.
(A) Alkaline comet assays were performed in uninfected, doxorubicin treated (200 nM) or MVM infected murine A9 cells for 24 hr, and DNA fragmentation was visualized using immunofluorescence microscopy. (B) Immunoblot analysis of MVM infection in rodent F-111 cells pulsed with (or without) 2 mM HU for 4 hr prior to infection with MVM at an MOI of 10 for 20 hr. Cells were harvested as described and analyzed for MVM replication via assaying NS1 levels and γ-H2AX in the nuclear lysates. Beta-Actin levels were used as loading control for the immunoblots. (C) (Left) UCSC genome browser screenshots of the VAD regions on chromosomes 17 (17qA3.3) and 19 (19qA) demarcated by red boxes in Figure 3A. (Right) Representative UCSC genome browser screenshots of the red boxes in the left panel of Figure 3—figure supplement 2C at Narfl, Vwa7, Ehd1 and Slc29a2 loci containing SICER-called ChIP-seq peaks for gamma-H2AX in HU treated A9 cells and MVM interaction sites mapped by V3C-seq at 16 hpi.
Figure 4 with 2 supplements
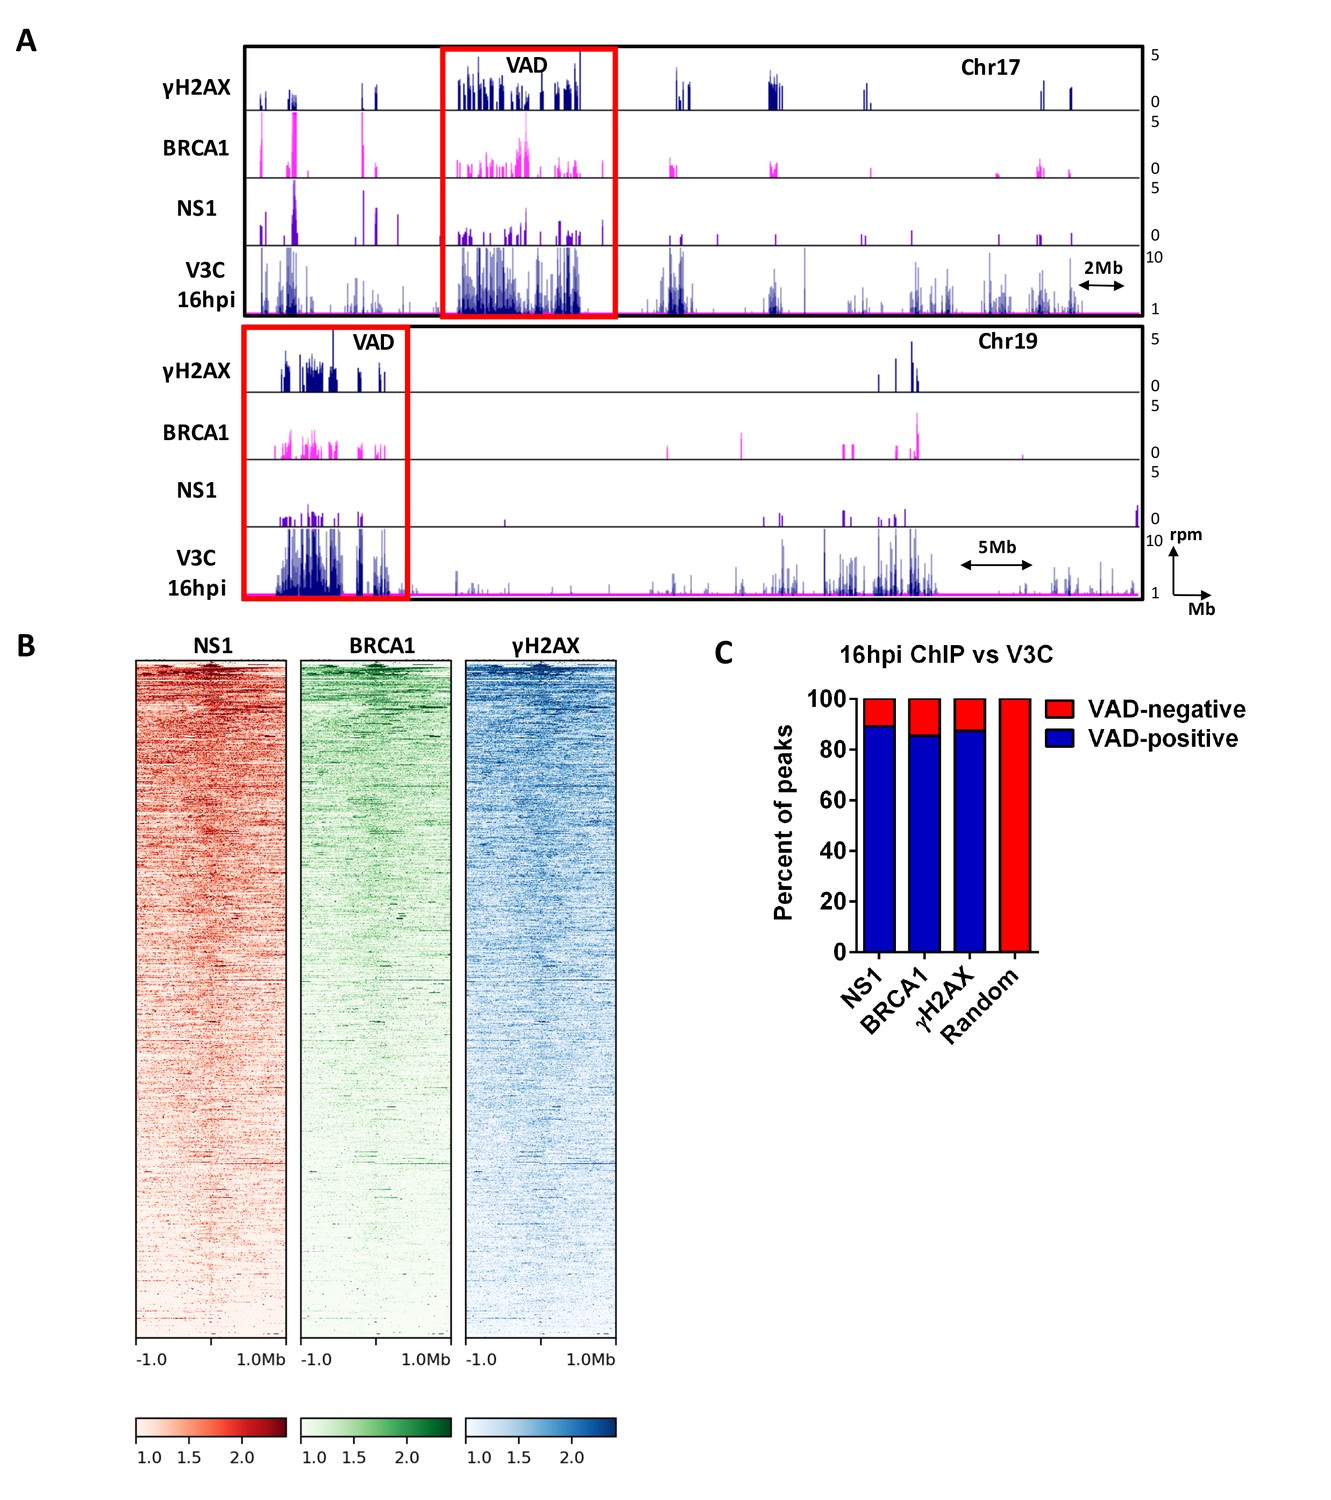
MVM NS1 colocalizes to sites of cellular DNA damage along with MVM genome.
(A) Representative quantile normalized ChIP-seq plots of MVM-NS1 (purple) and BRCA1 (pink) binding to the cellular genome on Chromosome 17 (top) and Chromosome 19 (bottom), with γ-H2AX and V3C at 16 hpi. Red rectangle denotes VAD sites, and y-axis values for ChIP-seq peaks have been restricted from 0 to 5 reads per million. (B) The enrichment of NS1 (left), BRCA1 (middle) and γ-H2AX (right) around MVM-associated regions were calculated and plotted as heatmaps using DeepTools on the Galaxy server (Ramírez et al., 2016). (C) The fraction of NS1 and DDR-positive genomic regions that colocalized with V3C at 16 hpi were calculated using BEDTools, and presented as VAD-positive sites. A library of randomly generated ChIP-seq peaks on the mouse genome with the same fragment size as the called peaks was used as control and also intersected with the MVM-VADs.
Figure 4—figure supplement 1
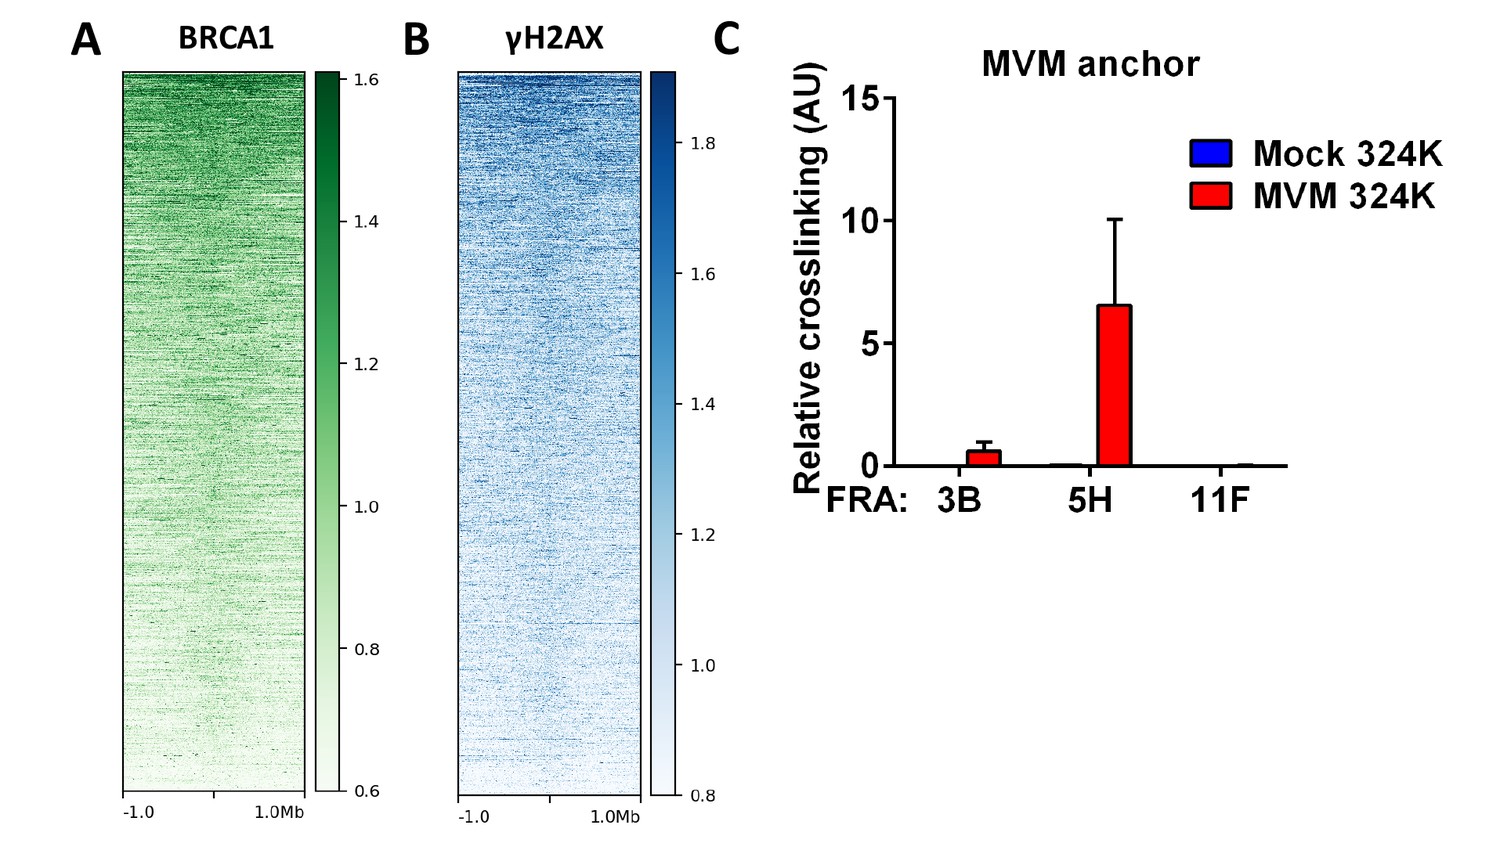
Called peaks from DDR ChIP-seq in HU-treated primary mouse splenocytes were compared with DDR ChIP-seq in MVM infected murine A9 fibroblasts at 16 hpi.
The comparisons are presented in the form of heatmaps for (A) BRCA1 binding (green) and (B) γ-H2AX modification (blue). (C) The spatial interaction of MVM with common fragile sites were assayed in parasynchronized human NB-324K cells infected with MVM for 16 hr. Focused 3C-qPCR was performed with Taqman probes on the MVM genome, and assayed for interaction with the prototypical human fragile site FRA3B, as well as two other sites FRA5H and FRA11F. Data is presented as mean ± SEM of three independent experiments.
Figure 4—figure supplement 2
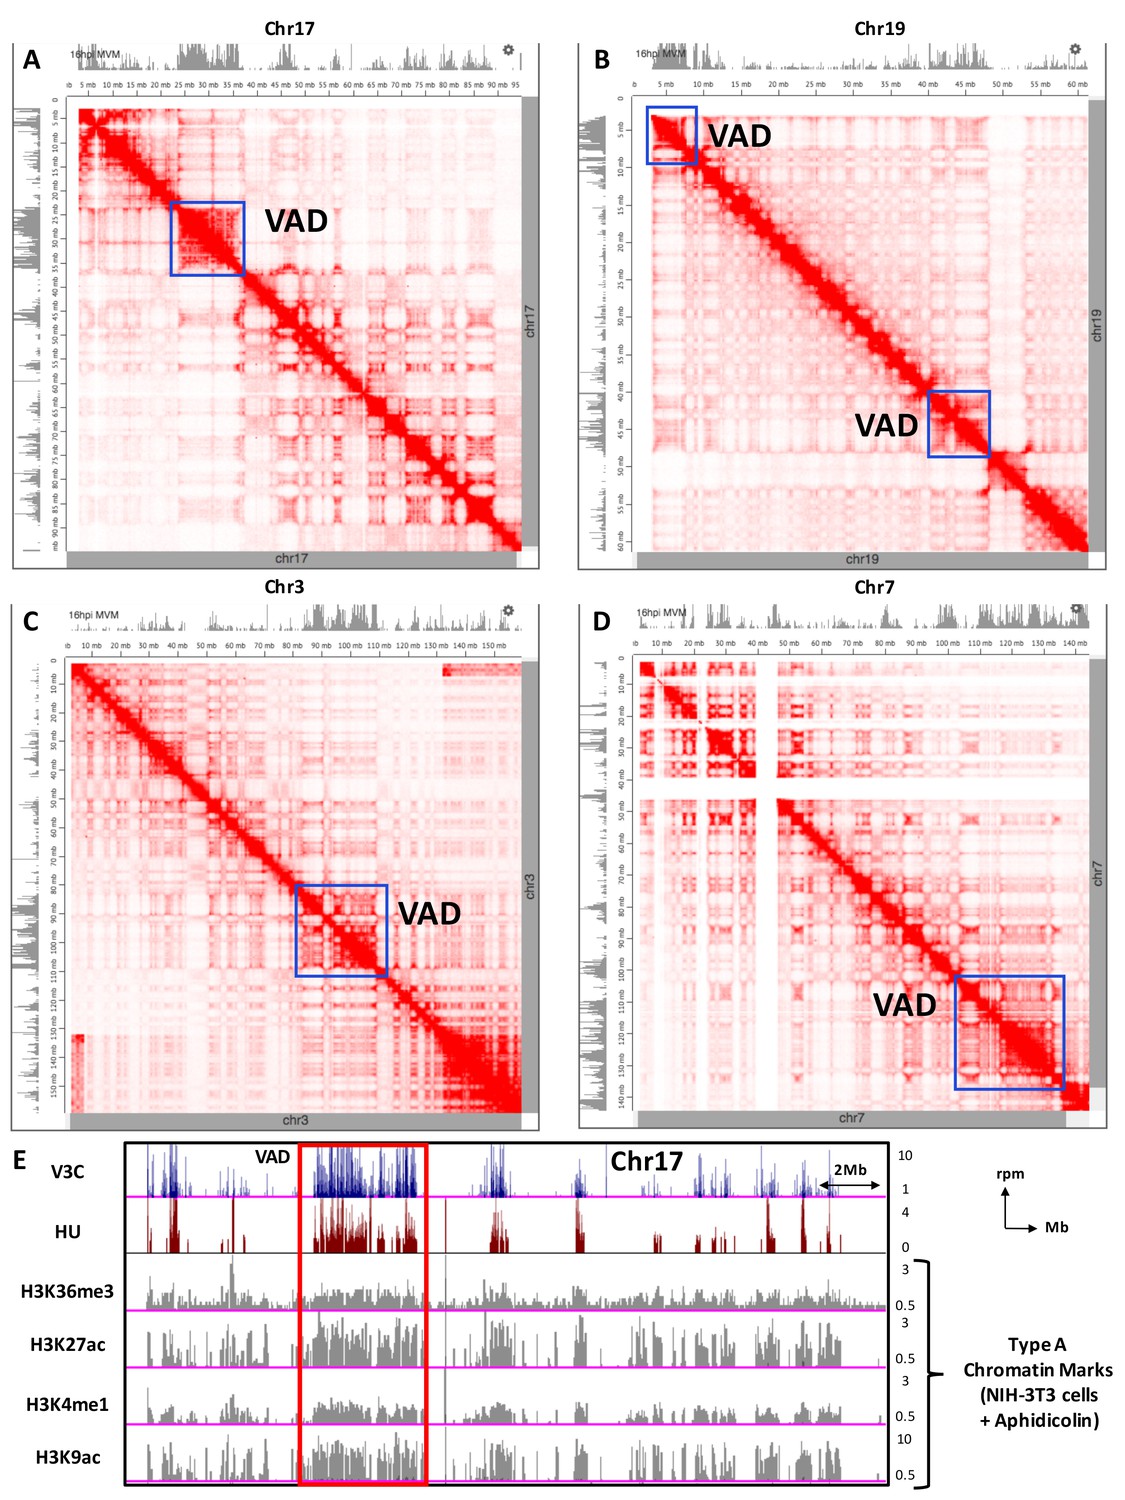
Comparisons of MVM-associated VAD sites with topological structure of the mouse nucleome.
Hi-C contact maps in murine CH12 cells were visualized in comparison with MVM-V3C in A9 cells at 16 hpi (grey tracks on top) using the Juicebox data visualization platform (presented as red heatmaps, [Durand et al., 2016; Rao et al., 2014]). Representative contact maps are shown for Chromosomes: (A) 17, (B) 19, (C) 3 and (D) 7. Blue squares indicate robust VAD regions that coincide with Hi-C contact domains. (E) MVM interaction sites on the mouse genome identified by V3Cseq at 16 hpi was also overlayed with published chromatin marks (Kraushaar et al., 2013) for Type A chromatin (Rao et al., 2014) including tri-methylated histone H3 at lysine 36 (H3K36me3), acetylated histone H3 at lysine 27 (H3K27ac), mono-methylated histone H3 at lysine 4 (H3K4me1) and acetylated histone H3 at lysine 9 (H3K9ac) in Aphidicolin-induced NIH-3T3 cells (Kraushaar et al., 2013). Reads-per- million (rpm) values of the ChIP-seq pulldowns are indicated to the right of each corresponding histogram track.
Figure 5

FISH assays confirmed that MVM localized with cellular sites of DNA damage.
(A) Schematic of Chromosomes 19 and 6 showing where MVM associates with the mouse genome in A9 cells at 16 hr post infection, depicting the sites where FISH probes were designed. Representative GSD-STORM images show the spatial localization of the MVM genome (red) with (B) chromosome 19 VAD (19qA, green), (C) chromosome 6 control site (6 pA, cyan), and (D) both probe sets. (B) The MVM probe is labelled in red, while the cellular VAD site at 19qA is labelled in green. The insets show magnified views of the MVM-VAD probe sets demarcated by red rectangles in the original image. (C) The MVM probe is labelled in red and cellular site associated with non-VAD at 6 pA (shown in 5A, bottom) is labelled in cyan. Red arrowheads indicate the location of the MVM probes, and the cyan arrowhead indicates the location of the 6 pA region of the cellular genome. (D) Relative locations of the MVM genome with cellular VAD-associated site at 19qA (green) and non-VAD site at 6 pA (cyan) in the same cell. The inset shows a magnified view of the MVM-VAD probe set, and cyan arrows indicate the non-VAD-associated probes. Nuclear borders are labelled in white dotted line. Scale is presented as a white line and measures 2 μm. (E) The absolute distance between MVM and cellular genome at sites identified as VADs (19qA and 15qE) versus VAD-negative sites (12qA3 and 17qA2) were calculated using 3D-FISH. Results are depicted as grey dots for each individual APAR body in multiple fields from least three independent infections of parasynchronized A9 cells at 16 hpi, with the median distance represented by a red line. Black error bars represent the interquartile range of the dataset. The median radius of an APAR body at 16 hpi is shown as a dashed horizontal line, and teal shading indicates the domain which would be occupied by the APAR body. Significant differences are denoted as ****p<0.0005 (one-way ANOVA, multiple comparisons). ns designates non-significant statistical differences between datasets.
Figure 6
MVM associates with artificially-engineered sites of DNA damage.
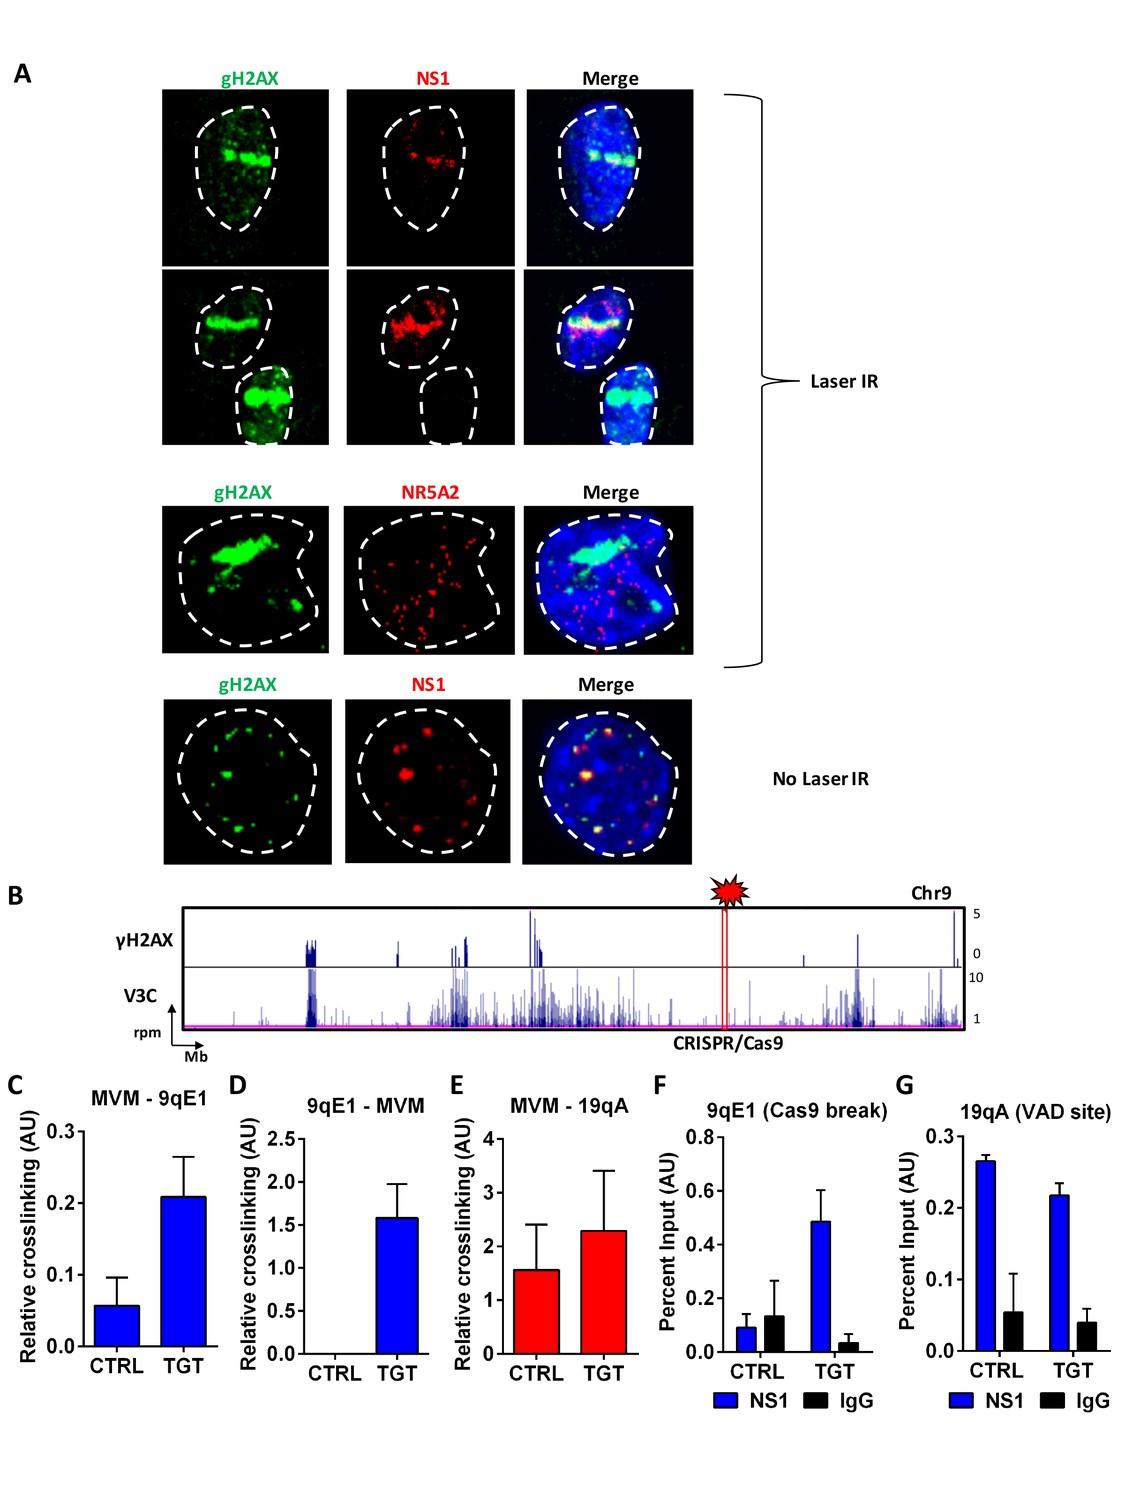
(A) Murine A9 fibroblasts were infected with MVM at an MOI of 10 for 18 hr. Cells were sensitized with Hoechst 33342 solution prior to irradiation in selected regions of interest with a 405 nanometer laser (top 3 panels), and were compared with un-irradiated cells (bottom panel). Cells were fixed and analyzed for the localization of DNA damaged sites (detected by green γ-H2AX staining), with that of MVM NS1 protein (red). The irrelevant transcription factor NR5A2 (red) was used as a negative control as this marker that does not colocalize with APAR bodies (see Figure 1). The nuclear periphery is demarcated with dotted white lines and DAPI staining. (B) Schematic of γ-H2AX binding to the cellular genome on chromosome 9 (top panel) compared with MVM-interaction sites (bottom panel) in parasynchronized murine A9 cells infected with MVM (MOI 5) for 16 hr. The site where guide RNAs were designed for DDR induction is shown as a red rectangle and labelled ‘CRISPR/Cas9’. Focused V3C-qPCR assays were performed in A9 cells constitutively expressing LentiCRISPRv2 which were transiently transfected with guide RNAs (nontargeting, labelled as ‘CTRL’ or specific to the 9qE1 site, labelled as ‘TGT’), and infected with MVM at an MOI for 5 for 16 hr. The spatial association of MVM with cellular sites were determined with Taqman probes on (C), the MVM genome, and reciprocal interaction with the Taqman probe on (D), the 9qE1 break site. (E) MVM association with Chr19 VAD at 19qA was tested by focused Taqman qPCR. NS1 occupancy at (F), the 9qE1 break site and (G), the 19qA VAD was assayed by ChIP-qPCR in cells transfected with non-targeting (CTRL) and specific (TGT) guide RNAs. Background levels were determined using IgG pulldowns. qPCR data are presented as mean ± SEM of three independent experiments.
Tables
Key resources table
| Reagent type (species) or resource | Designation | Source or reference | Identifiers | Additional information |
|---|---|---|---|---|
| Cell line (Mus musculus, Male) | A9 | ATCC, (Tattersall and Bratton, 1983) PMID: 6602222 | RRID:CVCL_3984 | Verified as mycoplasma- negative by PCR |
| Cell line (Mus musculus) | NIH-3T3 | ATCC | RRID:CVCL_0594 | Verified as mycoplasma- negative by PCR |
| Cell line (Homo sapiens) | NB-324K | (Tattersall and Bratton, 1983) PMID: 6602222 | RRID:CVCL_U409 | Verified as mycoplasma- negative by PCR |
| Cell line (Mus musculus) | EL4 | ATCC, (Tattersall and Bratton, 1983) PMID: 6602222 | RRID:CVCL_0255 | Verified as mycoplasma- negative by PCR |
| Cell line (Rattus norvegicus) | F111 | Fischer Rat Fibroblasts; (Freeman et al., 1975) | RRID:CVCL_6C52 | Verified as mycoplasma- negative by PCR |
| Antibody | NS1 | Salome and Pintel, unpublished | 2C9b | anti-mouse; Usage per sample: ChIP: 6 µg Immunofluorescence: 2 µg IB: 2 µg |
| Antibody | γ−Η2ΑX | EMD Millipore | EMD Millipore:05–636 | anti-mouse; Usage per sample: ChIP: 5 µg |
| Antibody | γ−Η2ΑX | Abcam:ab11174 | RRID:AB_297813 | anti-rabbit; Usage per sample: ChIP: 5 µg Immunofluorescence: 2 µg IB: 2 µg |
| Antibody | BRCA1 | Thermo Fisher Scientific:17F8 | RRID:AB_557804 | anti-mouse; Usage per sample: ChIP: 5 µg |
| Antibody | FANCD2 | Bethyl Laboratories: a302-174A | RRID:AB_1659803 | anti-rabbit; Usage per sample: Immunofluorescence: 2 µg |
| Antibody | NR5A2 | Abcam:ab189876 | RRID: AB_2732890 | anti-rabbit; Usage per sample: Immunofluorescence: 2 µg |
| Antibody | IgG | Cell Signaling | Cell Signaling:5415S | mouse; Usage per sample: ChIP: 5 µg |
| Antibody | AF 488 | Life Technologies: A11034 | RRID:AB_2576217 | anti-rabbit secondary; Usage per sample: Immunofluorescence: 1 µg |
| Antibody | AF 568 | Life Technologies: A11031 | RRID:AB_144696 | anti-mouse secondary; Usage per sample: Immunofluorescence: 1 µg |
| Antibody | AF 555 | Life Technologies: A27039 | RRID:AB_2536100 | anti-rabbit secondary; Usage per sample: Immunofluorescence: 1 µg |
| Antibody | AF 647 | Life Technologies: A32728 | RRID:AB_2633277 | anti-mouse secondary; Usage per sample: Immunofluorescence: 1 µg |
| Recombinant DNA reagent | Lenti-CRISPRv2 | Addgene; (Sanjana et al., 2014) PMID: 25075903 | Addgene plasmid 52961 | |
| Recombinant DNA reagent | pgRNA-humanized | Addgene; (Qi et al., 2013) PMID: 23452860 | Addgene plasmid 44248 | |
| Peptide, recombinant protein | HindIII | New England Biolabs | NEB:R0104 | |
| Peptide, recombinant protein | NlaIII | New England Biolabs | NEB:R0125 | |
| Peptide, recombinant protein | T4 DNA Ligase | New England Biolabs | NEB:M0202 | |
| Commercial assay or kit | FISH Tag DNA Multicolor Kit | Thermo Fisher Scientific | Thermo Fisher Scientific: F32951 | |
| Commercial assay or kit | QIAquick PCR purification kit | Qiagen | Qiagen:28106 | |
| Commercial assay or kit | NEBNext Ultra II Library Prep Kit for Illumina | New England Biolabs | NEB:E7645 | |
| Commercial assay or kit | Trevigen Comet Assay Kit | Trevigen | Trevigen: 4250–050 K | |
| Commercial assay or kit | StemCell | EasySep Human CD4+ T Cell Enrichment Kit | StemCell:19052 | |
| Chemical compound, drug | Hydroxyurea | Sigma Aldrich | Sigma Aldrich:H8627 | |
| Chemical compound, drug | Doxorubicin | Sigma Aldrich | Sigma Aldrich:D1515 | |
| Chemical compound, drug | Bovine Serum Albumin | Sigma Aldrich | Sigma Aldrich:A2153 | |
| Chemical compound, drug | ProLong Diamond Antifade Mountant with DAPI | Thermo Fisher Scientific | Thermo Fisher Scientific: P36966 | |
| Chemical compound, drug | Hoechst 33342 | Thermo Fisher Scientific | Thermo Fisher Scientific: 62249 | |
| Software, algorithm | Bowtie2 | (Langmead and Salzberg, 2012) PMID: 22388286 | http://bowtie-bio.sourceforge.net/bowtie2/index.shtml | |
| Software, algorithm | Samtools | (Li et al., 2009) PMID: 19505943 | RRID:SCR_006646 | http://samtools.sourceforge.net/ |
| Software, algorithm | Bedtools | (Quinlan and Hall, 2010) PMID: 20110278 | RRID:SCR_006646 | http://bedtools.readthedocs.io/en/latest/ |
| Software, algorithm | Deeptools | (Ramírez et al., 2016) PMID: 27079975 | RRID:SCR_016366 | https://deeptools.readthedocs.io/en/develop/ |
| Software, algorithm | UCSC Genome Browser | (Kent et al., 2002) PMID: 12045153 | RRID:SCR_005780 | https://genome.ucsc.edu/ |
| Software, algorithm | PreprocessCore | (Bolstad, 2013) | https://www.bioconductor.org/packages/release/bioc/html/preprocessCore.html | |
| Software, algorithm | Biostrings | (Pagès et al., 2017) | https://bioconductor.org/packages/release/bioc/html/Biostrings.html | |
| Software, algorithm | EPIC | (Xu et al., 2014) PMID: 24743992 | https://github.com/biocore-ntnu/epic | |
| Software, algorithm | Galaxy | (Afgan et al., 2016) PMID: 27137889 | RRID:SCR_006281 | https://usegalaxy.org/ |
| Software, algorithm | ImageJ | (Schneider et al., 2012) PMID: 22930834 | RRID:SCR_003070 | https://imagej.net/Welcome |
| Software, algorithm | Huygens Professional | Huygens professional version 17.10 (Scientific volume imaging, The Netherlands) | https://svi.nl/Huygens-Professional |
Table 1
Bioinformatic codes used.
https://doi.org/10.7554/eLife.37750.015| Program | Function | Code used |
|---|---|---|
| V3C-seq analysis | ||
| Bowtie2 | Alignment | bowtie2 --trim5 50 --very-sensitive -x/storage/htc/ biocompute/ircf/dbase/genomes/M_musculus/bowtie2/ index/mm10 -S 24hpi_1.sam 24hpi_1.fastq |
| Samtools | Sam to Bam | samtools view -b -S -o aligned_24hpi_1.bam 24hpi_1.sam |
| Sort | samtools sort -o aligned_sorted_24hpi_1.bam aligned_24hpi_1.bam | |
| BEDtools | Compute histogram | genomeCoverageBed -ibam aligned_sorted_24hpi_1.bam -bg - trackline -split -g. ..>24hpi_1.bedgraph |
| ChIP-seq analysis | ||
| Bowtie2 | Alignment | bowtie2 -x/storage/htc/biocompute/ircf/dbase/genomes/M_musculus/ bowtie2/index/mm10 -U 16hpi_gh2ax_1.fastq -S 16hpi_gh2ax_1.sam |
| Samtools | Sam to Bam | samtools view -b -S -o aligned_16hpi_gh2ax_1.bam 16hpi_gh2ax_1.sam |
| Sort | samtools sort -o aligned_sorted_16hpi_gh2ax_1. bam aligned_16hpi_gh2ax_1.bam | |
| BEDtools | Bam to BED conversion | bedtools bamtobed -i 16hpi_gh2ax_1.bam>16hpi_gh2ax_1.bed |
| EPIC | Peak Calling | epic -t 16hpi_gh2ax_1.bed -c 16hpi_ip.bed -gn mm10 -b BED -o epic_12hpi_gh2ax_1 |
| BEDtools | Intersection | bedtools intersect –a 16hpi_gh2ax_1.bed –b 16hpi_gh2ax_2. bed>16hpi_gh2ax_1_2.bed |
| Jaccard analysis | bedtools jaccard -a mock_gh2ax.bed -b 16hpi_gh2ax.bed | |
Table 2
Antibody table.
https://doi.org/10.7554/eLife.37750.016| Antibody | Concentration used |
|---|---|
| NS1 (see Key Resources Table) | ChIP: 6 μg Immunofluorescence: 2 μg IB: 2 μg |
| γ-H2AX (anti-mouse); EMD Millipore | ChIP: 5 μg |
| γ-H2AX (anti-rabbit); Abcam | ChIP: 5 μg Immunofluorescence: 2 μg IB: 2 μg |
| BRCA1 (anti-mouse); Thermo Fisher Scientific | ChIP: 5 μg |
| FANCD2 (anti-rabbit); Bethyl Laboratories | Immunofluorescence: 2 μg |
| NR5A2 (anti-rabbit); Abcam | Immunofluorescence: 2 μg |
| IgG (mouse); Cell Signaling | ChIP: 5 μg |
| AF 488; anti-rabbit secondary, Life Technologies | Immunofluorescence: 1 μg |
| AF 568; anti-mouse secondary, Life Technologies | Immunofluorescence: 1 μg |
| AF 555; anti-rabbit secondary, Life Technologies | Immunofluorescence: 1 μg |
| AF 647; anti-mouse secondary, Life Technologies | Immunofluorescence: 1 μg |
Additional files
-
Supplementary file 1
contains a table with the sequences of PCR primers and Taqman probes used in this study.
- https://doi.org/10.7554/eLife.37750.017
-
Transparent reporting form
- https://doi.org/10.7554/eLife.37750.018
Download links
A two-part list of links to download the article, or parts of the article, in various formats.
Downloads (link to download the article as PDF)
Open citations (links to open the citations from this article in various online reference manager services)
Cite this article (links to download the citations from this article in formats compatible with various reference manager tools)
Parvovirus minute virus of mice interacts with sites of cellular DNA damage to establish and amplify its lytic infection
eLife 7:e37750.
https://doi.org/10.7554/eLife.37750


