Crystal structure of the full Swi2/Snf2 remodeler Mot1 in the resting state
- Ludwig-Maximilians-Universität München, Germany
- University of Virginia Health System, United States
- Center for Integrated Protein Sciences Munich, Germany
Figures
Figure 1 with 1 supplement
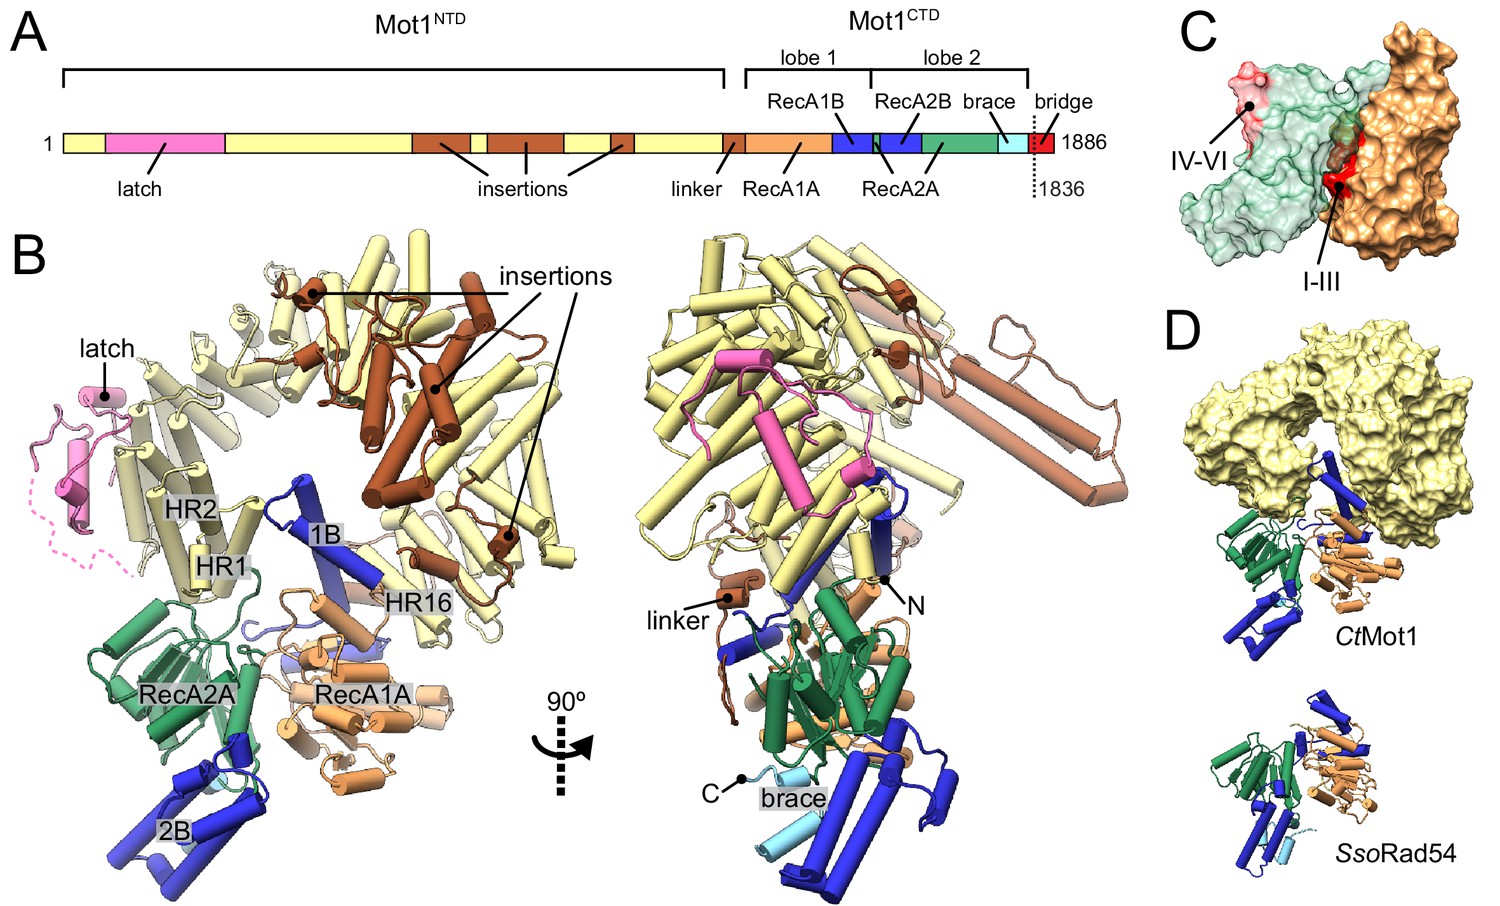
Structure of the Chaetomium thermophilum Mot1.
(A) Domain organization of CtMot1. The HEAT repeats are in yellow. The latch is in pink, other insertions of CtMot1NTD and the linker are in brown. RecA-like subdomains of CtMot1CTD are in orange (1A) and green (2A). Swi2/Snf2-specific insertions 1B and 2B are in dark blue. Brace and bridge elements are in light blue and red, respectively. The boundary of the crystallization construct (residue 1836) is marked with the dotted line. (B) Cartoon representation of the structure. N- and C-termini are labelled N and C, respectively. HEAT repeats 1, 2, and 16 are labelled HR1, HR2, and HR16, respectively. Missing residues of the latch are represented by the dotted line. (C) Surface representation of CtMot1CTD lobe 1 (orange) and 2 (green). Regions where helicase motifs are located on each lobe are colored in red. (D) Side-by-side comparison of CtMot1CTD (top panel) and SsoRad54 (Dürr et al., 2005) (bottom panel). CtMot1NTD is represented as yellow surface. If not stated otherwise, all panels have color coding as in A.
Figure 1—figure supplement 1
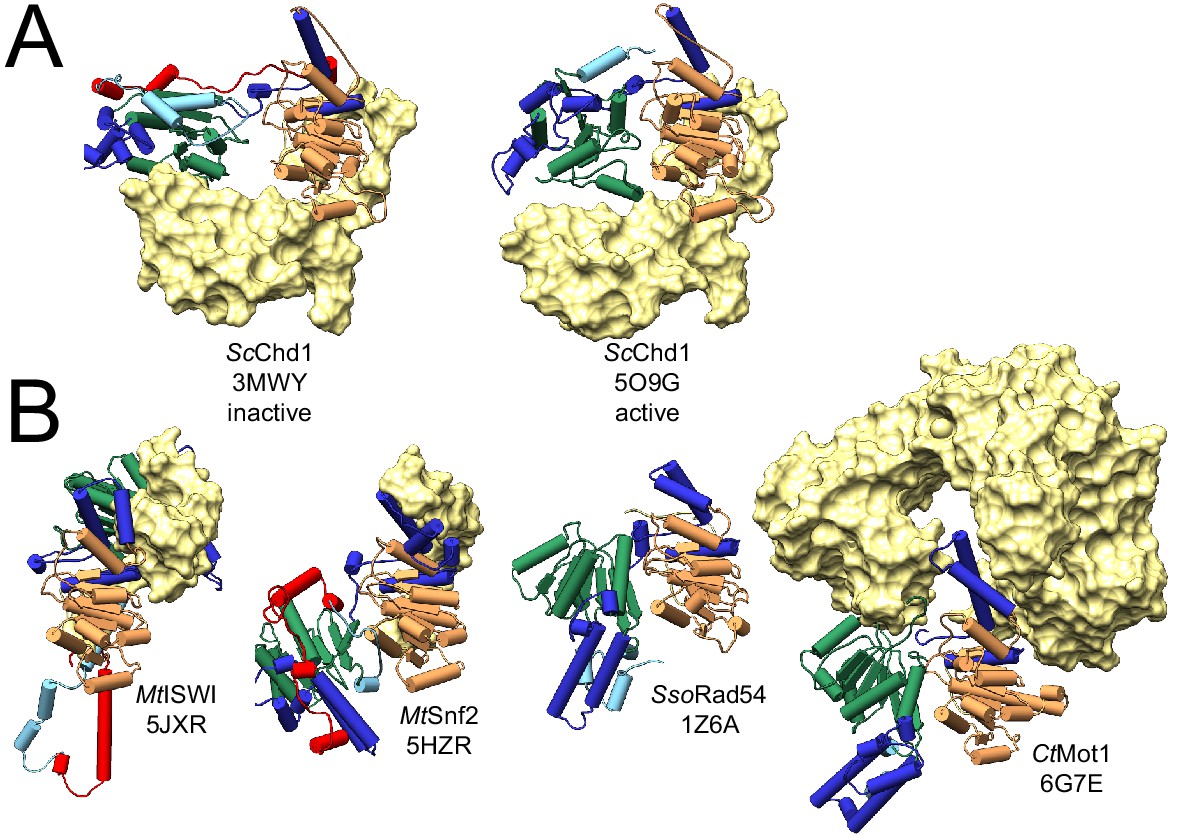
Auto-inhibited conformations of Swi2/Snf2 domains.
(A) Comparison of inactive and active states of Saccharomyces cerevisiae Chd1. Left: in its nucleosome ligand-free state (PDB 3MWY, Hauk et al., 2010) the two ATPase lobes of ScChd1 are misaligned and separated due to the binding of the chromodomain (yellow surface). Right: upon the activation by binding of chromodomains to a nucleosomal substrate (here omitted), the block on lobe 2 is released, enabling proper alignment of both lobes for ATP hydrolysis (PDB 5O9G, Farnung et al., 2017). (B) Other Swi2/Snf2 domain structures representing auto-inhibited conformations: Myceliophthora thermophila ISWI (PDB 5JXR, Yan et al., 2016), Myceliophthora thermophila Snf2 (PDB 5HZR, Xia et al., 2016), Sulpholobus solfataricus Rad54 (PDB 1Z6A, Dürr et al., 2005), and Chaetomium thermophilum Mot1 (PDB 6G7E, this study). All panels show the same view with respect to lobe 1, thereby highlighting distinct positions of lobe 2 in all structures. In all panels, lobe 1 and 2 are represented as cartoons color-coded as in Figure 1. Auxiliary domains adjacent to the ATPase domain are shown as yellow surfaces.
Figure 2 with 1 supplement
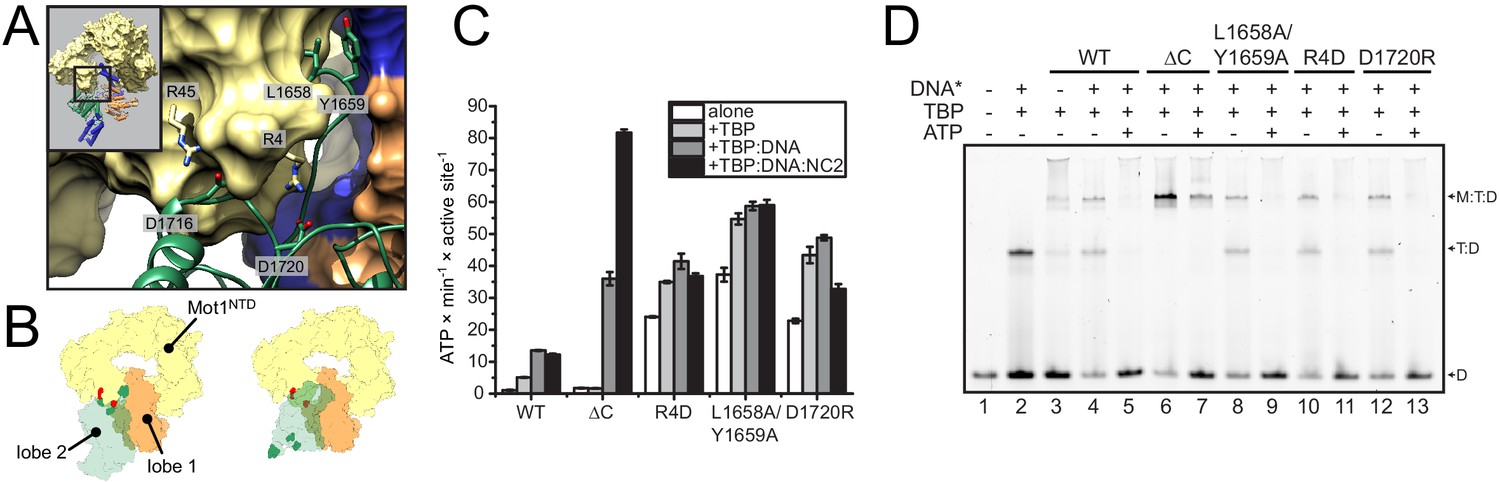
Analysis of CtMot1 mutants.
(A) View at the interface between RecA2A (green cartoon), HR1/2 (yellow surface), and lobe 1 (orange/blue surface). Residues analyzed in this study are shown as sticks and labelled accordingly. (B) Cartoon model showing the positions of mutations in the Mot1NTD (red spheres on yellow surface) and in lobe 2 (green spheres on green surface). Left: orientation as in the CtMot1 crystal structure. Right: CtMot1 with ATPase modeled as in the S. cerevisiae Chd1:nucleosome complex, that is the ATP hydrolysis-competent conformation (Farnung et al., 2017). (C) ATPase activity of the mutants. Error bars represent standard deviations from three technical replicates. CtMot1WT is labelled as WT, CtMot1ΔC as ΔC. (D) Electrophoretic mobility shift assay showing ATP-dependent dissociation of Mot1:TBP:DNA and TBP:DNA complexes. All CtMot1 constructs form ternary complexes with labelled DNA and TBP (M:T:D). In the presence of ATP and unlabeled competitor DNA (DNA*), wild-type CtMot1 (WT), L1658/Y1659, R4D, and D1720R mutants fully disrupt M:T:D and T:D complexes (lanes 5, 9, 11, and 13, respectively), whereas CtMot1ΔC (ΔC) is less efficient (lane 7).
-
Figure 2—source data 1
Raw data from the ATPase activity assay used for Figure 2C and Figure 2—figure supplement 1A.
- https://doi.org/10.7554/eLife.37774.007
-
Figure 2—source data 2
Raw data from quantification of electrophoretic mobility shift assay used for Figure 2—figure supplement 1B.
- https://doi.org/10.7554/eLife.37774.008
Figure 2—figure supplement 1
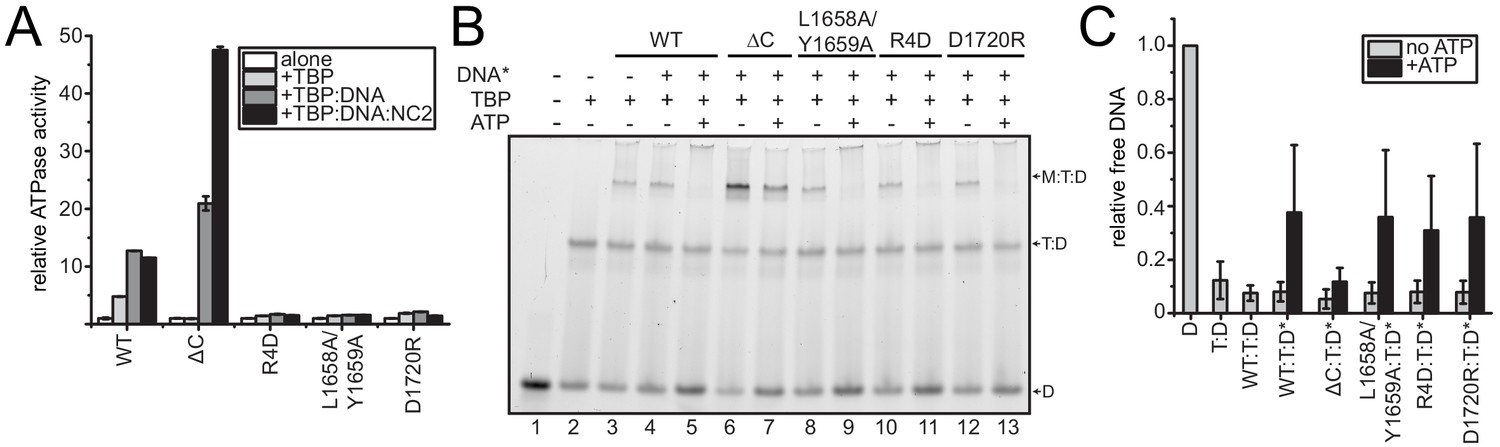
Analysis of CtMot1 mutants.
(A) ATPase activity of the CtMot1 mutants. This panel represents the same data as shown in Figure 2C but normalized against the basal activity of each CtMot1 variant. (B) Dissociation of Mot1:TBP:DNA and TBP:DNA complexes in an electrophoretic mobility shift assay. The assay was performed analogously to the one shown in Figure 2D, but more TBP was added and ATP incubation was shorter (see Materials and Methods). These experimental conditions were chosen so that the reaction does not reach the endpoint to see the differences in dissociation catalyzed by WT versus L1658A/Y1659A, R4D, or D1720R. (C) Quantitation of electrophoretic mobility shift assays as shown in panel B. The bars represent the ratio between the intensity of free DNA and complex bands (Mot1:TBP:DNA and TBP:DNA) in each lane. The reaction without proteins (D) was normalized to 1. T:D - TBP:DNA, WT:T:D-Mot1WT:TBP:DNA, ΔC:T:D–Mot1ΔC:TBP:DNA, L1658A/Y1659A:T:D-Mot1L1658A/Y1659A:TBP:DNA, R4D:T:D-Mot1R4D:TBP:DNA, D1720R:T:D-Mot1D1720R:TBP:DNA. * - reactions performed in the presence of unlabeled competitor DNA. Quantitation was done using ImageJ. Data represent mean values ± standard deviation (n = 6).
Figure 3
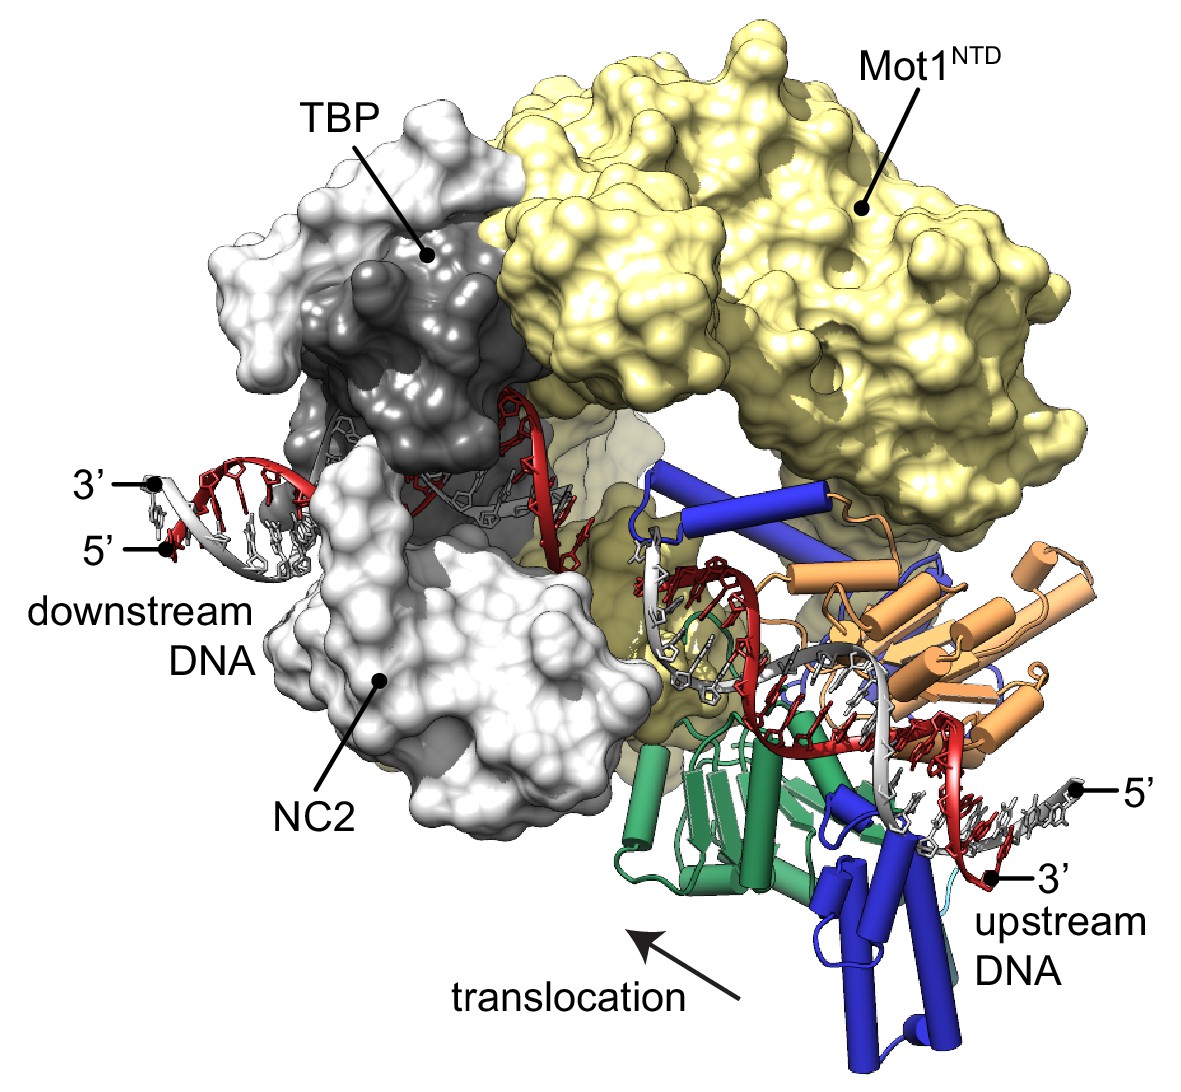
Model of the Mot1:TBP:NC2:DNA complex.
CtMot1ΔC was superimposed onto EcMot1NTD:TBP:NC2:DNA via the HEAT repeats (yellow surface). The path of the upstream DNA was determined by superimposing SsoRad54:DNA onto CtMot1ΔC via lobe 1. The TATA box strand from EcMot1NTD:TBP:NC2:DNA as well as the corresponding strand from SsoRad54:DNA are marked in gray. The non-TATA box strands are in red. Substrate proteins TBP and NC2 are represented as dark and light gray surfaces, respectively. The black arrow represents the direction in which Swi2/Snf2 domain is proposed to translocate along the DNA scaffold. CtMot1CTD is color-coded as in Figure 1.
Tables
Table 1
Data collection and refinement statistics for the CtMot1 structure.
https://doi.org/10.7554/eLife.37774.004| Data collection | |
|---|---|
| Space group | P21 |
| Unit cell | |
| a, b, c (Å) | 93.2, 96.9, 129.7 |
| α, β, γ (°) | 90.0, 97.6, 90.0 |
| Resolution (Å) | 48.7 (3.3–3.2)* |
| Total reflections | 239071 (10913) |
| Unique reflections | 36422 (1888) |
| Rmeas [%] | 14.4 (88.7) |
| I/σI | 11.8 (2.6) |
| CC1/2 | 0.99 (0.79) |
| Completeness (%) | 97.1 (68.8) |
| Redundancy | 6.6 (5.8) |
| Refinement | |
| Resolution (Å) | 48.7 (3.3–3.2) |
| No. reflections | 36410 (2930) |
| Rwork | 0.19 (0.42) |
| Rfree | 0.24 (0.42) |
| No. atoms | 12390 |
| Protein | 12390 |
| Ligand/ion | 0 |
| Water | 0 |
| B factors (Å2) | |
| Protein | 75 |
| Ligand/ion | |
| Water | |
| R.M.S deviations | |
| Bond lengths (Å) | 0.002 |
| Bond angles (°) | 0.463 |
| Ramachandran plot | |
| Favored [%] | 97 |
| Allowed [%] | 3 |
| Outliers [%] | 0 |
-
* Values in parentheses are for highest-resolution shell.
Key resources table
| Reagent type (species) or resource | Designation | Source or reference | Identifiers | Additional information |
|---|---|---|---|---|
| Gene (Chaetomium thermophilum) | CtMot1 | this paper | UniProtKB: G0S6C0_CHATD | gene cloned from a cDNA library |
| Cell line (Escherichia coli) | Rosetta(DE3) | Novagen | Merck: 70954 | |
| Cell line (Escherichia coli) | B843(DE3) | Novagen | Merck: 69041 | |
| Recombinant DNA reagent | pETDuet-1 | Novagen | Merck: 71146 | used to express full-length CtMot1 (1–1886) and its point mutants |
| Recombinant DNA reagent | pET21b | Novagen | Merck: 69741 | used to express CtMot1 (1–1836) and CtMot1(1–1836, E1434Q) |
| Chemical compound, drug | L(+)-Selenomethionine | Acros Organics | Acros Organics: 259960010 | 42 mg/mL final concentration |
| Chemical compound, drug | SelenoMethionine Medium Base plus Nutrient Mix | Molecular Dimensions | Molecular Dimensions: MD12-501 | |
| Chemical compound, drug | Adenosine 5′- triphosphate disodium salt hydrate (ATP) | Sigma-Aldrich | Sigma: A2383-10G | |
| Chemical compound, drug | β-Nicotinamide adenine dinucleotide reduced disodium salt hydrate (NADH) | Sigma-Aldrich | Sigma: 10107735001 | |
| Chemical compound, drug | Phospho(enol)pyruvic acid monopotassium salt (PEP) | PanReac AppliChem | AppliChem: A2271 | |
| Chemical compound, drug | Pyruvate kinase/lactic dehydrogenase enzymes from rabbit muscle | Sigma-Aldrich | Sigma: P0294 | |
| Software, algorithm | XDS | Kabsch, 2010, doi: 10.1107/S0907444909047374 | ||
| Software, algorithm | PHENIX | Adams et al., 2010, doi:10.1107/S0907444909052925 | ||
| Software, algorithm | Coot | Emsley et al., 2010, doi: 10.1107/S0907444910007493 | ||
| Software, algorithm | UCSF Chimera | Pettersen et al., 2004, doi: 10.1002/jcc.20084 | http://www.rbvi.ucsf.edu/chimera/ | |
| Software, algorithm | ImageJ 1.51 k | Schneider et al., 2012, doi: 10.1038/nmeth.2089 | quantification of electrophoretic shift assay | |
| Software, algorithm | OriginPro 2015 | OriginLab, Northampton, MA | ||
| Sequence- based reagent | 48 bp dsDNA | Biomers | 5′–CAGTACGGCCGGGCGCCCGGCATGGCGGCCTATAAAAGGGGGTGGAAT–3' | |
| Sequence- based reagent | 48 bp 6-FAM labelled dsDNA | Biomers | 5′–CAGTACGGCCGGGCGCCCGGCATGGCGGCCTATAAAAGGGGGTGGAAT–3' | |
| Sequence- based reagent | 36 bp dsDNA | Biomers | 5′–CGGCCGGGCGCCCGGCATGGCGGCCTATAAAAGGGC–3' |
Additional files
-
Transparent reporting form
- https://doi.org/10.7554/eLife.37774.010
Download links
A two-part list of links to download the article, or parts of the article, in various formats.
Downloads (link to download the article as PDF)
Open citations (links to open the citations from this article in various online reference manager services)
Cite this article (links to download the citations from this article in formats compatible with various reference manager tools)
Crystal structure of the full Swi2/Snf2 remodeler Mot1 in the resting state
eLife 7:e37774.
https://doi.org/10.7554/eLife.37774


