Antibiotic-induced acceleration of type 1 diabetes alters maturation of innate intestinal immunity
- New York University Langone Medical Center, United States
- University of Wisconsin School of Medicine and Public Health, United States
- New York University, United States
- University of North Carolina at Chapel Hill School of Public Health, United States
- University of Minnesota, United States
- Janssen Pharmaceutical Companies of Johnson and Johnson, United Kingdom
- Tufts University, United States
- New York Uniersity Langone Medical Center, United States
Figures
Figure 1 with 1 supplement
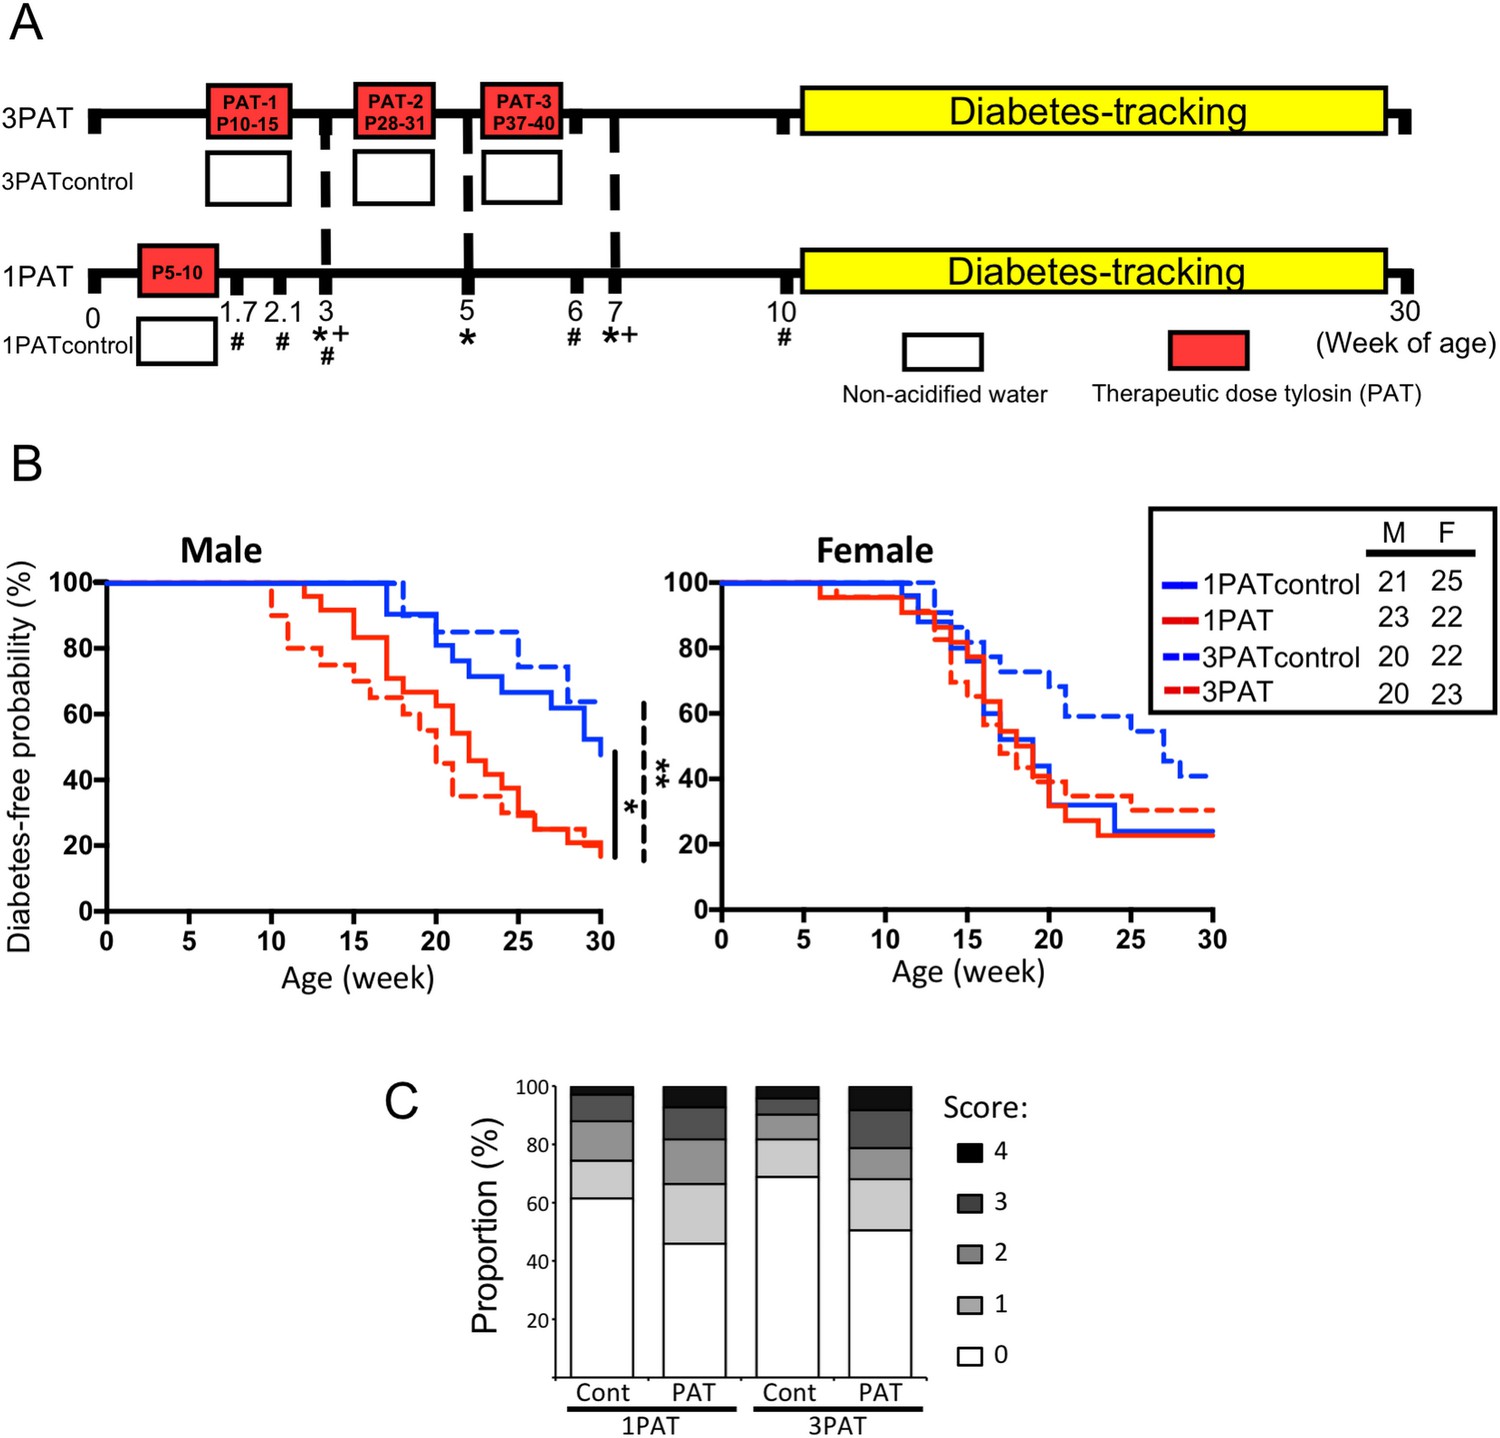
Effect of 1PAT/3PAT on T1D development.
(A) Design of NOD 1PAT and 3PAT experiments. Pregnant NOD/ShiLtJ mice were randomized into four groups: 3PAT, 1PAT, and their controls (3PAT control, 1PAT control) as described in the Materials and methods section. From 11–30 weeks of age, mice were tested weekly for T1D by blood glucose measurement. *Weeks at which fecal samples microbiome were analyzed by16S rRNA sequencing; and + metagenomic sequencing. #Timepoint at which a subset of mice were sacrificed for collection of ileal and cecal tissues and content. Microbiome was analyzed by 16S rRNA sequencing and metagenomics, and tissues for gene expression, metabolomics, and flow cytometric analysis. (B) Kaplan-Meier analysis of T1D incidence in male and female NOD mice. Statistical significance was determined by the log-rank test. *p=0.019; **p=0.002. (C) Insulitis in male NOD mice at P70. Upon necropsy, the pancreas was preserved and stained, as described in Materials and methods, and insulitis determined with scores 0–4 indicating progressive infiltration (Livanos et al., 2016). The extent of pancreatic islet inflammation (scores 1–4) in PAT is higher than in controls at P70 in both the 1PAT and 3PAT experiments, but differences by mouse (n = 6/group) were not significant. Score differences were significant across the 235 individual 1PAT, and 229 control islets, (p=0.0016, Chi square), and across 201 individual 3PAT and 210 control islets (p=0.0034). [See also Figure 1—figure supplement 1].
-
Figure 1—source data 1
Time points of T1D development and scores of pancreatic islets.
- https://doi.org/10.7554/eLife.37816.005
Figure 1—figure supplement 1

Effect of 1PAT on NOD mouse body weight.
(A) Body weight of male and female NOD mice as individual points (horizontal line represents mean ± SD) at weeks 3–10, with statistical significance determined by t test, *p<0.05. (B) Body weight across weeks 3–30 is shown continuously. There were no significant differences based on antibiotic exposure.
Figure 2 with 11 supplements
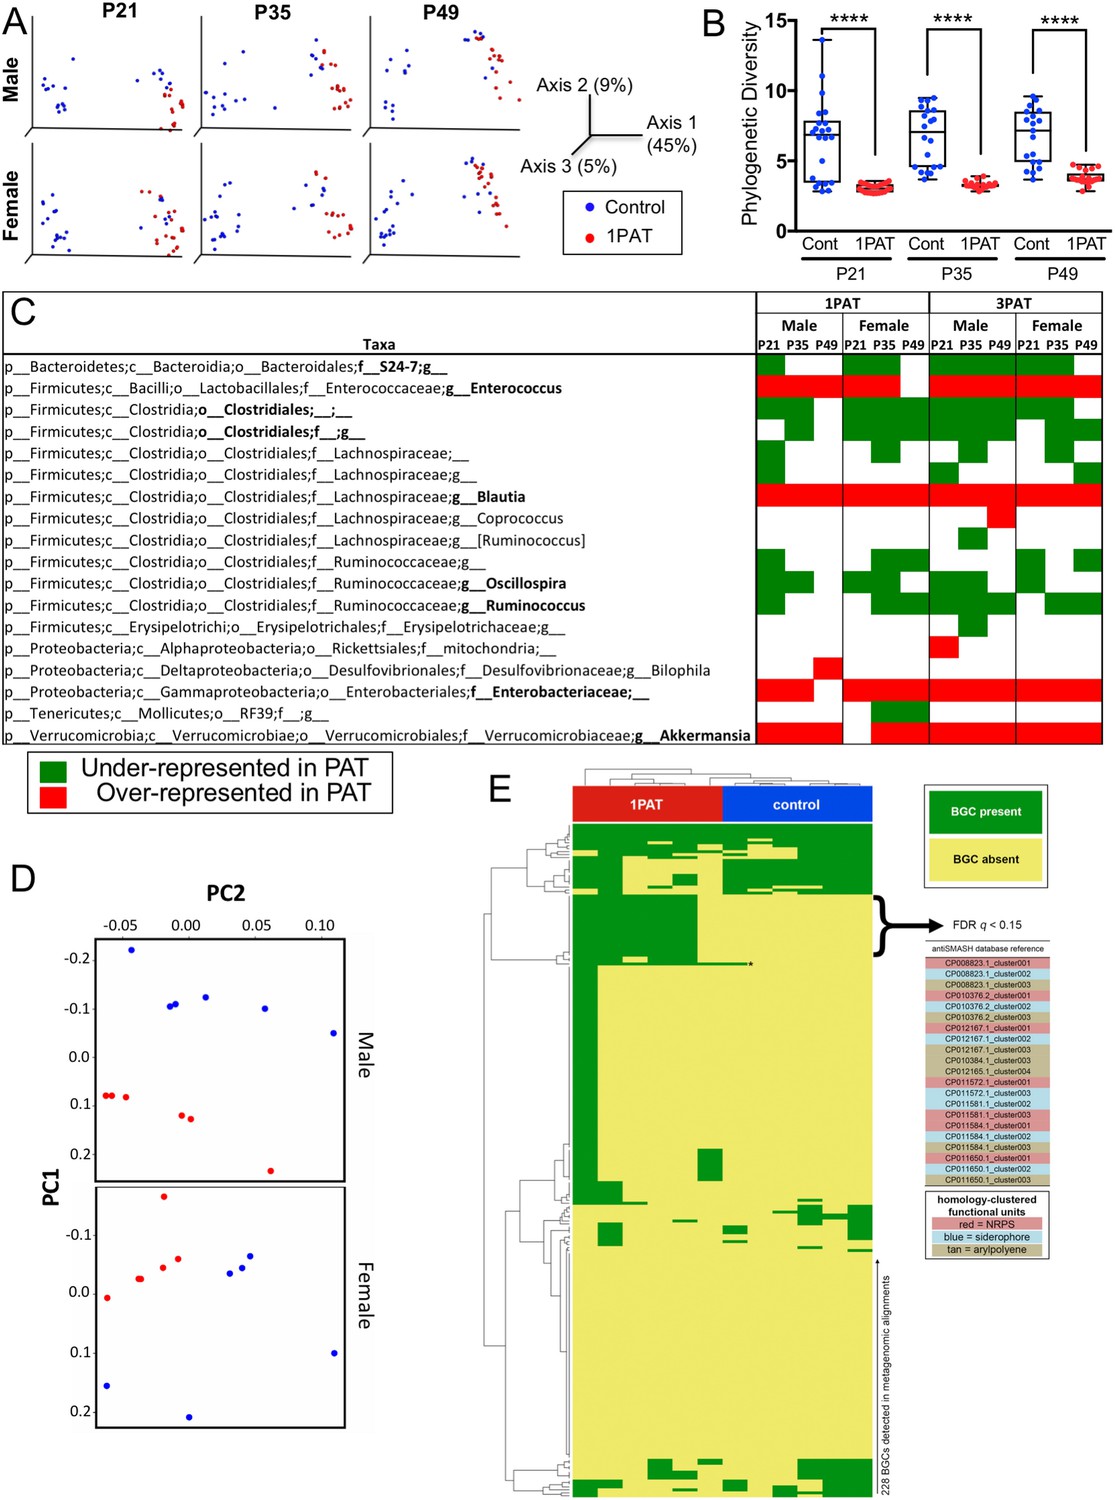
Early-life fecal microbiota in PAT and control NOD mice.
(A) β-diversity, as determined by unweighted UniFrac analysis of control and1PAT fecal microbiota over time, analyzed by QIIME2. Inter- and intra-group UniFrac distances were all significant (p<0.0001), determined by one-way-ANOVA with Tukey correction for multiple comparisons. (B) α-diversity (Phylogenic diversity (PD)) of fecal microbiota in control and 1PAT males. Statistical significance determined by one-way-ANOVA test. ****p<0.0001. (C) Early-life taxa significantly under- or over-represented in 1PAT and 3PAT mice compared to controls, by ANCOM in QIIME2. Fecal specimens were obtained at P21, P35, and P49 from male and female mice, exposed or not to 1PAT or 3PAT (n = 20–25 mice per group). (D) Metagenomic (MetaCyc) pathway distribution in male and female mice at P21, visualized by principal component analysis (PCA; blue, control; red, 1PAT, n = 6 samples per group). (E) Comparison of BGC content in male 1PAT and control metagenomic P21 samples. Presence (blue) or absence (gold) heat map of the 228 detected BGCs in male 1PAT (green) vs. control (purple) mice, generated by using an accelerated optimal gapped alignment algorithm against a BGC database (Al-Ghalith and Knights, 2017; Blin et al., 2017; Needleman and Wunsch, 1970). For visualization and dendrograms, axes are clustered by average linkage. For each of the 228 BGCs shown, a Fisher’s exact test was performed on a contingency table of 1PAT/control vs. BGC presence/absence. Filtering to an FDR q < 0.15 yielded 22 uncharacterized BGCs enriched in 1PAT vs. control mice, and an Enterococcus polysaccharide pathway, indicated by ‘*'. Similarity-based clustering using custom Python and C code collapses the 22 uncharacterized BGCs to three functional groups (indicated in table by color) annotated to the family Enterobacteriaceae, encoding putative aryl polyene, NRPS (nonribosomal peptide synthetase), and siderophore pathways. [See also Figure 2—figure supplements 1–11, and Supplementary file 1].
-
Figure 2—source data 1
Values of alpha diversities and beta diversities.
- https://doi.org/10.7554/eLife.37816.018
Figure 2—figure supplement 1
Fecal and cecal microbiota characteristics of 1PAT and control male and female NOD mice.
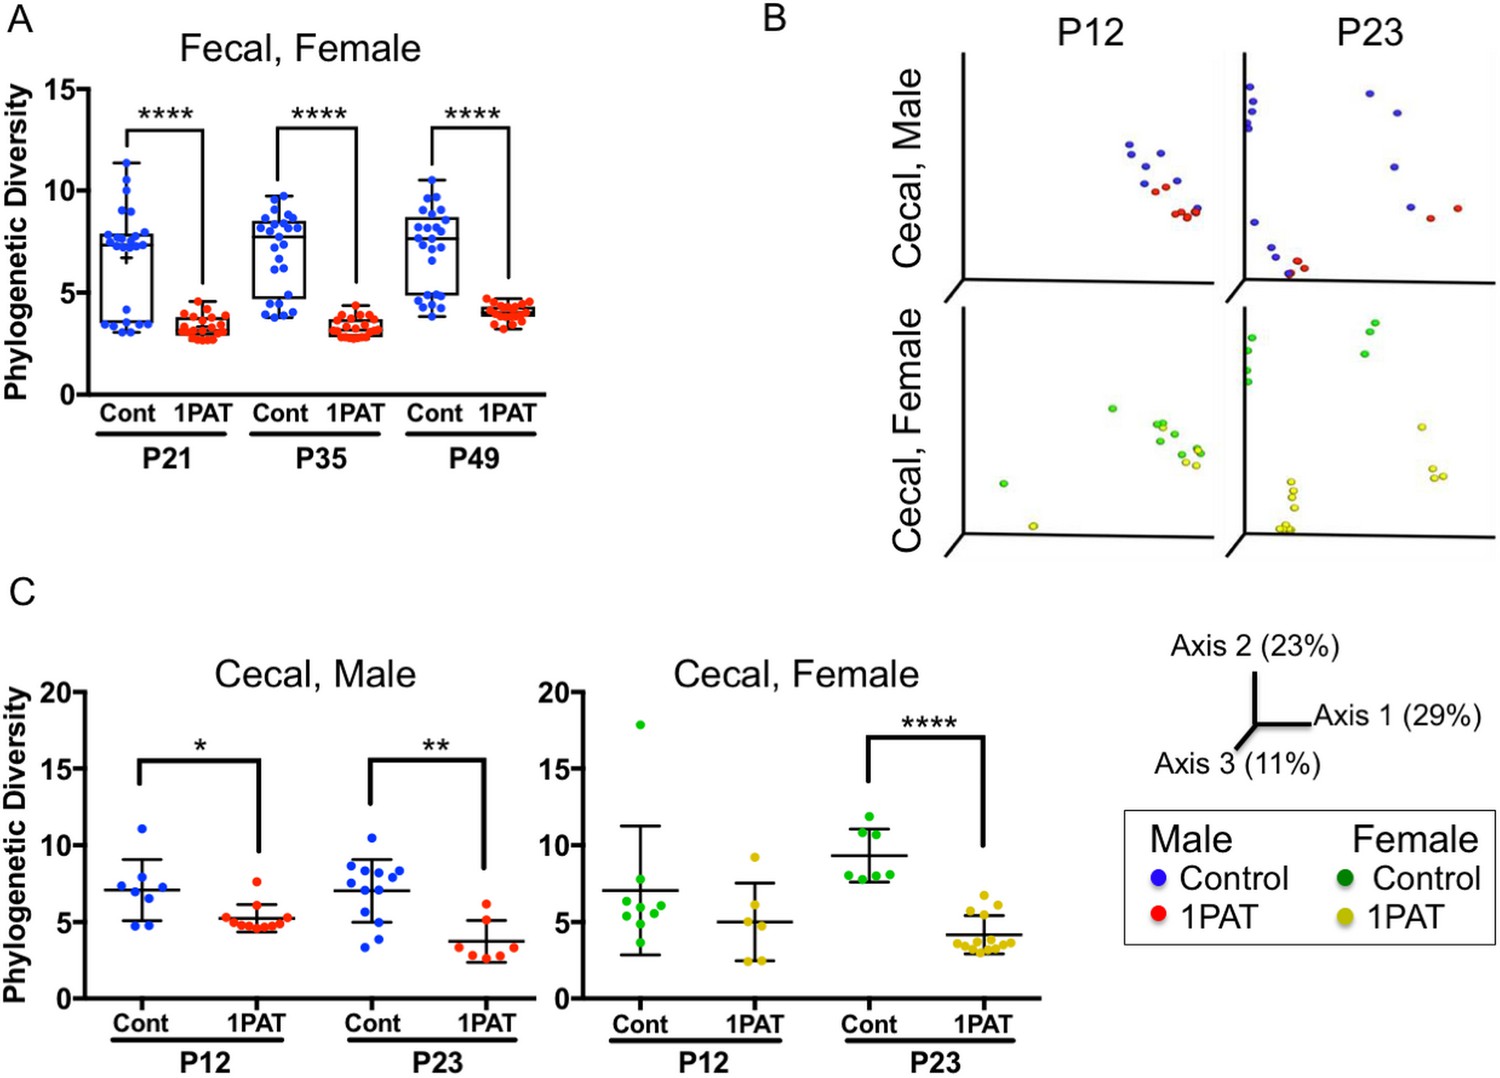
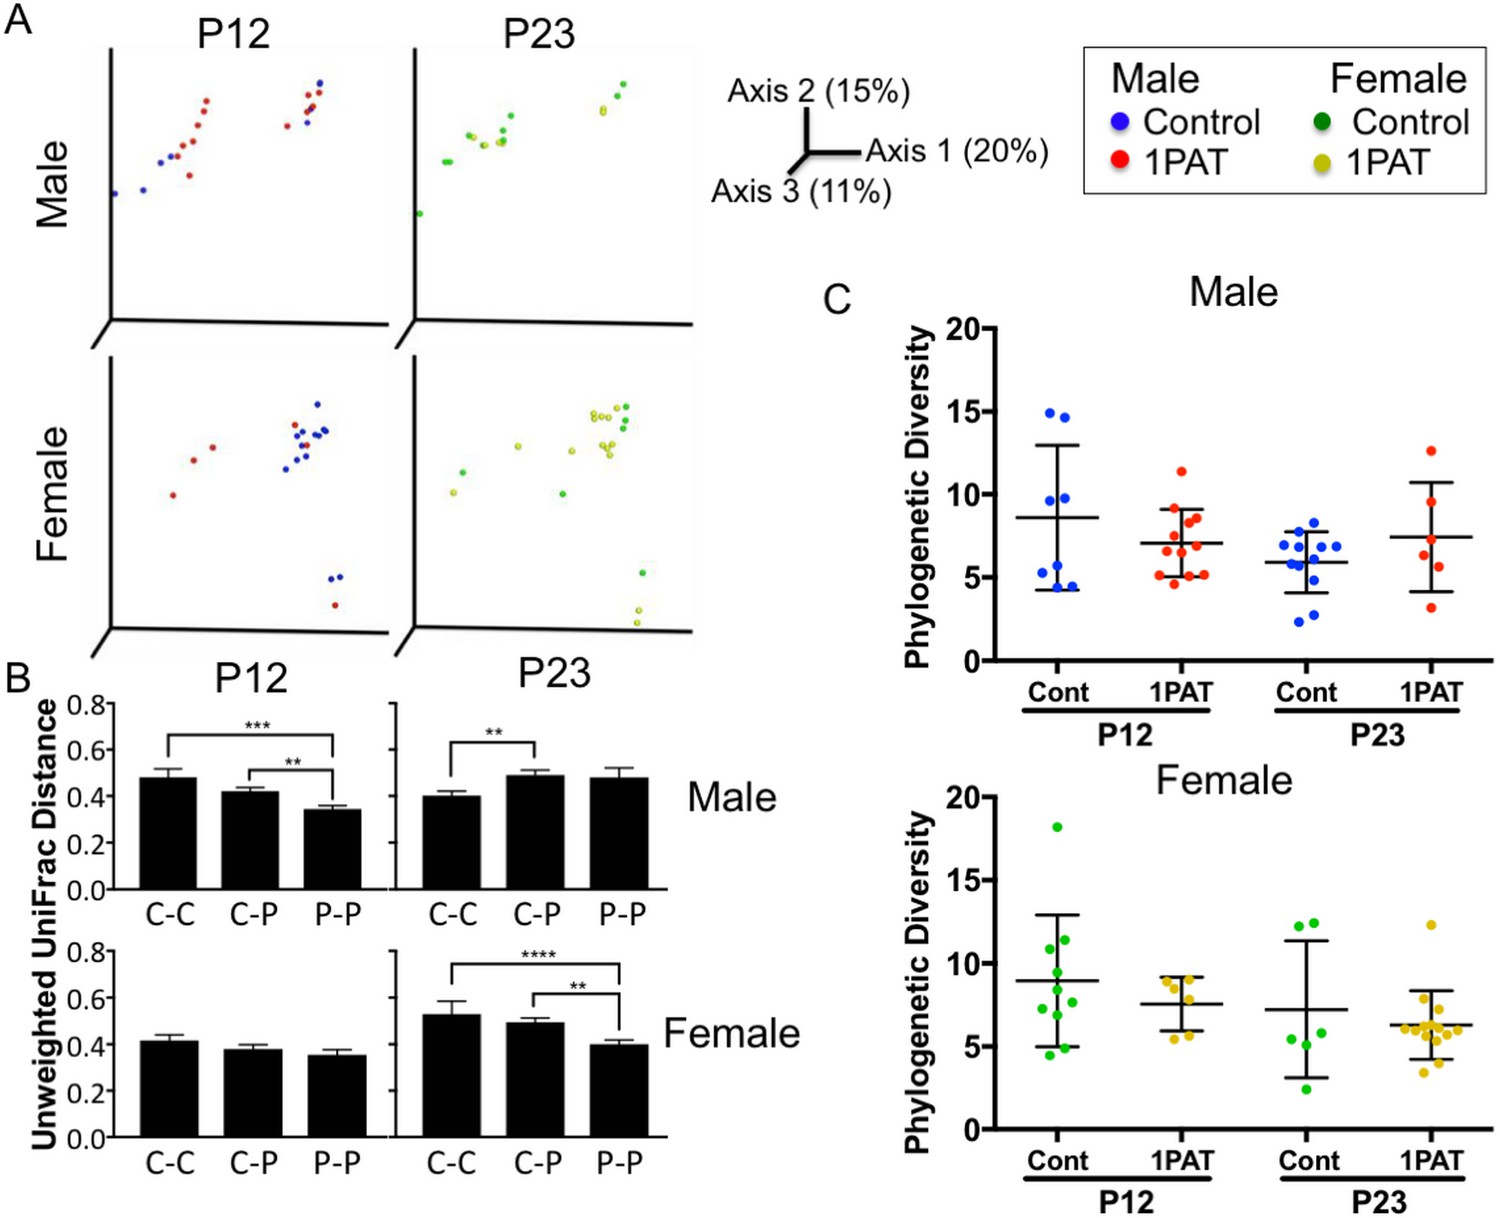
(A) α-diversity (Phylogenic diversity (PD)) of fecal microbiota in females (P21, P35 and P49). Statistical significance determined by one-way-ANOVA test. ****p<0.0001. (B) β-diversity, as measured by unweighted UniFrac analysis of cecal microbiota over time (P12, and P23). (C) α-diversity (PD) of cecal microbiota in both males and females (P12 and P21). Statistical significance determined by one-way-ANOVA test. *p<0.05; **p<0.01; and ****p<0.0001.
Figure 2—figure supplement 2
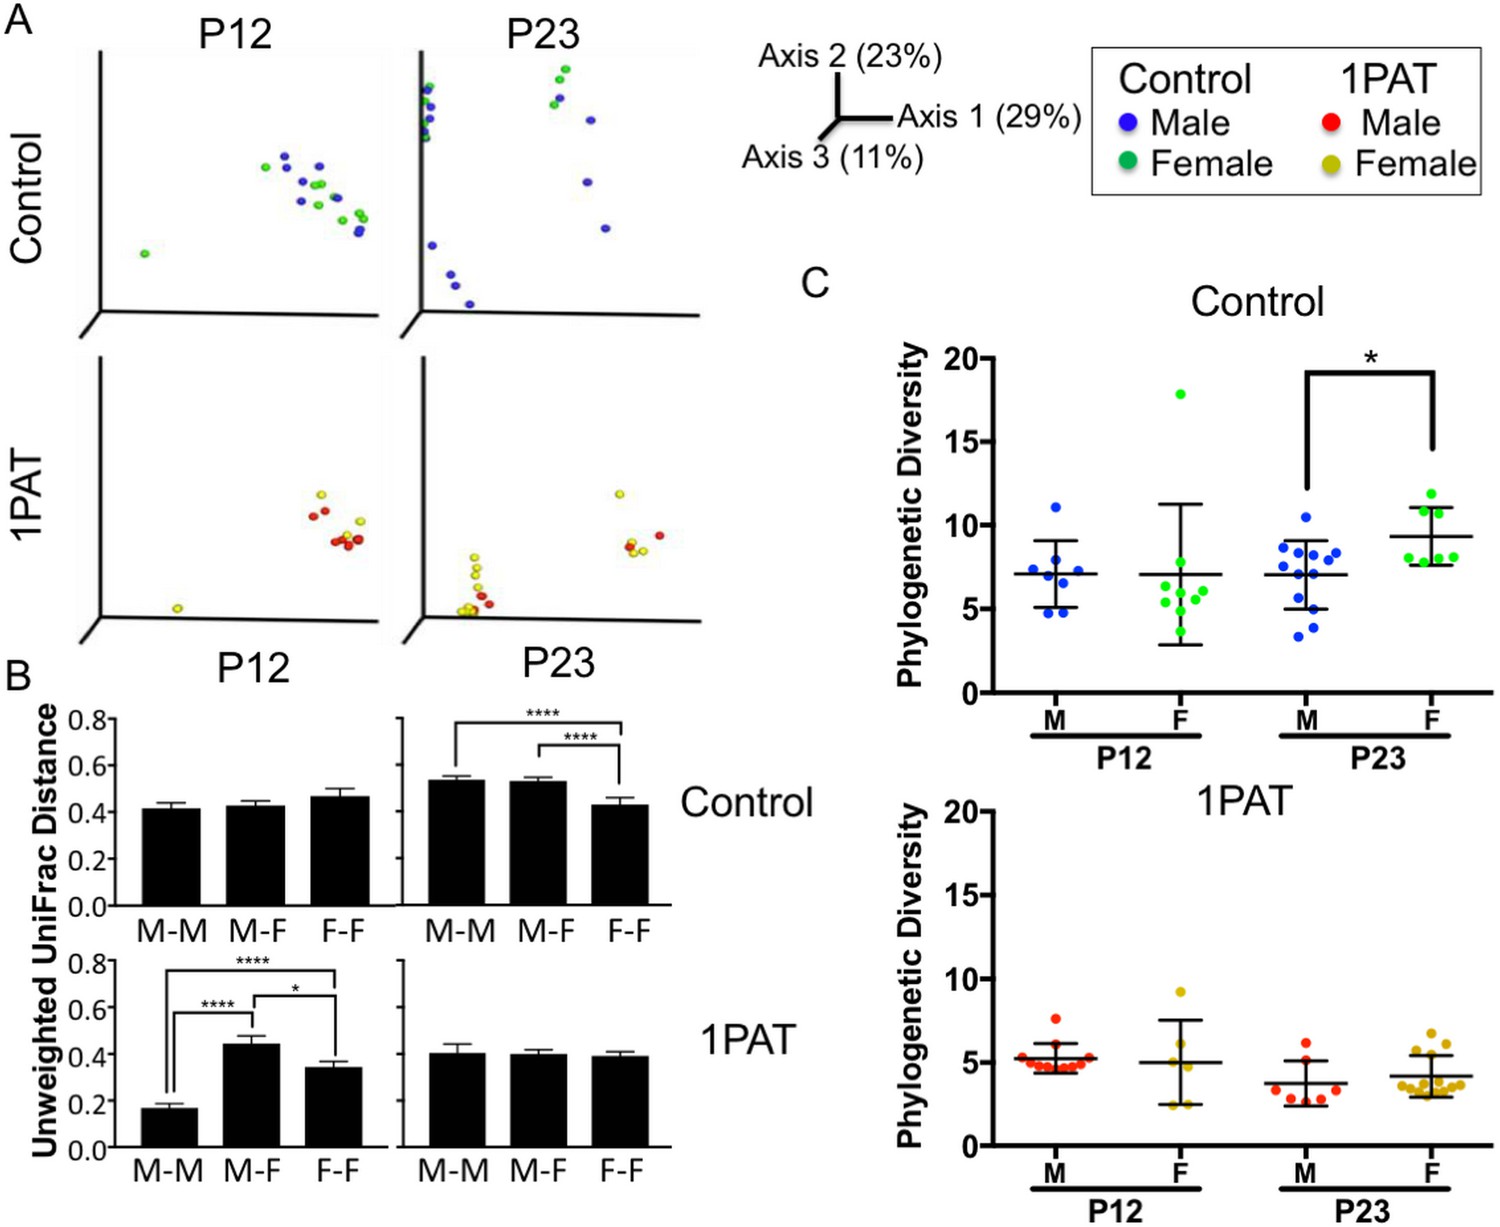
Cecal microbiota characteristics of male and female control and PAT NOD mice.
(A) β-diversity, as measured by unweighted UniFrac analysis of cecal microbiota over time (P12, and P23). (B) Inter- and intra-group UniFrac distances. Significance determined by one-way-ANOVA with Tukey method for correction for multiple comparisons. ****p<0.001. M-M, M-F and F-F represent the intra-group distances within males, inter-group distances between males and females, and intra-group distances within females, respectively. (C) α-diversity (Phylogenic diversity (PD)) of cecal microbiota. Statistical significance determined by one-way-ANOVA. *p<0.05; **p<0.01; and ****p<0.0001.
Figure 2—figure supplement 3

Fecal microbiota characteristics of male and female NOD mice in 1PAT and control groups in early life.
(A) β-diversity, as measured by unweighted UniFrac analysis of fecal microbiota over time (P21, P35, and P49). (B) Inter- and intra-group UniFrac distances. Significance determined by one-way-ANOVA with Tukey method for correction for multiple comparisons. ****p<0.001. M-M, M-F and F-F represent the intra-group distances within males, inter-group distances between males and females, and intra-group distances within females, respectively. (C) α-diversity (Phylogenic diversity (PD)) of fecal microbiota. Statistical significance determined by one-way-ANOVA. ****p<0.0001.
Figure 2—figure supplement 4
Ileal microbiota characteristics of male and female control and PAT NOD mice.
(A) β-diversity, as measured by unweighted UniFrac analysis of ileal microbiota over time (P12, and P23). (B) Inter- and intra-group UniFrac distances. Significance determined by one-way-ANOVA with Tukey method for correction for multiple comparisons. ****p<0.001. M-M, M-F and F-F represent the intra-group distances within males, inter-group distances between males and females, and intra-group distances within females, respectively. (C) α-diversity (Phylogenic diversity (PD)) of ileal microbiota. Statistical significance determined by one-way-ANOVA. *p<0.05; **p<0.01; ***p<0.001; and ****p<0.0001.
Figure 2—figure supplement 5
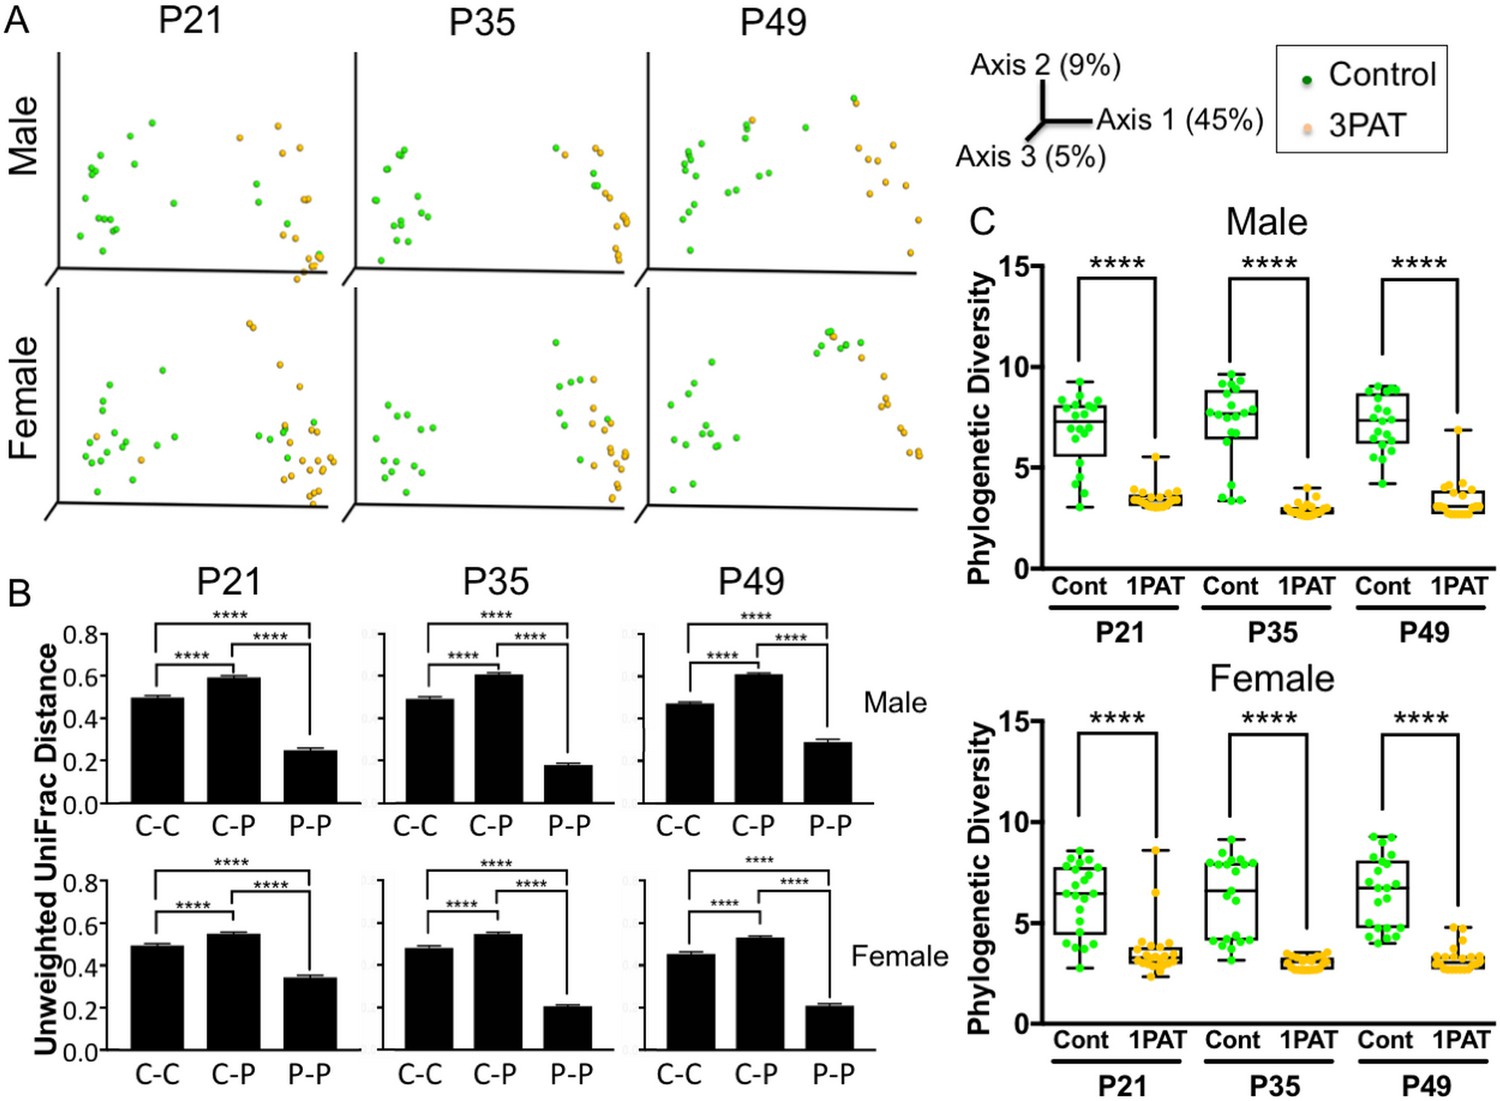
Microbiota characteristics of 3PAT and control NOD mice in early life.
(A) β-diversity, as measured by unweighted UniFrac analysis of fecal microbiota over time (P21, P35, and P49). (B) Inter- and intra-group UniFrac distances. Significance determined by one-way-ANOVA with Tukey method for correction for multiple comparisons. ****p<0.001. C-C, C-P and P-P represent the intra-group distances within controls, inter-group distances between controls and PAT, and intra-group distances within PAT, respectively. (C) α-diversity (Phylogenic diversity (PD)) of fecal microbiota. Statistical significance determined by one-way-ANOVA. ****p<0.0001.
Figure 2—figure supplement 6
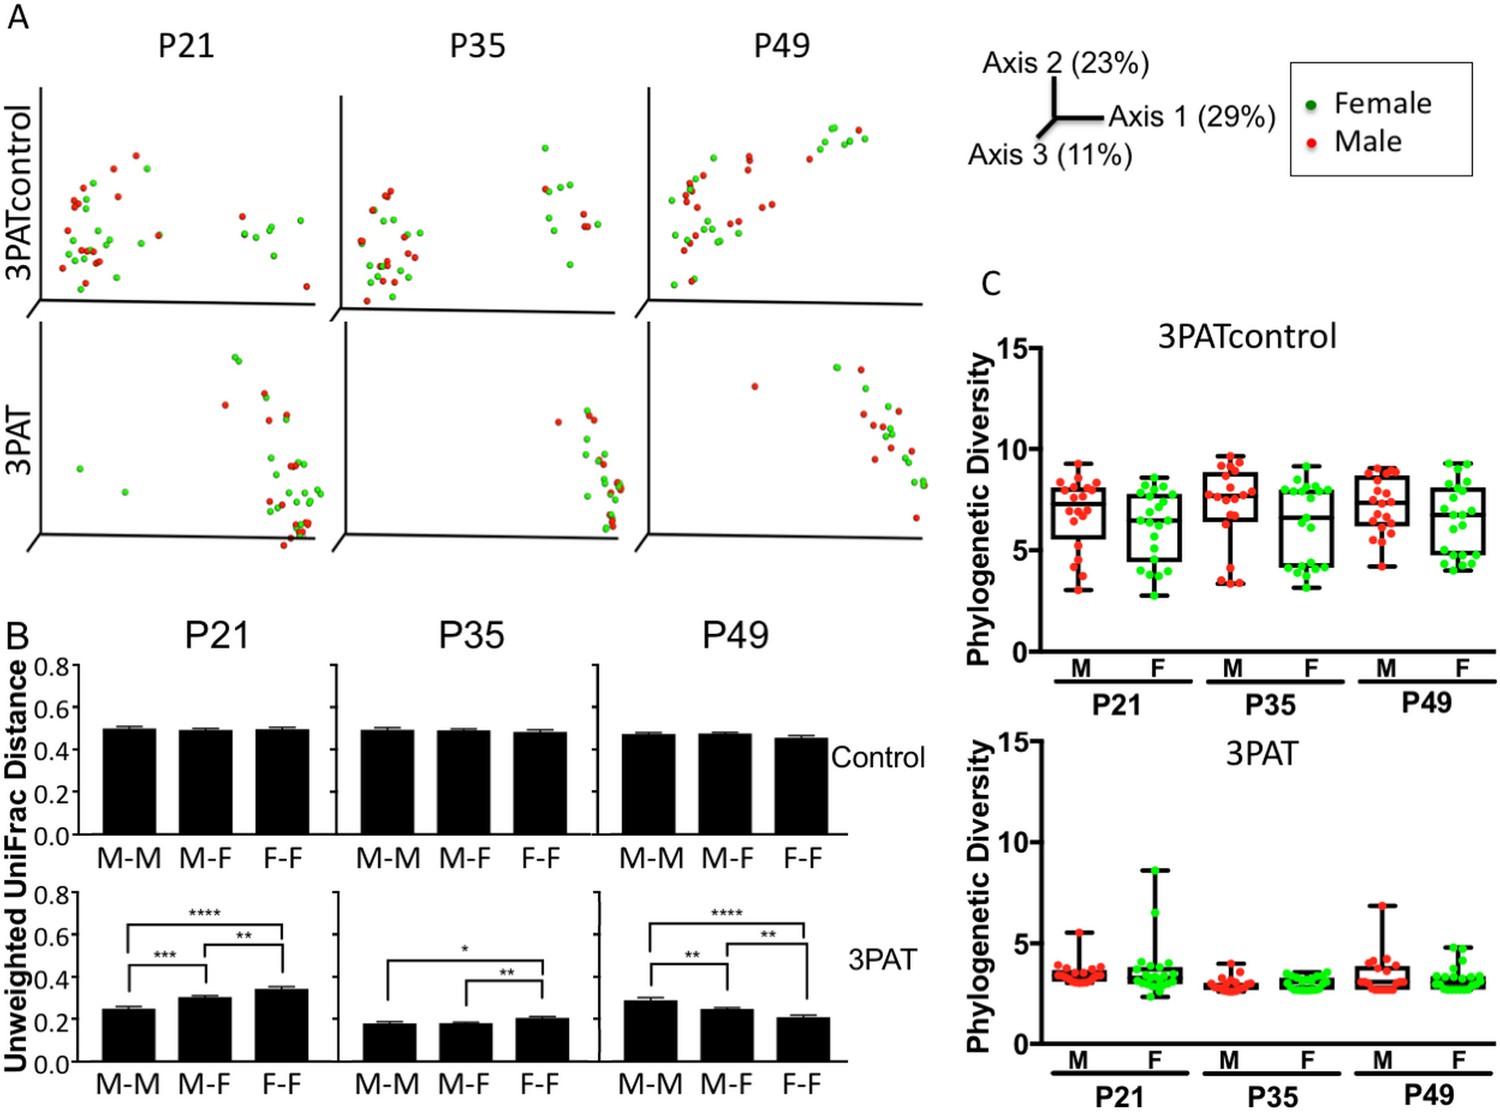
Microbiota characteristics of male and female NOD mice in 3PAT and control groups in early life.
(A) β-diversity, as measured by unweighted UniFrac analysis of fecal microbiota over time (P21, P35, and P49). (B) Inter- and intra-group UniFrac distances. Significance determined by one-way-ANOVA with Tukey method for correction for multiple comparisons. ****p<0.001. (C) α-diversity (Phylogenic diversity (PD)) of fecal microbiota. Statistical significance determined by one-way-ANOVA. ****p<0.0001.
Figure 2—figure supplement 7
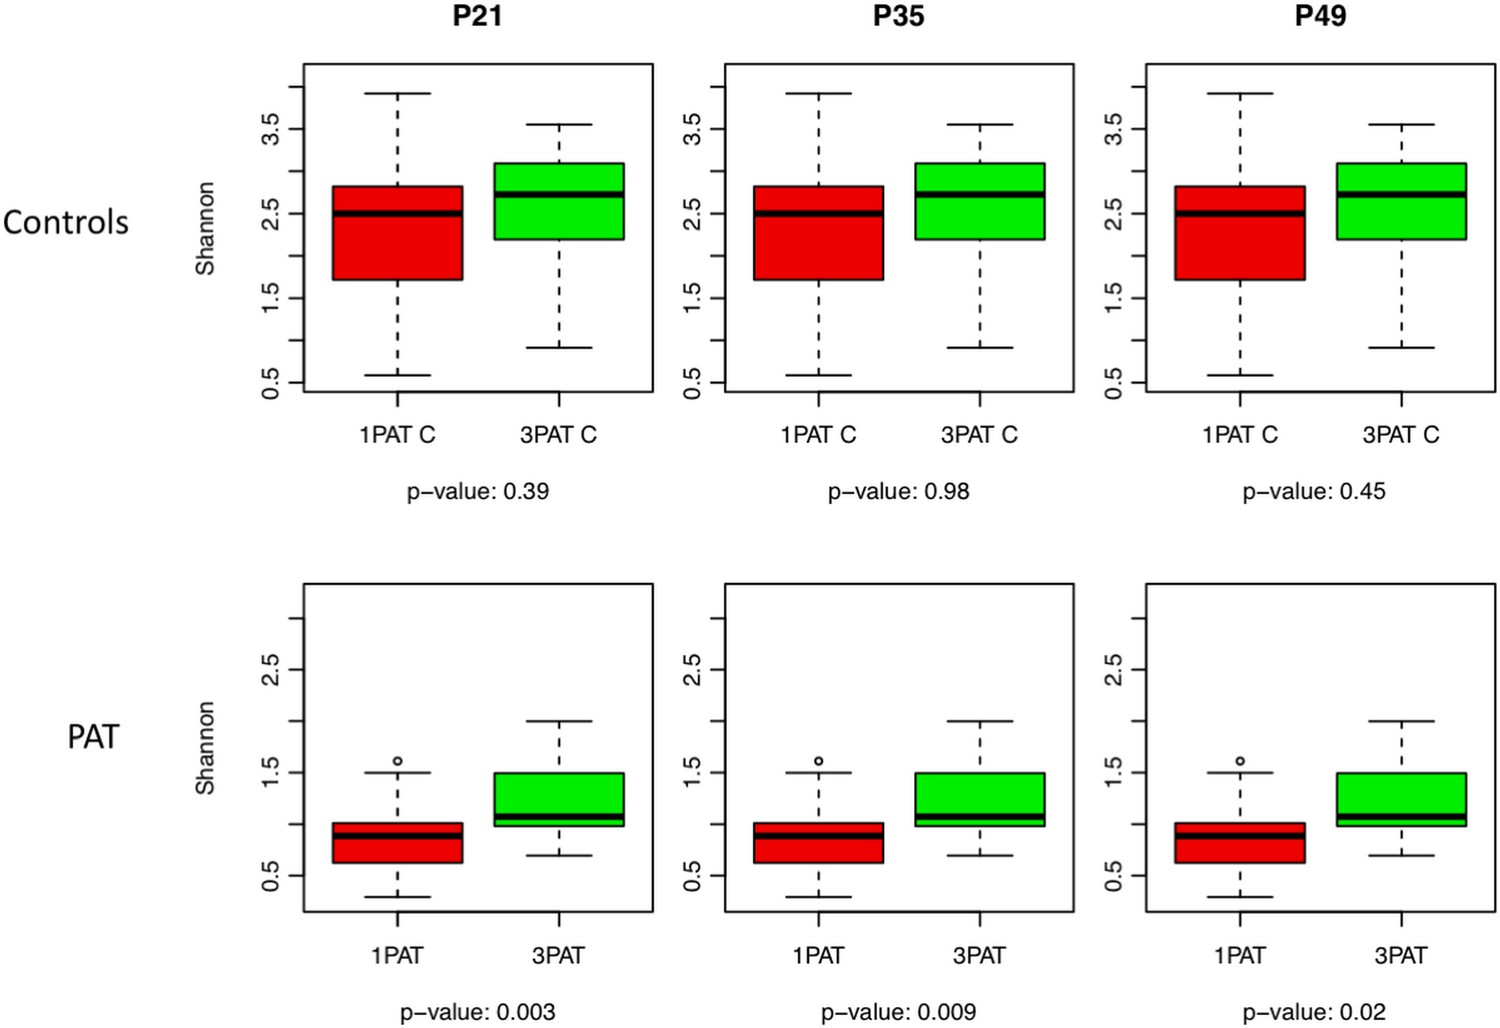
α-diversity in males across the 1PAT and 3PAT experiments at P21-P49.
Shannon scores (mean ± SD) for controls (top Panel) and PAT (bottom Panel), p values based on t tests, results from Simpson analysis are similar (data not shown).
Figure 2—figure supplement 8

Metagenomic analysis of microbiota characteristics of 1PAT and control NOD mice in early life.
Unsupervised clustering of the microbial pathways with the 25% highest variance. A group of 34 specific pathways in the 1PAT mice, regardless of time or sex are outlined with a blue box.
Figure 2—figure supplement 9
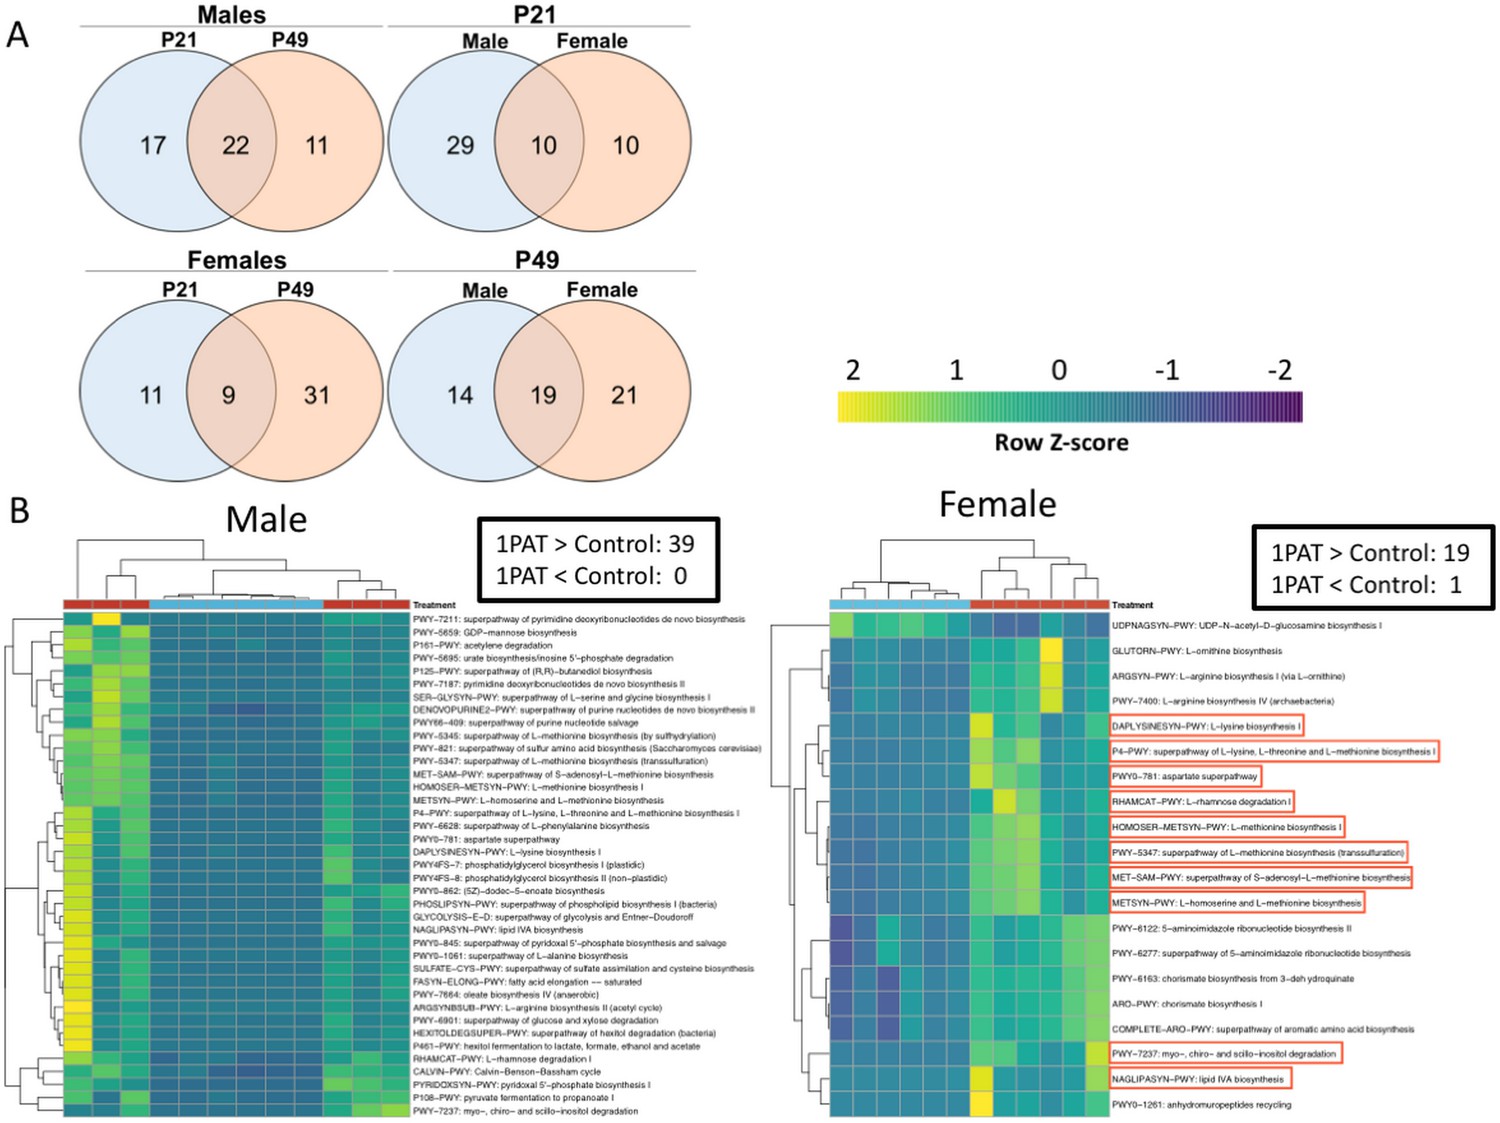
Metagenomic analysis of microbial pathways in fecal samples differing by treatment and by sex.
(A) Comparisons of the numbers of significantly different pathways. Left: between 1PAT and Control between P21 and P49 in males (top) and females (bottom); Right, at P21 (top) or P49 (bottom) between males and females. (B) Unsupervised clustering of the microbial pathways differentiated by 1PAT in males and females (n = 6 mice per sex per treatment). The male-female shared pathways are highlighted in red boxes.
Figure 2—figure supplement 10
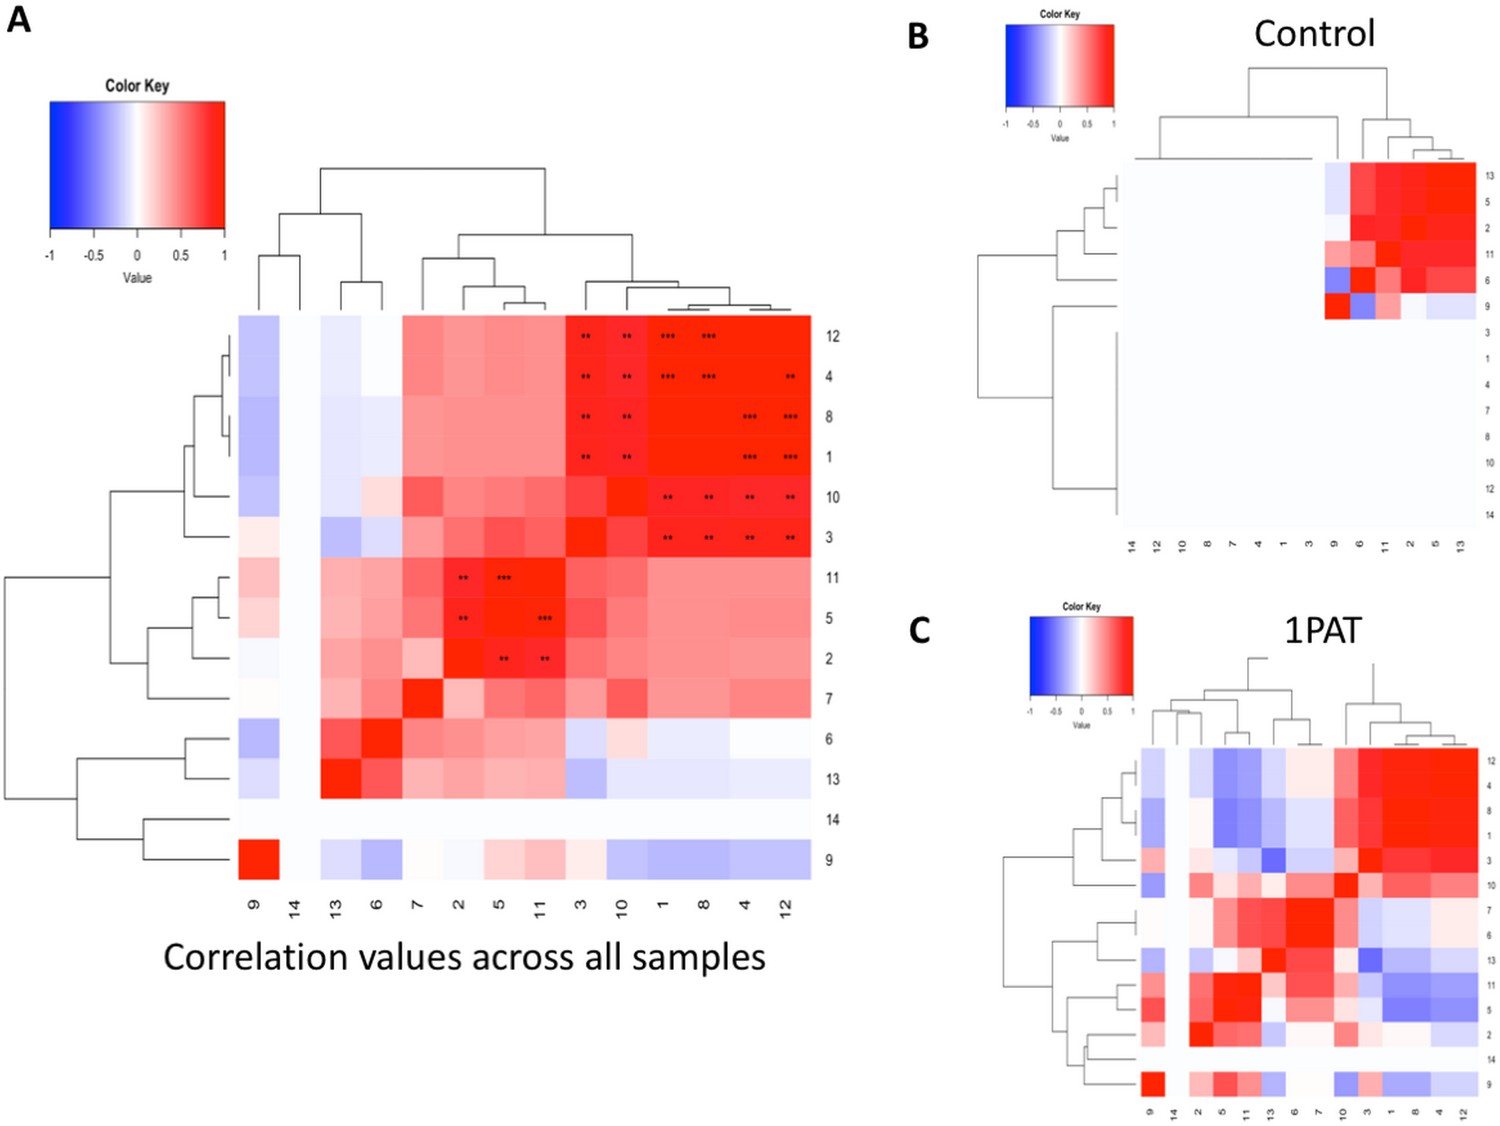
Heat maps of the correlation of the representation of fecal metagenomic pathways at P21.
Spearman correlation calculated for each pairwise metagenomics pathway comparison and correlation coefficients are clustered as a heat map. Significance levels use a Benjamini-Hochberg correction and significant correlations are indicated by an asterisk (*p<0.05, **p<0.01, ***p<0.001). Panels (A) All samples. (B) Controls, and (C) 1PAT. Pathways with fewer than three non-zero entries were not calculated and appear in the heat map as having a correlation of 0. The codes for the pathways are as follows: 1. fatty acid elongation saturated; 2. Calvin Benson Bassham cycle; 3. hexitol fermentation to lactate formate ethanol and acetate; 4. superpathway of phospholipid biosynthesis I bacteria; 5. urate biosynthesis inosine 5’ phosphate degradation; 6. pyrimidine deoxyribonucleotides de novo biosynthesis II; 7. superpathway of pyrimidine deoxyribonucleotides de novo biosynthesis; 8. oleate biosynthesis IV anaerobic; 9. 5Z-dodec-5-enoate biosynthesis; 10. superpathway of purine nucleotide salvage; 11. superpathway of L-serine and glycine biosynthesis I; 12. superpathway of sulfate assimilation and cysteine biosynthesis; 13. superpathway of purine nucleotides de novo biosynthesis II; 14. superpathway of L-methionine biosynthesis by sulfhydrylation.
Figure 2—figure supplement 11
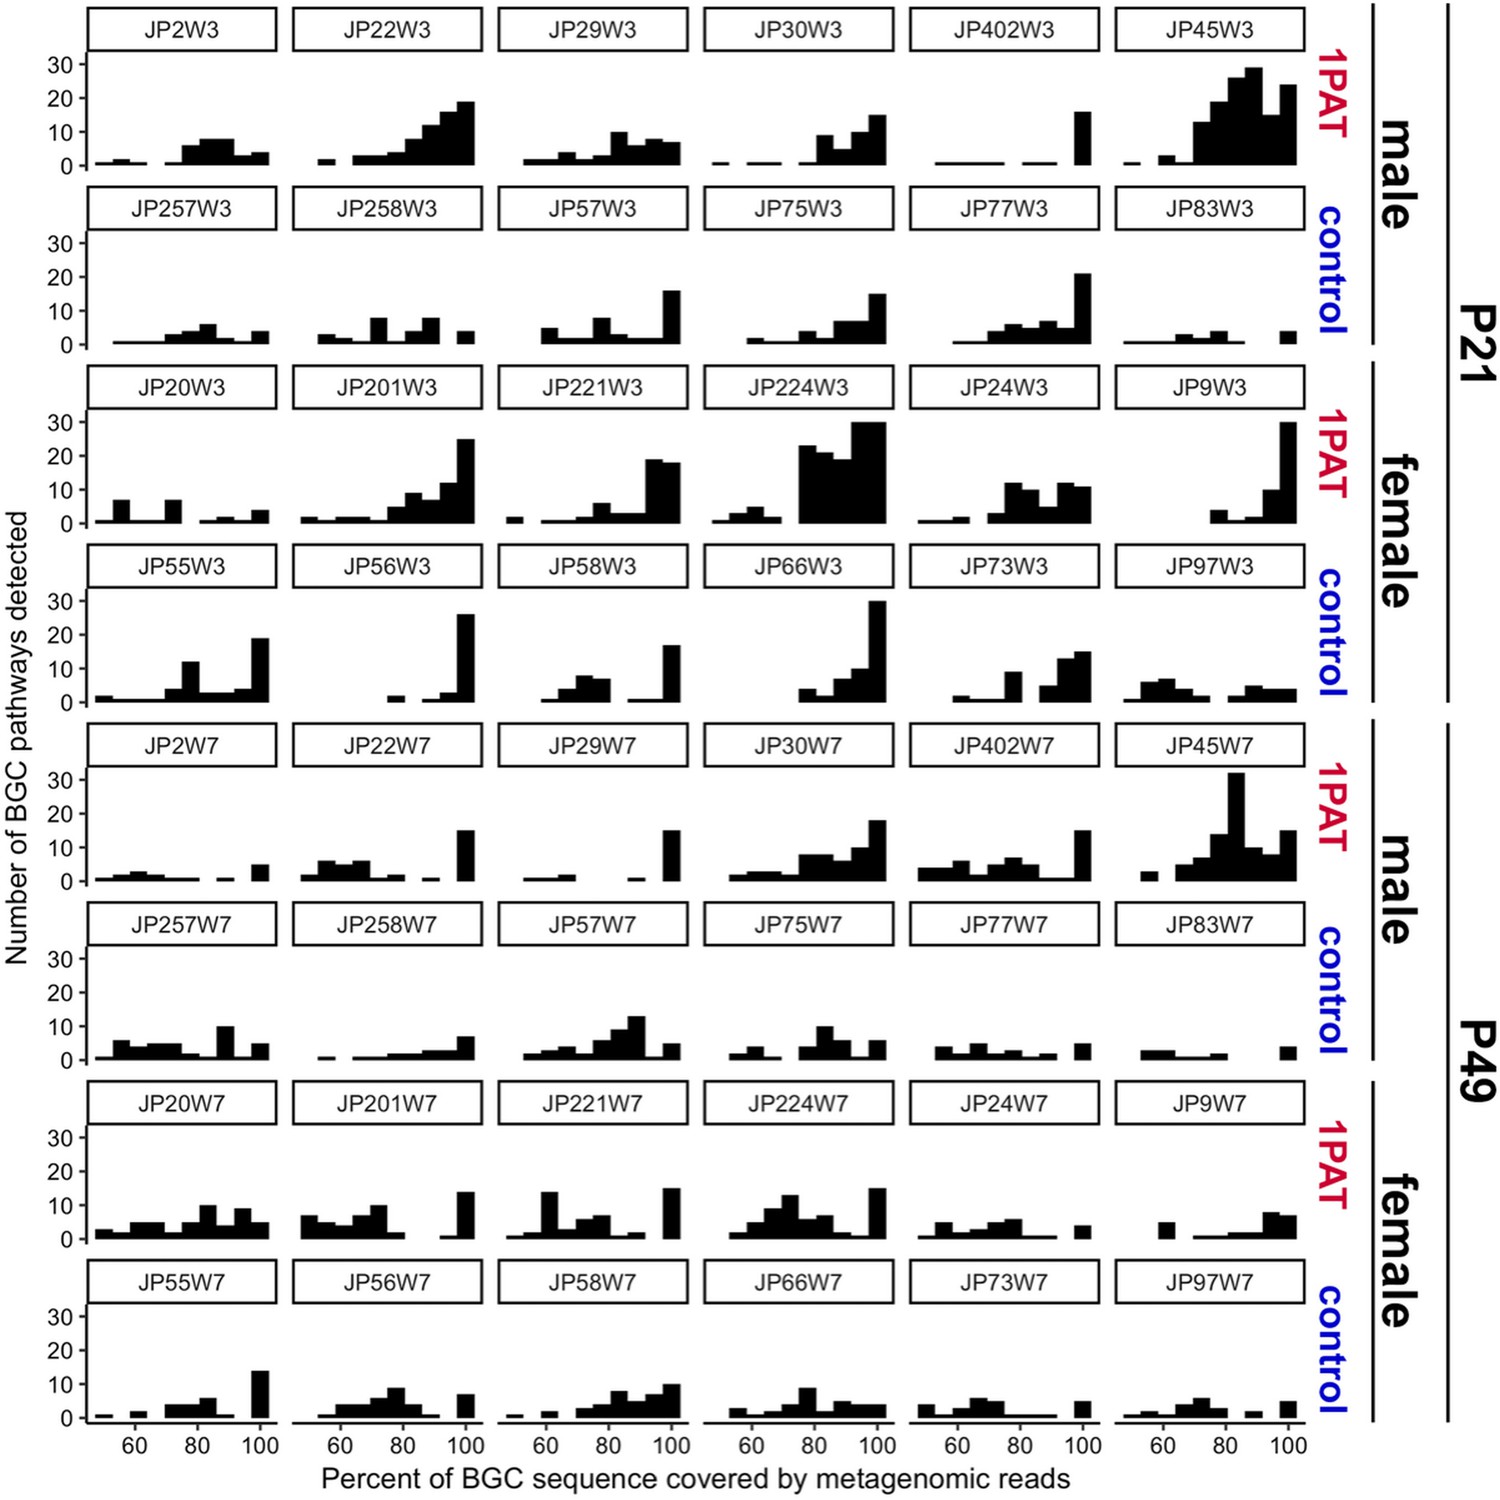
Biosynthetic gene cluster (BGC) frequencies in 1PAT and control samples at P21 and P49.
Histograms show the total number of detected BGC pathways for the 48 samples from 24 mice subjected to metagenomic analysis. Quality controlled shotgun reads were aligned to BGCs at 95% identity using optimal gapped alignment, and pathway coverage was calculated using custom Python and R code. BGC hits were filtered to those with high within-sample coverage, resulting in 228 unique BGC pathways. For each sample, the BCG frequency is plotted as a histogram versus the raw percent coverage, which shows both the overall higher coverage rates in PAT compared with control as well as the variation in BGC number per sample.
Figure 3

Effect of 1PAT on early-life metabolism.
(A) Quantitation of six short chain fatty acids (SCFA) in P23 cecal samples. Samples were examined by targeted GC/MS; formic acid was not detectable (not shown). Groups: Control (n = 7), 1PAT(n = 6), compared by Welch’s T Test for unpaired samples (*p<0.05). (B) Hepatic and serum metabolites differentially induced by 1PAT. Analysis based on significance at ≥ 2 time points or in both serum and liver in the same direction (n = 7–17 samples per group) [See also Supplementary file 2].
-
Figure 3—source data 1
Values of concentrations of six short chain fatty acids.
- https://doi.org/10.7554/eLife.37816.020
Figure 4 with 3 supplements
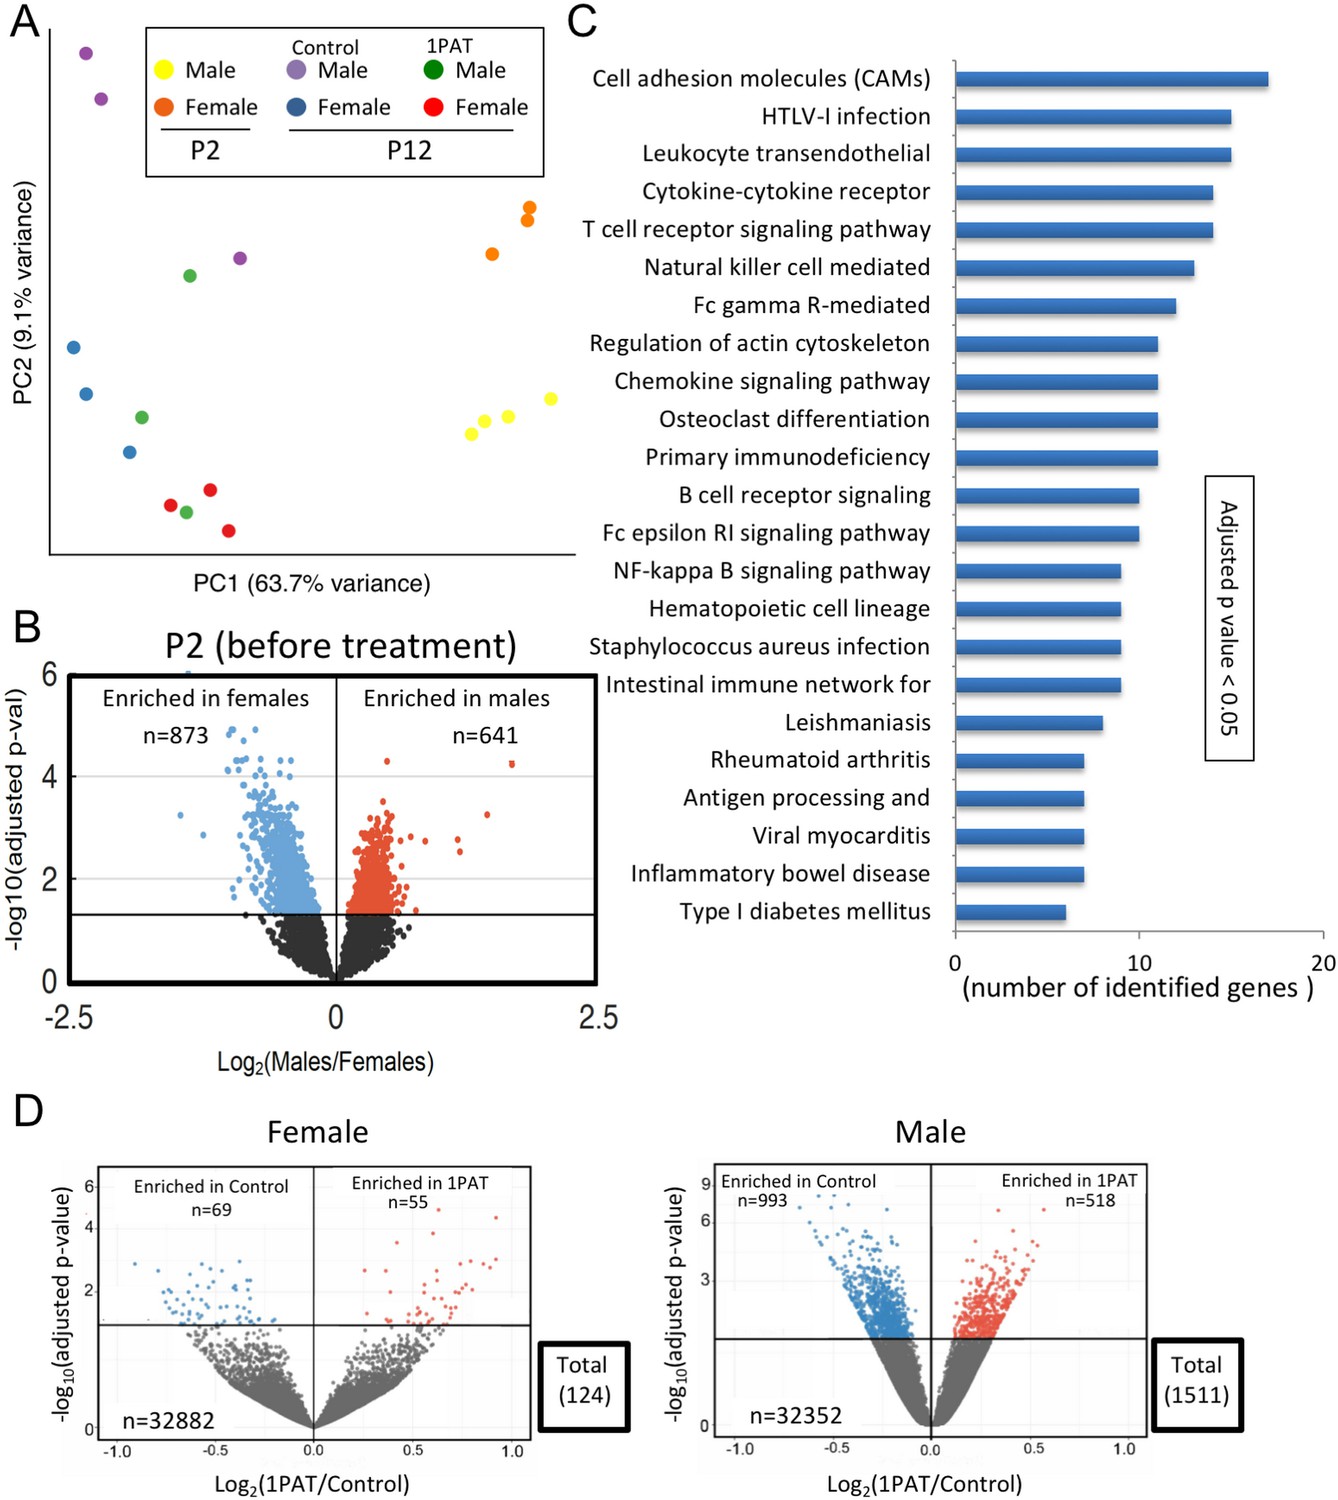
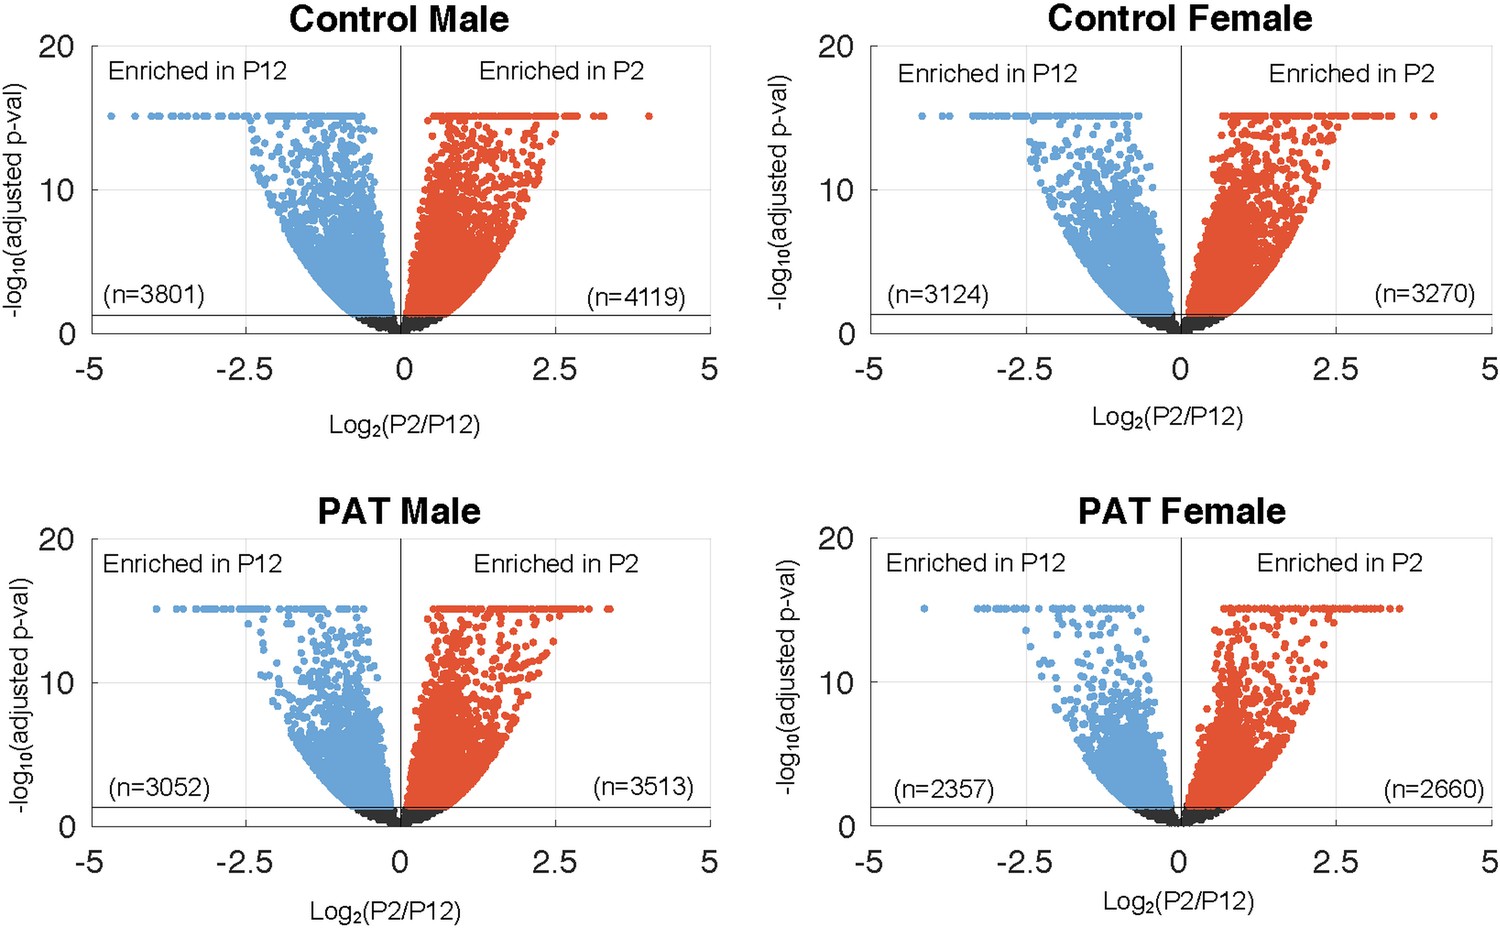
1PAT effects on ileal gene expression from P2 to P23, based on RNA-Seq analysis.
(A) Bray-Curtis analysis of ileal gene expression of pups at P2 and P12 (2 days after PAT), represented by PCA. All differences between expression at P2 and P12 (in both 1PAT and control mice) were significant in both males and females (p<0.05). (B) Differential ileal gene expression between P2 males and females; volcano plot indicates 1514 genes with significantly different expression. DESeq2 difference visualization maximizes at 15 (-log10 (adjusted p values)). (C) Ileal KEGG pathways altered by 1PAT in P12 males; 23 significant pathways (adjusted p<0.05, after Benjamini-Hochberg correction), bars indicate numbers of differentially affected genes/pathway. (D) Differential ileal gene expression in 1PAT and control P23 females (left) and males (right) shown by volcano plot. In females, 124 genes (55 up-, 69 down-), and in males, 1511 genes (518 up-, 993 down-) were significantly differentially expressed, a 12.2-fold difference between the sexes. n = 4, 3, and 6–7 mice per group, at P2, P12, and P23, respectively. [See also Figure 4—figure supplements 1–3, and Supplementary files 3 and 4].
Figure 4—figure supplement 1
Differential ileal gene expression maturation between P2 and P12 in control and PAT mice, as shown in volcano plots.
In the controls, a total of 7920 genes (for males) and 6394 (for females) showed significant maturation between P2 and P12, (adjusted p<0.05 based on DESeq2 differential expression analysis). The PAT mice received their antibiotic course between P5-10, and the number of genes maturing between P2 and P12 fell to 6565 in males, 17% less than in controls, and to 5017 in females, 21% less than in controls. Visualization of DESeq2 differences maximizes at 15 (-log10 (adjusted p values)).
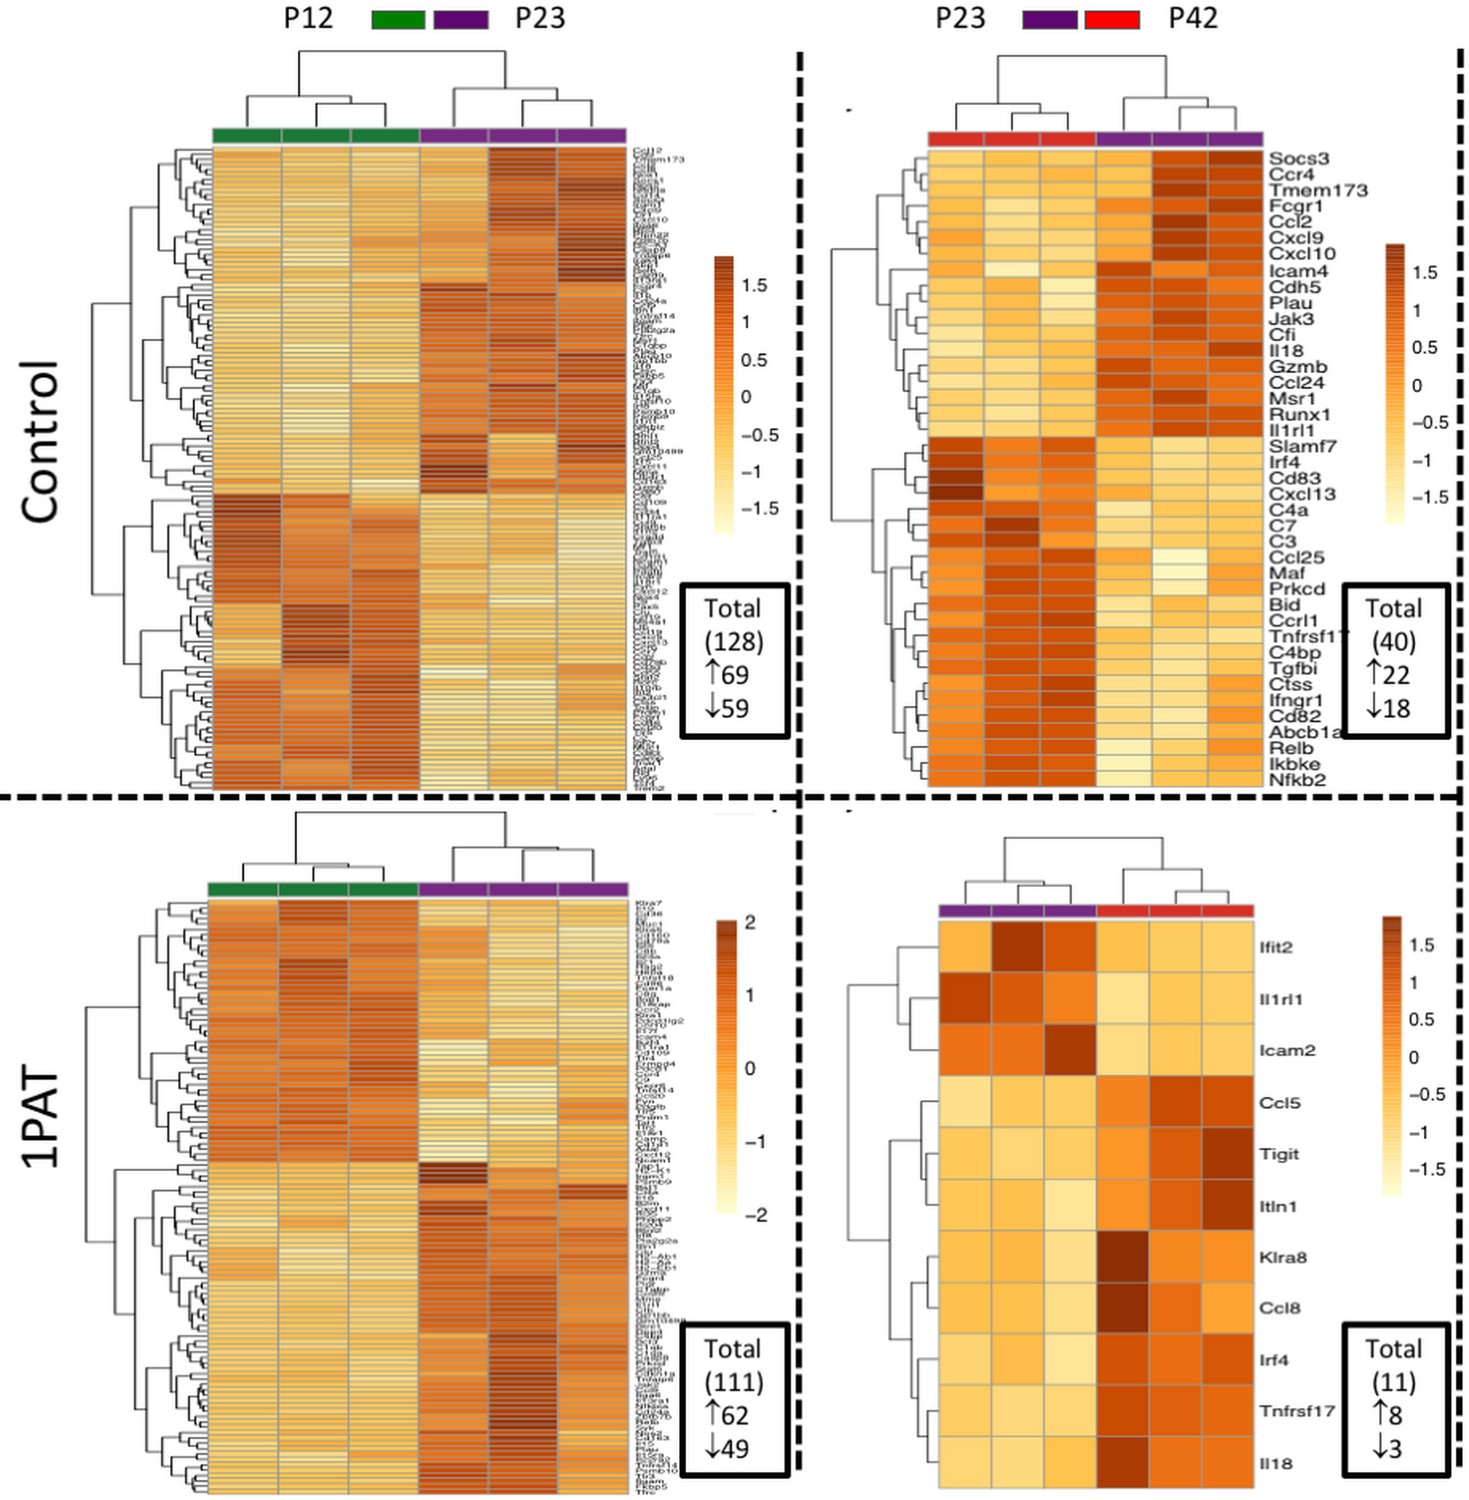
Figure 4—figure supplement 2
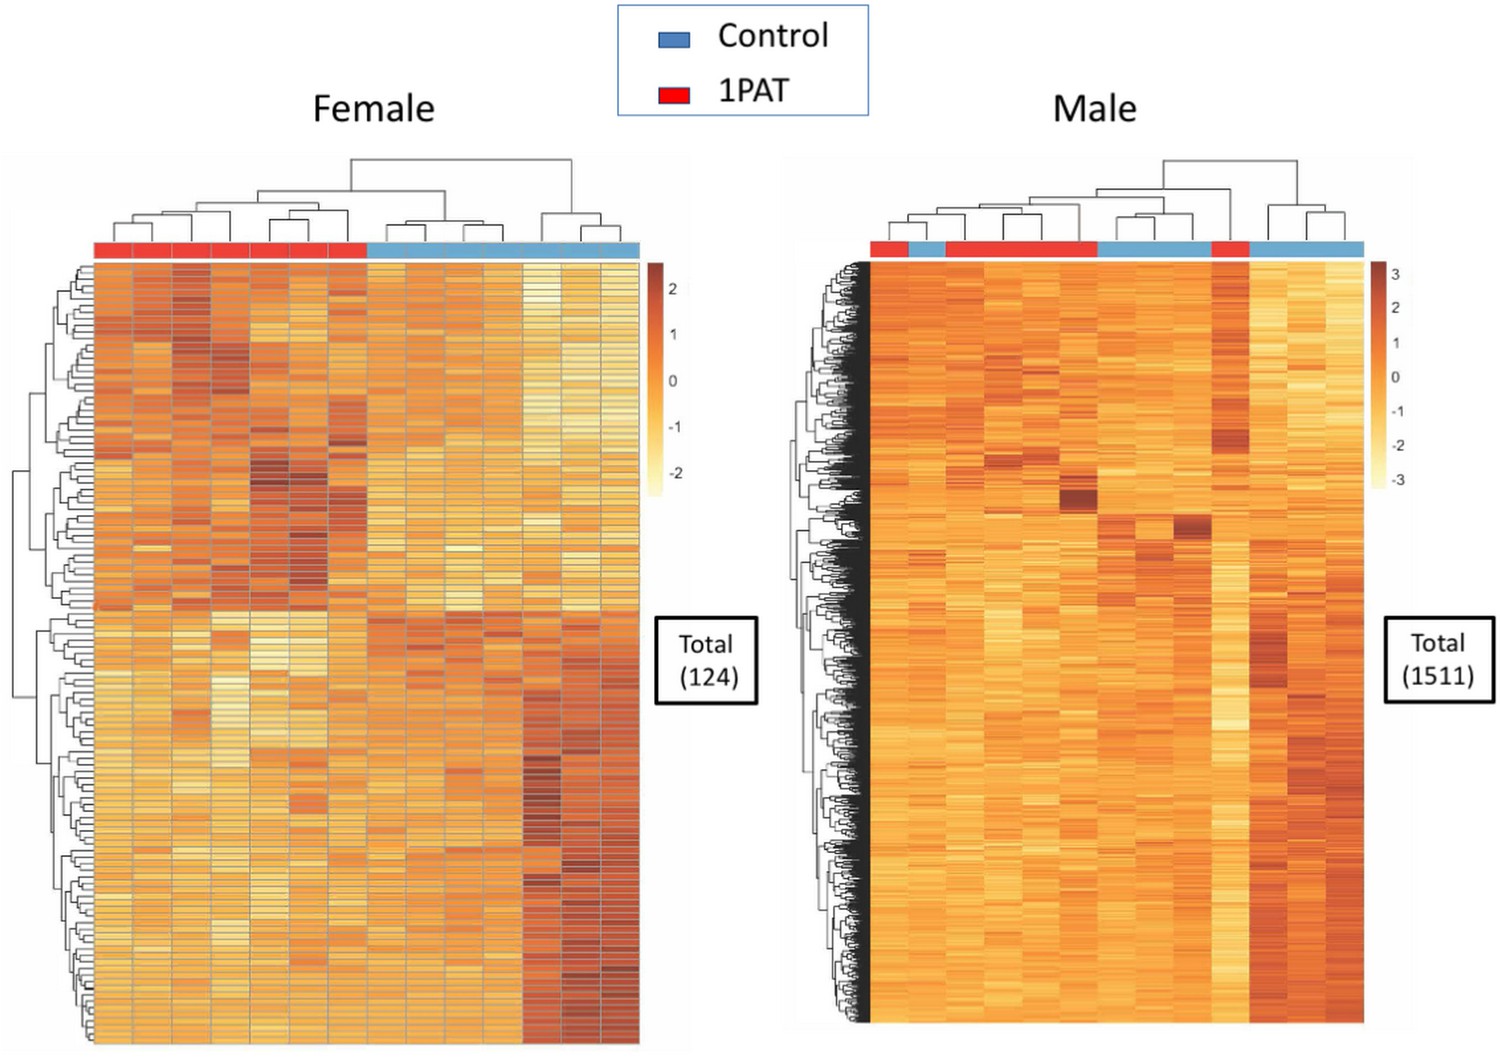
Unsupervised hierarchical clustering of significantly differential genes in P23 1PAT and control mice as assessed by RNA-Seq, and shown on heat maps.
The number of differential genes differed substantially between females (left, 124 genes) and males (right, 1511). The differential gene lists can be found in Supplementary file 3.
Figure 4—figure supplement 3
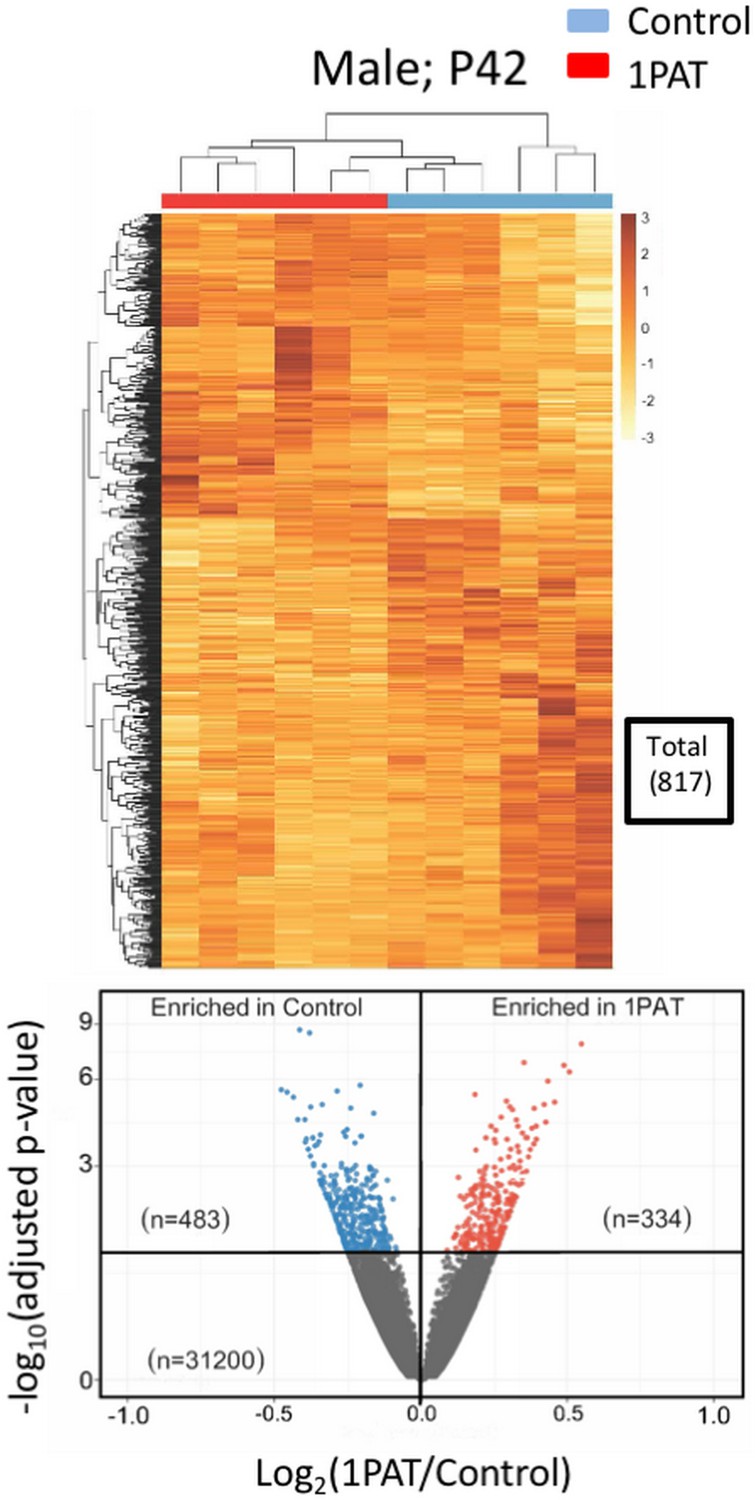
Effect of 1PAT on ileal gene expression profiles in 1PAT and control male mice at P42, showing an unsupervised hierarchical clustering of all significantly differential genes.
817 genes showed significant differential expression (334 up-, 483 down-).
Figure 5 with 3 supplements
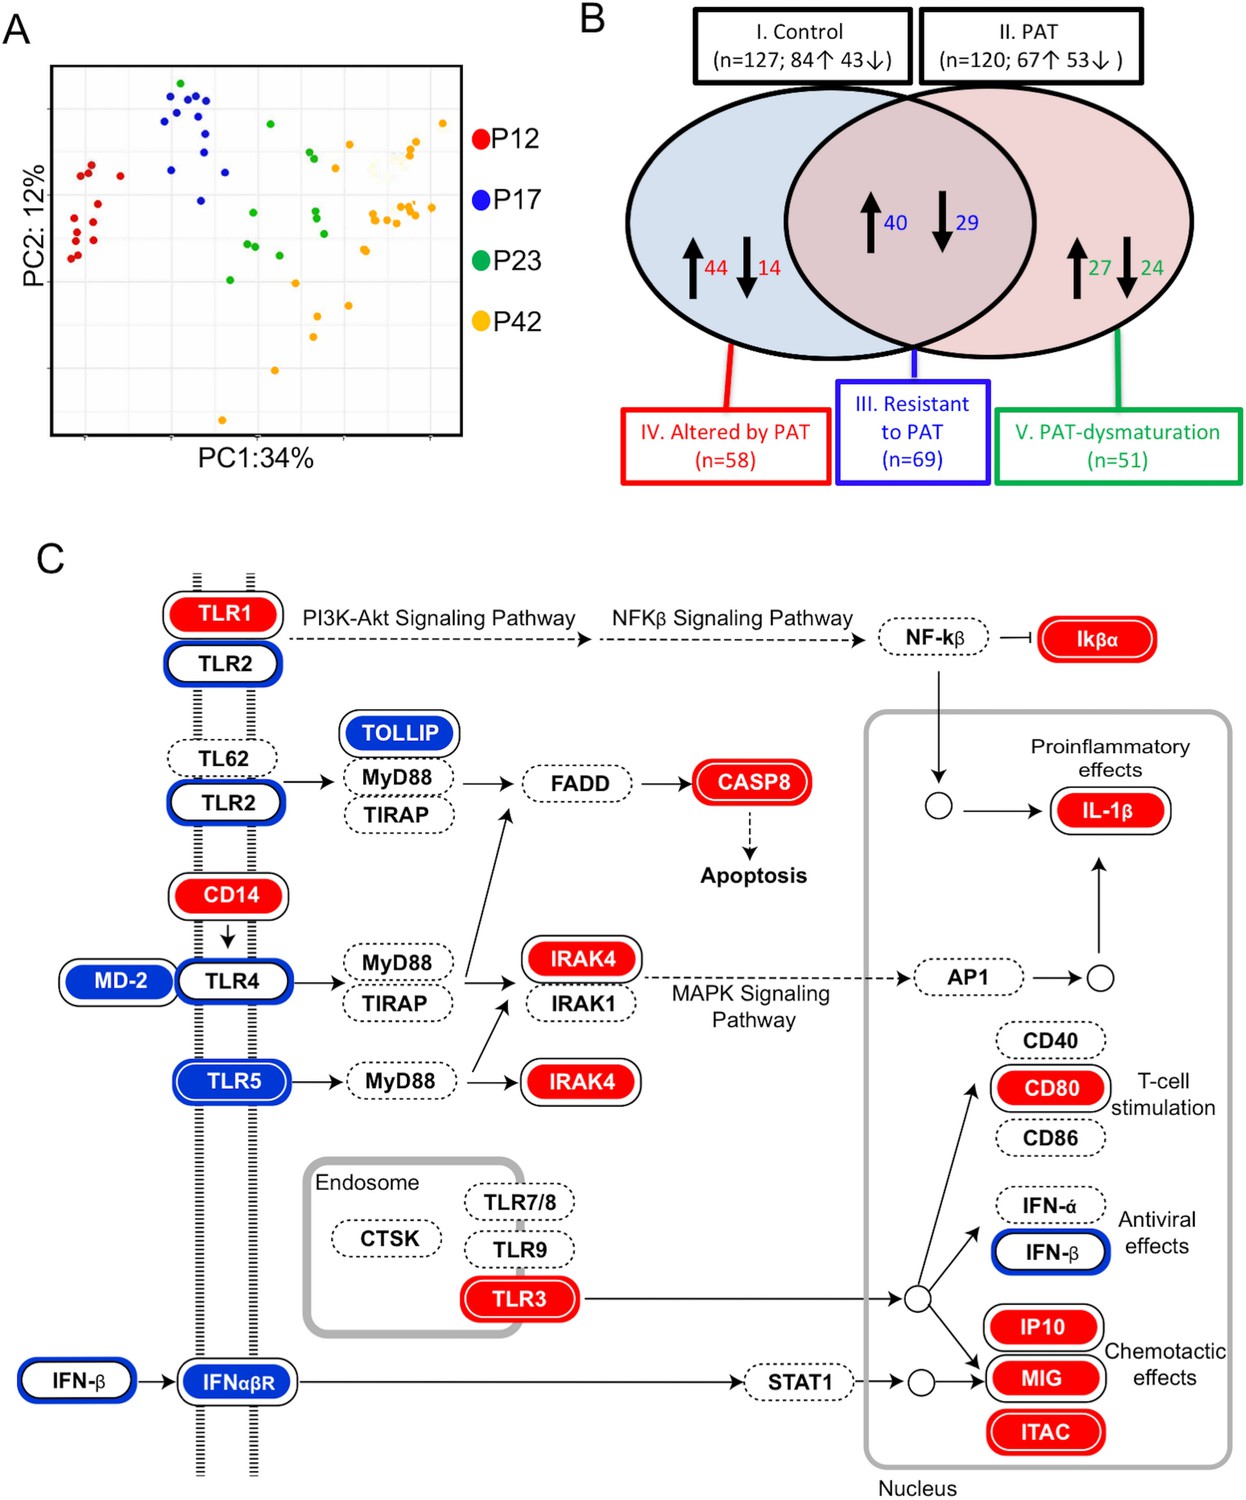
1PAT effects on ileal immune gene expression in NOD mice, as evaluated by NanoString.
(A) Bray-Curtis analysis of ileal gene expression of pups, over time (P12, P17, P23 and P42). (B) Comparison of ileal gene expression in1PAT and Control NOD males, defining five classes of genes maturing between P12 and P42. I. Maturing in Control mice; II. Maturing in 1PAT mice; III. Maturation that is resistant to 1PAT; IV. Maturation that is altered by 1PAT; and V. Maturing exclusively in1PAT mice (dysmaturation). Arrows indicate direction of maturation of expression from P12 to P42, and number of genes affected. (C) Differences in Toll-like receptor signaling pathway genes between 1PAT and control males maturing from P12 to P23, based on KEGG pathway analysis. Boxes filled with blue indicate that gene expression significantly decreased in controls during maturation from P12 to P23; filled with red indicate significant increases; Blue and red circles indicate significant decreases or increases, respectively, in the 1PAT mice. Black circles indicate that the significant change in controls was lost in 1PAT mice. All significance testing performed by Fisher’s exact test with the Benjamini–Hochberg correction. [See also Figure 5—figure supplements 1–3].
Figure 5—figure supplement 1
PAT effect on the maturation of ileal immune gene profiles in male NOD mice, as assessed by NanoString nCounter assays and shown on heat maps.
Genes differentially expressed between P12 and P23 (left) and between P23 and P42 (right) are shown for control (top) or 1PAT mice (bottom). Significantly more ileal genes showed maturity of expression between P12 and P23 than between P23 and P42, in both the control and the 1PAT mice, (p<0.0001 for both, Chi-square analyses). The differential gene list can be found in Supplementary file 6.
Figure 5—figure supplement 2
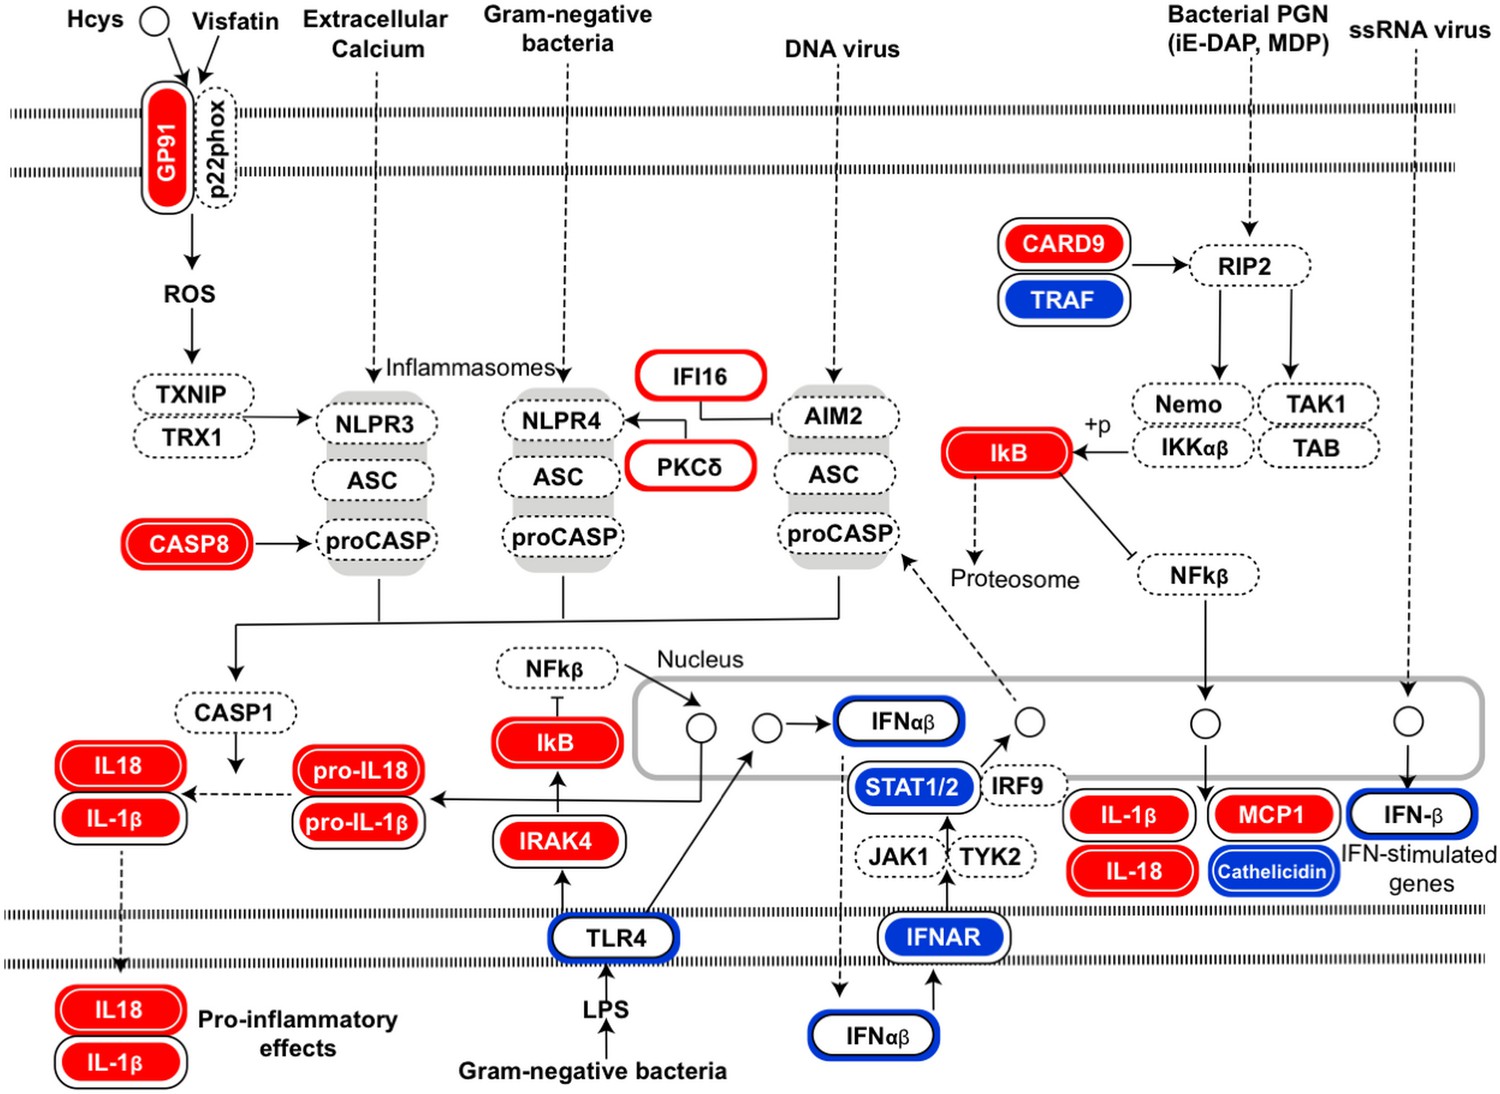
Differences in NOD-like receptor signaling pathway between PAT and control males maturing from P12-P23.
For key, see symbols in main text Figure 5C.
Figure 5—figure supplement 3
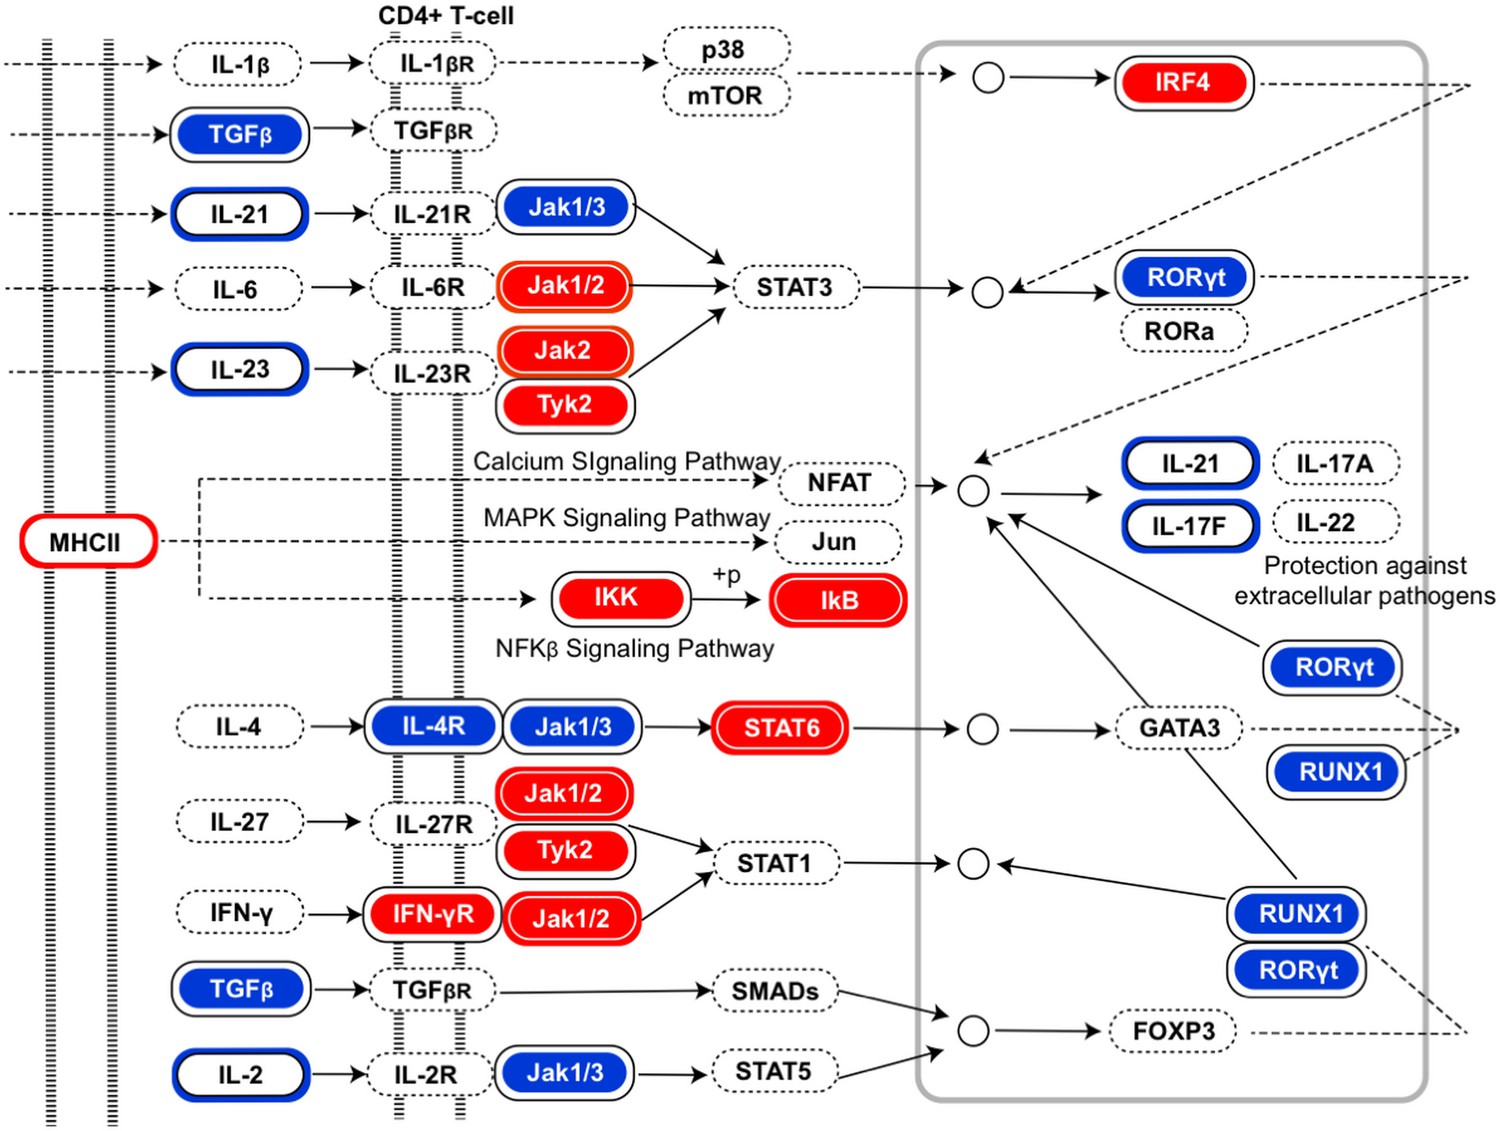
Differences in Th17 cell differentiation pathway between PAT and control males maturing from P12 to P42.
For key, see symbols in main text Figure 5C.
Figure 6 with 3 supplements
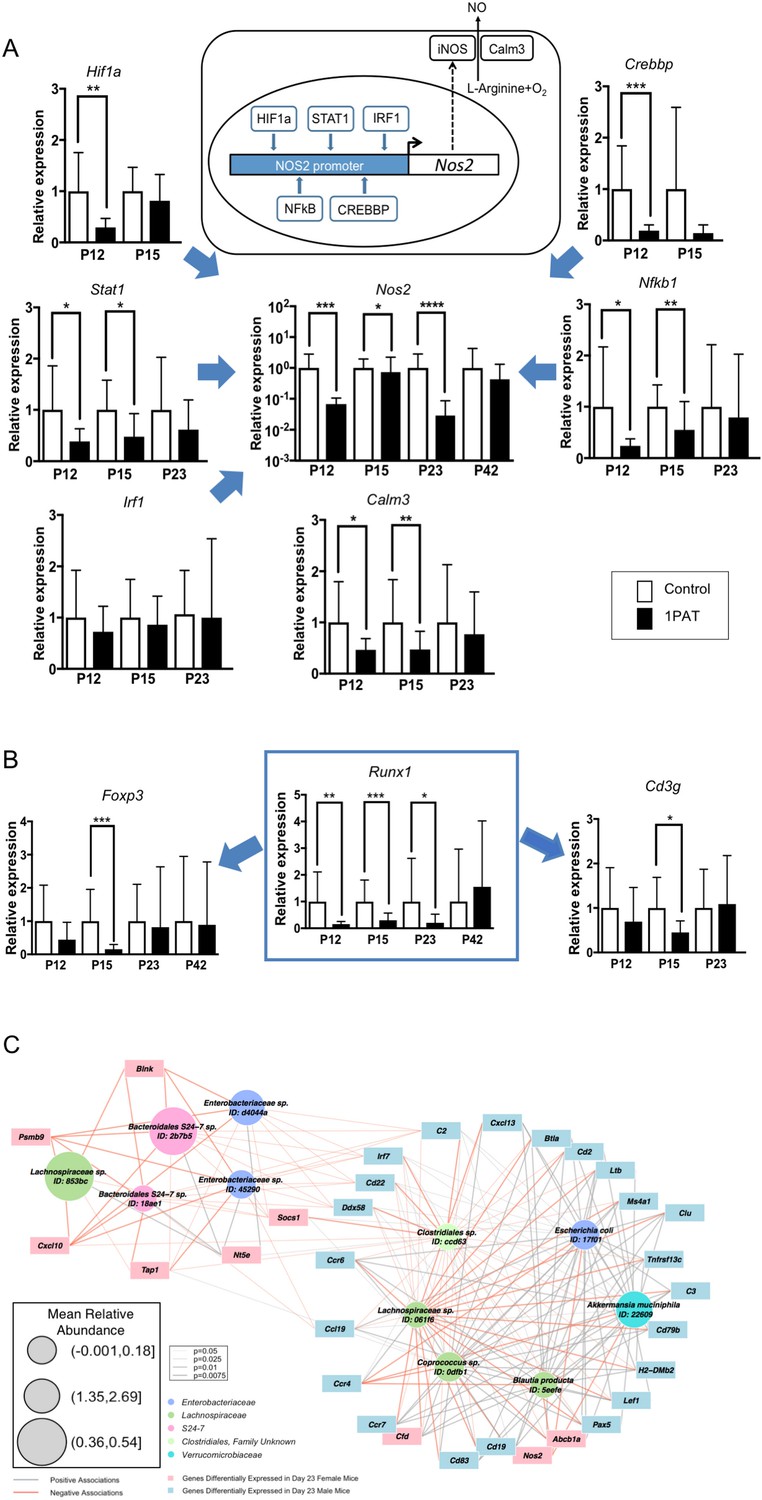
Differential effects of 1PAT on transcription of specific ileal genes in P12 to P42 mice, as determined by RT-qPCR, and microbe-host gene expression interactions.
(A) Transcription of the inducible nitric oxide synthase gene Nos2 and its upstream transcription factor genes Stat1, Nfkb1, Hif1a, Crebbp, and Irf1, as well as Nos2 partner Calm3. (B) Transcription factor Runx1 and its downstream immune genes Foxp3 and Cd3g. n = 10 ~22 samples per group, and mean values with STDEV were shown. Statistical significance determined by the Mann Whitney test. *p<0.05; **p<0.01; ***p<0.001; and ****p<0.0001. (C) CompPLS framework selecting significant associations identified differential taxa and ileal gene expression in P23 male mice. The 43 immune genes profiled by NanoString were selected as the targeted significantly differential genes, and the model found 31 (72%). Red and gray edges indicate negative and positive model-selected associations, respectively. Edge width in the network indicates statistical significance as derived from empirical p values after bootstrapping. Node sizes are scaled to the mean relative abundance for each taxon, and color-coded by OTU family. [See also Figure 6—figure supplements 1–3 and Supplementary files 3 and 4].
-
Figure 6—source data 1
Relative expression values for 10 ileal genes.
- https://doi.org/10.7554/eLife.37816.033
Figure 6—figure supplement 1
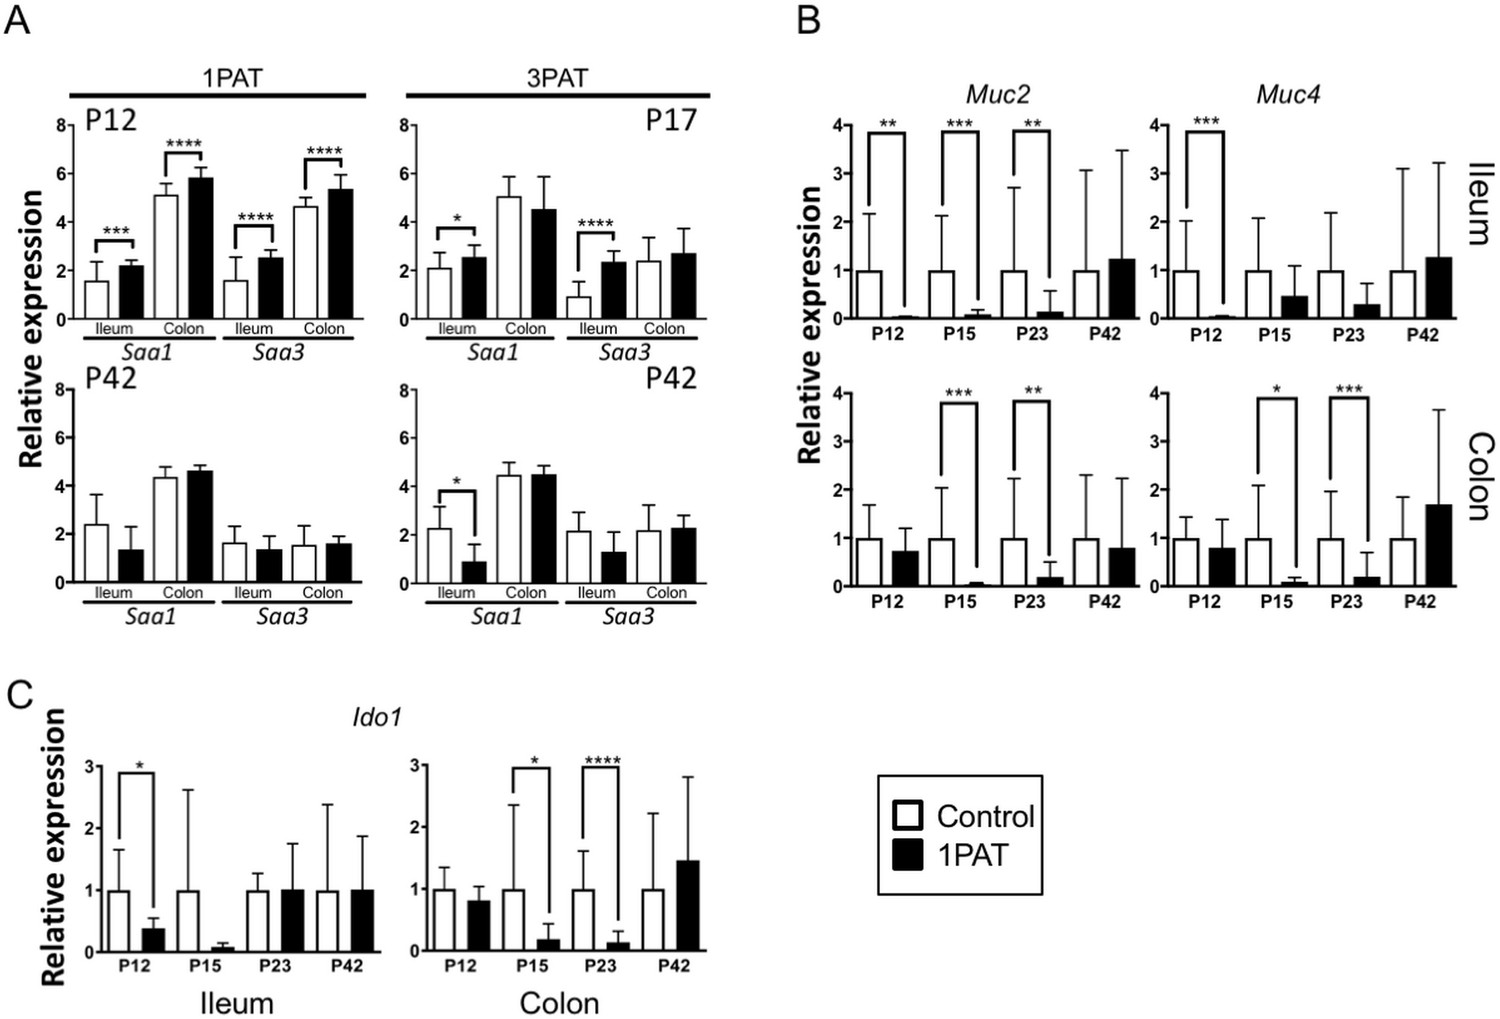
Differential effects of PAT on Saa, mucin genes, and Ido1 expression, as determined by RT-qPCR.
(A) 1PAT (left) and 3PAT (right) effects on Saa1 and Saa3 expression at P12 or P17 (upper panels) and at P42 (lower panels) in ileum and colon, compared to controls. (B) 1PAT effect on the expression of epithelial cell mucin-producing genes Muc2 (left) and Muc4 (right) in ileum (upper panels) and colon (lower panels) at P12–P42. (C) 1PAT effect on the expression of indoleamine 2,3-dioxygenase gene Ido1 in ileum (left panel) and colon (right panel). Statistical significance between 1PAT and control groups (n = 6–18 samples per group) determined by the Mann–Whitney test. *p<0.05; **p<0.01; ***p<0.001; and ****p<0.0001.
Figure 6—figure supplement 2
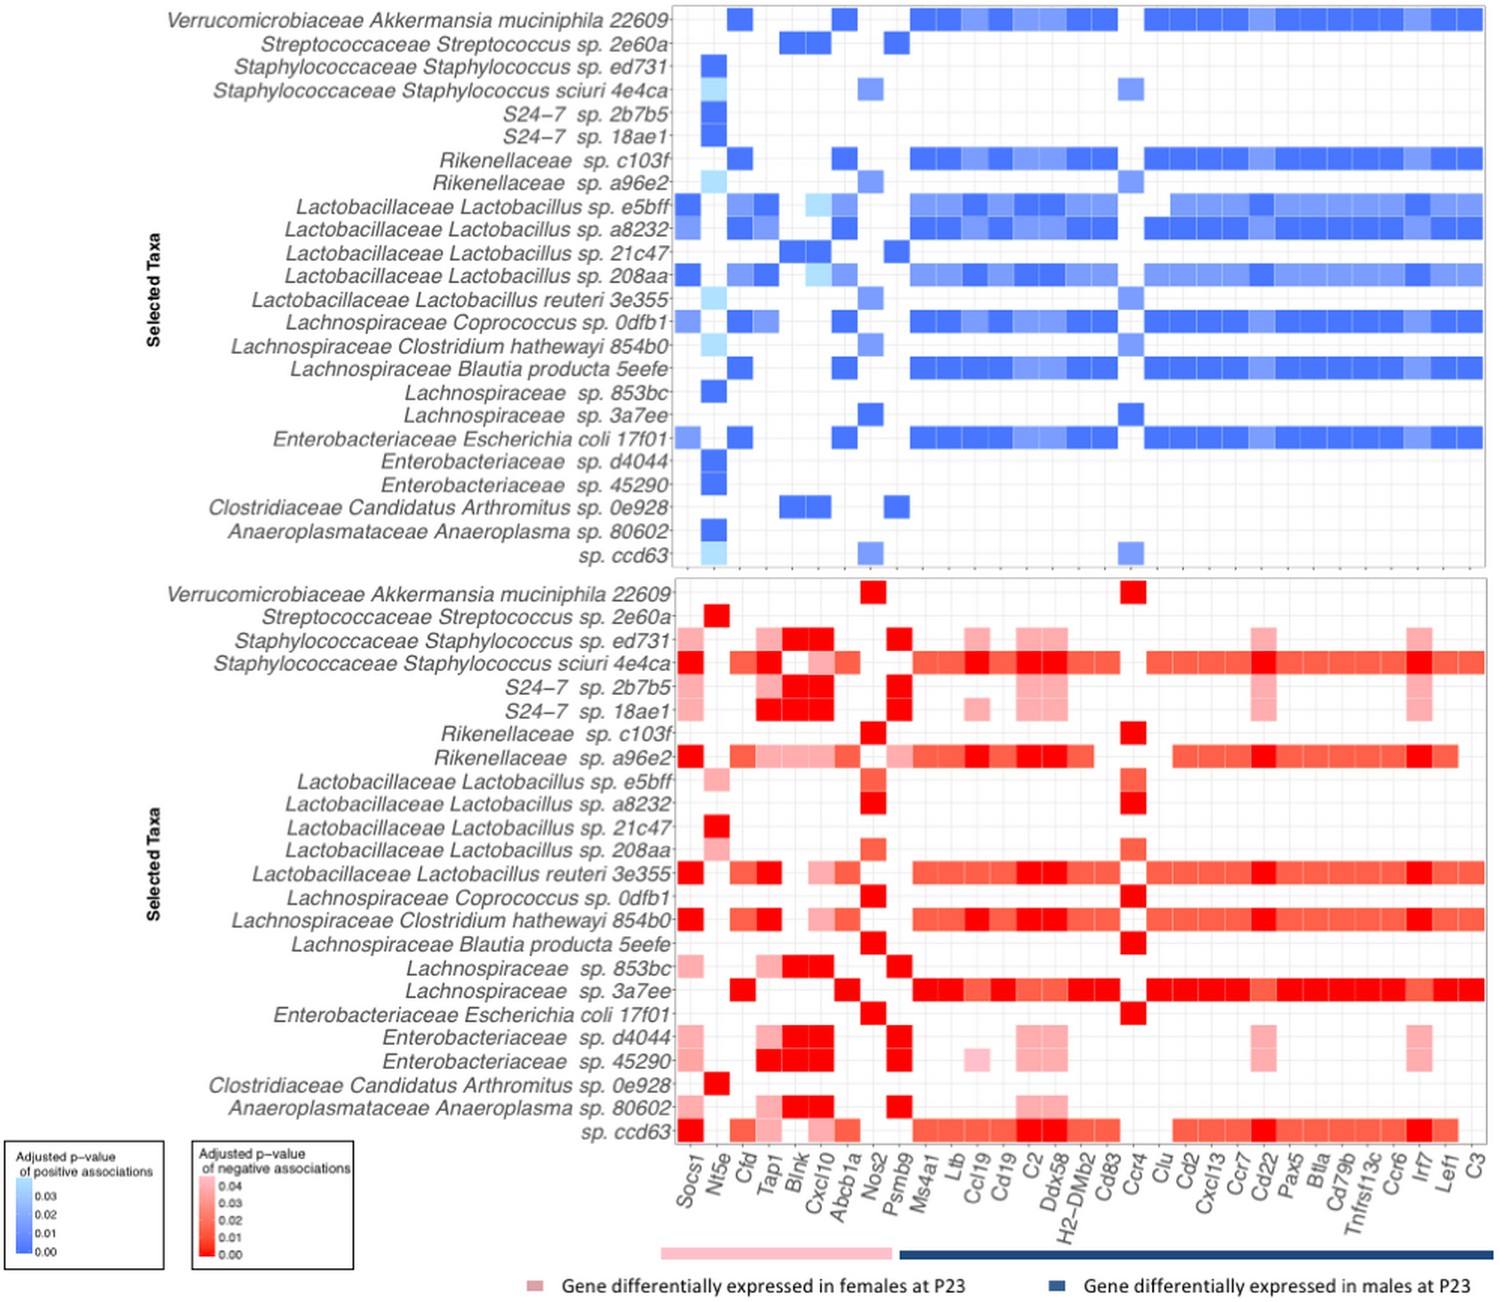
Significant associations of intestinal taxa with 31 strongly differentially expressed ileal genes in P23 PAT mice.
The heat maps show the significant positive (top panel) and negative (bottom panel) associations. The pink line indicates 9 genes specific for females and the blue line indicates the 22 genes specific for males in the network compPLS model (see Figure 6C). Shading in the heat-map reflects the p values for the associations found by the model.
Figure 6—figure supplement 3
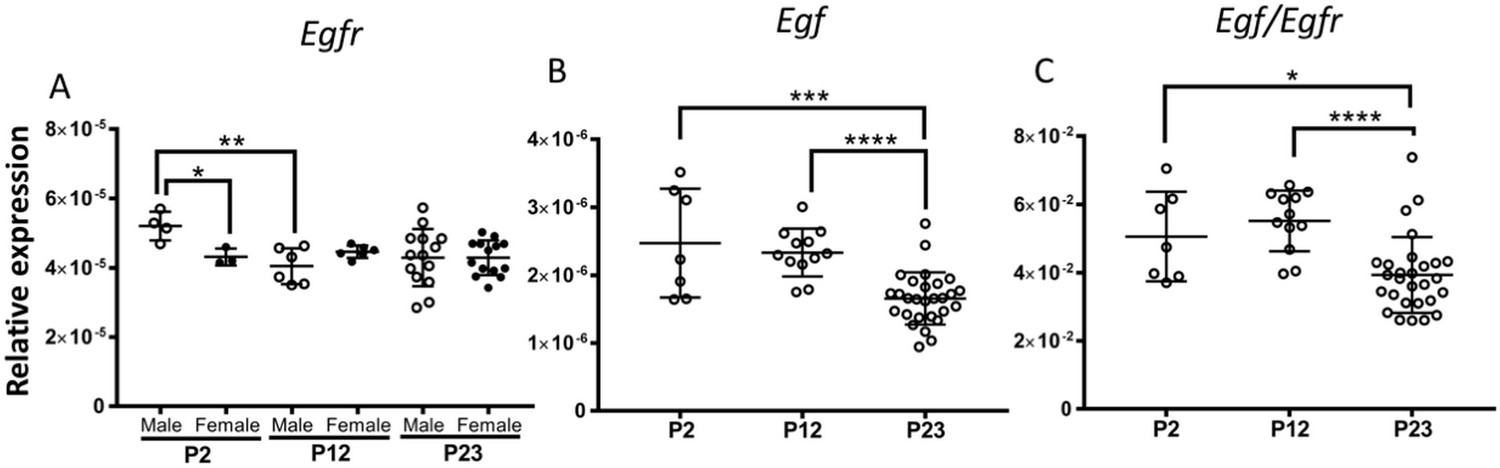
Changes in ileal Egf expression with age, either alone or as a ratio to Egfr.
Given there were no significant differences with PAT exposure (data not shown), treatment groups were combined. Panel (A). Normalized Egfr expression by age. Panel (B). Normalized Egf expression by age. Panel (C). Normalized ratio of Egf/Egfr by age. All significant p values shown, as determined by Student’s t test. All significant p values are shown: *p<0.05; **p<0.01; ***p<0.001; and ****p<0.0001.
Figure 7
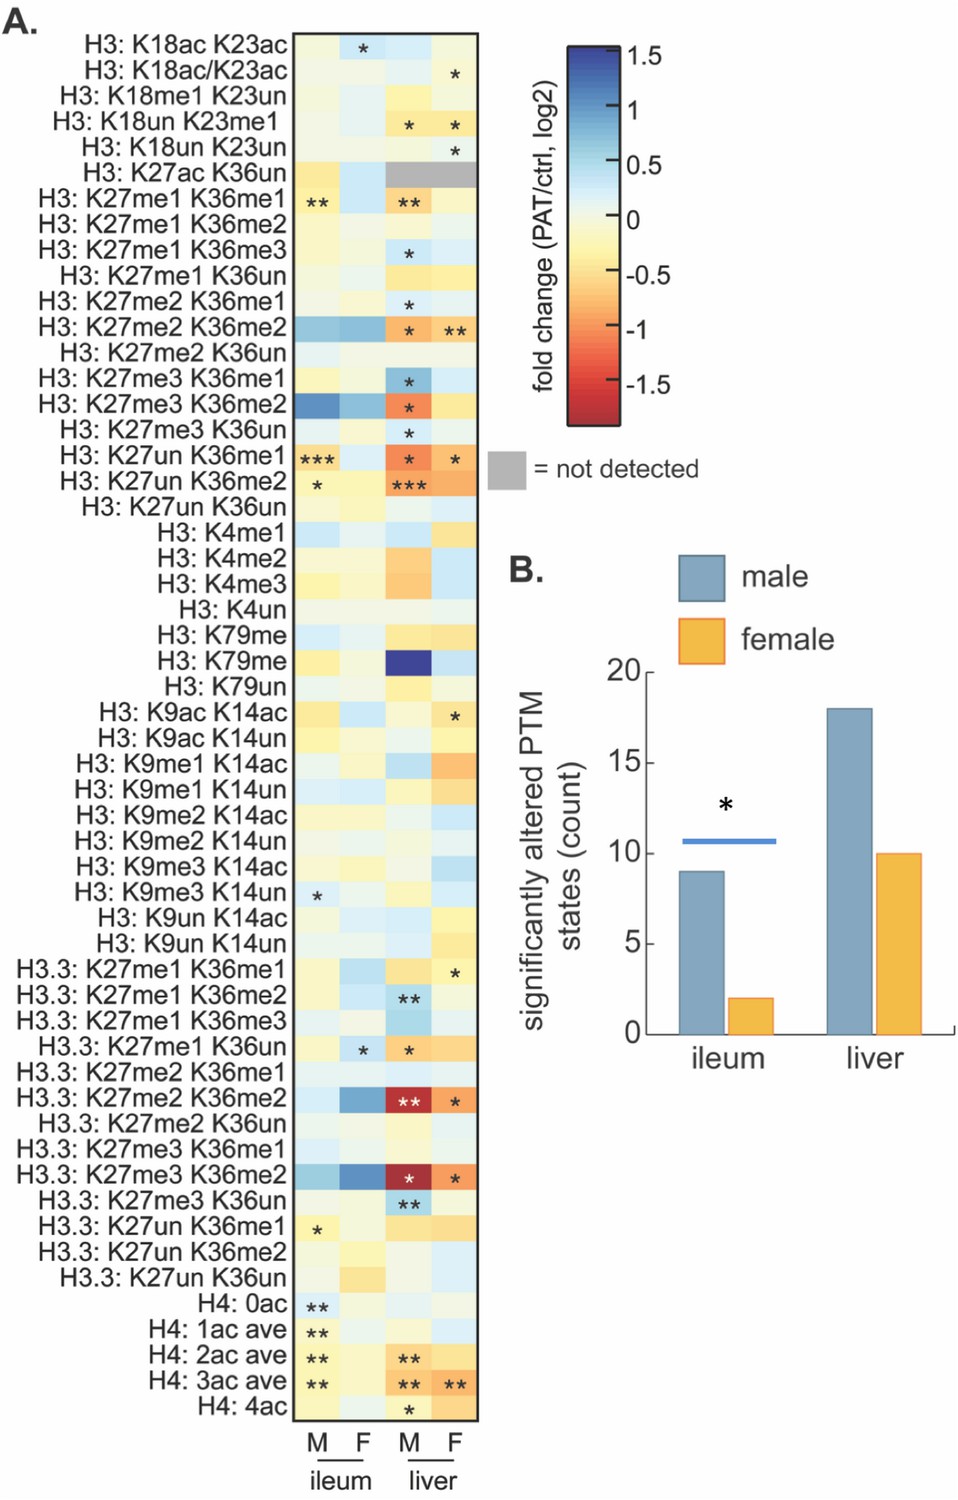
Effect of 1PAT on tissue-specific histone PTM state in P23 mice.
(A) Fold-change (log2) of 65 unique histone PTM states in male (M) and female (F) ileal and hepatic tissues. Statistical significance determined by Welch’s t test (n = 4–5 mice per group). *p<0.05, **p<0.01, and ***p<0.001. (B) Summation of significantly altered histone peptides in male and female ileum and liver; significance determined by Chi square analysis. *p<0.05. [See also Supplementary file 5].
Figure 8
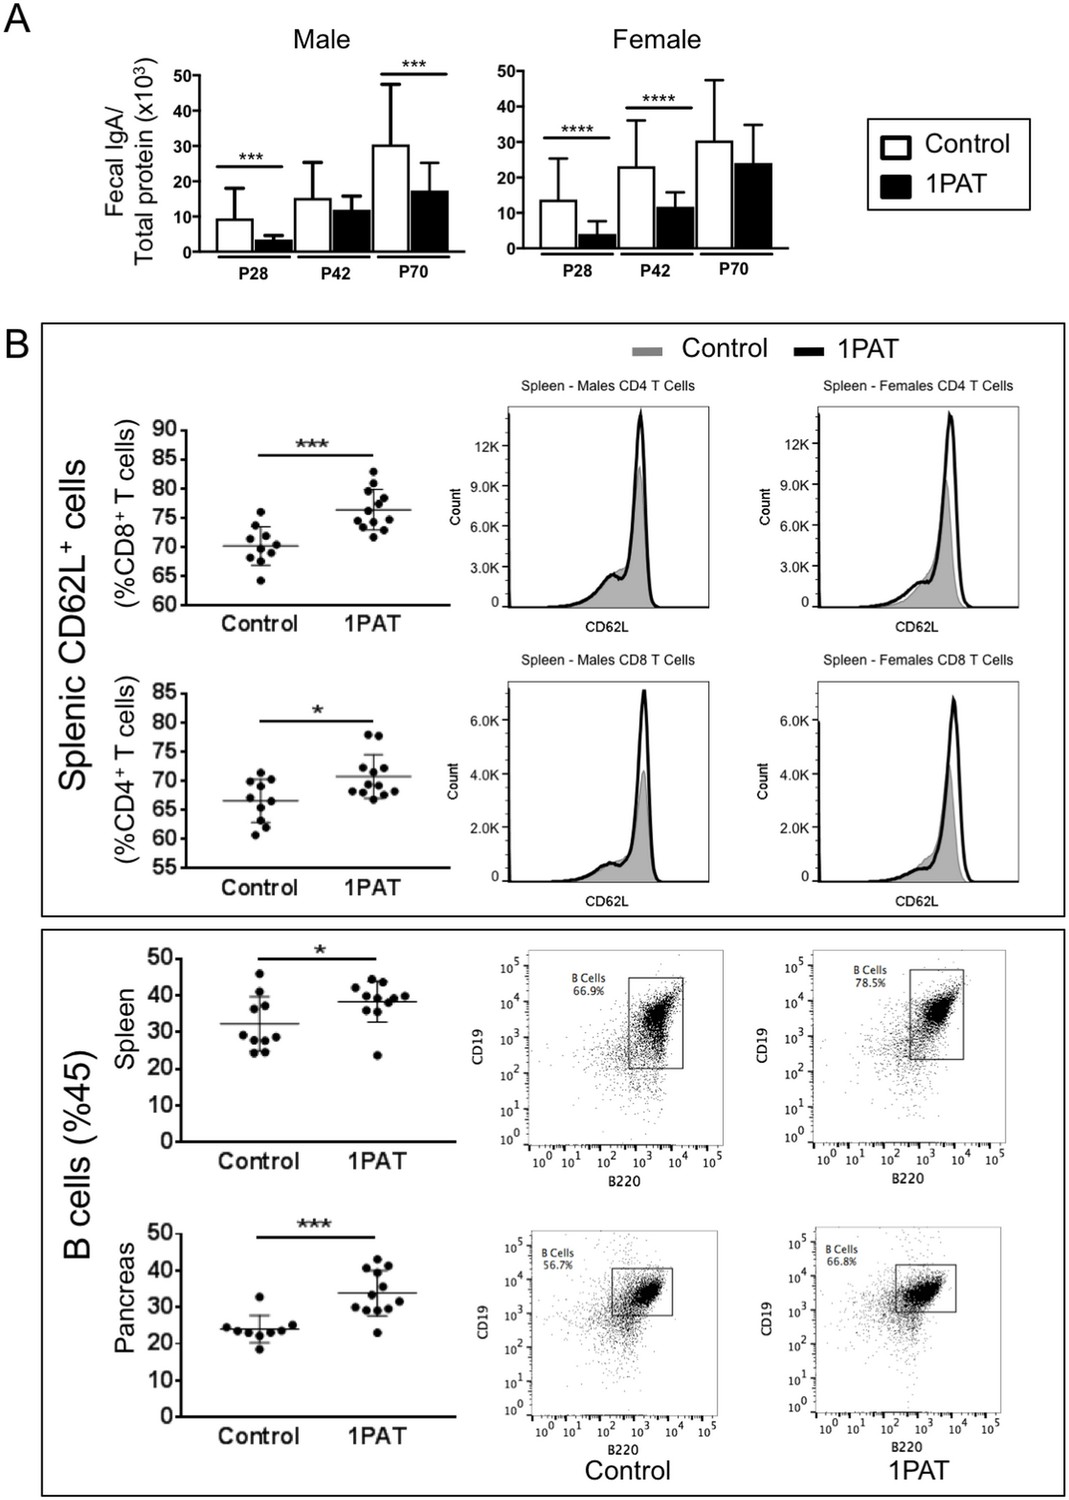
Effect of 1PAT on host immune responses.
(A) Fecal IgA levels in male and female NOD mice in 1PAT or control groups from P28 to P70, as determined by ELISA. Statistical significance, comparing 1PAT and control (n = 20–25 samples per group) was determined by the Mann Whitney test. *p<0.05; **p<0.01; ***p<0.001. (B) Flow cytometric analysis of immune cells of P42 NOD mice. 1PAT treatment significantly increased proportions of splenic memory T cells (both CD4+ CD62L+ and CD8+ CD62L+ cells) and B cells, especially in females (data not shown), and increased the proportion of B cells in the pancreas (in both males and females). Statistical significance, comparing 1PAT and control (n = 10–12 samples per group) was determined by the unpaired T test. *p<0.05; **p<0.01; ***p<0.001.
-
Figure 8—source data 1
IgA ELISA and flow cytometry data.
- https://doi.org/10.7554/eLife.37816.036
Figure 9
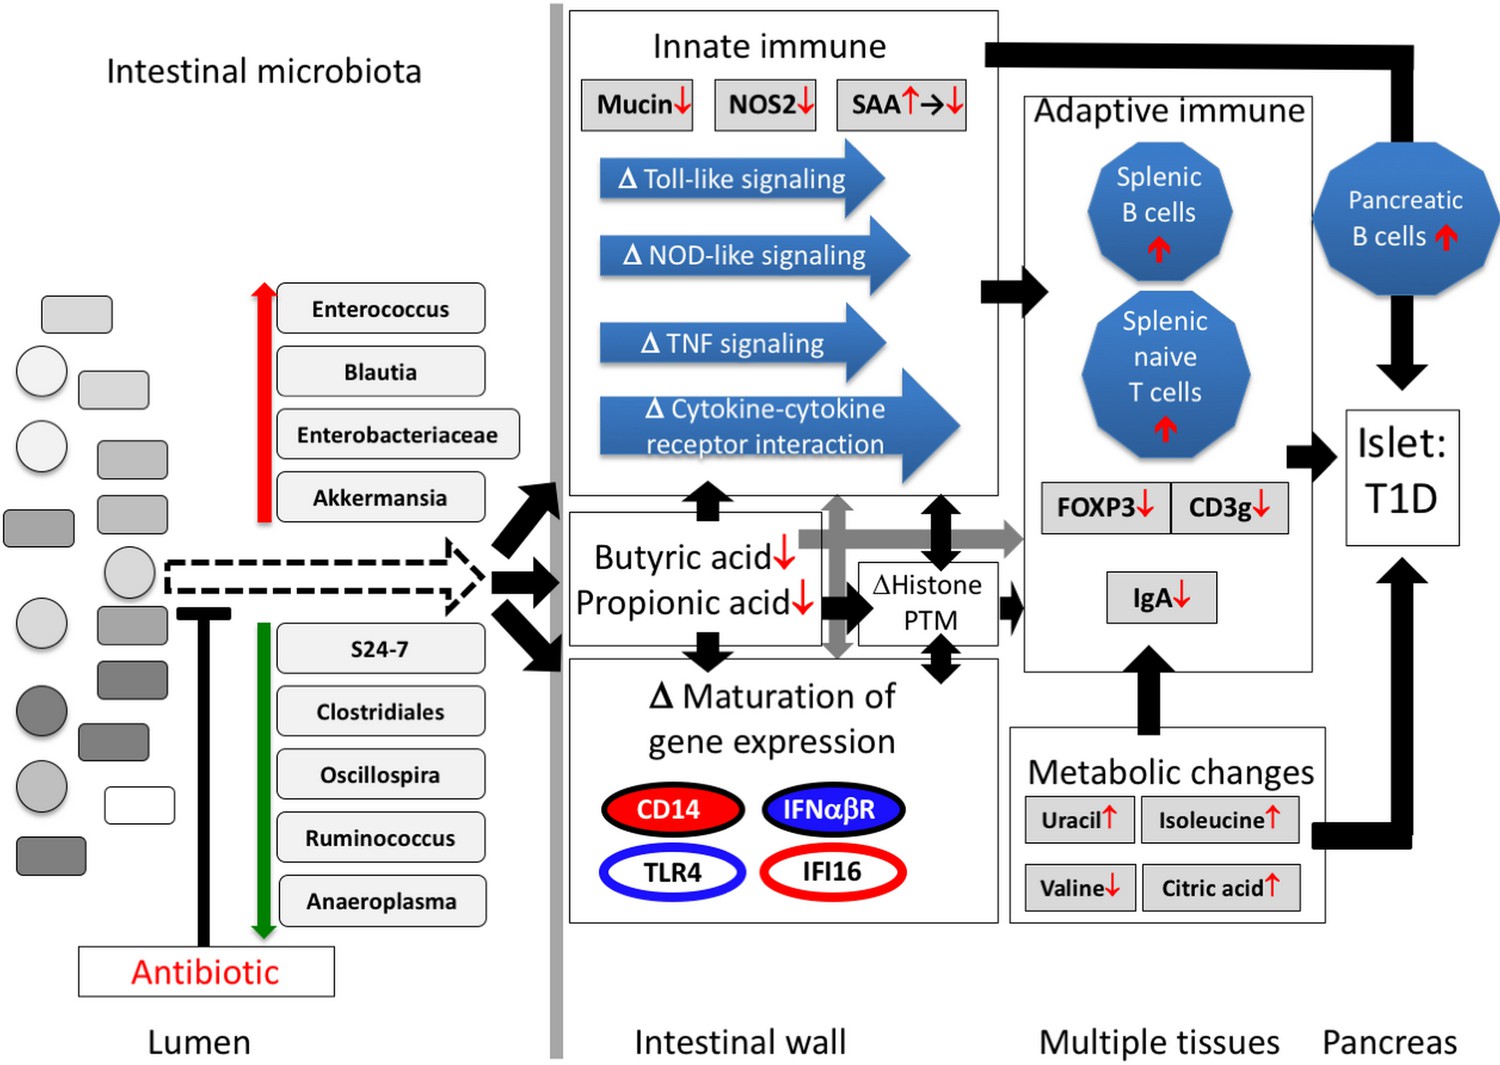
Proposed model of how a single early-life antibiotic course can perturb the microbiota/metagenome/metabolome leading to dysregulated intestinal innate and adaptive immunity to accelerate T1D in NOD mice.
For differences in maturation of gene expression, see Figure 5C legend.
Author response image 1
Tables
Key resources table
| Reagent type (species) or resource | Designation | Source or reference | Identifiers | Additional information |
|---|---|---|---|---|
| Strain (Mus musculus) background | NOD/ShiLtJ mice | Jackson Laboratory (Bar Harbor ME) | ||
| Chemical compound, drug | Tylosin tartrate | Sigma-Aldrich, Billerica MA | Cat#T6134-25G | |
| Biological sample | Mouse tissues: liver, pancreas, serum; ileum; colon | This paper | ||
| Biological sample | Mouse microbiota samples: fecal cecal contents, ileal contents | This paper | ||
| Antibody | CD45 BV650 | BioLegend | 30-F11 | |
| Antibody | CD3 AF700 | BioLegend | 17A2 | |
| Antibody | CD8a PacificBlue | BioLegend | 53–6.7 | |
| Antibody | CD4 AF488 | BD BioSciences | RM4-5 | |
| Antibody | CD19 PE-Cy7 | BioLegend | 6D5 | |
| Antibody | B220 PerCPCy5.5 | BioLegend | RA3-6B2 | |
| Antibody | CD44 PE-Dazzle 594 | BioLegend | IM7 | |
| Antibody | CD62L BV570 | BioLegend | MEL-14 | |
| Sequence-based reagent | PCR primer pairs | See Supplementary file 7 | ||
| Commercial assay or kit | FreeStyle Lite meter/blood lgucose test strips | Abbott Diabetes Care Inc., Abbott Park IL | Cat#99073070822 | |
| Commercial assay or kit | PowerLyzer PowerSoil DNA Isolation Kit | MoBio, Carlsbad CA | Cat#12855–100 | |
| Commercial assay or kit | PowerSoil-htp 96 Well Soil DNA Isolation Kit | MoBio, Carlsbad CA | Cat#12955–4 | |
| Commercial assay or kit | PureLink RNA Mini Kit | Invitrogen, Carlsbad CA | Cat#12183020 | |
| Commercial assay or kit | nCounter GX mouse immunology kit | NanoString Technologies, Seattle WA | Cat#XT-CSO-MIM1-12 | |
| Commercial assay or kit | Verso cDNA Synthesis kit | Thermo Scientific, Waltham MA | Cat#AB1453A | |
| Commercial assay or kit | SYBR Green PCR Master mix | Roche, Branchburg NJ | Cat#12183020 | |
| Commercial assay or kit | mouse IgA ELISA kit | Bethyl, Montgomery TX | Cat#E90-103 | |
| Commercial assay or kit | BCA Protein Assay Kit | Thermo Scientific, Waltham MA | Cat#23225 | |
| Commercial assay or kit | Counting Beads | ThermoFisher | CountBright Absolute Counting Beads; C36950 | |
| Software, algorithm | compPLS | DOI: 10.1186/s13073- 016-0297-9 | https://github.com/zdk123/compPLS | |
| Software, algorithm | SHI7 | PMID: 29719872 | https://github.com/knights-lab/shi7 | |
| Software, algorithm | ‘custom Python and C code’ | DOI:10.5281/zenodo. 1208675 | https://github.com/RRShieldsCutler/clusterpluck | |
| Software, algorithm | QIIME2 | doi:10.1186/s40168- 018-0470-z | https://github.com/qiime2/q2-feature-classifier | |
| Software, algorithm | HUMAnN2 v0.9.5 | doi: 10.1371/journal. pcbi.1002358 | RRID:SCR_014620 | http://huttenhower.sph.harvard.edu/humann |
| Software, algorithm | STAR v2.5.2b | doi: 10.1093/bioinformatics/ bts635 | ||
| Software, algorithm | Ingenuity Pathway Analysis | IPA, QIAGEN Redwood City | RRID:SCR_008653 | http://www.ingenuity.com |
| Software, algorithm | lmer4 | Bates et al. | https://cran.r-project.org/web/packages/lme4/index.html | |
| Software, algorithm | FlowJo v10.2 | Tree Star Inc., Ashland OR | RRID:SCR_008520 | |
| Other |
Additional files
-
Supplementary file 1
Microbial metabolic pathways significantly differentiated by 1PAT based on metagenomic analysis.
- https://doi.org/10.7554/eLife.37816.038
-
Supplementary file 2
List of metabolites differentially regulated by 1PAT in serum and liver early in life.
- https://doi.org/10.7554/eLife.37816.039
-
Supplementary file 3
Lists of ileal genes differentially expressed by 1PAT at P23 in males and females, based on RNA-Seq analysis.
- https://doi.org/10.7554/eLife.37816.040
-
Supplementary file 4
Lists of ileal immune genes differentially expressed from P12-P23 and P23-P42 in control and 1PAT males.
- https://doi.org/10.7554/eLife.37816.041
-
Supplementary file 5
Data of hepatic and ileal histone PTM state analysis.
- https://doi.org/10.7554/eLife.37816.042
-
Supplementary file 6
Ileal immune genes significantly differentially expressed between 1PAT and control in P23 male and female NOD mice.
- https://doi.org/10.7554/eLife.37816.043
-
Supplementary file 7
List of primer sequences used for RT-qPCR analysis.
- https://doi.org/10.7554/eLife.37816.044
-
Transparent reporting form
- https://doi.org/10.7554/eLife.37816.045
Download links
A two-part list of links to download the article, or parts of the article, in various formats.
Downloads (link to download the article as PDF)
Open citations (links to open the citations from this article in various online reference manager services)
Cite this article (links to download the citations from this article in formats compatible with various reference manager tools)
Antibiotic-induced acceleration of type 1 diabetes alters maturation of innate intestinal immunity
eLife 7:e37816.
https://doi.org/10.7554/eLife.37816


