A stochastic epigenetic switch controls the dynamics of T-cell lineage commitment
- University of Washington, United States
- California Institute of Technology, United States
- Drexel University, United States
- Howard Hughes Medical Institute, California Institute of Technology, United States
Figures
Figure 1 with 1 supplement
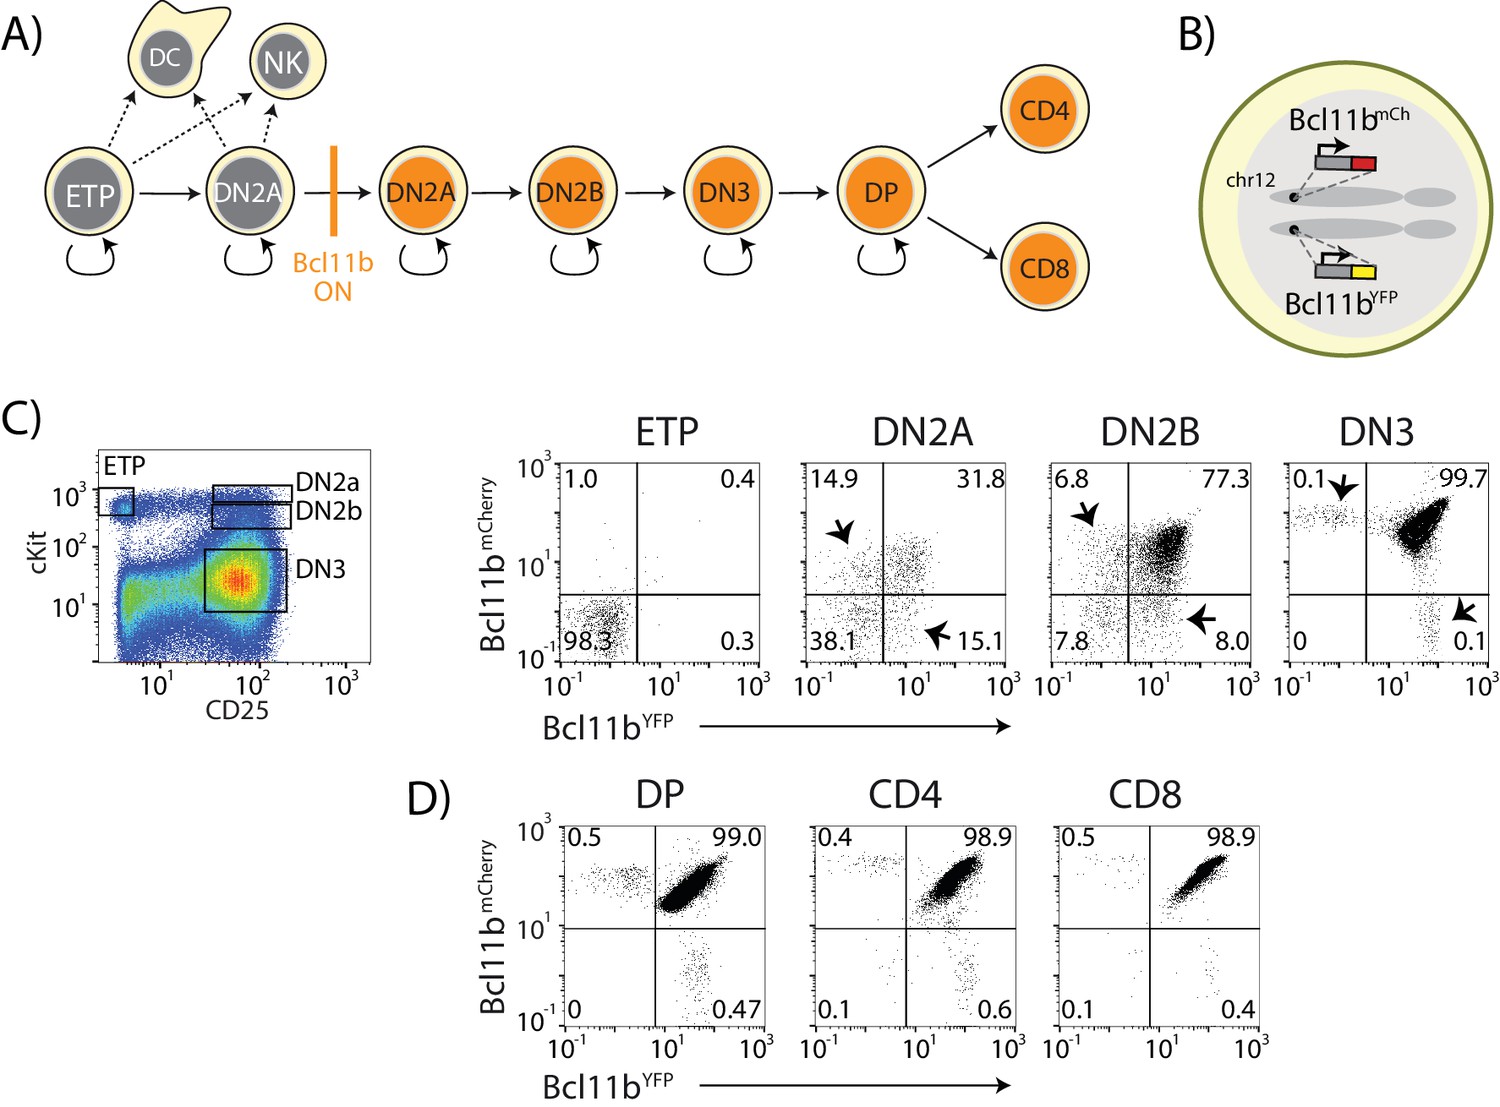
Dual-color Bcl11b reporter strategy can reveal epigenetic mechanisms controlling T-cell lineage commitment.
(A) Overview of early T-cell development. Bcl11b turns on to silence alternate fate potentials and drive T-cell fate commitment. ETP – early thymic progenitor; DN2 – CD4- CD8-double negative-2A progenitor; DP – CD4+ CD8+; NK – natural killer; DC – dendritic cell. (B) Dual-allelic Bcl11b reporter cells, where two distinguishable fluorescent proteins (YFP and mCherry) are inserted non-disruptively into the same sites on the two endogenous Bcl11b loci. (C) Flow cytometry plots show cKit versus CD25 levels in CD4-CD8- double negative (DN) thymic progenitors (left), along with Bcl11b-YFP versus Bcl11b-mCh expression levels in the indicated DN progenitor subsets from dual Bcl11b reporter mice. Arrowheads indicate cells expressing one copy of Bcl11b. (D) Flow plots show Bcl11b-YFP versus Bcl11b-mCh levels in CD4+CD8+double positive (DP) T-cell precursors from the thymus (left), or CD4 (center) or CD8 (right) T-cells from the spleen. Results are representative of analysis of 6–8 mice from two independent experiments. See also Figure 1—figure supplement 1.
Figure 1—figure supplement 1

Experimental strategy for generating different Bcl11b reporter mouse strains.
The two Bcl11b loci were targeted in embryonic stem (ES) cells using homologous recombination, followed by drug selection using the indicated drug-resistance markers (vertical arrows). ES cells were then injected into blastocysts (horizontal arrows) to generate the indicated mice. These mice were subsequently bred to generate the appropriate two-color mice for experiments (see Materials and methods). To generate the enhancer disrupted ES cells, the dual-color tagged ES line was retargeted with a deletion construct including a selectable hygromycin resistance gene (hyg). Cells with the correct insertion were then used to generate mice.
Figure 2 with 1 supplement
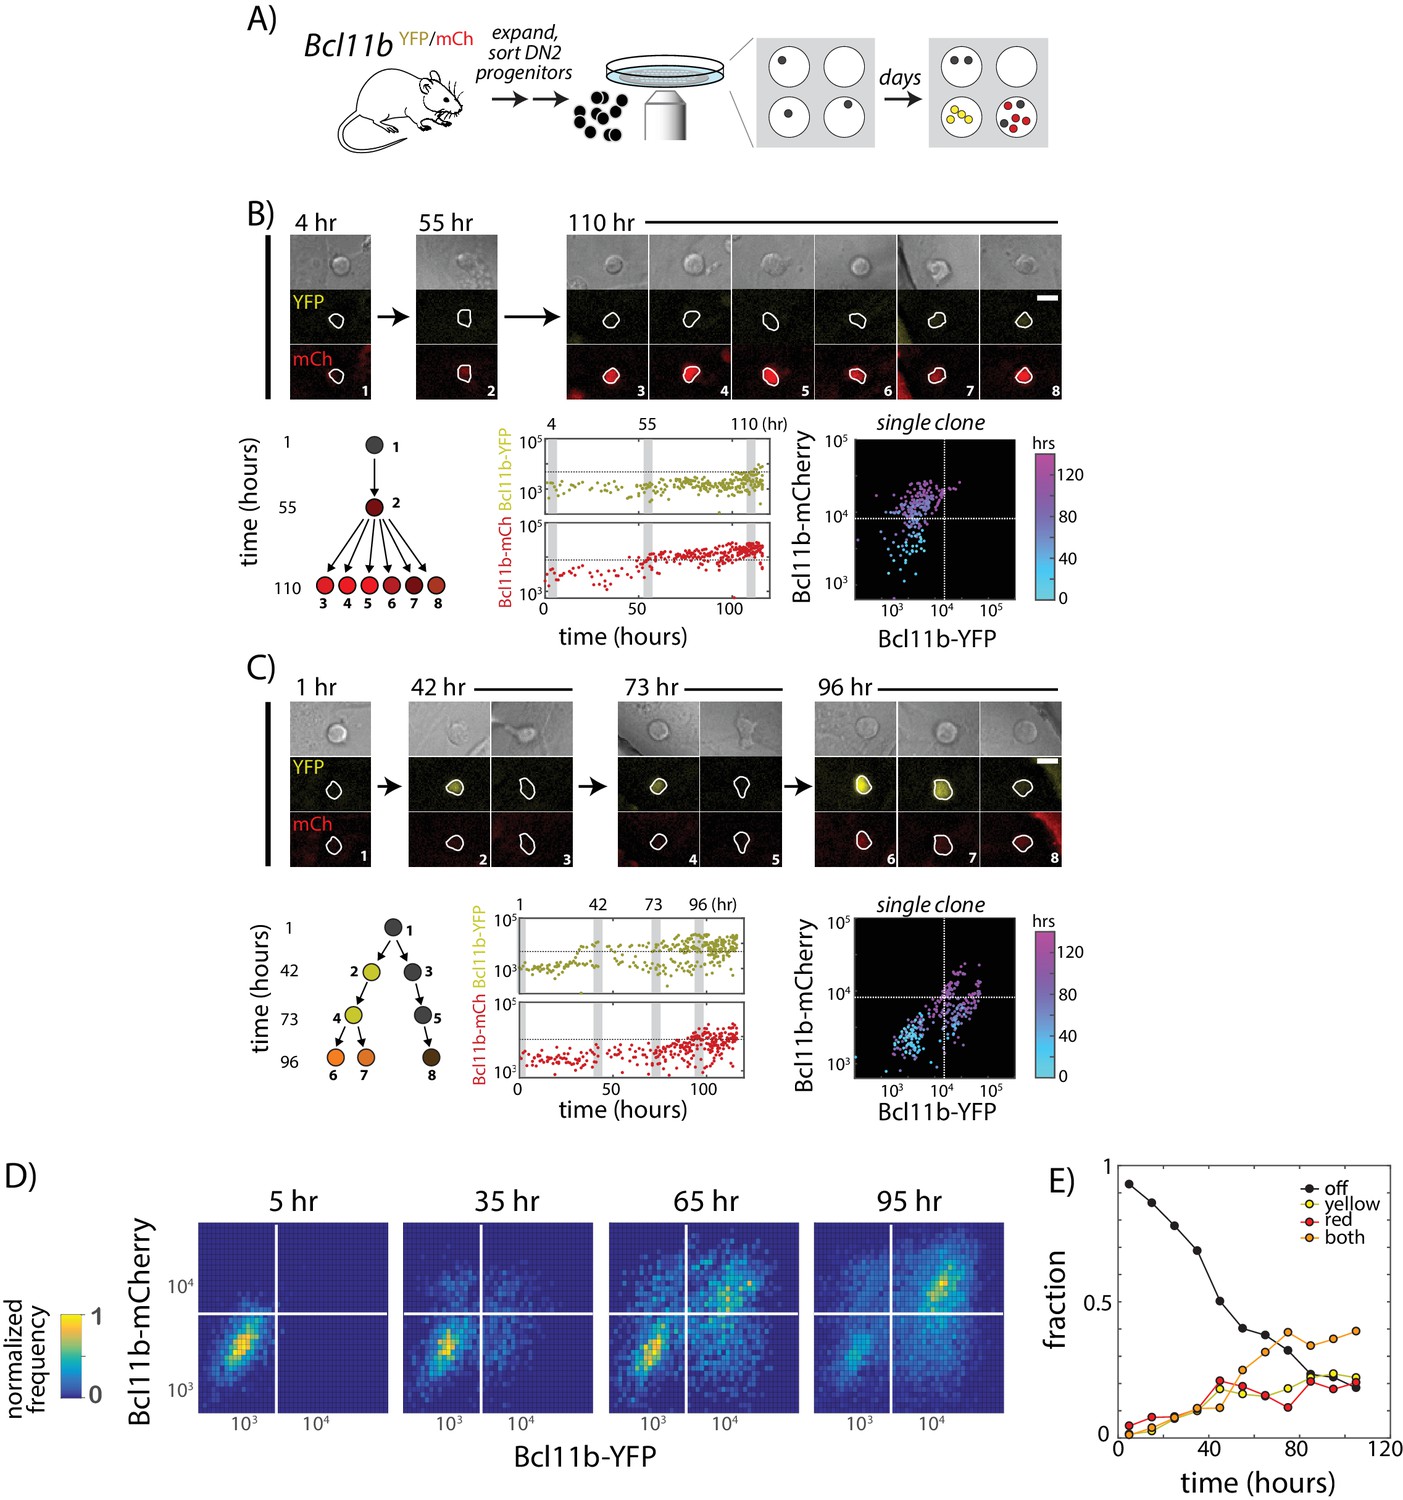
Two copies of Bcl11b switch on independently and stochastically in the same cell in single lineages of T-cell progenitors.
(A) Bcl11b-negative DN2 cells derived from bone-marrow progenitors were isolated by flow cytometry, cultured within microwells, and followed for 5 days using fluorescence imaging. Cells were then segmented using automated image analysis. (B–C). Dynamics of Bcl11b activation in two representative clonal progenitor lineages. Timelapse images (top) show developing T-cell progenitors from two representative clones (left), with segmented cell boundaries in white. Numbers (top left) indicate time in hours. Scale bar = 10 microns. Trees (bottom left) show coarse-grained cell lineage relationships for the cells shown here. Plots (center, lower rows) show Bcl11b-YFP and Bcl11b-mCh expression time traces in all cells from a single clone, with vertical gray bars indicating the time points of the image shown on the left. Horizontal lines indicate activation threshold. Colored scatterplots (bottom right) show time evolution of Bcl11b-mCh versus Bcl11b-YFP levels in single clones, from 0 hr (cyan) to 120 hr (purple). (D) Heat maps show Bcl11b-YFP and Bcl11b-mCh distributions in the polyclonal population at the indicated time points. White lines represent Bcl11b expression thresholds. Color bar (left) represents normalized cell numbers at each time point. (E) Fractions of cells having different Bcl11b allelic expression states over time, obtained by mixed Gaussian fitting of the heat maps shown. Data represent a cohort of ~200 starting cells from a single timelapse movie. Overall, data show that Bcl11b switches on slowly and stochastically in single lineages of progenitors, maintaining alternate activity states in the same clone, heritable across many divisions. Results are representative of three independent experiments. See also Figure 2—figure supplement 1 and Video 1.
-
Figure 2—source data 1
Differential Bcl11b allelic expression states over time for a cohort of ~200 starting cells.
File contains a table of the fractions of mono-, bi-allelic, and non-expressing Bcl11b cells sampled at various time points over 105hrs. This data is plotted in Figure 2E.
- https://doi.org/10.7554/eLife.37851.006
Figure 2—figure supplement 1
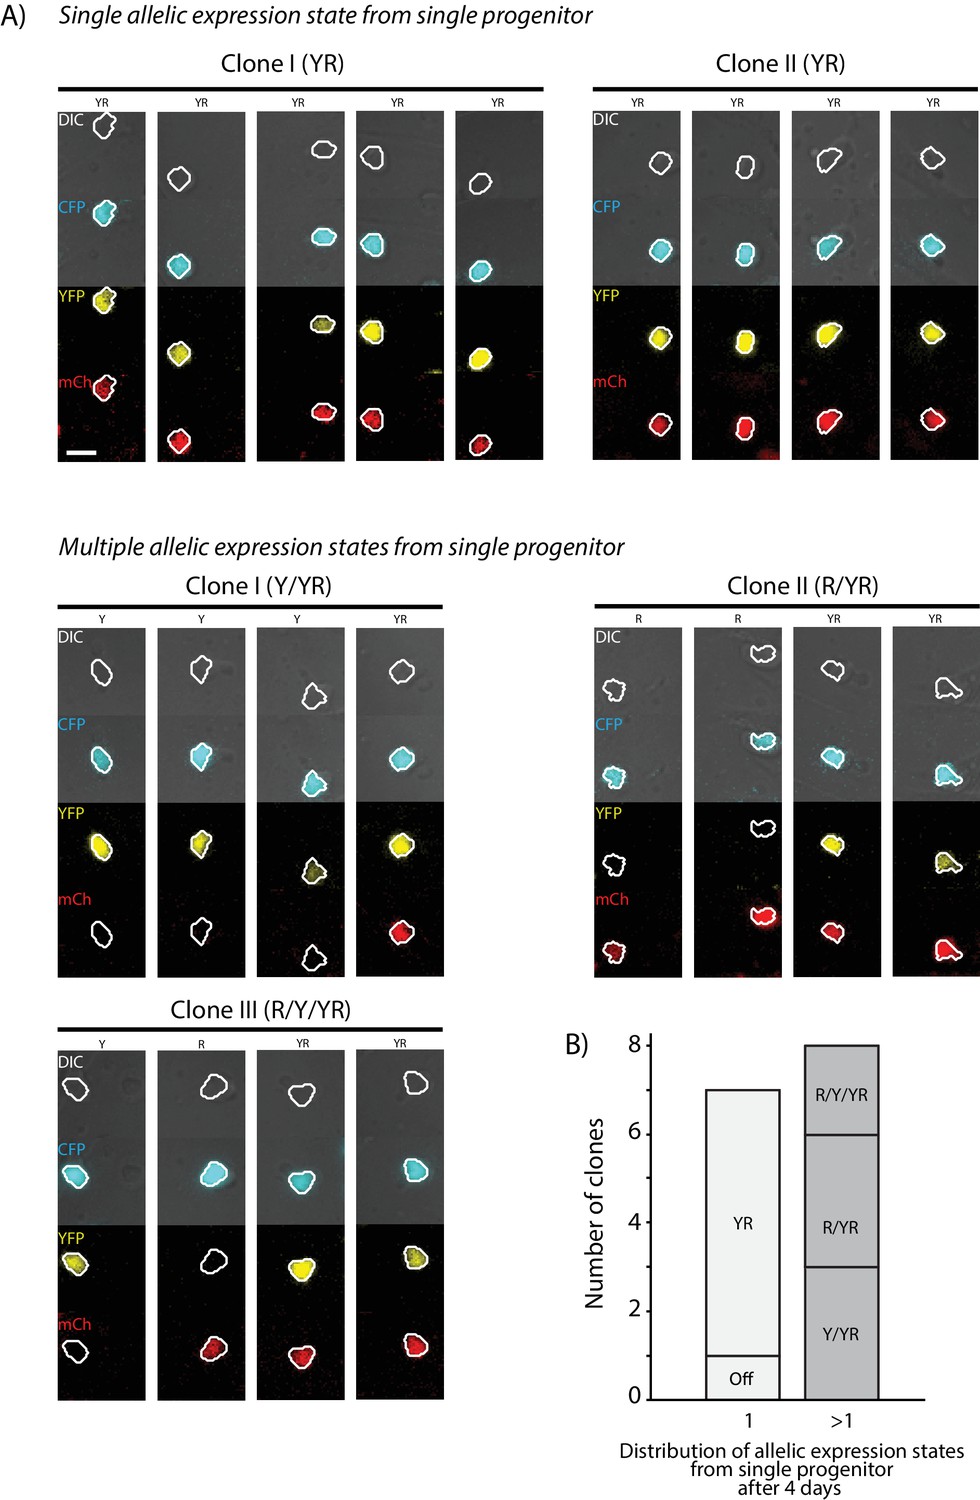
Bcl11b shows heterogeneity in locus activation within clonal progenitor lineages.
Bone-marrow-derived Bcl11b-YFP-mCherry- DN2 progenitors were sorted, seeded on OP9-DL1 monolayers within PDMS micro-well arrays, and continuously observed using long-term timelapse imaging. Microwells seeded with single proliferating cell clones were identified, and Bcl11b activation states of descendants were then analyzed after 4 days. (A) Timelapse images show DIC (gray), YFP (yellow) and mCherry (red) fluorescence of cells descended from single progenitors. Each row represents cells within a single microwell. Images were taken between 105 and 115 hr after onset of imaging. Scale bar represents 10 microns. (B) Stacked bar chart shows the range of Bcl11b activation states observed for clonal descendants after 4 days. Left bar indicates clones where cells were all found in the same activation state; right bar gives clones with multiple activation states observed within a single clone.
Figure 3 with 4 supplements
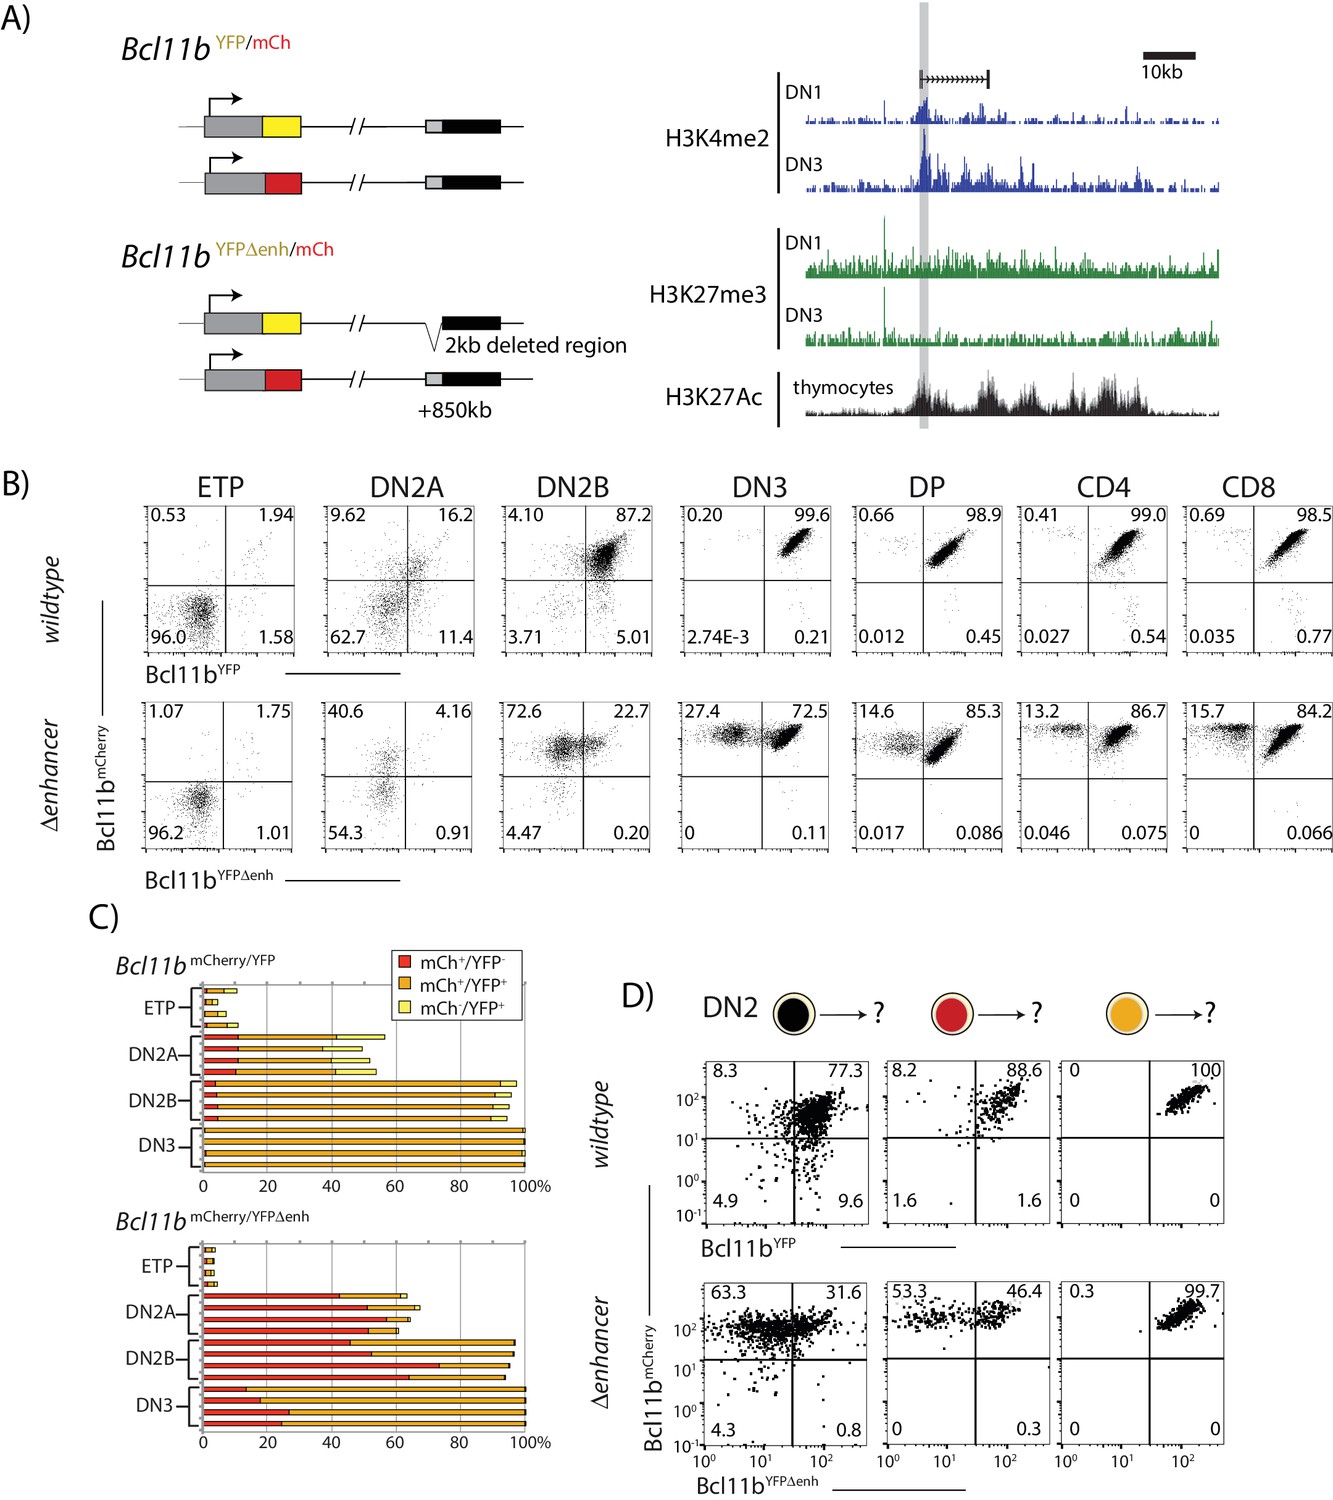
A distal enhancer region controls Bcl11b activation probability.
(A) Schematic of normal and enhancer-deleted two-color Bcl11b reporter strains (left). Genome browser plots (right), showing +850 kb enhancer of Bcl11b, showing distributions of histone marks (H3K4me2, H3K27me3, and H3K27Ac) and an associated LncRNA (Isoda et al., 2017). Orientation is with transcription from left to right (reversed relative to genome numbering). Gray shaded area indicates the enhancer region deleted using gene targeting (removed region: chr12:108,396,825–108,398,672, mm9). (B) Flow cytometry plots show Bcl11b-mCh versus Bcl11b-YFP levels in developing T-cell populations from dual Bcl11b reporter mice, either with an intact YFP enhancer (top), or a disrupted YFP enhancer (bottom). Results are representative of two independent experiments. (C) Bar graphs showing the percentages of cells in early thymic populations with mono- and bi-allelic expression of wildtype mCherry and wildtype YFP versus mutant YFP alleles in wildtype Bcl11bYFP/mCh and Bcl11bYFPΔEnh/mCh dual reporter mice, demonstrating the reduced frequency of mutant YFP allele expression relative to the wildtype mCherry allele in the same cells. Each bar shows results from one mouse; n = 4 mice of each strain are shown. (D) DN2 progenitors were sorted for different Bcl11b allelic activation states as indicated, cultured on OP9-DL1 monolayers for 4 days, and analyzed using flow cytometry. Flow plots show Bcl11b-mCh versus Bcl11b-YFP levels of cells generated from precursors with a normal (top) or disrupted (bottom) YFP enhancer, showing defective YFP up-regulation from the mutant relative to the wildtype alleles. Enhancer disruption reduces the probability of switch-like Bcl11b activation, but does not affect expression levels after activation. Results are representative of two independent experiments. See also Figure 1—figure supplement 1, and Figure 3—figure supplement 1–4.
-
Figure 3—source data 1
Comparison of Bcl11b allelic expression between wildtype and mutant dual reporter mice in early thymic populations.
Data gives the population percentages of mono- and bi-allelic expressing cells for early thymic populations analyzed using flow cytometry. 4 biological replicates of each strain (wildtype and enhancer deleted) are presented. Bar graphs in Figure 3C are generated from this data.
- https://doi.org/10.7554/eLife.37851.016
Figure 3—figure supplement 1
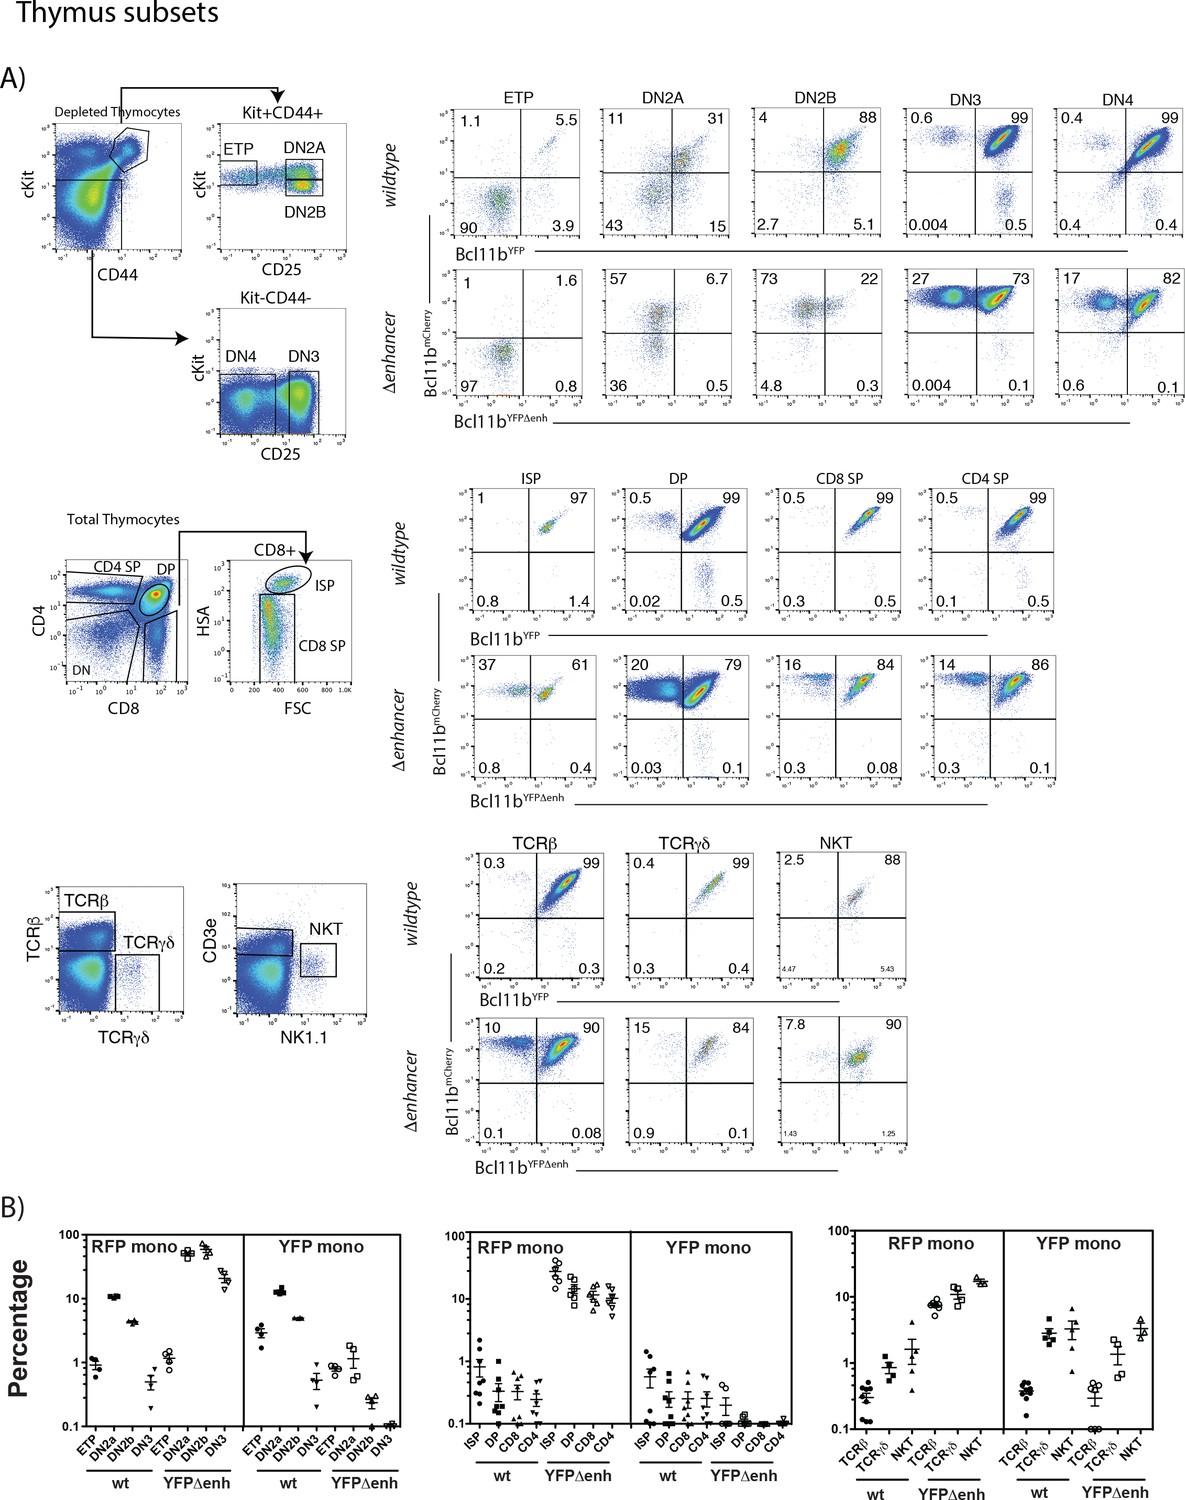
Levels of mono-allelic Bcl11b expression in thymus subsets: mono-allelic expression can persist throughout thymic development.
(A) Representative flow cytometry plots showing gating strategies for thymic subsets and two-color Bcl11b expression in these populations from Bcl11bYFP/mCh(neo) (wildtype) or Bcl11bYFPΔEnh/mCh(neo) (Δenhancer) mice. DN subsets were enriched by magnetic bead depletion of mature thymic cells before staining and analysis. (B) Percentages of cells expressing only mCherry (RFP mono) or YFP (YFP mono) in specific T cell populations from Bcl11bYFP/mCh(neo) (wt) or Bcl11bYFPΔEnh/mCh(neo) (YFPΔenh) mice. Each symbol represents results from an individual mouse (n = 4 to 6 mice per group). This figure shows that although bi-allelic expression predominates, mono-allelic expression of both YFP and mCherry wildtype alleles persist in some cells throughout intrathymic development. Furthermore, the YFPΔenh mutant dramatically increases the percentage of cells expressing only the mCherry (wildtype) allele due to failure to activate the mutant allele. However, the level of mono-allelic expression seen decreases generally over development of CD4 and CD8 SP αβ T cells and is slightly higher among TCRγδ+ and NKT cells relative to conventional TCRβ+ cells, possibly consistent with additional selection events.
-
Figure 3—figure supplement 1—source data 1
Percentages of mono- and bi-allelic expressing cells in specific thymic populations analyzed for wildtype (Bcl11bYFP/mCh(neo)) and mutant (Bcl11bYFPΔEnh/mCh(neo)) dual reporter mice.
Thymic populations were analyzed using flow cytometry according to the representative plots shown in Figure 3—figure supplement 1A, and percentages of cells with mono- and bi-allelic expression are shown. 4-6 biological replicates of each strain are presented. Plots in Figure 3—figure supplement 1B are generated from percentages of mono-expressing cells only.
- https://doi.org/10.7554/eLife.37851.010
Figure 3—figure supplement 2
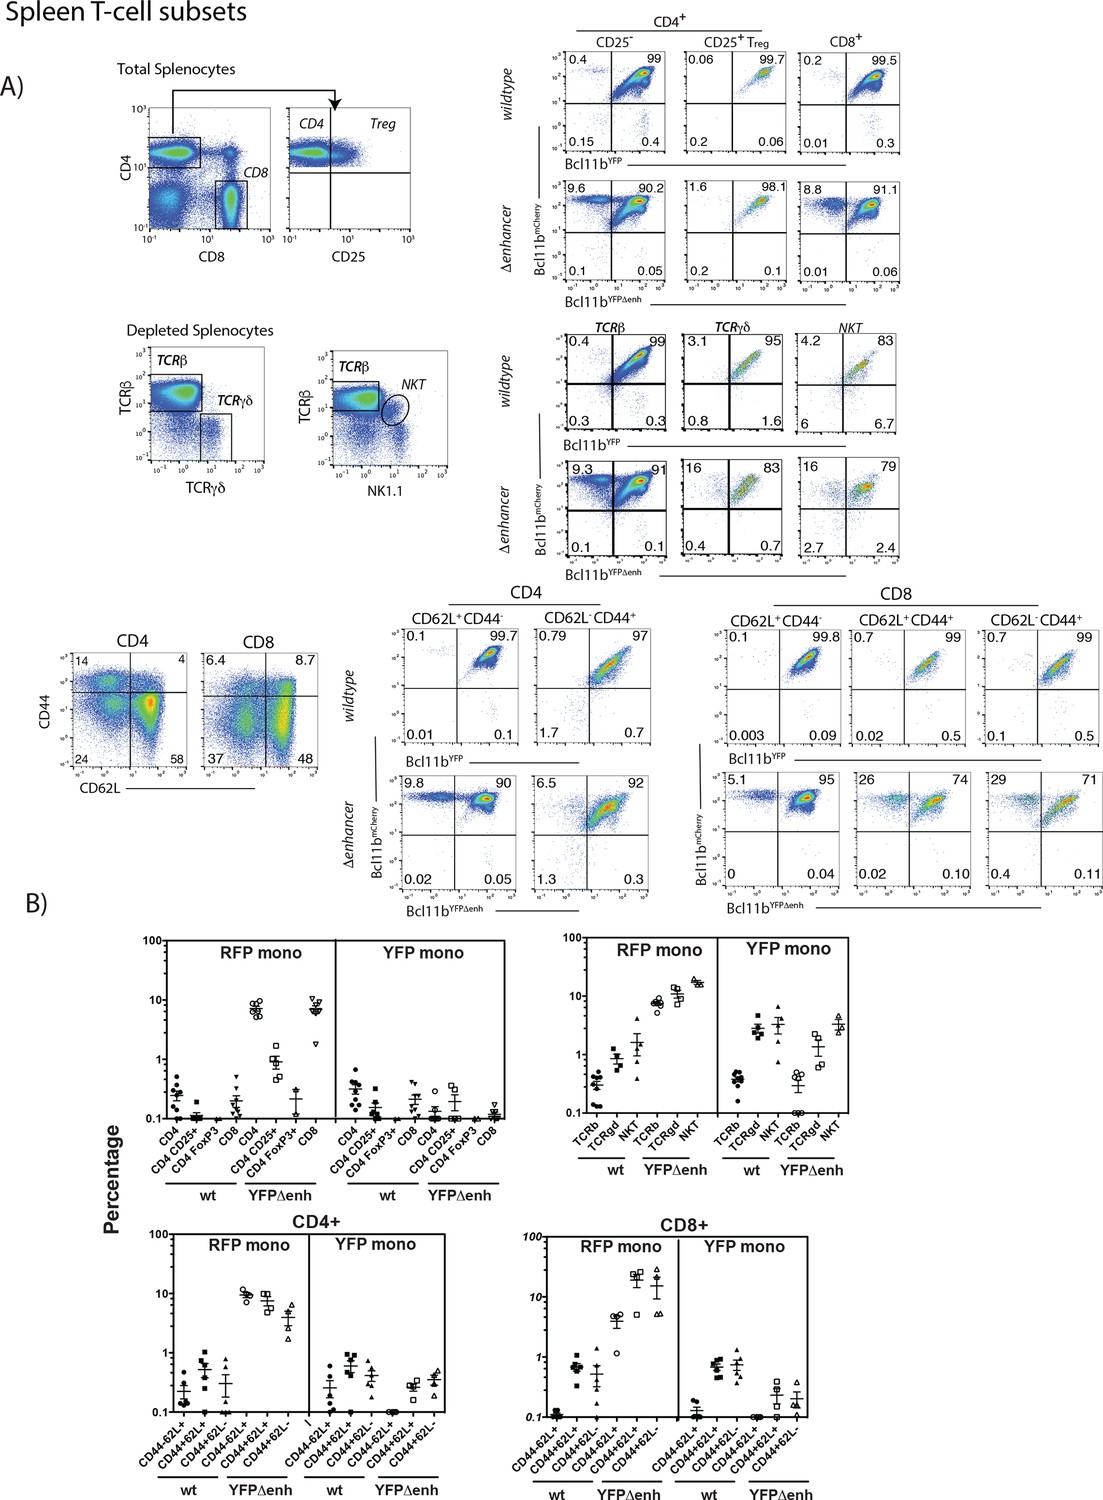
Mono-allelic Bcl11b expression persists in peripheral splenic T-cell subsets and is cell autonomous.
(A) Representative flow cytometry plots showing gating strategies for splenic subsets and two-color Bcl11b expression in these populations from Bcl11bYFP/mCh(neo) (wildtype) or Bcl11bYFPΔEnh/mCh(neo) (Δenhancer) mice. Some T-cell subsets were enriched by magnetic bead depletion of B cells before staining and analysis as indicated. (B) Percentages of cells expressing only mCherry (RFP mono) or YFP (YFP mono) in specific T cell populations from Bcl11bYFP/mCh(neo (wt) or Bcl11bYFPΔEnh/mCh(neo) (YFPΔenh) mice. Each symbol represents results from an individual mouse (n = 2 to 8 mice per group). The data show that patterns of mono-allelic expression seen in the thymus (cf. Figure 3—figure supplement 1) persist in the periphery in CD4, CD8 NKT, and TCRγδ T cells, for both wildtype and YFPΔenh mutant alleles. However, there are subset differences which are most evident in the mCherry wildtype/YFP Δenh genotype. In particular, activated or antigen-experienced (CD44+) CD8 cells show a greater frequency of mono-allelic mCherry expression than naïve (CD44-) CD8 cells, whereas CD4+ CD25+Treg cells exhibit much lower levels of mono-allelism than conventional CD4+ and CD8+ cells. These results could be related to the specific requirements for Bcl11b activity in different peripheral T-cell subsets (Avram and Califano, 2014).
-
Figure 3—figure supplement 2—source data 1
Percentages of mono- and bi-allelic expressing cells in specific spleen populations analyzed for wildtype (Bcl11bYFP/mCh(neo)) and mutant (Bcl11bYFPΔEnh/mCh(neo)) dual reporter mice.
Figure 3—figure supplement 1—source data 1 shows data comparing Bcl11b expressing cells between wildtype and mutant dual reporter mice. T cell subsets in the spleen were analyzed using flow cytometry according to representative plots shown in Figure 3—figure supplement 3A. Data represents 2-8 animals of each strain and shows percentages of mono- and bi-allelic expressing cells. Plots in Figure 3—figure supplement 2B are generated from percentages of mono-expressing cells only.
- https://doi.org/10.7554/eLife.37851.012
Figure 3—figure supplement 3
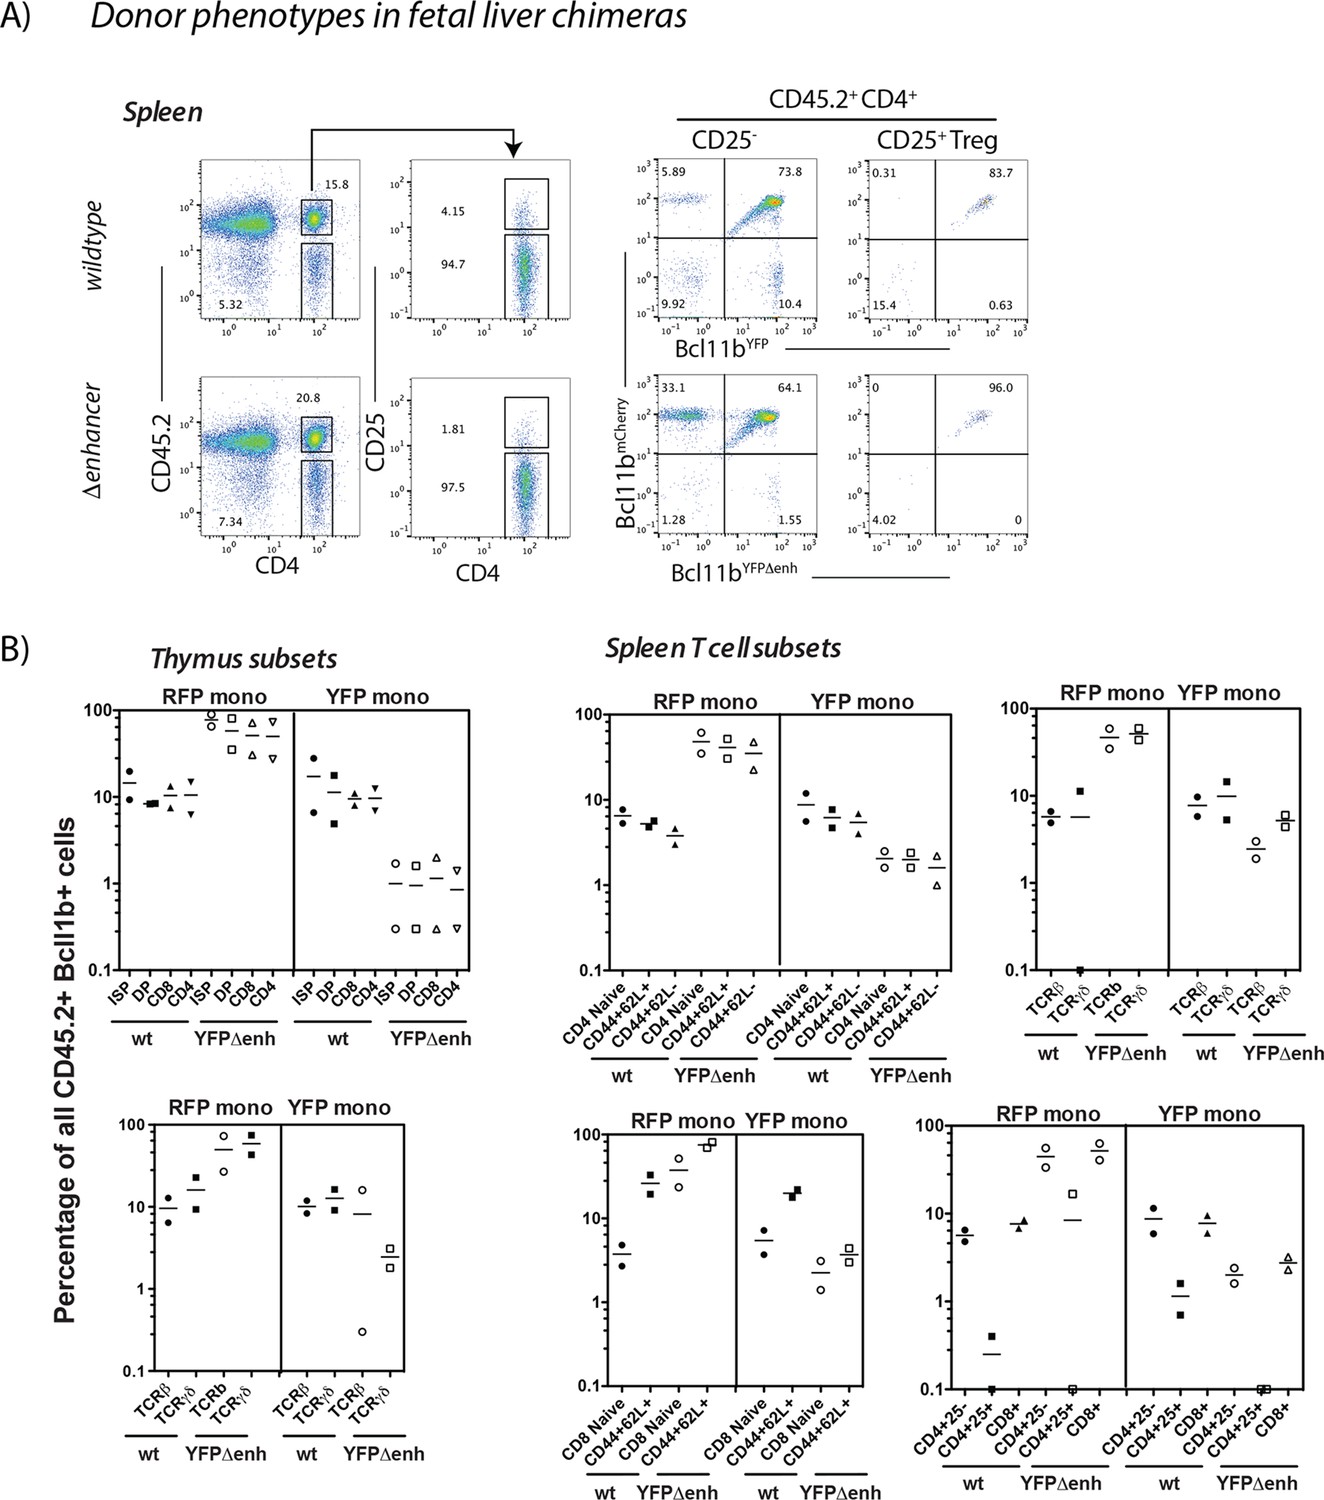
Cell autonomy of Bcl11b expression control in hematopoietic chimeric mice.
B6.Cd45.1 mice were irradiated with 1000 rads and injected retro-orbitally with 106 fetal liver cells from Bcl11bYFP/mCh(neo) (wt) and Bcl11bYFPΔEnh/mCh(neo) (YFPΔenh) (Cd45.2+) mice (F0 generation). After 8 weeks chimeric mice were analyzed for expression of the wild type (wt) mCherry and wt or mutant (Δenh) YFP alleles. (A) Representative flow cytometry plots showing gating strategies for CD45.2+ splenic subsets and two-color Bcl11b expression in these populations from Bcl11b. Other thymic and splenic T-cell populations were gated similarly to those shown Figure 3—figure supplement 1A and Figure 3—figure supplement 2A-B. (B) Percentages of cells expressing only mCherry (RFP mono) or YFP (YFP mono) in specific T cell populations, demonstrating the persistence of small but similar percentages of mono-allelically expressed mCherry and YFP alleles in wt mice and the major increase in mono-allelic mCherry positive cells in the presence of the YFPΔEnh mutant alllele. Each symbol represents results from an individual mouse (n=2 mice per group). Results are shown for chimeras from one wildtype/mutant F0 donor pair. Similar results were obtained from chimeras from a different pair of wildtype and mutant fetal F0 donors.
-
Figure 3—figure supplement 3—source data 1
Percentages of mono- and bi-allelic expressing cells in thymic and splenic populations analyzed for wildtype (Bcl11bYFP/mCh(neo)) and mutant (Bcl11bYFPΔEnh/mCh(neo)) chimeric mice.
Figure 3—figure supplement 3—source data 1 shows data comparing Bcl11b expression in hematopoietic chimeric mice. Thymic and splenic T cell populations were analyzed using flow cytometry according to the representative plots shown in Figure 3—figure supplements 1A,2A,3A. 2 chimeric animals of each strain were analyzed for Figure 3—figure supplement 3—source data 1. Plots in Figure 3—figure supplement 2B are generated from percentages of mono-expressing cells only.
- https://doi.org/10.7554/eLife.37851.014
Figure 3—figure supplement 4
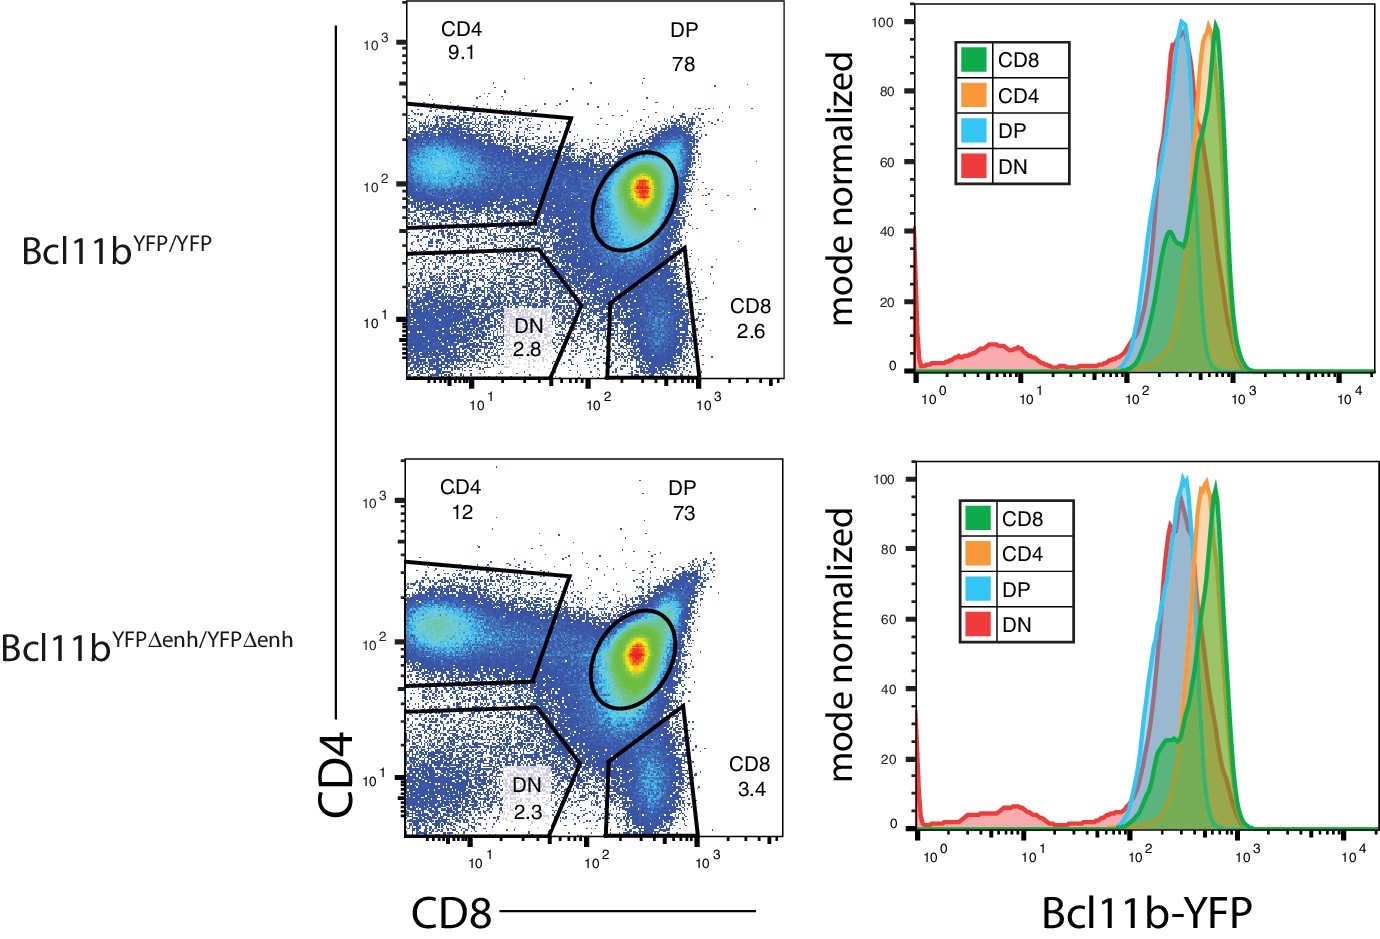
Thymocytes from homozygous mutant enhancer Bcl11bYFPΔEnh/YFPΔEnh mice are able to generate T-cell subsets expressing Bcl11b at normal levels relative to wild-type enhancer Bcl11b YFP/YFP mice.
Representative FACS plots showing gates used for CD4 and CD8 double negative (DN), double positive (DP) and single positive (CD4 and CD8) populations (left plots) and the relative levels of Bcl11b-YFP in each subset generated from enhancer mutant and wild-type mice (right histograms, n = 2 for each genotype).
Figure 4 with 2 supplements
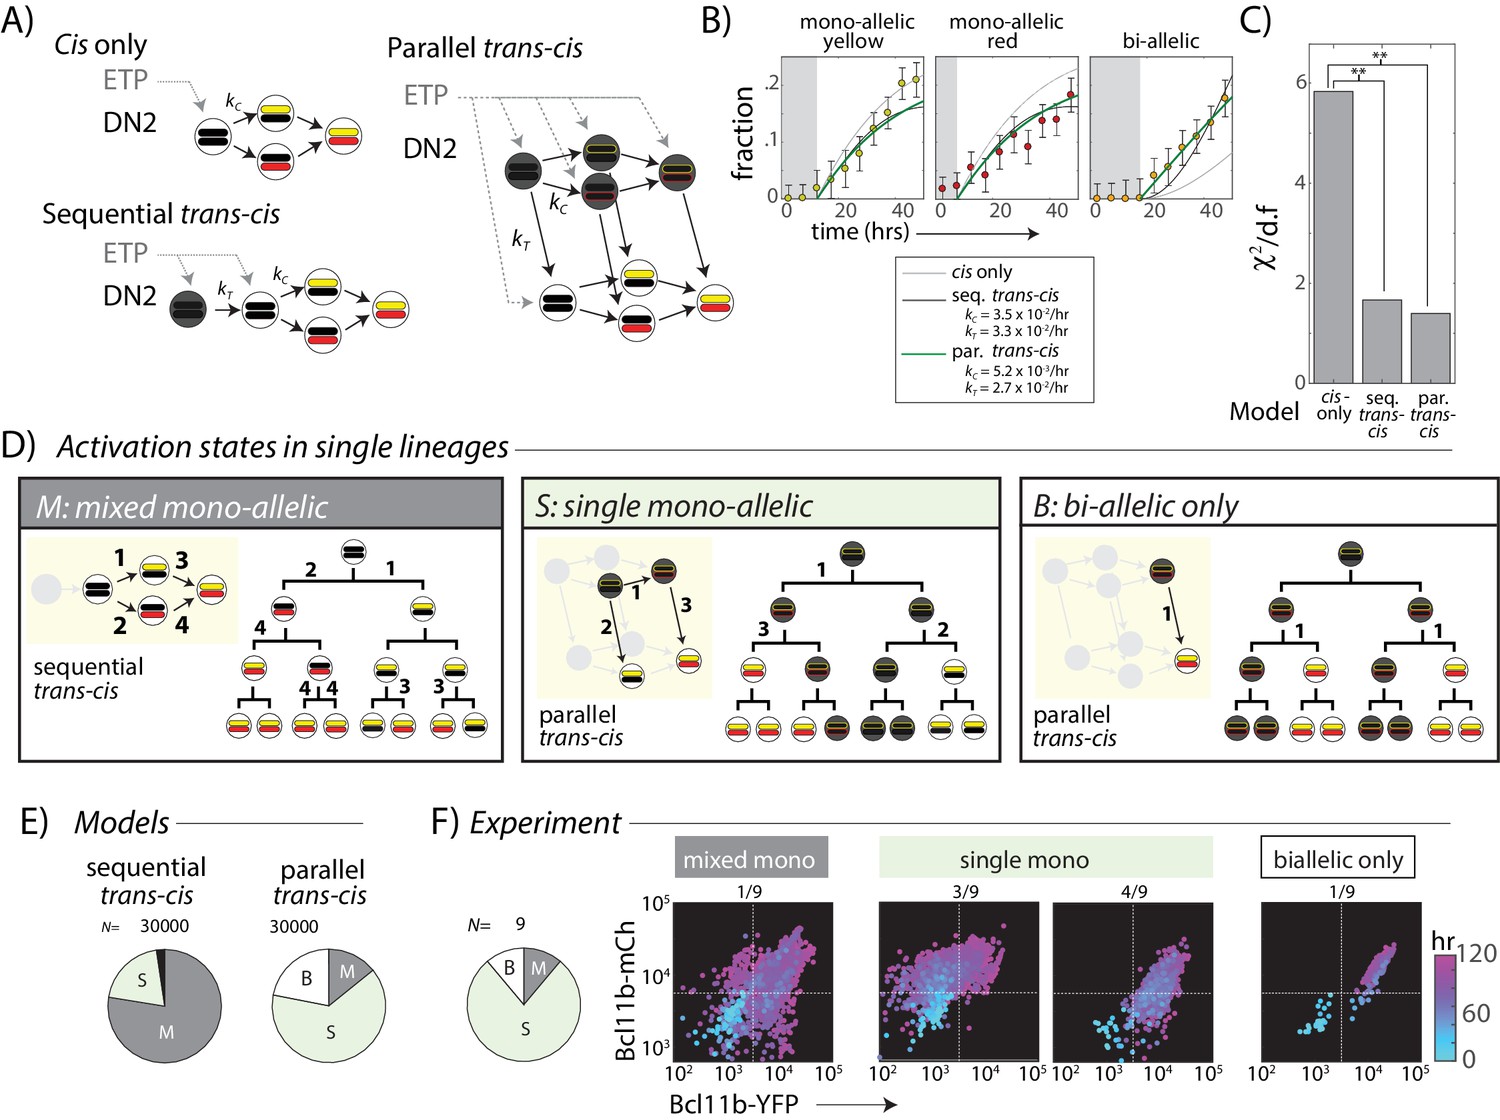
A trans-acting step, occurring in parallel with the cis-acting step, provides an additional input for Bcl11b activation.
(A) Candidate models for Bcl11b activation from the DN2 stage, involving a single cis-acting switch (top left), sequential trans-, then cis-acting switches (bottom left), and parallel, independent trans- and cis- acting switches (right). (B) Plots show best fits of different models to the time evolution of Bcl11b allelic activation states, observed by timelapse imaging (Figure 2). Gray-shaded area indicates time delay for detection of indicated allelic state as a result of the time required for stable fluorescence protein accumulation. Best fit rate constants indicated in legend. (C) Bar charts show reduced chi-squared values for each model fit, that is the normalized sum-squared fit errors over all time points and allelic states, divided by the degrees of freedom (d.f.) (see Materials and methods). Both sequential and parallel trans-cis models fit the data significantly better than the cis-only model (F-test, F = 12.2, p=0.0052, sequential vs. cis-only model; F = 8.13, p=0.021, parallel vs. cis-only model). (D) Three possible classes of Bcl11b activation states observable from clonal lineage data. Lineage trees and transition diagrams show examples of simulated lineages that fall into the indicated classes. (E) Pie charts show expected distribution of allelic activation states predicted for clonal lineages of non-expressing progenitors in either the sequential (left) or the parallel (right) trans-cis model, obtained from N = 30,000 simulations, using parameters derived from bulk fitting (see Appendix). (F) Pie chart (left) shows observed distribution of activation states observed across an entire imaging time course. Colored scatterplots (right) show Bcl11b-mCh versus Bcl11b-YFP levels of single-cell lineages, falling into the indicated categories. Clones were scored according to observable fluorescence across an entire developmental trajectory, from 0 hr (cyan) to 120 hr (purple). The observed frequency of clones with ‘single mono-allelic’ expression of Bcl11b (7/9 = 77%) is significantly different than that predicted for the sequential trans-cis Model (20.1%, **- p<0.001, χ2 = 14.9, d.f. = 1), but not significantly different from that predicted for the parallel trans-cis Model (63.9%, χ2 = 0.27, d..f = 1, n.s.). Results are representative of three independent experiments. See Figure 4—figure supplement 2 for data for independent replicate experiments.
-
Figure 4—source data 1
Quantitative analysis of timelapse imaging data used to test three minimal models.
Figure 4—source data 1B shows the mean population fractions and 95% confidence intervals of mono- and bi-allelic expressing cells as observed by timelapse imaging. Figure 4B was plotted from these data points. Figure 4—source data 1C gives the reduced chi-squared values calculated for each model and is represented in Figure 4C. Figure 4—source data 1E, plotted as pie charts in Figure 4E, shows expected fractions of each class of Bcl11b activation state from 30,000 Monte-Carlo simulations for both sequential and parallel trans-cis models. Figure 4—source data 1F shows number of single cell lineages scored for each class of Bcl11b activation state in each observed experiment (3 independent experiments). Both sequential and parallel trans-cis models predict different frequencies of activation states.
- https://doi.org/10.7554/eLife.37851.020
Figure 4—figure supplement 1
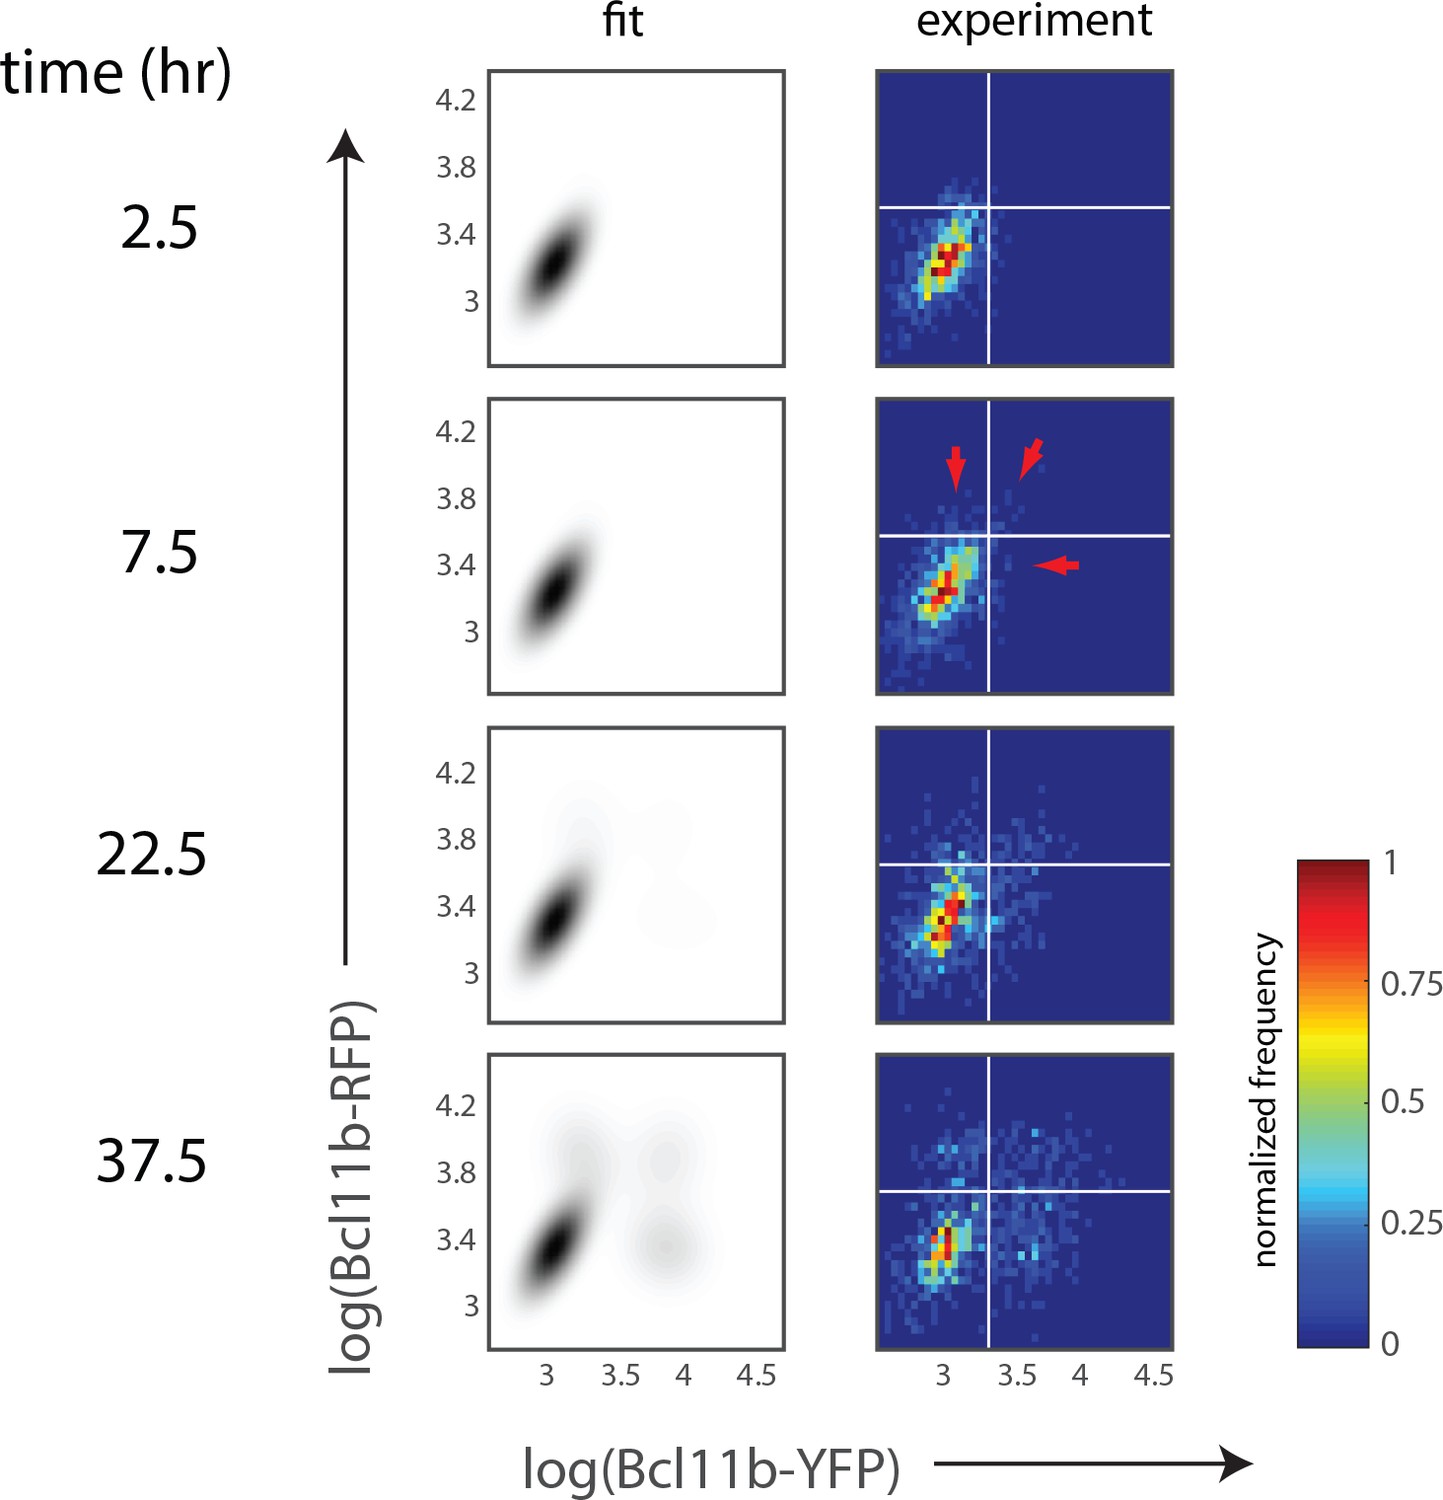
Least-squares fitting of 2D histograms of Bcl11b expression levels.
Two-dimensional plots show experimental (right) and best-fit (left) heat maps of Bcl11b levels at the indicated time points. Data are taken from 5 hr time windows centered on the indicated time points. White horizontal and vertical bars (right) provide a visual guide for discerning Bcl11b activation levels, while red arrows (t = 7.5 hr) show emergence of the two mono-allelic expressing populations, together with emergence of bi-allelic expressing population.
Figure 4—figure supplement 2
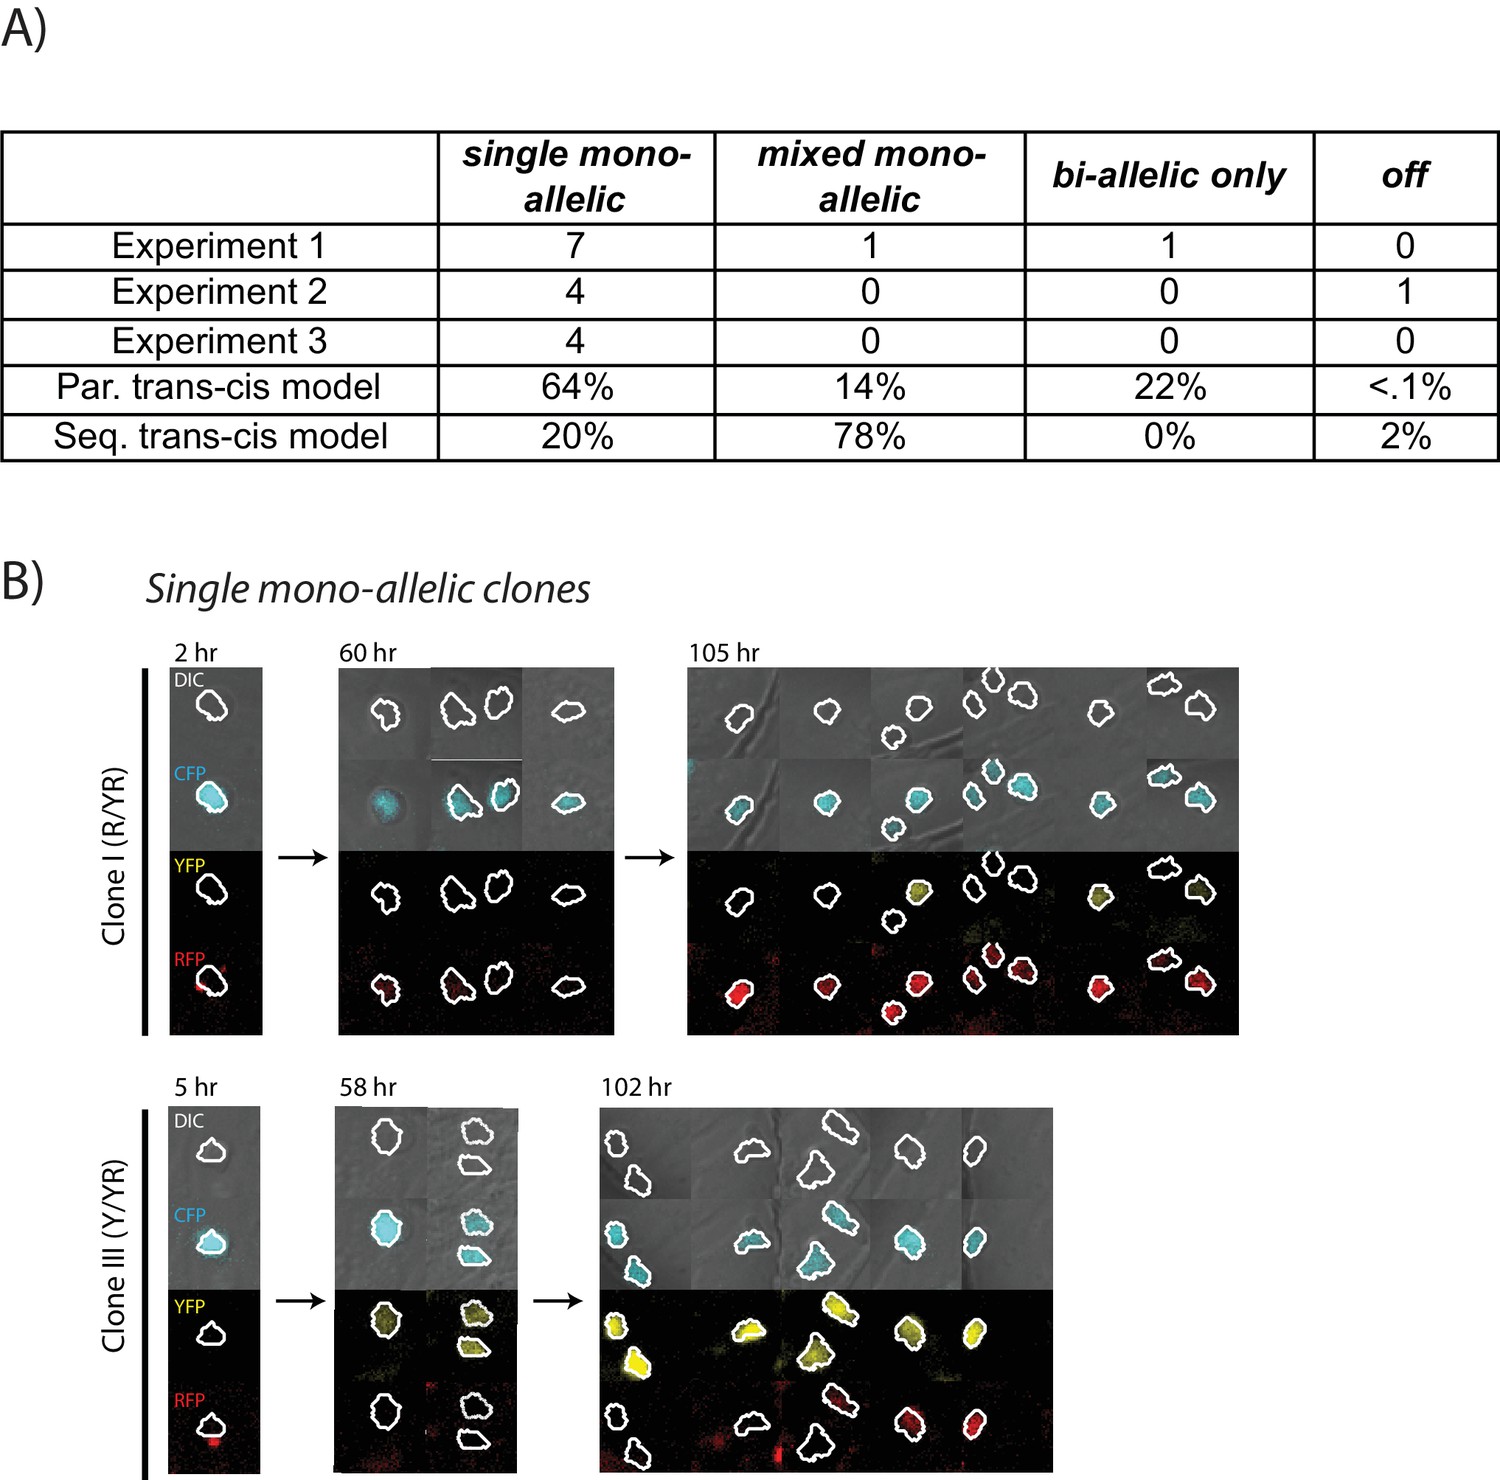
Clones show mono-allelic expression from a single predominant allele during Bcl11b activation.
(A) Table shows observed numbers of clones with indicated allelic activation patterns, showing data from three independent experiments. Simulations of clonal lineages from sequential or parallel trans-cis activation models are shown (N = 30,000 simulations). See Figure 4 and main text for model description and allelic pattern definition. (B) Live images show cells from two clonal lineages showing a single mono-allelic pattern of activation, with mono-allelic expression of either the red allele only (Clone I), or the yellow allele only (Clone II). Images shown are from Experiment 3, whereas images and data in Figure 4 are shown from Experiment 1.
Figure 5 with 1 supplement
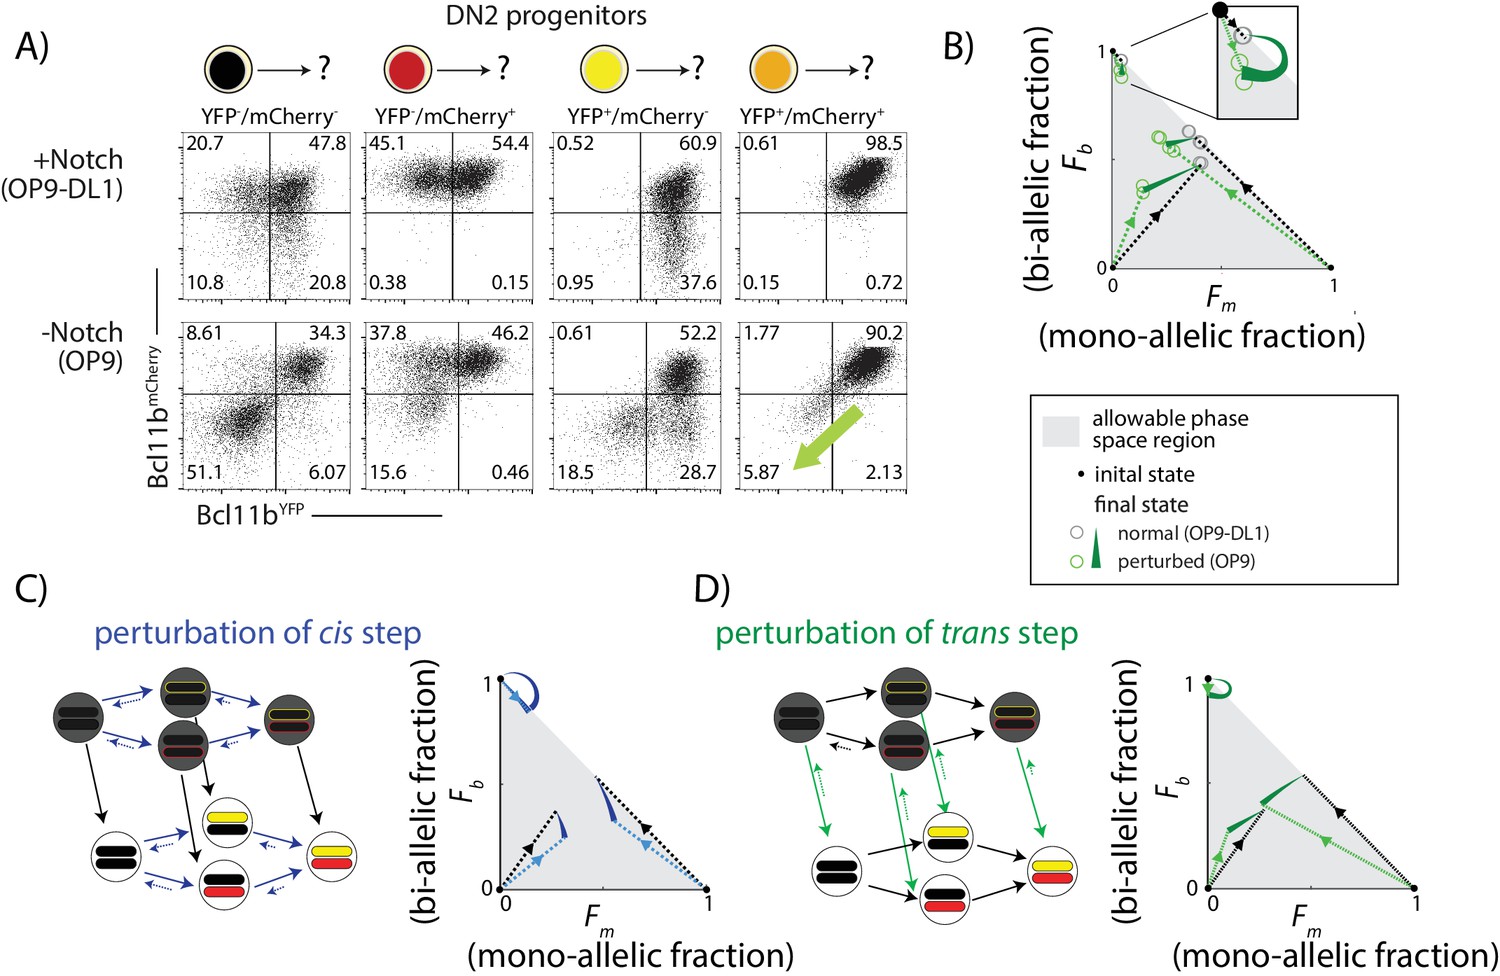
Notch signaling controls a parallel trans-acting step for Bcl11b activation.
BM-derived DN2 progenitors with different Bcl11b allelic activation states were sorted, cultured on either OP9-Control (-Notch) or OP9-DL1 (+Notch) monolayers for four days, and analyzed using flow cytometry. (A) Flow cytometry plots show Bcl11b-mCherry versus Bcl11b-YFP expression levels in analyzed cells. Percentages of non-expressing, mono-allelic expressing (both YFP and mCherry) and bi-allelic expressing cells were used to calculate the locations in the phase space. Note that when Notch signaling is withdrawn from bi-allelically expressing cells, they downregulate both alleles coordinately (green-shaded arrow). (B) Phase space diagrams experimentally obtained from analysis of flow cytometry data. Points in phase space represent the average of 2–4 replicate data points in a single experiment (hollow circles). Inset shows final activation states of bi-allelic starting progenitors upon Notch withdrawal. Results shown are representative of two independent experiments. (C–D) Predicted phase space diagrams for fraction of bi-allelic expressing cells (Fb) against the fraction of mono-allelic expressing cells (Fm, YFP+ and mCh+ combined), for either the sequential trans-cis activation model (C), or the parallel trans-cis model (see Appendix for details). Black (colored) dotted lines connect initial state to the normal (perturbed) final state. Note that actual developmental trajectories may be curved (not shown). Arrows show predicted shifts in final state due to the indicated perturbations. Note that perturbations affect both the rates and reversibility of the indicated reactions. See also Figure 5—figure supplement 1.
-
Figure 5—source data 1
Flow Cytometry Analysis of BM-derived DN2 progenitors cultured in the presence or absence of Notch.
File shows percentages of mono- and bi-allelic state cells analyzed after 4 days culture from each group of starting progenitors. Data was used to generate Figure 5B.
- https://doi.org/10.7554/eLife.37851.023
Figure 5—figure supplement 1
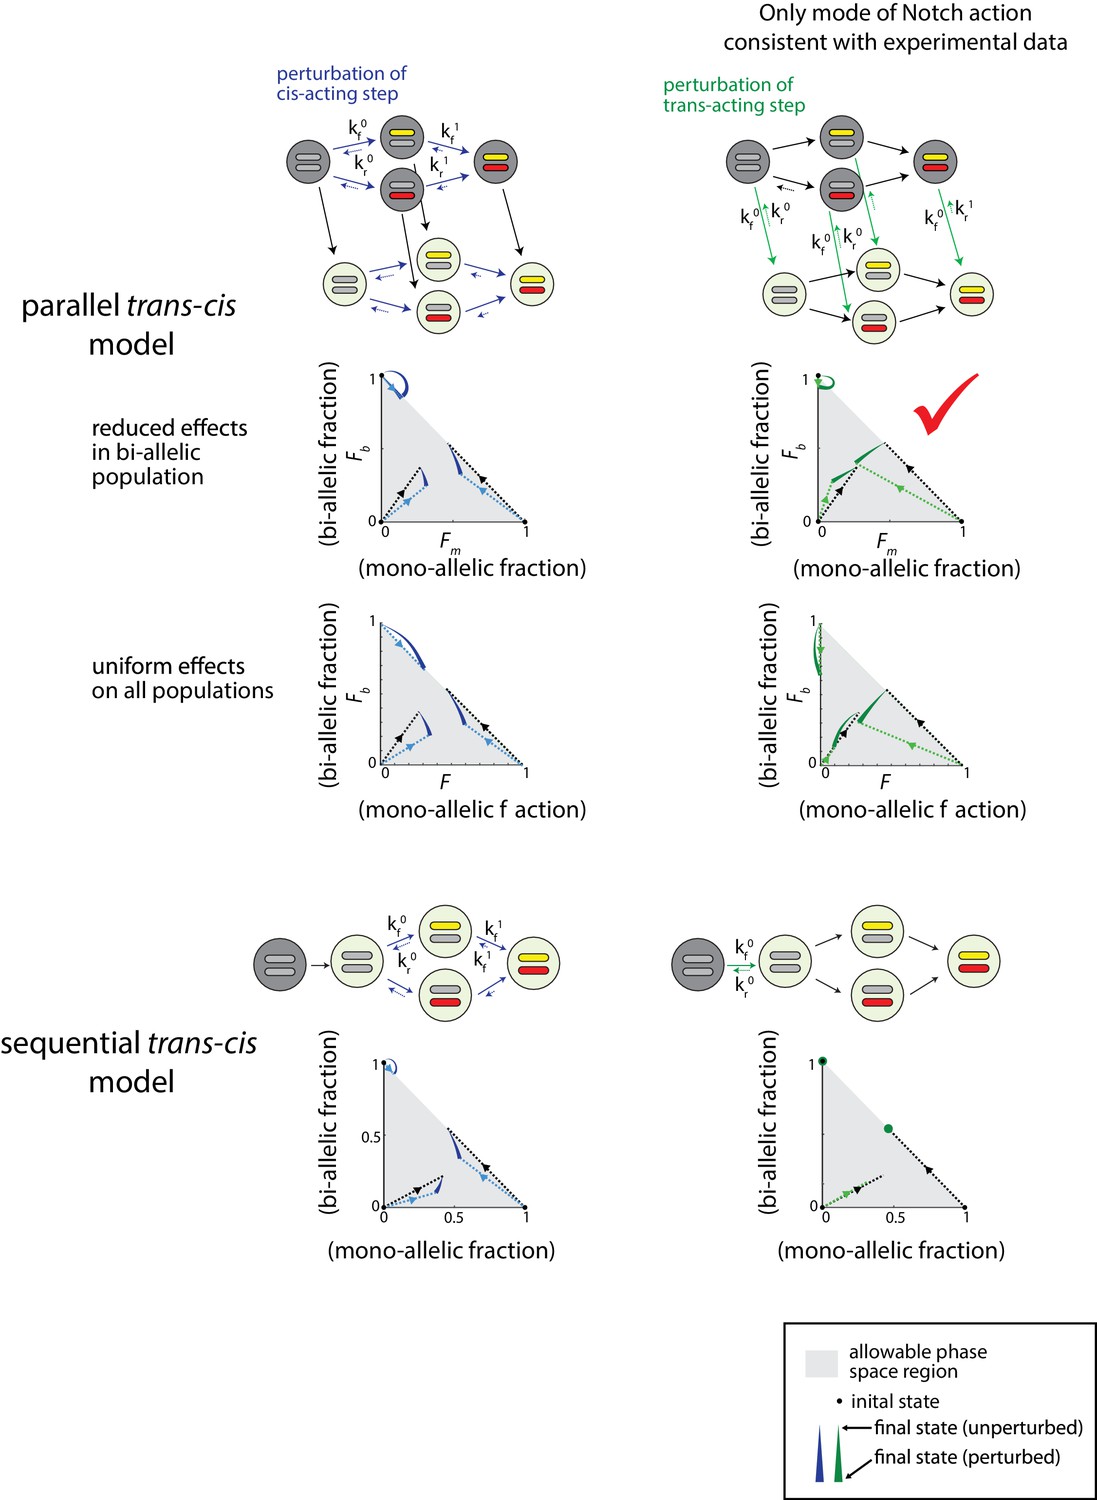
Notch controls a parallel trans-acting step for Bcl11b activation.
The parallel and sequential trans-cis Bcl11b activation models (upper and lower panels, respectively). Effects of perturbation of cis (blue) or trans (green) acting steps in both models are shown with colored arrows. Phase space diagrams show the predicted final fractions of mono-allelic expressing cells (FM, sum of mono-allelic cells from both alleles), and bi-allelic expressing cells (Fb), for both unperturbed cells (black lines) and cells where the indicated reaction steps are perturbed (colored lines). Box indicates the only predicted mode that is consistent with observed effects of experimental Notch signaling inhibition. Definitions for the forward and back rate constants (kf0, kf1, kr0, kr1) are given in Appendix 1—tables 3–6 of the Appendix.
Figure 6
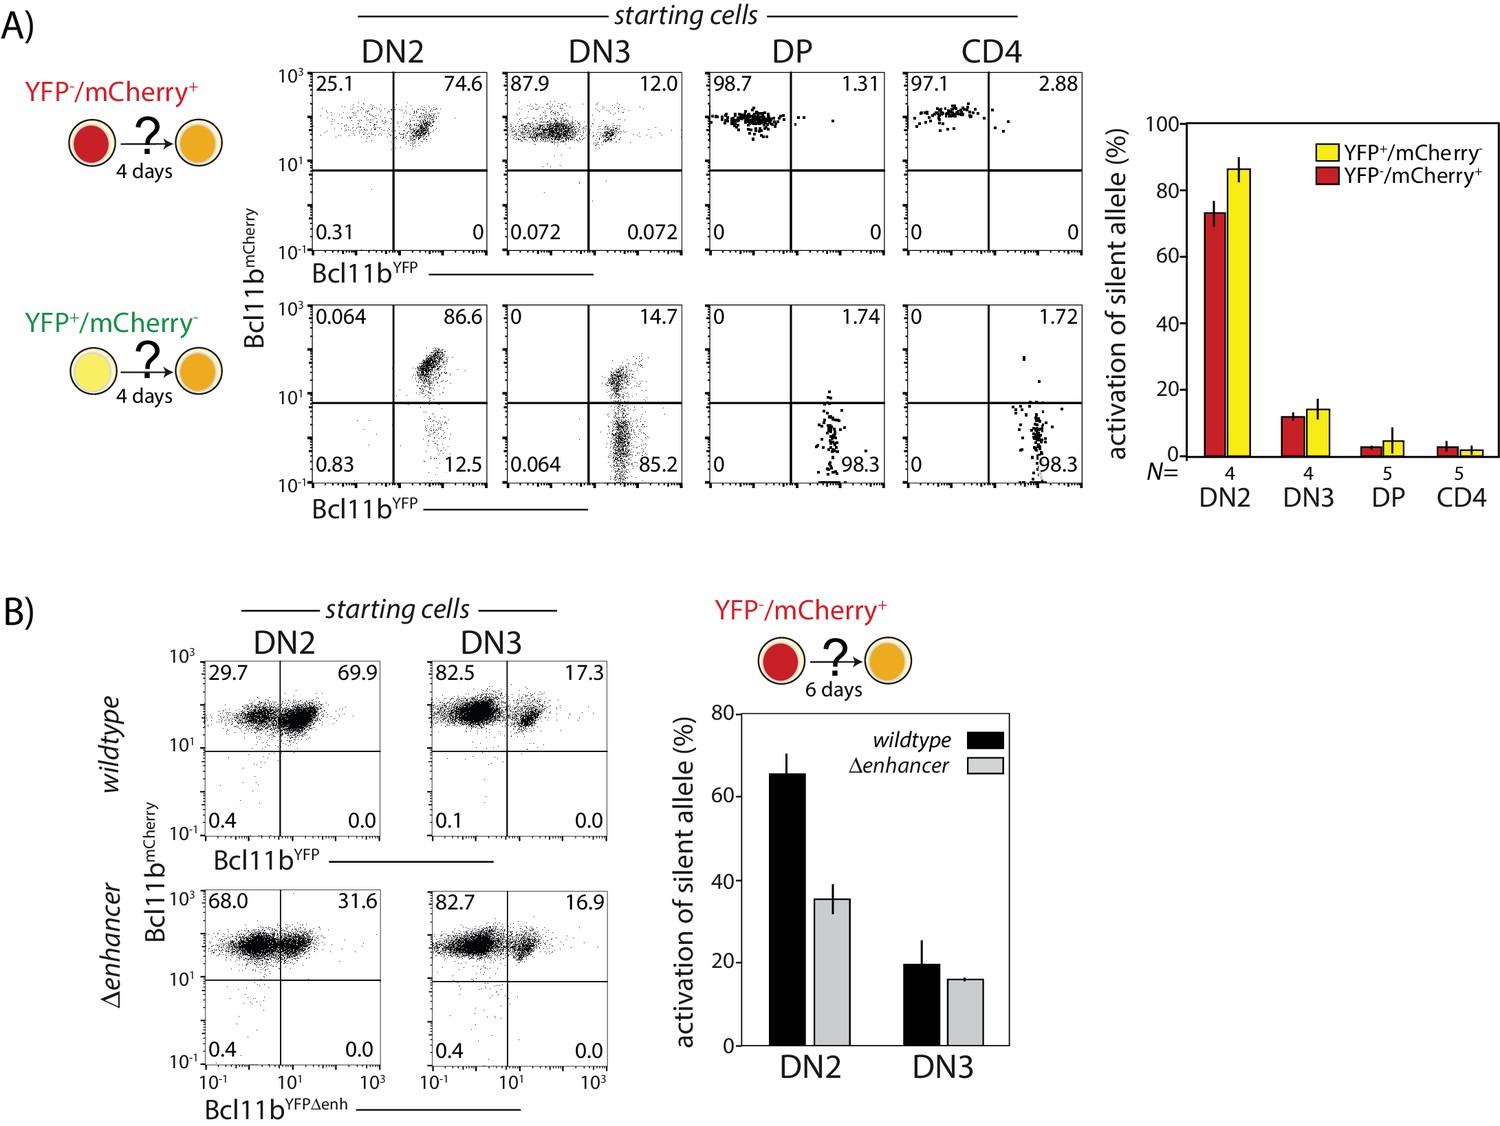
Probabilistic Bcl11b activation occurs within a limited developmental time window.
Cells expressing only one Bcl11b allele at the indicated stages were sorted from thymocytes, cultured for 4d on OP9-DL1 monolayers, and analyzed for activation of the initially inactive Bcl11b allele using flow cytometry. (A) Flow plots (left) show Bcl11b-mCh versus Bcl11b-YFP expression levels for descendants of cells that had mono-allelic expression at the indicated stages of development; bar charts (right) show the fraction of progenitors from different stages that activate the silent Bcl11b allele upon culture. Data represent mean and standard deviation of 4–5 replicates, derived from two independent experiments. The competence to activate the silent Bcl11b allele decreases upon progression to the DN3 stage and beyond. (B) Flow plots (left) show Bcl11b-mCh versus Bcl11b-YFP expression levels for DN2 or DN3 progenitors with either an intact YFP allele enhancer (top) or a disrupted YFP allele enhancer (bottom). Bar chart (right) shows the fraction of cells activating the silent Bcl11b allele upon re-culture. Data show that enhancer disruption reduces the Bcl11b activation advantage in DN2 cells as compared to DN3 cells. Data represent mean and standard deviation of three replicates from two independent experiments.
Figure 7
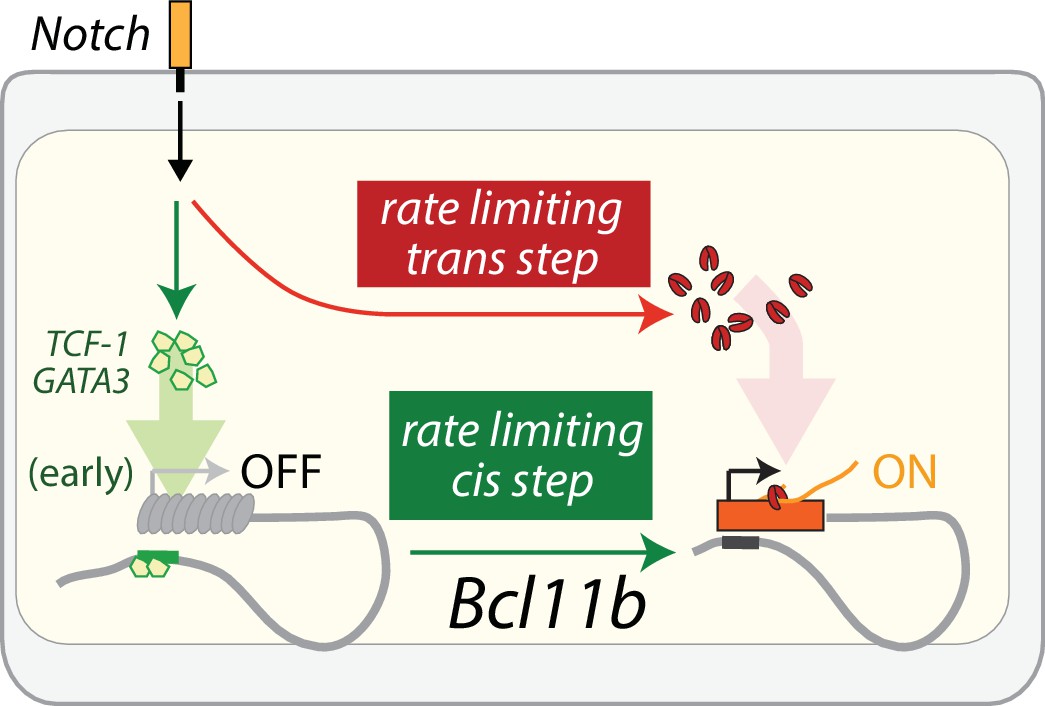
Model of Bcl11b regulation by parallel cis and trans-limiting steps.
Bcl11b activation requires two rate-limiting steps: a switch of the Bcl11b locus from an inactive to active epigenetic state, and the activation of a trans factor is necessary for transcription of Bcl11b from an activated locus. Notch signaling activates TCF-1 and GATA3 in early thymic progenitors (García-Ojeda et al., 2013; Scripture-Adams et al., 2014; Weber et al., 2011), and these two factors may act on the identified distal enhancer to control the rate-limiting cis step on the Bcl11b locus (green). In parallel, Notch promotes the activation of a trans factor (red) that is necessary for transcription from a cis-activated Bcl11b locus. The cis and trans-limiting steps together control the dynamics of Bcl11b expression and T-cell lineage commitment.
Author response image 1
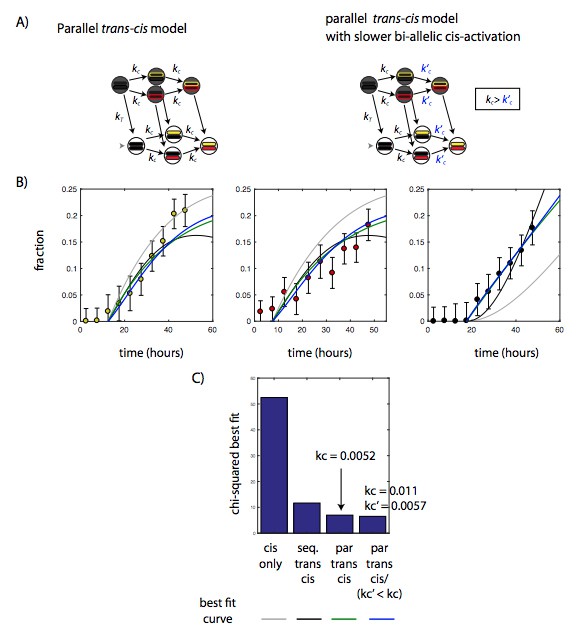
A slower rate of bi-allelic activation does not significantly improve model fit in the parallel trans-cis model.
A) Diagram showing parallel trans-cis model shown in main text (left), and variant parallel trans-cis model with a slower rate of activation of the second Bcl11b allele (right). B) Best fits of cis-only (gray) sequential trans-cis (black), parallel trans-cis (green), and variant parallel trans-cis (blue) models to time evolution of the fraction of Bcl11b mono and bi-allelic expressing populations. See Figure 4 legend and text for description of fitting procedures. C) Bar chart showing the chi-squared value for the best fit for the four models, showing that variant parallel trans-cis model (forth column) does not significantly reduced chi-squared value compared to the simpler parallel trans-cis model (third column).
Videos
Video 1
Timelapse movie of a single clonal DN2 progenitor lineage.
Bcl11b-YFP-mCh- DN2 progenitors were cultured on OP9-DL1 monolayers with 5 ng/mL IL-7 and Flt3-L within individual PDMS micro-wells, and continuously imaged for 100 hr. Images show superposition of a DIC image (gray) and cellular fluorescent intensities from the Bcl11b-mCherry (red) and Bcl11b-YFP (green) channels, with segmented cell boundaries shown in white. For clarity, images show only the fluorescence intensities within the cell boundaries, excluding auto-fluorescence from well boundaries and OP9-DL1 monolayers. Scatter-plot (bottom-right) updates with each frame to show fluorescent intensities of segmented cells at corresponding time points. Scale bar = 50 microns.
Tables
Key resources table
| Reagent type (species) or resource | Designation | Source or reference | Identifiers | Additional information |
|---|---|---|---|---|
| Recombinant DNA reagent | pTarget Bcl11b IRES-H2Bm Cherry-neo/3pUTR | This paper | N/A | Gene targeting vector with IRES-H2B-mCherry- loxP-neo-loxP cassette knocked into 3' UTR of Bcl11b |
| Recombinant DNA reagent | pTarget Bcl11b dEnh-hygro | This paper | N/A | Gene targeting vector with Enhancer replaced by hygromycin cassette |
| Recombinant DNA reagent | FRT-PGK-gb2- hygromycin-FRT cassette | Genebridges | Cat# A010 | |
| Recombinant DNA reagent | MSCV IRES H2B-mCerulean | Kueh et al., 2013 | N/A | |
| Recombinant DNA reagent | pCL-Eco | Imgenex | Cat# NBP2-29540 | |
| Strain, strain background (mouse) | Bcl11bYFP(neo)/mCh(neo) | This paper | N/A | Two color reporter mice generated from breeding animals homozygous for either Bcl11b YFP(neo) or Bcl11b mCh(neo). See Materials and methods for details. |
| Strain, strain background (mouse) | Bcl11bmCh(neo)/mCh(neo) | This paper | N/A | Homozygous Bcl11b mCh(neo) reporter mice used to generate two color reporter mice. Derived from Bcl11b YFP/mCh(neo) F0 chimeric mice. See Materials and methods for details. |
| Strain, strain background (mouse) | Bcl11bYFP/mCh(neo) | This paper | N/A | Control mice for comparing the effects of the enhancer on Bcl11b expression. Generated by targeting Bcl11b mCherry gene targeting vector to V6.5 mouse embryonic stem (ES) cells with single modified Bcl11b mCitrine dneo allele. See Materials and methods for details. |
| Strain, strain background (mouse) | Bcl11bYFPdEnh/mCh(neo) | This paper | N/A | Two color reporter mouse with Bcl11b enhancer deleted. Generated by targeting dEnh gene target vector to V6.5 mouse ES cells with genotype Bcl11b YFP/mCh(neo). See Materials and methods for details. |
| Strain, strain background (mouse) | Bcl11bYFPdEnh/dEnh | This paper | N/A | Homozygous deleted enhancer mice generated from Bcl11b YFP dEnh/mCh(neo) mice. See Materials and methods for details. |
| Strain, strain background (mouse) | CD45.1 C57BL/6: B6.SJL-Ptprca Pepcb/BoyJ | Jackson Laboratory | Stock No# 002014 | |
| Cell line (mouse) | OP9-DL1-GFP | Schmitt and Zúñiga-Pflücker, 2002 | N/A | |
| Cell line (mouse) | OP9-Mig | Schmitt and Zúñiga-Pflücker, 2002 | N/A | |
| Cell line (mouse) | OP9-DL1-hCD8 | Kueh et al., 2016 | N/A | |
| Cell line (human) | Human Phoenix-ECO | ATCC | Cat# CRL-3214 | |
| Antibody | Anti-mouse CD8a Biotin (clone 53–6.7) | eBioscience | Cat# 13-0081-86; RRID:AB_466348 | (1:100) |
| Antibody | Anti-mouse TCRb Biotin (clone H57-597) | eBioscience | Cat# 13-5961-85; RRID:AB_466820 | (1:100) |
| Antibody | Anti-mouse TCRgd Biotin (clone GL3) | eBioscience | Cat# 13-5711-85; RRID:AB_466669 | (1:100) |
| Antibody | Anti-mouse Ter119 Biotin (clone TER-119) | eBioscience | Cat# 13-5921-85; RRID:AB_466798 | (1:100) |
| Antibody | Anti-mouse NK1.1 Biotin (clone PK136) | eBioscience | Cat# 13-5941-85; RRID:AB_466805 | (1:100) |
| Antibody | Anti-mouse Gr-1 Biotin (clone RB6-8C5) | eBioscience | Cat# 13-5931-86; RRID:AB_466802 | (1:100) |
| Antibody | Anti-mouse CD11c Biotin (clone N418) | eBioscience | Cat# 13-0114-85; RRID:AB_466364 | (1:100) |
| Antibody | Anti-mouse CD11b Biotin (clone M1/70) | eBioscience | Cat# 13-0112-86; RRID:AB_466361 | (1:100) |
| Antibody | Anti-mouse CD19 Biotin (clone 1D3/6D5) | eBioscience | Cat# 13-0193-85; RRID:AB_657658 | (1:100) |
| Antibody | Anti-mouse CD3e Biotin (clone 145–2 C11) | eBioscience | Cat# 13-0031-85; RRID:AB_466320 | (1:100) |
| Antibody | Anti-human/mouse B220 Biotin (clone RA3-6B2) | eBioscience | Cat# 13-0452-85; RRID:AB_466450 | (1:100) |
| Antibody | Anti-mouse F4/80 Biotin (clone BM8) | eBioscience | Cat# 13-4801-85; RRID:AB_466658 | (1:100) |
| Antibody | Anti-mouse CD4 Biotin (clone GK1.5) | eBioscience | Cat# 13-0041-85; RRID:AB_466326 | (1:100) |
| Antibody | Anti-human/mouse CD44 eFluor 450 (clone IM7) | eBioscience | Cat# 48-0441-82; RRID:AB_1272246 | (1:300) |
| Antibody | Anti-mouse CD25 Brilliant Violet 510 (clone PC61) | Biolegend | Cat# 102041; RRID:AB_2562269 | (1:300) |
| Antibody | Anti-mouse CD117 (cKit) APC-eFluor 780 (clone 2B8) | eBioscience | Cat# 47-1171-82; RRID:AB_1272177 | (1:300) |
| Antibody | Anti-mouse HSA eFluor 450 (clone M1/69) | eBioscience | Cat# 48-0242-82; RRID:AB_1311169 | (1:300) |
| Antibody | Anti-mouse CD4 Brilliant Violet 510 (clone GK1.5) | Biolegend | Cat# 100449; RRID:AB_2564587 | (1:300) |
| Antibody | Anti-mouse CD8a APC (clone 53–6.7) | eBioscience | Cat# 17-0081-82; RRID:AB_469335 | (1:300) |
| Antibody | Anti-mouse TCRb APC-eFluor 780 (clone H57-597) | eBioscience | Cat# 47-5961-82; RRID:AB_1272173 | (1:300) |
| Antibody | Anti-mouse CD25 APC-eFluor 780 (clone PC61.5) | eBioscience | Cat# 47-0251-82; RRID:AB_1272179 | (1:300) |
| Antibody | Anti-mouse CD19 eFluor 450 (clone 1D3/6D5) | eBioscience | Cat# 48-0193-82; RRID:AB_2734905 | (1:300) |
| Antibody | Anti-mouse CD117 (cKit) APC (clone 2B8) | eBioscience | Cat# 17-1171-82; RRID:AB_469430 | (1:300) |
| Antibody | Anti-mouse CD45 APC-eFluor 780 (clone 30-F11) | eBioscience | Cat# 47-0451-82; RRID:AB_1548781 | (1:300) |
| Antibody | Anti-mouse CD25 APC (clone PC61.5) | eBioscience | Cat# 17-0251-82; RRID:AB_469366 | (1:300) |
| Antibody | Anti-mouse CD4 APC-eFluor 780 (clone GK1.5) | eBioscience | Cat# 47-0041-82; RRID:AB_11218896 | (1:300) |
| Antibody | Anti-mouse CD8a APC-eFluor 780 (clone 53–6.7) | eBioscience | Cat# 47-0081-82; RRID:AB_1272185 | (1:300) |
| Antibody | Anti-mouse CD45 APC (clone 30-F11) | eBioscience | Cat# 17-0451-82; RRID:AB_469392 | (1:300) |
| Antibody | Anti-mouse CD5 eFluor 450 (clone 53–7.3) | eBioscience | Cat# 48-0051-82; RRID:AB_1603250 | (1:300) |
| Antibody | Anti-mouse TCRgd APC (clone GL3) | eBioscience | Cat# 17-5711-82; RRID:AB_842756 | (1:300) |
| Antibody | Anti-mouse CD49b eFluor 450 (clone DX5) | eBioscience | Cat# 48-5971-82; RRID:AB_10671541 | (1:300) |
| Antibody | Anti-mouse NK1.1 APC (clone PK136) | eBioscience | Cat# 17-5941-82; RRID:AB_469479 | (1:300) |
| Antibody | Anti-mouse CD3e APC-eFluor 780 (clone 145–2 C11) | eBioscience | Cat# 47-0031-82; RRID:AB_11149861 | (1:300) |
| Antibody | Anti-mouse TCRb eFluor 450 (clone H57-597) | eBioscience | Cat# 48-5961-82; RRID:AB_11039532 | (1:300) |
| Antibody | Anti-mouse CD49b Biotin (clone DX5) | eBioscience | Cat# 13-5971-82; RRID:AB_466825 | (1:300) |
| Antibody | Anti-mouse CD62L APC (clone MEL-14) | eBioscience | Cat# 17-0621-82; RRID:AB_469410 | (1:300) |
| Antibody | Anti-mouse CD45.2 Brilliant Violet 510 (clone 104) | Biolegend | Cat# 109837; RRID:AB_2561393 | (1:300) |
| Antibody | Anti-mouse CD4 eFluor 450 (clone GK1.5) | eBioscience | Cat# 48-0041-82; RRID:AB_10718983 | (1:300) |
| Antibody | Anti-mouse CD45 eFluor 450 (clone 30-F11) | eBioscience | Cat# 48-0451-82; RRID:AB_1518806 | (1:300) |
| Antibody | Streptavidin PerCP-Cyanine5.5 | Biolegend | Cat# 405214; RRID:AB_2716577 | (1:300) |
| Antibody | Streptavidin Brilliant Violet 510 | Biolegend | Cat# 405234 | (1:300) |
| Peptide, recombinant protein | Recombinant Human Flt3-Ligand | PeproTech | Cat# 300–19 | |
| Peptide, recombinant protein | Recombinant Human IL-7 | PeproTech | Cat# 200–07 | |
| Peptide, recombinant protein | Recombinant Human Stem Cell Factor (SCF) | PeproTech | Cat# 300–07 | |
| Peptide, recombinant protein | Recombinant Mouse IL-6 | eBioscience | Cat# 14-8061-62 | |
| Peptide, recombinant protein | Recombinant Mouse Stem Cell Factor (SCF) | eBioscience | Cat# 34-8341-82 | |
| Peptide, recombinant protein | Recombinant Mouse IL-3 | eBioscience | Cat# 14-8031-62 | |
| Peptide, recombinant protein | Retronectin | Takara | Cat# T100B | |
| Peptide, recombinant protein | DL1-extIgG Protein | Varnum-Finney et al., 2000 | N/A | |
| Software, algorithm | FlowJo (v10.0.8) | Tree Star | N/A | |
| Software, algorithm | MATLAB (R2016a) | MathWorks | N/A | |
| Other | FuGENE 6 Transfection Reagent | Promega | Cat# E2691 | |
| Other | MACS Streptavidin Microbeads | Miltenyi Biotec | Cat# 130-048-101 | |
| Other | LS Columns | Miltenyi Biotec | Cat# 130-042-401 | |
| Other | 250mm-diameter PDMS circular micromesh arrays | Microsurfaces Pty Ltd | Cat# MMA-0250-100-08-01 |
Appendix 1—table 1
Best fit parameters of the sequential trans-cis activation model to data, with confidence intervals.
https://doi.org/10.7554/eLife.37851.029| Parameter | Units | Best-fit | Lower bound | Upper bound |
|---|---|---|---|---|
| 1/hr | ||||
| 1/hr | ||||
| I |
Appendix 1—table 2
Best fit parameters of the parallel trans-cis activation model to data, with confidence intervals.
https://doi.org/10.7554/eLife.37851.030| Parameter | Units | Best-fit | Lower bound | Upper bound |
|---|---|---|---|---|
| 1/hr | ||||
| 1/hr | ||||
| (fraction) | ||||
| , | (fraction) | |||
| (fraction) |
Appendix 1—table 3
Perturbing the cis-acting step in the sequential activation model.
https://doi.org/10.7554/eLife.37851.031| Parameter | Description |
|---|---|
| cis-activation rate, from non-expressing to mono-allelic state | |
| cis-activation rate, from mono-allelic to bi-allelic state | |
| back cis-activation rate, from mono-allelic to non-expressing state | |
| back cis-activation rate, from bi-allelic to mono-allelic state | |
| trans-activation rate | |
| 0 to 0.35 | |
| 0.4 |
Appendix 1—table 4
Perturbing the trans-acting step in the sequential activation model.
https://doi.org/10.7554/eLife.37851.032| Parameter | Description |
|---|---|
| cis-activation rate | |
| trans-activation rate | |
| back trans-activation rate | |
| 0 to 0.35 |
Appendix 1—table 5
Perturbing the cis-acting step in the parallel activation model.
https://doi.org/10.7554/eLife.37851.033| Parameter | Description |
|---|---|
| cis-activation rate, from non-expressing to mono-allelic state | |
| cis-activation rate, from mono-allelic to bi-allelic state | |
| back cis-activation rate, from mono-allelic to non-expressing state | |
| back cis-activation rate, from bi-allelic to mono-allelic state | |
| trans-activation rate | |
| 0 to 0.35 | |
| 0.4 |
Appendix 1—table 6
Perturbing the trans-acting step in the parallel activation model.
https://doi.org/10.7554/eLife.37851.034| Parameter | Description |
|---|---|
| cis-activation rate | |
| trans-activation rate, from non-expressing/mono-allelic state | |
| trans-activation rate, from bi-allelic state | |
| back trans-activation rate, from non-expressing/mono-allelic state | |
| back trans-activation rate, from bi-allelic state | |
| 0 to 0.65 | |
| 0.2 |
Additional files
-
Supplementary file 1
List of antibodies used for magnetic bead protocols, flow cytometry analysis, and sorting.
Each antibody specifies the cell populations targeted and their corresponding reference figures.
- https://doi.org/10.7554/eLife.37851.025
-
Transparent reporting form
- https://doi.org/10.7554/eLife.37851.027
Download links
A two-part list of links to download the article, or parts of the article, in various formats.
Downloads (link to download the article as PDF)
Open citations (links to open the citations from this article in various online reference manager services)
Cite this article (links to download the citations from this article in formats compatible with various reference manager tools)
A stochastic epigenetic switch controls the dynamics of T-cell lineage commitment
eLife 7:e37851.
https://doi.org/10.7554/eLife.37851


