A stochastic epigenetic switch controls the dynamics of T-cell lineage commitment
- University of Washington, United States
- California Institute of Technology, United States
- Drexel University, United States
- Howard Hughes Medical Institute, California Institute of Technology, United States
Abstract
Cell fate decisions occur through the switch-like, irreversible activation of fate-specifying genes. These activation events are often assumed to be tightly coupled to changes in upstream transcription factors, but could also be constrained by cis-epigenetic mechanisms at individual gene loci. Here, we studied the activation of Bcl11b, which controls T-cell fate commitment. To disentangle cis and trans effects, we generated mice where two Bcl11b copies are tagged with distinguishable fluorescent proteins. Quantitative live microscopy of progenitors from these mice revealed that Bcl11b turned on after a stochastic delay averaging multiple days, which varied not only between cells but also between Bcl11b alleles within the same cell. Genetic perturbations, together with mathematical modeling, showed that a distal enhancer controls the rate of epigenetic activation, while a parallel Notch-dependent trans-acting step stimulates expression from activated loci. These results show that developmental fate transitions can be controlled by stochastic cis-acting events on individual loci.
https://doi.org/10.7554/eLife.37851.001Introduction
During development, individual cells establish and maintain stable gene expression programs through the irreversible activation of lineage-specifying regulatory genes. A fundamental goal of developmental biology is to understand how and when these activation events are initiated to drive cell fate transitions. The concentrations of active transcription factors in the nucleus are crucial for embryonic patterning and progressive gene expression changes in development (Briscoe and Small, 2015; Davidson, 2010; Jaeger, 2011) and are often assumed to directly dictate rates of target gene transcription (Coulon et al., 2013; Estrada et al., 2016; Phillips, 2015). At the same time, an additional layer of epigenetic control mechanisms acts directly at gene loci on chromosomes, through chemical modification of DNA or DNA-associated histone proteins (Bird, 2002; Tessarz and Kouzarides, 2014), or regulation of chromosome conformation or packing in the nucleus (Felsenfeld and Dekker, 2012). Chromatin modification and accessibility changes are ultimately initiated by the binding and action of trans-acting factors; however, while these changes are often assumed to closely follow transcription factor changes, other recent work shows that epigenetic processes could occur slowly (Kaikkonen et al., 2013; Mayran et al., 2018), and could introduce slow, stochastic, rate-limiting steps to gene activation, even when transcription factor inputs are fully present (Berry et al., 2017; Bintu et al., 2016). Despite much work, it has generally remained unclear what role, if any, epigenetic mechanisms play in controlling the timing and outcome of developmental gene activation and cell fate decisions.
Epigenetic control is ordinarily difficult to disentangle from control due to changes in transcription factor activity. However, the two mechanisms can be distinguished by their effects on different gene copies in the same cell (Bonasio et al., 2010). Control due to transcription factor changes occurs in trans, and thus affects two copies of the gene in the same cell coordinately; in contrast, epigenetic mechanisms function at single gene copies, in cis, and thus could generate distinct activation states for different gene copies in the same cell, a concept that underlies the utility of X-chromosome inactivation and other systems as models for epigenetic gene control (Berry et al., 2015; Deng et al., 2014; Farago et al., 2012; Gendrel and Heard, 2014; Ku et al., 2015; Xu et al., 2006). For this reason, tracking both copies of a gene in the same cell with distinguishable fluorescent proteins can provide insight into the dynamics of cis and trans regulatory processes (Elowitz et al., 2002; Yang et al., 2017).
Using this approach of tracking two gene copies, we have studied the developmental activation of Bcl11b, a key driver of T-cell commitment and identity. To become a T-cell, hematopoietic progenitors transition through a series of developmental states, where they lose alternate lineage potential and eventually commit to the T-cell lineage (Figure 1A). T-cell lineage commitment requires the irreversible switch-like activation of Bcl11b, which serves to repress alternate lineage potential and establish T-lineage identity (Ikawa et al., 2010; Li et al., 2010a; Li et al., 2010b). Bcl11b is regulated by an ensemble of transcription factors, including Runx1, GATA-3, TCF-1, and Notch, which bind to multiple locations on the gene locus (Li et al., 2013; Kueh et al., 2016). However, even when these developmentally controlled transcription factors have been fully mobilized, Bcl11b activation occurs only after an extended time delay of ~4 days, allowing pre-commitment expansion of progenitors (Kueh et al., 2016). During activation, the Bcl11b locus remodels its epigenetic state, undergoing changes in DNA methylation and histone modification (Ji et al., 2010; Zhang et al., 2012), nuclear positioning, genome compartmentalization and looping interactions (Hu et al., 2018), and expression of a cis-acting lncRNA transcript (Isoda et al., 2017). These observations suggest that the dynamics of Bcl11b activation could be determined by epigenetic processes as well as transcription factors.
Figure 1 with 1 supplement see all
Dual-color Bcl11b reporter strategy can reveal epigenetic mechanisms controlling T-cell lineage commitment.
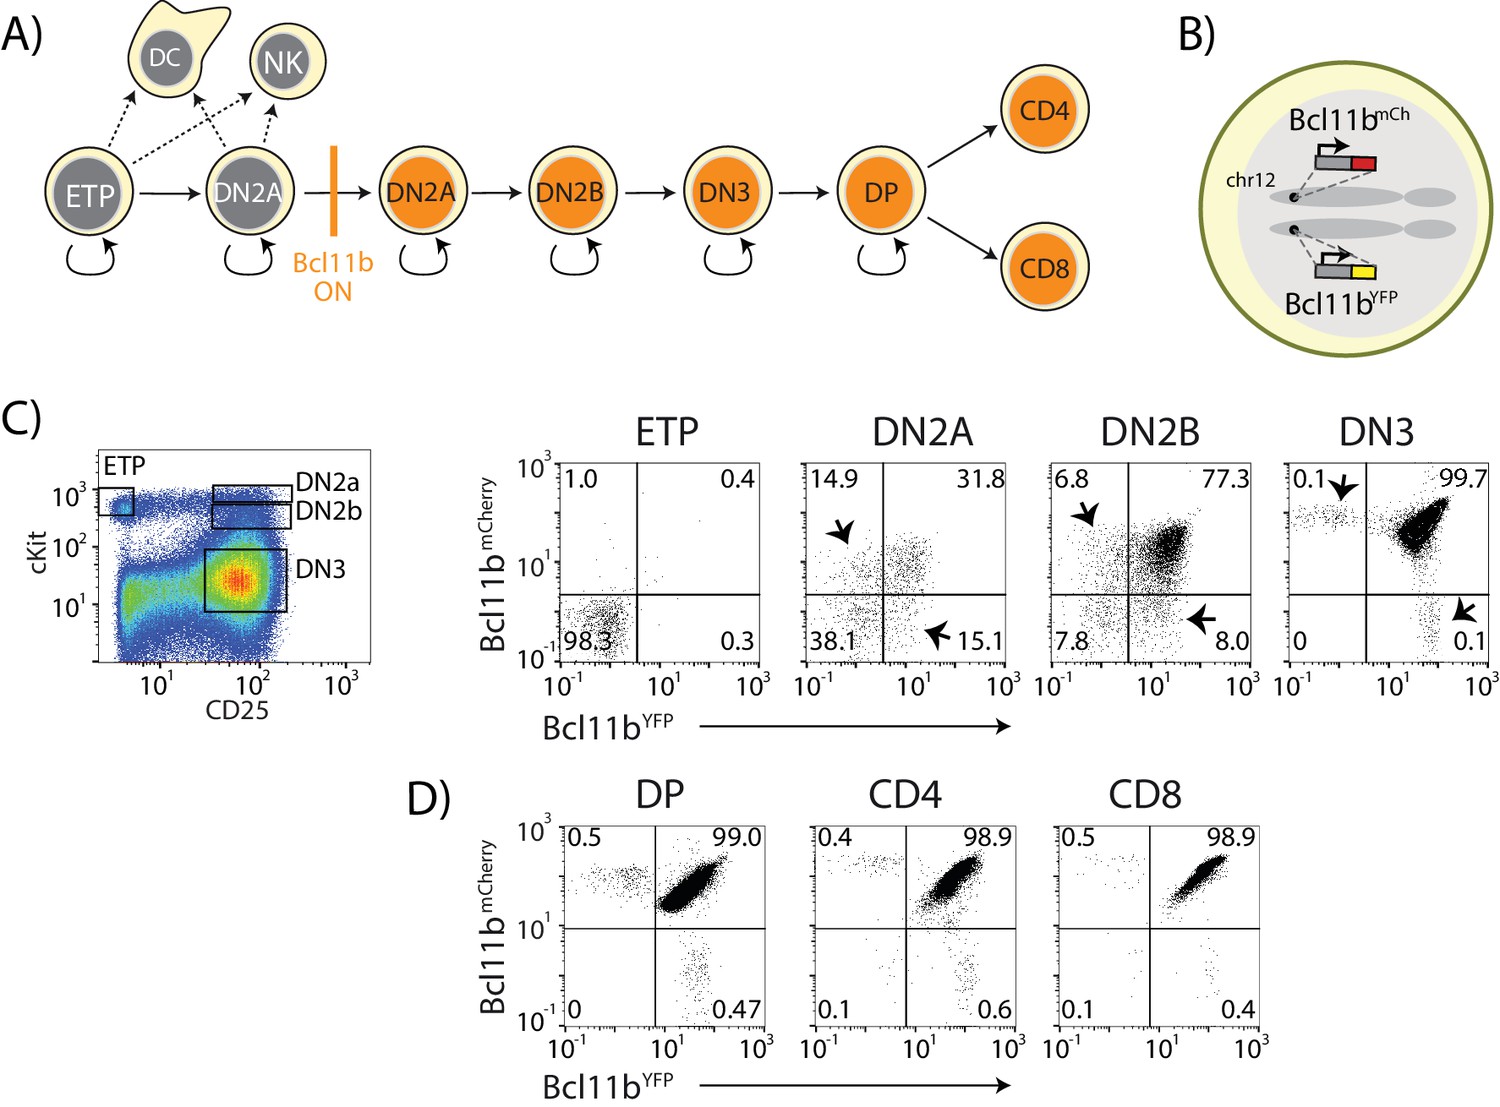
(A) Overview of early T-cell development. Bcl11b turns on to silence alternate fate potentials and drive T-cell fate commitment. ETP – early thymic progenitor; DN2 – CD4- CD8-double negative-2A progenitor; DP – CD4+ CD8+; NK – natural killer; DC – dendritic cell. (B) Dual-allelic Bcl11b reporter cells, where two distinguishable fluorescent proteins (YFP and mCherry) are inserted non-disruptively into the same sites on the two endogenous Bcl11b loci. (C) Flow cytometry plots show cKit versus CD25 levels in CD4-CD8- double negative (DN) thymic progenitors (left), along with Bcl11b-YFP versus Bcl11b-mCh expression levels in the indicated DN progenitor subsets from dual Bcl11b reporter mice. Arrowheads indicate cells expressing one copy of Bcl11b. (D) Flow plots show Bcl11b-YFP versus Bcl11b-mCh levels in CD4+CD8+double positive (DP) T-cell precursors from the thymus (left), or CD4 (center) or CD8 (right) T-cells from the spleen. Results are representative of analysis of 6–8 mice from two independent experiments. See also Figure 1—figure supplement 1.
To separately follow two Bcl11b copies in developing cells, we engineered a dual-color reporter mouse, where the two Bcl11b copies are tagged with distinguishable fluorescent proteins. We then used quantitative live-cell imaging to follow Bcl11b activation dynamics in single progenitor lineages, along with mathematical modeling and perturbation experiments to dissect the relative contributions of cis- and trans- acting inputs to Bcl11b regulation. Our results revealed that activation of Bcl11b and consequent T-cell commitment require a stochastic, cis-acting epigenetic step on the Bcl11b locus. This step occurs independently at the two alleles in the same cell, with a slow timescale spanning multiple days and cell cycles. A separate trans-acting step, controlled by the T-cell developmental signal Notch, occurs in parallel with this cis-acting step and provides an additional necessary input for Bcl11b activation. Finally, we found that over the course of development, T-cell progenitors lose the ability to activate the cis-epigenetic switch, and as a result, can progress to final differentiated states with only one Bcl11b locus stably activated. Together, these results show that intrinsically stochastic events occurring at single gene copies can determine the timing and outcome of mammalian cell fate decisions.
Results
Two Bcl11b copies show slow, independent activation in single progenitor lineages
We generated a double knock-in reporter mouse strain, with an mCitrine yellow fluorescent protein (YFP) inserted non-disruptively in the 3’-untranslated region of one Bcl11b copy and an mCherry red fluorescent protein (mCh) at the same site in the other copy (Figure 1B and Figure 1—figure supplement 1). Both Bcl11b copies contain a floxed neomycin resistance cassette downstream of the fluorescent protein (Figure 1—figure supplement 1); however, we have shown conclusively, using Cre-mediated excision, that this cassette has no effect on Bcl11b activation (Kueh et al., 2016). We isolated thymocyte populations at different stages of development and differentiation directly from dual reporter Bcl11b mice, and measured the fraction of cells expressing Bcl11b from each allele at stages spanning the initial onset of Bcl11b expression (Figure 1C). As reported previously (Kueh et al., 2016; Tydell et al., 2007), Bcl11b was inactive in early T-cell progenitors (ETPs), and began to turn on in the subsequent CD4, CD8 double negative (DN)2a stage, becoming expressed in all cells throughout the rest of T-cell development (Figure 1A,C,D). By DN2b and DN3 stages, the large majority of cells had turned on both Bcl11b copies. These transitions involve multiple cell cycles each, with about 2 days between late ETP and DN2a and about 3 days between DN2a and DN2b (Kueh et al., 2016). However, in the DN2a compartment where Bcl11b gene activation begins, a significant fraction of the cells expressed only one copy of Bcl11b, with roughly equal fractions of cells expressing either the YFP or mCherry (mCh) alleles (Figure 1C, arrowheads). This suggested that the two Bcl11b copies could turn on at different times in the same cell during development.
To determine directly whether two Bcl11b copies switch on independently in the same cell, we used multi-day timelapse imaging to follow the two Bcl11b fluorescent reporters in clonal lineages of developing progenitors. We isolated Bcl11b-negative DN2a T-cell progenitors from dual Bcl11b reporter mice, transduced them with cyan fluorescent protein (CFP)-expressing retroviral constructs for cell tracking, and cultured them in vitro at limiting dilution with OP9-DL1 stromal cells (Schmitt and Zúñiga-Pflücker, 2002), confining them in microwells to allow tracking of descendants of each progenitor over multiple days (Figure 2A). We used OP9-DL1 cells to present the Notch ligand DL1, a critical T-cell developmental signal, and included the supportive cytokines Interleukin (IL)−7 and Flt3 ligand (see Materials and methods). The ~1 hr interval between successive frames did not permit complete lineage tracking due to rapid cell movement (Video 1), but still enabled mapping and visualization of all descendants, and determination of coarse-grained lineage relationships (Figure 2B,C, bottom left).
Figure 2 with 1 supplement see all
Two copies of Bcl11b switch on independently and stochastically in the same cell in single lineages of T-cell progenitors.
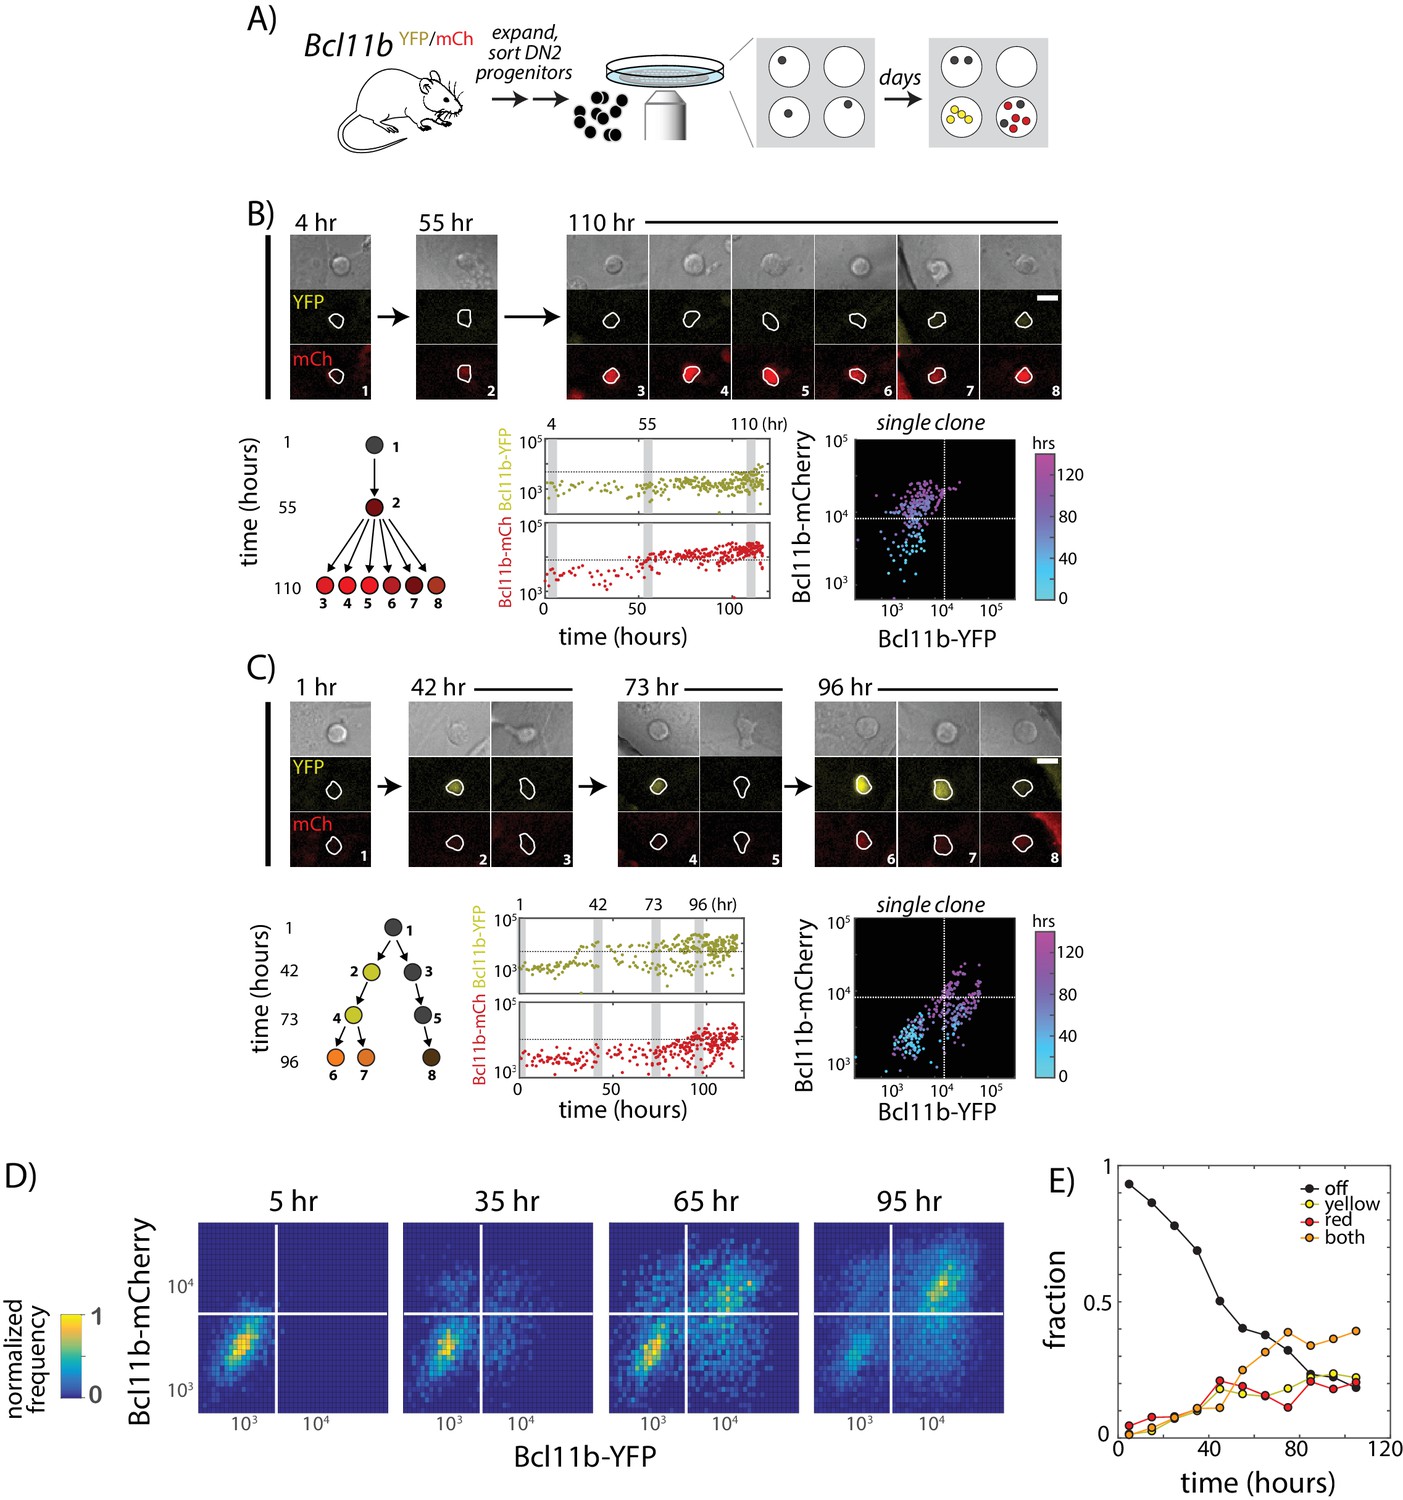
(A) Bcl11b-negative DN2 cells derived from bone-marrow progenitors were isolated by flow cytometry, cultured within microwells, and followed for 5 days using fluorescence imaging. Cells were then segmented using automated image analysis. (B–C). Dynamics of Bcl11b activation in two representative clonal progenitor lineages. Timelapse images (top) show developing T-cell progenitors from two representative clones (left), with segmented cell boundaries in white. Numbers (top left) indicate time in hours. Scale bar = 10 microns. Trees (bottom left) show coarse-grained cell lineage relationships for the cells shown here. Plots (center, lower rows) show Bcl11b-YFP and Bcl11b-mCh expression time traces in all cells from a single clone, with vertical gray bars indicating the time points of the image shown on the left. Horizontal lines indicate activation threshold. Colored scatterplots (bottom right) show time evolution of Bcl11b-mCh versus Bcl11b-YFP levels in single clones, from 0 hr (cyan) to 120 hr (purple). (D) Heat maps show Bcl11b-YFP and Bcl11b-mCh distributions in the polyclonal population at the indicated time points. White lines represent Bcl11b expression thresholds. Color bar (left) represents normalized cell numbers at each time point. (E) Fractions of cells having different Bcl11b allelic expression states over time, obtained by mixed Gaussian fitting of the heat maps shown. Data represent a cohort of ~200 starting cells from a single timelapse movie. Overall, data show that Bcl11b switches on slowly and stochastically in single lineages of progenitors, maintaining alternate activity states in the same clone, heritable across many divisions. Results are representative of three independent experiments. See also Figure 2—figure supplement 1 and Video 1.
-
Figure 2—source data 1
Differential Bcl11b allelic expression states over time for a cohort of ~200 starting cells.
File contains a table of the fractions of mono-, bi-allelic, and non-expressing Bcl11b cells sampled at various time points over 105hrs. This data is plotted in Figure 2E.
- https://doi.org/10.7554/eLife.37851.006
Video 1
Timelapse movie of a single clonal DN2 progenitor lineage.
Bcl11b-YFP-mCh- DN2 progenitors were cultured on OP9-DL1 monolayers with 5 ng/mL IL-7 and Flt3-L within individual PDMS micro-wells, and continuously imaged for 100 hr. Images show superposition of a DIC image (gray) and cellular fluorescent intensities from the Bcl11b-mCherry (red) and Bcl11b-YFP (green) channels, with segmented cell boundaries shown in white. For clarity, images show only the fluorescence intensities within the cell boundaries, excluding auto-fluorescence from well boundaries and OP9-DL1 monolayers. Scatter-plot (bottom-right) updates with each frame to show fluorescent intensities of segmented cells at corresponding time points. Scale bar = 50 microns.
We had previously shown that about 3 days are required for half of the cells in such DN2a populations to turn on any Bcl11b expression (Kueh et al., 2016). In theory, this delay could reflect requirement for activation of some additional transcription factor. However, even a novel transcription factor would be able to work on both alleles in parallel. Instead, strikingly, imaging revealed strongly asynchronous activation of the two Bcl11b copies in the same cell during this time period. Within single clonal lineages from DN2a progenitors, one copy of Bcl11b could switch on multiple days and cell generations before the other (Figure 2B,C and Video 1), giving rise to distinct allelic expression states that persisted over multiple divisions. Across clones, however, similar percentages of cells activated Bcl11b-YFP first as compared to those turning on Bcl11b-mCherry first, consistent with independent activation (Figure 2D,E). Similar activation rates for both alleles were also observed on average across populations from individual mice regardless of parent-of-origin (data not shown), ruling out any imprinting-type bias. These results indicated that the allelic bias within clones was clonally inherited.
From a dynamic point of view, we observed that in some clones, the times at which a Bcl11b allele first turned on differed between progeny of a single cell (Figure 2C, 42 hr), such that individual progenitors frequently gave rise to clonal descendants with multiple distinct states of Bcl11b allelic activation (53.3% heterogeneous after 4d, N = 15, Figure 2—figure supplement 1). A substantial percentage (~40%) of all cells remained mono-allelic in expression after 4d (Figure 2E), indicating that stochastic locus activation occurs with a slow time constant spanning multiple days. Furthermore, the fractions of cells mono-allelically expressing Bcl11b-YFP or Bcl11b-mCh increased with the same dynamics, indicating that each locus is triggered with the same stochastic activation rate. We note that the percentages of mono-allelic cells generated at given timepoints on OP9-DL1 co-culture differed from those in DN2b progenitors from the thymus, which have emerged from Bcl11b non-expressing DN2a cells at some unknown time in the past (40% versus ~15%, Figure 1C). This could reflect differences in the kinetics of Bcl11b allelic activation between the OP9-DL1 system and the thymic microenvironment. However, in both cases, we observed clearly defined Bcl11b mono-allelic as well as bi-allelic expressing populations, implying that the same slow cis- event observed in in vitro tracking experiments also governs Bcl11b activation and T-lineage commitment in the thymus. Taken together, these results suggest that timing of the Bcl11b activation switch – and the ensuing commitment to become a T-cell – is controlled independently at each Bcl11b allele by a stochastic and remarkably slow rate-limiting step.
A distal enhancer modulates stochastic Bcl11b locus activation
The stochastic transition of Bcl11b from an inactive to active state may be controlled by specific cis-regulatory DNA elements on the Bcl11b locus. Consistent with this idea, we found that graded changes in Notch signaling, GATA-3 activity, and TCF-1 activity alter the likelihood of all-or-none activation, rather than the amplitude of transcription (Kueh et al., 2016). Indeed, in a number of systems, cis-regulatory elements do not appear to control transcriptional amplitudes, but instead modulate the probabilities of all-or-none activation (Fukaya et al., 2016; Khan et al., 2011; Walters et al., 1995; Weintraub, 1988). To test how stochastic activation of individual Bcl11b alleles may be controlled, we examined the effect of disrupting the one known positive cis-regulatory element region, which resides ~850 kb downstream of Bcl11b within a ‘super enhancer’ at the opposite end of the same topologically associated domain (Li et al., 2013) (Figure 3A). This region, which shows distinctive histone marking and some T-lineage-specific transcription factor occupancy even before Bcl11b activation (Kueh et al., 2016), lies about 11 kb from the promoter of a Bcl11b-associated lncRNA, and loops to the Bcl11b gene body in a T-cell lineage specific manner (Hu et al., 2018; Isoda et al., 2017; Li et al., 2013). Like the Bcl11b locus itself, this enhancer region is marked by H3K27me3 in non-T lineage cells (Li et al., 2013).
Figure 3 with 4 supplements see all
A distal enhancer region controls Bcl11b activation probability.
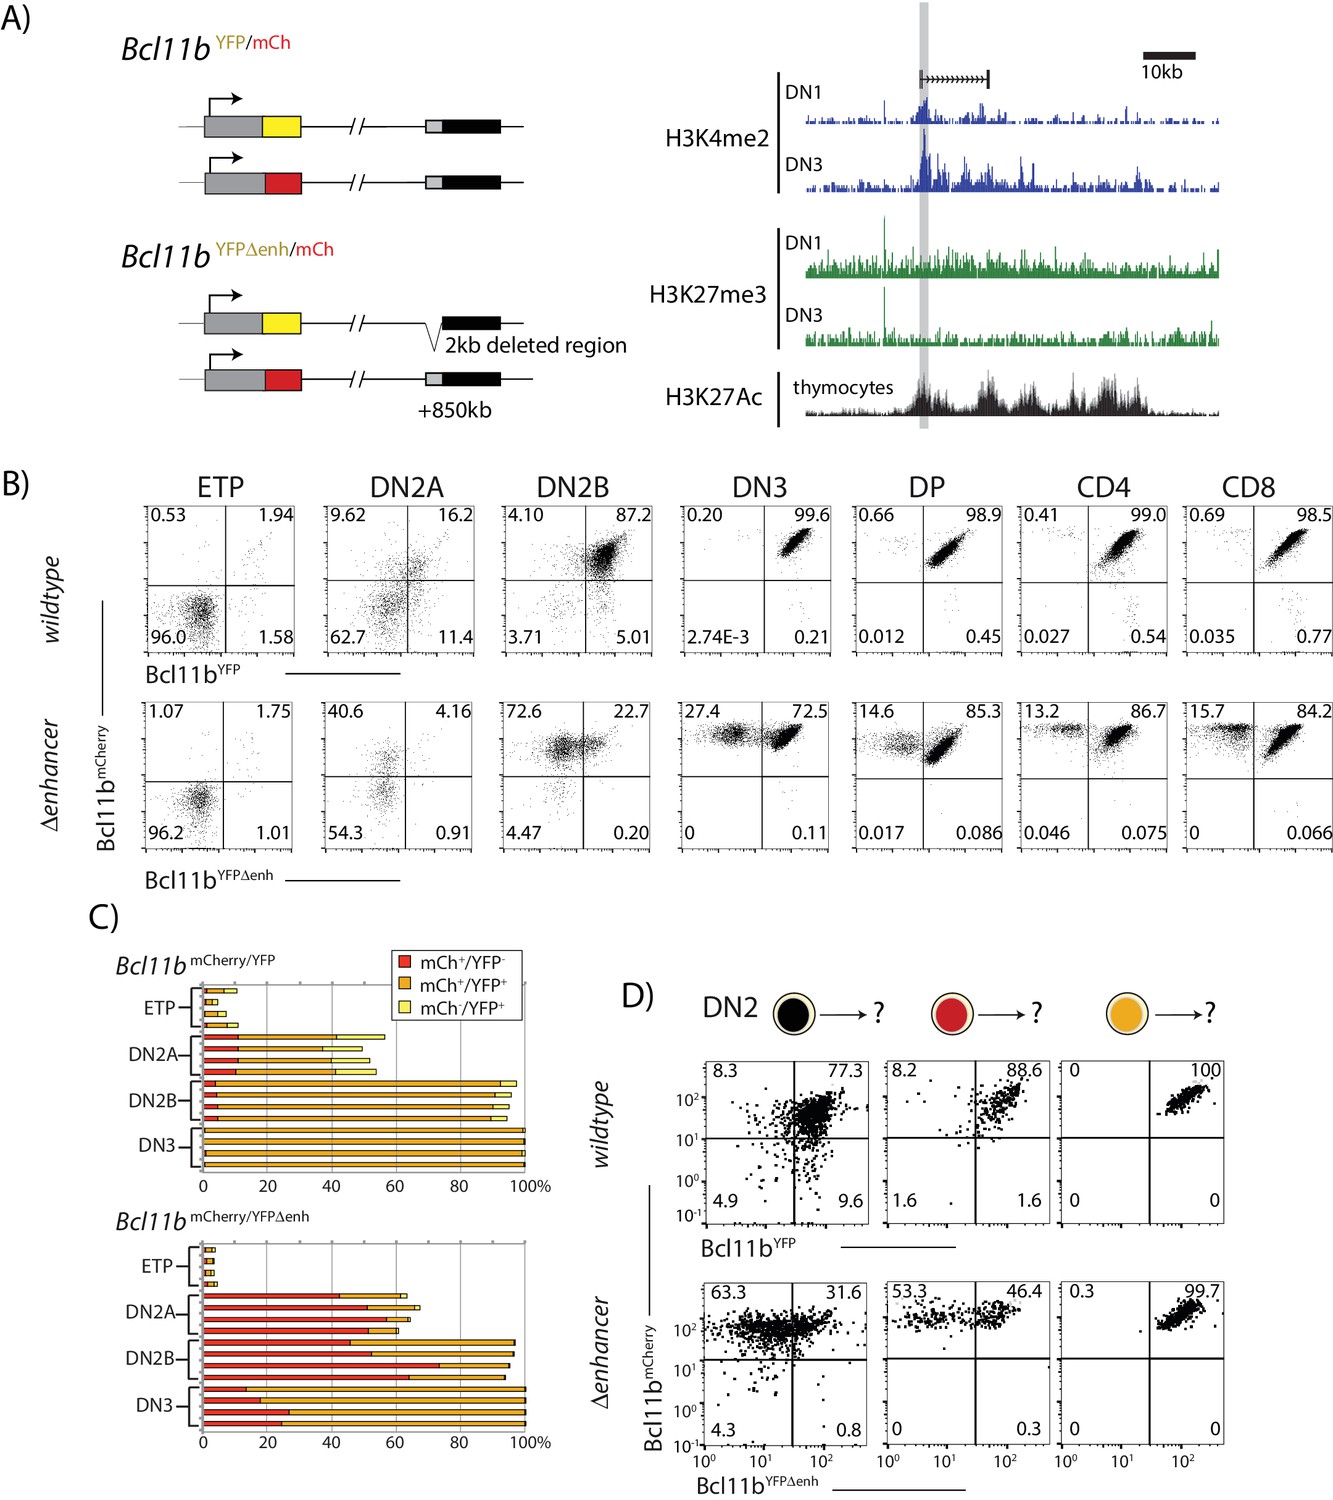
(A) Schematic of normal and enhancer-deleted two-color Bcl11b reporter strains (left). Genome browser plots (right), showing +850 kb enhancer of Bcl11b, showing distributions of histone marks (H3K4me2, H3K27me3, and H3K27Ac) and an associated LncRNA (Isoda et al., 2017). Orientation is with transcription from left to right (reversed relative to genome numbering). Gray shaded area indicates the enhancer region deleted using gene targeting (removed region: chr12:108,396,825–108,398,672, mm9). (B) Flow cytometry plots show Bcl11b-mCh versus Bcl11b-YFP levels in developing T-cell populations from dual Bcl11b reporter mice, either with an intact YFP enhancer (top), or a disrupted YFP enhancer (bottom). Results are representative of two independent experiments. (C) Bar graphs showing the percentages of cells in early thymic populations with mono- and bi-allelic expression of wildtype mCherry and wildtype YFP versus mutant YFP alleles in wildtype Bcl11bYFP/mCh and Bcl11bYFPΔEnh/mCh dual reporter mice, demonstrating the reduced frequency of mutant YFP allele expression relative to the wildtype mCherry allele in the same cells. Each bar shows results from one mouse; n = 4 mice of each strain are shown. (D) DN2 progenitors were sorted for different Bcl11b allelic activation states as indicated, cultured on OP9-DL1 monolayers for 4 days, and analyzed using flow cytometry. Flow plots show Bcl11b-mCh versus Bcl11b-YFP levels of cells generated from precursors with a normal (top) or disrupted (bottom) YFP enhancer, showing defective YFP up-regulation from the mutant relative to the wildtype alleles. Enhancer disruption reduces the probability of switch-like Bcl11b activation, but does not affect expression levels after activation. Results are representative of two independent experiments. See also Figure 1—figure supplement 1, and Figure 3—figure supplement 1–4.
-
Figure 3—source data 1
Comparison of Bcl11b allelic expression between wildtype and mutant dual reporter mice in early thymic populations.
Data gives the population percentages of mono- and bi-allelic expressing cells for early thymic populations analyzed using flow cytometry. 4 biological replicates of each strain (wildtype and enhancer deleted) are presented. Bar graphs in Figure 3C are generated from this data.
- https://doi.org/10.7554/eLife.37851.016
Using standard gene targeting, we deleted this distal ~2 kb enhancer region on the Bcl11b-YFP allele, leaving the Bcl11b-mCherry allele intact, to generate Bcl11bYFPΔEnh/mCh dual reporter mice (Figure 3A and Figure 1—figure supplement 1), and then analyzed resultant effects on YFP regulation in different T-cell subsets (Figure 3B,C and Figure 3—figure supplements 1–3). These were analyzed either from established young adult Bcl11bYFPΔEnh/mCh mice (Figure 3B,C and Figure 3—figure supplements 1,2) or from adult chimeras populated with fetal liver cells from the F0 generation (Figure 3—figure supplement 3A,B). The non-disrupted Bcl11b-mCherry allele served as an internal, same-cell control. At the ETP stage, essentially all Bcl11b alleles were silent, regardless of whether they had an intact or disrupted enhancer, as expected (Figure 3B). During the DN2a and DN2b stages, the enhancer-disrupted Bcl11b-YFP allele showed dramatically reduced activation compared to the Bcl11b-mCherry allele in the same cell. Interestingly, at later developmental stages in the thymus and in peripheral T-cell subsets (CD4, Treg, CD8) a large fraction of cells showed expression of the enhancer-disrupted YFP allele, along with the wild-type Bcl11b-mCherry allele (Figure 3B,C and Figure 3—figure supplements 1,2,3), indicating that the targeted element is not indispensable for Bcl11b activation. However, a small but significant percentage of cells still failed to activate the enhancer-disrupted allele, and instead persisted in a mono-allelic state with only expression of the Bcl11b-mCherry allele (Figure 3B,C and Figure 3—figure supplements 1,2,3). Mono-allelic cells were found in memory as well as naïve T-cell subsets (Figure 3—figure supplement 2), implying that these mono-allelically expressing cells are capable of immune responses, as expected from the normal phenotype of Bcl11b knockout heterozygotes. As shown in fetal liver chimeras, generation and persistence of Bcl11b-mCherry mono-allelic cells due to the mutant Bcl11bYFPΔEnh allele were determined cell intrinsically (Figure 3—figure supplement 3). However, from flow cytometric profiles, cells that turned on the disrupted allele expressed it at normal levels, suggesting that the enhancer mutation reduced the stochastic rate of Bcl11b activation, but not its expression level once activated.
To directly test this hypothesis, we measured Bcl11b-YFP activation with or without enhancer disruption, by sorting DN2 progenitors with zero or one allele activated, culturing on OP9-DL1 feeders, and analyzing activation dynamics of both alleles using flow cytometry. Consistently, enhancer disruption greatly reduced the fraction of cells that turned on Bcl11b-YFP, but did not perturb its expression level in cells that already successfully activated it (Figure 3D). Neither the wildtype nor the enhancer-disrupted allele reverted to silence after being activated. These results show that the deleted region within the distal Bcl11b super-enhancer works selectively, in cis, to accelerate the irreversible stochastic switch of the Bcl11b locus from an inactive to an active state.
The activation of the enhancer-disrupted Bcl11b allele observed in many DN2b and later cells suggests that there are other cis-regulatory elements on the Bcl11b locus that can also promote stochastic locus activation. The extended intergenic gene desert between Bcl11b and the next gene, Vrk1, is rich in potential regulatory elements that could compensate for the disruption of the enhancer element in the cells activating the YFP allele (Hu et al., 2018). Alternatively, the intact enhancer at the mCherry-tagged locus in the same cell could activate the enhancer-deleted Bcl11b locus in trans, but this was ruled out when we bred mice with the enhancer disruption to homozygosity (Bcl11bYFPΔEnh/YFPΔEnh). Progenitors from these mice were still able to turn on Bcl11b and to undergo T-cell development to CD4, CD8 double positive (DP) and single positive (SP) cells, and all the cells in these populations had normal levels of Bcl11b expression (Figure 3—figure supplement 4). Thus, the enhancer we identified works together with other regulatory elements specifically to control Bcl11b activation timing.
A parallel trans-acting step enables expression from an activated Bcl11b locus
The known transcriptional regulators of Bcl11b—TCF-1, Gata3, Notch1 and Runx1—are already strongly expressed prior to entering the DN2 stage, suggesting they are not limiting for Bcl11b activation in DN2 cells. The data presented above show that cis-acting mechanisms can substantially slow activation at individual alleles. However, additional trans-acting factors or post-translational changes in these factors could still limit the kinetics of Bcl11b activation, working either upstream of the cis-opening mechanism or as a separate, independent requirement. To gain insight into whether such trans-acting inputs are necessary to explain the observed dynamics, and how they could act together with the cis-acting step, we developed a set of minimal models requiring the cis-activating step either alone or together with an additional trans-acting step (see Appendix for model details). While the analysis is subject to technical limitations such as fluorescent protein sensitivity and time delays in expression, and the actual biological behavior is undoubtedly more complex, these minimal models, nevertheless, enable discrimination among broad classes of behavior.
To obtain unbiased estimates of the population fractions from imaging data (Figure 2), we fit four two-dimensional Gaussians to single-cell Bcl11b-YFP and Bcl11b-mCherry data (see Materials and methods for details). We note that estimated population fractions increased after a delay (Figure 4B, gray-shaded area), due to a time lag in fluorescence accumulation and detection after activation (Figure 4—figure supplement 1). We accounted for this lag by incorporating a fixed time delay into all of our model fits (see Materials and methods).
Figure 4 with 2 supplements see all
A trans-acting step, occurring in parallel with the cis-acting step, provides an additional input for Bcl11b activation.
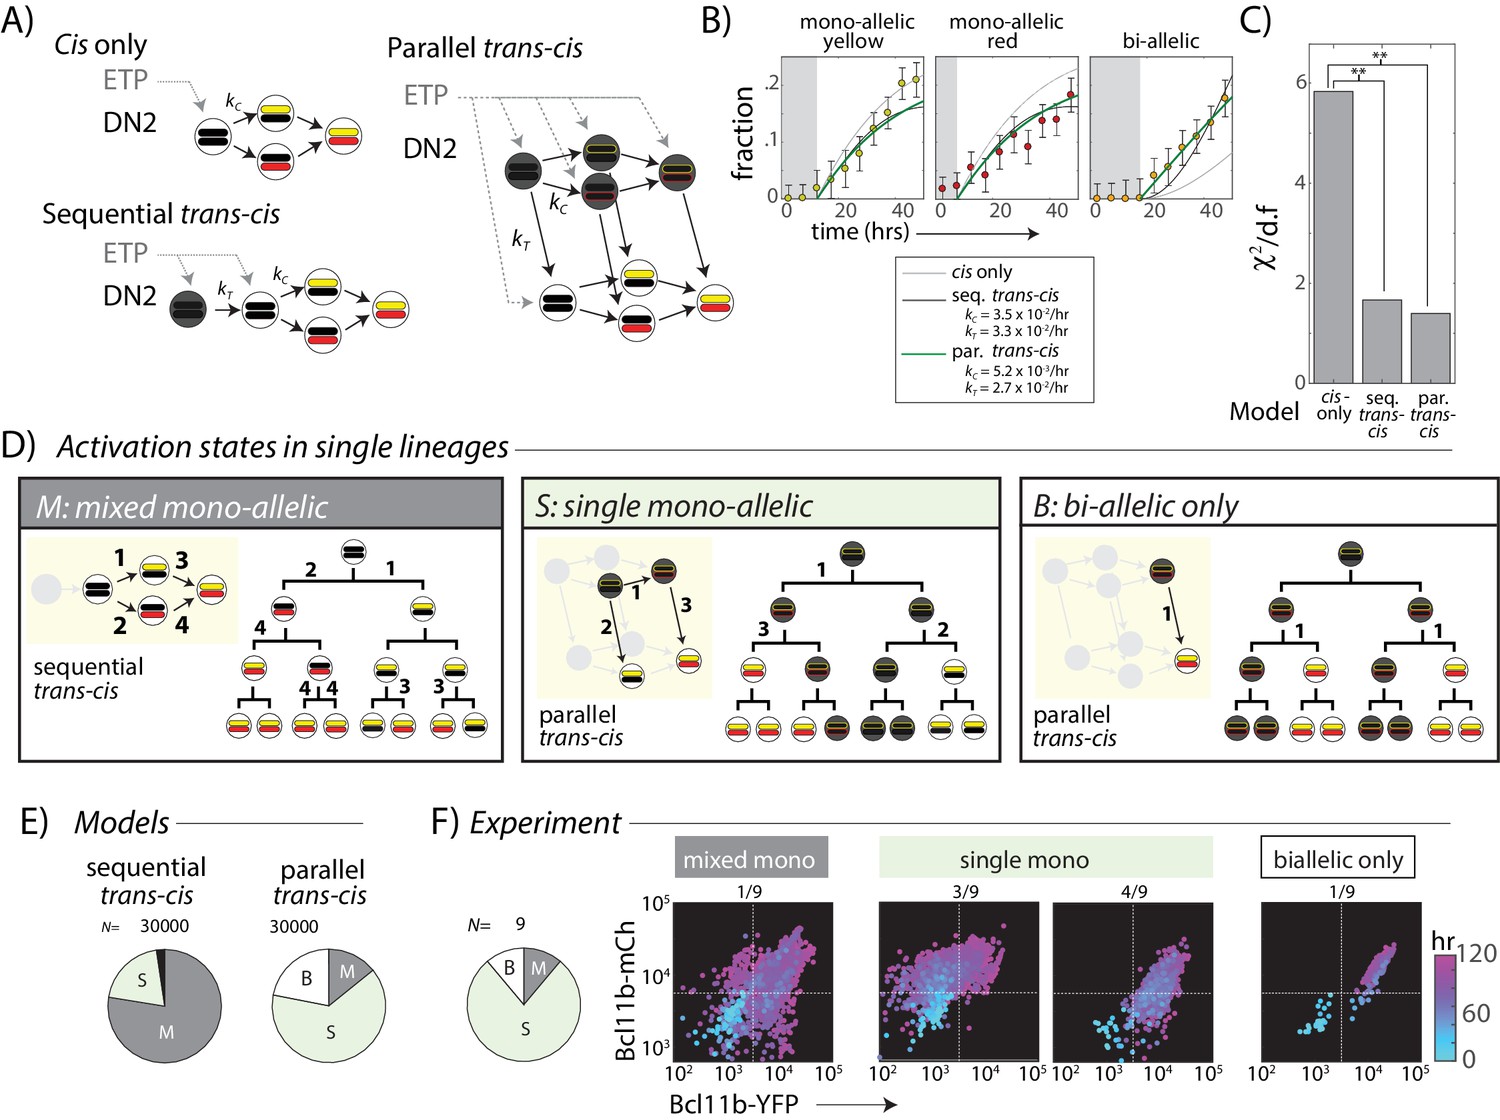
(A) Candidate models for Bcl11b activation from the DN2 stage, involving a single cis-acting switch (top left), sequential trans-, then cis-acting switches (bottom left), and parallel, independent trans- and cis- acting switches (right). (B) Plots show best fits of different models to the time evolution of Bcl11b allelic activation states, observed by timelapse imaging (Figure 2). Gray-shaded area indicates time delay for detection of indicated allelic state as a result of the time required for stable fluorescence protein accumulation. Best fit rate constants indicated in legend. (C) Bar charts show reduced chi-squared values for each model fit, that is the normalized sum-squared fit errors over all time points and allelic states, divided by the degrees of freedom (d.f.) (see Materials and methods). Both sequential and parallel trans-cis models fit the data significantly better than the cis-only model (F-test, F = 12.2, p=0.0052, sequential vs. cis-only model; F = 8.13, p=0.021, parallel vs. cis-only model). (D) Three possible classes of Bcl11b activation states observable from clonal lineage data. Lineage trees and transition diagrams show examples of simulated lineages that fall into the indicated classes. (E) Pie charts show expected distribution of allelic activation states predicted for clonal lineages of non-expressing progenitors in either the sequential (left) or the parallel (right) trans-cis model, obtained from N = 30,000 simulations, using parameters derived from bulk fitting (see Appendix). (F) Pie chart (left) shows observed distribution of activation states observed across an entire imaging time course. Colored scatterplots (right) show Bcl11b-mCh versus Bcl11b-YFP levels of single-cell lineages, falling into the indicated categories. Clones were scored according to observable fluorescence across an entire developmental trajectory, from 0 hr (cyan) to 120 hr (purple). The observed frequency of clones with ‘single mono-allelic’ expression of Bcl11b (7/9 = 77%) is significantly different than that predicted for the sequential trans-cis Model (20.1%, **- p<0.001, χ2 = 14.9, d.f. = 1), but not significantly different from that predicted for the parallel trans-cis Model (63.9%, χ2 = 0.27, d..f = 1, n.s.). Results are representative of three independent experiments. See Figure 4—figure supplement 2 for data for independent replicate experiments.
-
Figure 4—source data 1
Quantitative analysis of timelapse imaging data used to test three minimal models.
Figure 4—source data 1B shows the mean population fractions and 95% confidence intervals of mono- and bi-allelic expressing cells as observed by timelapse imaging. Figure 4B was plotted from these data points. Figure 4—source data 1C gives the reduced chi-squared values calculated for each model and is represented in Figure 4C. Figure 4—source data 1E, plotted as pie charts in Figure 4E, shows expected fractions of each class of Bcl11b activation state from 30,000 Monte-Carlo simulations for both sequential and parallel trans-cis models. Figure 4—source data 1F shows number of single cell lineages scored for each class of Bcl11b activation state in each observed experiment (3 independent experiments). Both sequential and parallel trans-cis models predict different frequencies of activation states.
- https://doi.org/10.7554/eLife.37851.020
In the simplest ‘cis only’ model, we assume that only the cis-activation step is required for Bcl11b activation in DN2 stage, with all required trans-acting steps having occurred prior to the ETP-DN2 transition (Figure 4A, left). Because cis-activation is controlled at each allele by a single rate constant, this model predicts a substantial lag between the appearance of mono-allelic cells, which require one cis-activation event, and the appearance of bi-allelic cells, which require two independent events (Appendix). By contrast, in experiments, bi-allelic cells accumulated immediately (Figure 4B and Figure 4—figure supplement 1), without a substantial lag relative to mono-allelic ones, resulting in a poor fit of the data to the cis-only model (Figure 4A). These results rule out the simplest cis-only model, and suggest that additional trans events may still limit Bcl11b expression at the DN2 stage.
We next considered two models in which trans-acting events affect Bcl11b activation. In the ‘sequential trans-cis’ model, a trans step must occur prior to the cis-activation step (Figure 4A). This trans step could represent activation of a factor or epigenetic regulator that is necessary for cis-activation. In the ‘parallel trans-cis’ model, both cis and trans steps are similarly necessary, but can occur in either order (Figure 4A). In this case, the trans step could represent activation of a factor that drives Bcl11b transcription, but only from a cis-activated locus. While our models only consider the DN2 stage, we note that they allow for some events to occur prior to the ETP-DN2a transition (Figure 4A, gray dotted arrows). When the trans-acting step is rate limiting, both of these models reduce bi-allelic lag by allowing the two alleles to turn on in relatively quick succession (in either model) or simultaneously (in the parallel model). For this reason, both the sequential and parallel trans-cis models reduced the lag prior to accumulation of bi-allelic cells, and hence fit the data significantly better than the ‘cis only’ model (Figure 4B, p<0.01 for both models).
While the sequential and parallel models show similar bulk behavior, they make divergent predictions about the distributions of mono-allelic and bi-allelic expression states within clonal lineages. For example, in the sequential model, silent progenitors are equally likely to activate one or the other Bcl11b allele, and are thus more likely to show mono-allelic expression from both alleles in single clones (Figure 4D, ‘mixed mono-allelic’). In contrast, in the parallel model, non-expressing progenitors could have one cis-activated but unexpressed Bcl11b allele due to absence of the trans step. Clonal descendants of such cells would be predisposed to show mono-allelic expression from the same allele before activating the second (Figure 4D, ‘single mono-allelic’). Therefore, to discriminate between sequential and parallel activation models, we used Monte-Carlo methods to simulate the dynamics of Bcl11b activation in all descendants of a single starting cell over four generations for each of the two models (Appendix), using the parameters that gave the best fits to the global time course data in Figure 4B. Altogether, we generated and analyzed N = 30,000 clonal lineages for each model.
As intuitively expected, the sequential trans-cis model predominantly generated ‘mixed mono-allelic’ clones containing cells with mono-allelic expression of both alleles, with or without bi-allelically expressing cells (Figure 4D,E, ‘mixed mono-allelic’). These distributions reflect the most likely event trajectory in the sequential model, in which independent, unsynchronized cis-activation events occur at each Bcl11b locus in different cells from a single ancestor. Within a cohort of clonal descendants competent to activate the cis-step, the first-activated allele choice occurs independently in each cell, generating multiple paths towards bi-allelic Bcl11b activation within a single clone. By contrast, the parallel model generated a much smaller fraction of such ‘mixed mono-allelic’ clones, and predominantly generated clones in which mono-allelic expression was restricted to the same allele across most cells (Figure 4D,E, ‘single mono-allelic’). This intra-clonal bias arises when the cis-acting step at one locus precedes the trans-step, forcing still-non-expressing DN2a precursors to preferentially activate that locus once the trans-acting event occurs (Figure 4D). Because the rate of cis-activation is low (τc ~ 4–6 days in this model), multiple individual cells can be generated within a clone that have inherited the same activated allele of the locus, prior to full bi-allelic expression. Moreover, the parallel but not the sequential trans-cis model gave rise to a small fraction of clones that showed only bi-allelic expression (Figure 4D,E, ‘bi-allelic only’), reflecting the activation of the trans-limiting step in cells that had already undergone cis-activation of both Bcl11b copies.
To discriminate experimentally between these two models, we quantified the distribution of Bcl11b allelic activation states generated in clonal lineages from progenitors starting with no Bcl11b activation, observed by timelapse microscopy as described above (Figure 2). Within a clone, we most frequently observed mono-allelic expression from only one specific allele, with or without bi-allelically expressing cells (Figure 4F ‘single mono-allelic’, light green, 7/9 clones, Figure 4—figure supplement 2; similar results observed over three independent experiments), but only rarely observed mono-allelic expression from both loci within the same clone (Figure 4F, ‘mixed mono-allelic’, gray, 1/9 clones). The observed percentage of ‘single mono-allelic’ expressing clones (7/9 = 77%) was significantly greater than that expected from the sequential trans-cis model (20.4%, p<0.005). Moreover, in one clone, we observed concurrent activation of both alleles (Figure 4F), a behavior that would have been exceedingly rare in a sequential model (none observed in 30,000 simulations). Together, these results suggest that a trans-acting step, acting in parallel with the cis-acting step, controls Bcl11b expression.
Notch signaling controls the parallel trans-acting step in Bcl11b activation
Notch signaling drives T-cell fate commitment and provides an important input for Bcl11b expression. While not required to maintain Bcl11b expression in committed cells, it acts earlier to enhance the probability of all-or-none Bcl11b expression at the DN2 stage and stabilize Bcl11b expression shortly after activation, preventing the re-silencing that still can occur in a small fraction of newly expressing cells (Kueh et al., 2016). The Notch intracellular domain is diffusible in the nucleus, but could affect Bcl11b activation by modulating either the cis or trans step in the parallel model. For example, Notch signaling could activate a trans factor that drives Bcl11b transcription from a cis-activated locus, and thereby alter the fraction of cells that express Bcl1b from a cis-activated locus. Alternatively, Notch could affect the rate of the cis-activation process, for instance by enhancing the activity of chromatin-remodeling enzymes on the Bcl11b promoter or enhancer, in which case it might alter the ratio of mono-allelic to bi-allelic activation states. To distinguish between these cases, we first experimentally analyzed the effects of removing Notch signaling on Bcl1b allelic expression patterns, and then compared the results to predictions based on corresponding perturbations in the parallel trans-cis model.
We sorted DN2 cells with no expression, mono-allelic expression or bi-allelic expression of Bcl11b as initial populations, and then cultured them either on OP9-DL1 or OP9-Control feeders to maintain or remove Notch signaling, respectively. After 4 days, we analyzed the resulting Bcl11b allelic expression states using flow cytometry (Figure 5A).
Figure 5 with 1 supplement see all
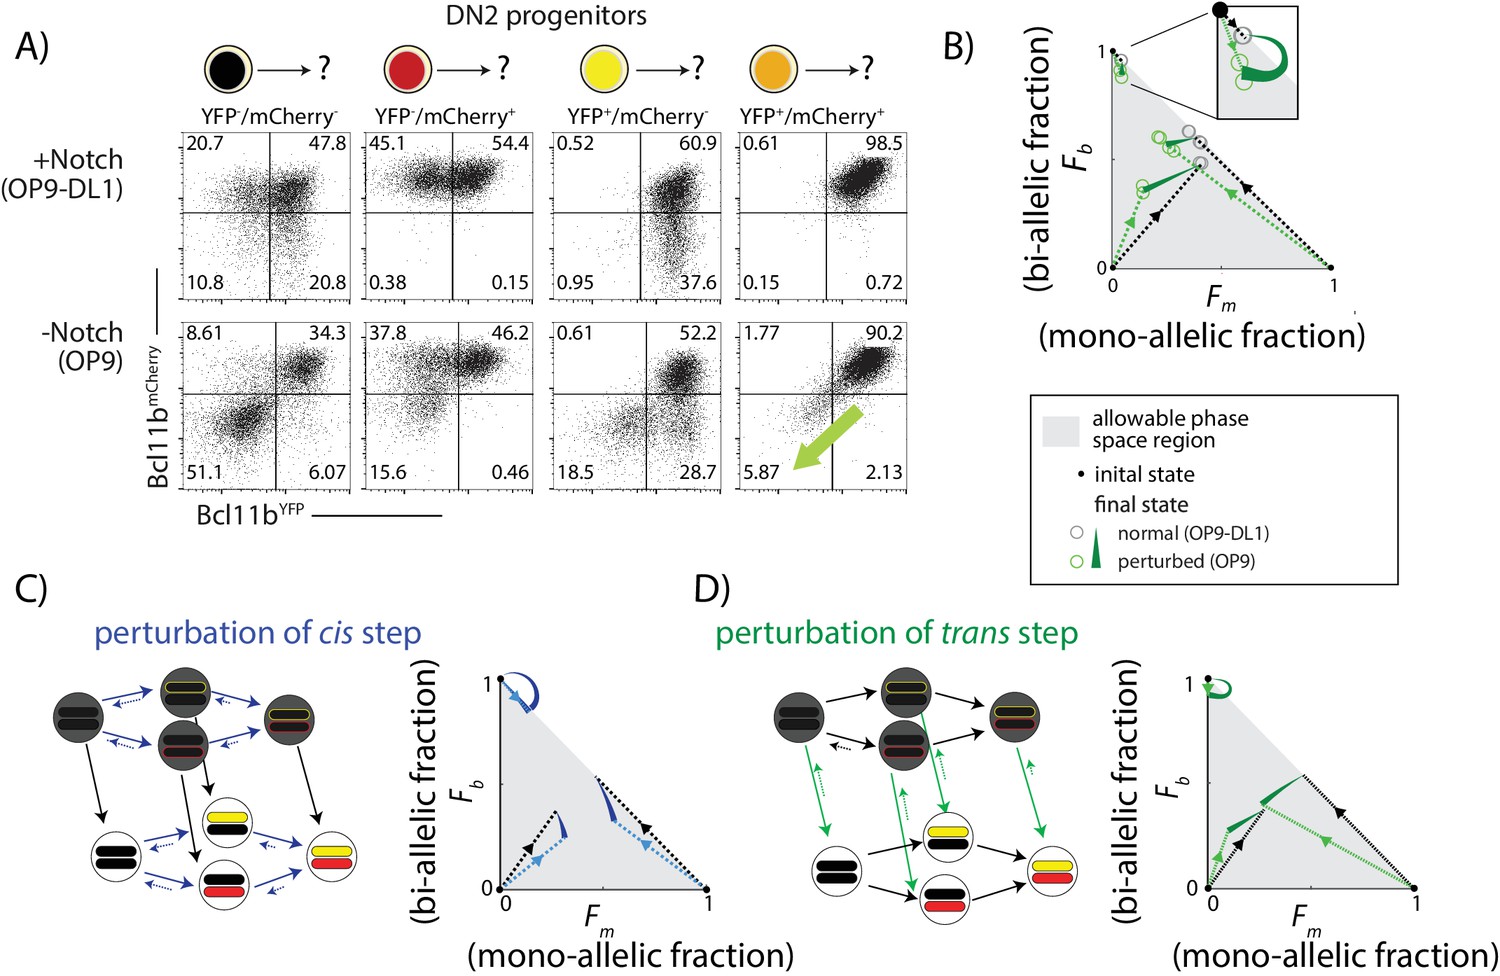
Notch signaling controls a parallel trans-acting step for Bcl11b activation.
BM-derived DN2 progenitors with different Bcl11b allelic activation states were sorted, cultured on either OP9-Control (-Notch) or OP9-DL1 (+Notch) monolayers for four days, and analyzed using flow cytometry. (A) Flow cytometry plots show Bcl11b-mCherry versus Bcl11b-YFP expression levels in analyzed cells. Percentages of non-expressing, mono-allelic expressing (both YFP and mCherry) and bi-allelic expressing cells were used to calculate the locations in the phase space. Note that when Notch signaling is withdrawn from bi-allelically expressing cells, they downregulate both alleles coordinately (green-shaded arrow). (B) Phase space diagrams experimentally obtained from analysis of flow cytometry data. Points in phase space represent the average of 2–4 replicate data points in a single experiment (hollow circles). Inset shows final activation states of bi-allelic starting progenitors upon Notch withdrawal. Results shown are representative of two independent experiments. (C–D) Predicted phase space diagrams for fraction of bi-allelic expressing cells (Fb) against the fraction of mono-allelic expressing cells (Fm, YFP+ and mCh+ combined), for either the sequential trans-cis activation model (C), or the parallel trans-cis model (see Appendix for details). Black (colored) dotted lines connect initial state to the normal (perturbed) final state. Note that actual developmental trajectories may be curved (not shown). Arrows show predicted shifts in final state due to the indicated perturbations. Note that perturbations affect both the rates and reversibility of the indicated reactions. See also Figure 5—figure supplement 1.
-
Figure 5—source data 1
Flow Cytometry Analysis of BM-derived DN2 progenitors cultured in the presence or absence of Notch.
File shows percentages of mono- and bi-allelic state cells analyzed after 4 days culture from each group of starting progenitors. Data was used to generate Figure 5B.
- https://doi.org/10.7554/eLife.37851.023
DL1 removal affected the distribution of Bcl11b allelic expression states differently depending on the state of the starting cell population. For progenitors with no initial Bcl11b expression, DL1 removal decreased the total fraction of cells that subsequently expressed Bcl11b from either allele from 0.9 to 0.5 (sum of mono-allelic and bi-allelic expressing cells, Figure 5A), as expected from the known positive effect of Notch on Bcl11b activation (Kueh et al., 2016). This reduction disproportionately affected mono-allelic expressing cells, such that the fraction of mono-allelic expressing cells relative to bi-allelic expressing cells decreased (from ~0.8 to 0.4, Figure 5A). In progenitors starting with mono-allelic Bcl11b expression, DL1 removal showed a large percentage reduction in the mono-allelic population, with a smaller reduction in the bi-allelic population (~14% versus 20% reduction, from Figure 5A). Finally, in bi-allelic expressing Bcl11b progenitors, most cells maintained expression despite Notch removal, as expected (Kueh et al., 2016), but a small fraction (~0.06) lost expression of both Bcl11b alleles entirely, reverting directly from the bi-allelic to a non-expressing state (Figure 5A, green arrows). To visually summarize these effects of Notch withdrawal, we represented the distribution of non-expressing, mono-allelic, and bi-allelic expressing cell states in the population in each condition from each starting population as points within a triangular region of allowed states in a single diagram (Figure 5B).
To interpret these experimental results, we compared the observed effects with predicted effects of a step-like perturbation in either the cis- or the trans-acting steps of the model (see Appendix). In order to account for reversibility in Bcl11b activation observed upon DL1 removal (Figure 5A), perturbation of the cis or trans step was implemented by both decreasing its forward rate and increasing its backwards rate. Additionally, all perturbations were assumed to have a weaker effect on transitions to or from the Bcl11b bi-allelic expressing state compared to transitions to or from the mono-allelic state. This assumption was designed to reflect the reduced impact of Notch signal withdrawal on cells starting with bi-allelic Bcl11b expression (Bcl11b inactivation was observed in ~6% of bi-allelic expressing progenitors versus ~15–18% of mono-allelic expressing progenitors, Figure 5A). We simulated the model with different strengths of cis or trans perturbations, and generated distributions of Bcl11b allelic activation states from non-expressing, mono-allelic, and bi-allelic starting populations.
Perturbation of the cis-acting step decreased the total fraction of cells expressing Bcl11b from all initial cell populations, as expected (Figure 5C). However, in contrast to experimental observations, this simulated perturbation increased, rather than decreased, the ratio of mono-allelic expressing cells to bi-allelic expressing cells (Figure 5C). It also caused bi-allelic expressing cells to sequentially turn off Bcl11b one allele at a time, rather than simultaneously as observed experimentally. Simulated perturbation of the cis-acting step thus did not match the observed effects of Notch withdrawal (Figure 5B,C).
By contrast, perturbation of the trans-acting step in the model produced effects resembling Notch withdrawal. First, it led to direct reversion of bi-allelic expressing progenitors to a non-expressing state, without passing through mono-allelic intermediates (Figure 5D, green arrows). Simultaneous inactivation of both alleles is difficult to reconcile with Notch affecting independent (cis) effects at each allele but is expected in response to removal of a trans-acting factor required for maintaining expression (Figure 5B). Second, unlike the cis perturbation, the trans perturbation did not increase the mono-allelic to bi-allelic ratio. In the simplest case, where all trans steps are uniformly affected by Notch, the trans perturbation is independent of the distribution of cis states (Figure 5—figure supplement 1), and therefore the mono- to bi-allelic ratio remains constant. When the trans perturbation more strongly affects mono-allelic cells, as we assume here, the mono- to bi-allelic ratio decreases, opposite to observed effects of the cis perturbation but consistent with experimental results.
Additionally, we also considered a third possibility in which Notch controls a necessary trans-acting step occurring strictly prior to cis-activation, as postulated by the sequential trans-cis model (Figure 5—figure supplement 1). In this case, progenitors that express one or both Bcl11b alleles would no longer be affected by Notch withdrawal, inconsistent with the experimental observations (Figure 5B). Taken together, these results strongly suggest that a separate Notch-dependent trans-acting event, occurring in parallel with Bcl11b locus activation, is necessary for Bcl11b activation and T-cell lineage commitment.
Bcl11b activation can only occur over a limited developmental window
Given the finite rate of cis- and trans-activation steps, all cells would be expected to eventually activate both Bcl11b copies. However, a small fraction of cells were consistently found to express Bcl11b mono-allelically in thymic and peripheral T cell subsets (Figures 1 and 3B,C and Figure 3—figure supplements 1,2). This result suggested that activation might be possible only for a limited time and that cells might lose competence to activate any still-silent Bcl11b locus as they develop. To test this hypothesis, we sorted mono-allelically expressing cells from different developmental stages, cultured them in vitro on OP9-DL1 monolayers for 4 days, and analyzed expression of both Bcl11b alleles (Figure 6A). The already-active copy retained active expression throughout the assay, as expected. However, the frequency of activation of the initial silent Bcl11b allele varied strongly with developmental stage. Activation occurred efficiently at the DN2 stage (DN2A and DN2B combined) but dropped sharply as cells progressed to DN3 (~80% versus~15% activated after 4 days, Figure 6A), and dropped even further at the double positive (DP) and CD4 single positive stages (~1.5% and 2.4%, respectively, Figure 6A). Equivalent results were obtained regardless of whether the experiment started with active wildtype YFP and mCherry alleles (Figure 6A). These results indicate that cis-activation of Bcl11b predominantly occurs during DN2 and DN3 stages.
This DN2-stage preference for Bcl11b activation competence could arise from stage-specific activity of the identified distal enhancer. To test this hypothesis, we compared the activation kinetics of intact and enhancer-disrupted YFP alleles in sorted progenitors expressing only the Bcl11b mCherry allele. When the input cells were DN2 cells, the enhancer-disrupted YFP allele showed markedly less activation over the next four days than the intact YFP allele (70% versus 32%, Figure 6B). However, using input cells sorted at the DN3 stage, no differences in activation propensity were observed, with both wildtype and disrupted enhancer alleles showing the same attenuated degree of activation (~17%). These results suggest that the Bcl11b enhancer works specifically to enhance cis-activation of Bcl11b at the DN2 stage.
Discussion
Stochastic epigenetic control switches have been described in yeasts, plants, and, more recently, constructed in synthetic systems (Berry et al., 2017; Bintu et al., 2016; Hathaway et al., 2012; Keung et al., 2014; Xu et al., 2006), yet their roles in controlling fate decisions in vertebrate developmental systems are not well understood. Specifically, it is not clear when epigenetic states simply respond passively to ‘upstream’ developmental changes in transcription factor activity, and when they actively impose distinct temporal constraints on transcription factor effects. By separately following the two chromosomal copies of Bcl11b in single cells, we found that the decision to turn on Bcl11b, and the ensuing transition to T-cell fate, involves a stochastic, irreversible rate-limiting cis-activation step that occurs on each chromosomal allele of the Bcl11b gene itself. The cis-acting step occurs at a low enough rate (/hr, Figure 4A) to generate numerous mono-allelically expressing cells as intermediates, and is stable enough to propagate the same mono-allelic activation state through multiple rounds of cell division in individual clones. In particular, by generating delays of multiple days and cell generations prior to differentiation, the cis-acting switch also indirectly controls the overall degree of proliferation of the progenitor pool. These results thus demonstrate that stochastic, epigenetic events on individual gene loci can fundamentally limit the timing and outcome of mammalian cell fate decisions, as well as the population structure of the resulting differentiated population.
Slow, stochastic Bcl11b activation is controlled in part by an enhancer far downstream from the Bcl11b promoter, on the opposite end of the same topologically associated domain. Multiple known epigenetic changes that occur on the Bcl11b locus could participate in the processes whose dynamics we have measured here. The distal enhancer could recruit chromatin regulators that clear repressive chromatin modifications from the Bcl11b locus. In its silent state, the Bcl11b promoter and gene body are covered by DNA methylation and histone H3K27me3 modifications (Hu et al., 2018; Ji et al., 2010; Zhang et al., 2012). Chromatin regulators recruited by the enhancer could disrupt repressive modifications in their vicinity, catalyzing a phase transition that results in cooperative, all-or-none removal of repressive marks on the entire gene locus (Larson et al., 2017; Strom et al., 2017). As another possibility, the distal enhancer could recruit trans- factors that facilitate its T-lineage-specific looping with the Bcl11b promoter and its subsequent activation (Li et al., 2013). In early T-cell progenitors, the Bcl11b promoter establishes new contacts with its distal enhancer, resulting in de novo formation of an altered topological associated domain, with boundaries defined by these two elements (Hu et al., 2018; Isoda et al., 2017). Trans- regulators of DNA loop extrusion that associate with the distal enhancer, whose binding may be facilitated by non long-coding RNA transcription (Isoda et al., 2017), may stabilize these looping interactions (Fudenberg et al., 2016; Nasmyth, 2001; Riggs, 1990; Sanborn et al., 2015), which may release Bcl11b from the repressive environment of the nuclear periphery and permit its activation (Isoda et al., 2017). The evidence for such epigenetic differences associated with the Bcl11b locus in T and non-T cells have been known for some time, but the functional impacts of cis-acting mechanisms on locus activation dynamics has been unknown until now. Ultimately, any of these mechanisms that are rate-limiting will have to account for the stochastic nature of Bcl11b locus activation, its exceptionally long activation time constant, and its all-or-none, irreversible nature, demonstrated here. Dissecting the molecular and biophysical basis of these striking emergent properties will be the subject of future investigation.
Mathematical modeling, together with perturbation analysis, are consistent with Bcl11b expression requiring a separate Notch signal-dependent trans- event that is needed in parallel with Bcl11b cis-activation (Figure 7). The comparable slow rate constants for parallel cis and trans steps imply that a substantial fraction of cells can undergo the cis-acting step prior to trans-activation and observable Bcl11b expression. Furthermore, although the experiments here all start with DN2A progenitors, relevant dynamics may extend to earlier stages. In fact, the cis-acting step could potentially occur within the preceding ETP stage or during the ETP-DN2a transition (Kueh et al., 2016). Consistent with this hypothesis, changes in Bcl11b chromatin state associated with gene activation can already be observed at the ETP stage (Isoda et al., 2017; Zhang et al., 2012). Furthermore, previous work showed that knockdown of Gata3 and TCF-1, which first turn on at the ETP stage and are required for Bcl11b activation but not for subsequent events, impact Bcl11b activation more strongly in ETP cells than in DN2A cells that have not yet activated Bcl11b, suggesting that many cells may enter DN2A after cis-activation has already occurred. Looking ahead, a more complete model will therefore have to span multiple stages of T cell development.
How widespread are stochastic epigenetic switches of the type analyzed here? The only other regulatory switch whose individual allele dynamics been similarly characterized, to our knowledge, occurs in the plant vernalization system, which controls flowering in response to periods of cold temperature. Specifically, exposure to cold causes silencing of FLC, a master repressor of flowering. An obvious regulatory difference between the two systems is in the direction of regulation, with FLC undergoing silencing and Bcl11b undergoing activation. Nevertheless, the two systems share common dynamic features. Like Bcl11b, FLC silencing involves an all-or-none switch that occurs stochastically, independently at distinct gene copies in the same cell, and is stably inherited during cell division (Angel et al., 2011; Berry et al., 2015; Yang et al., 2017). Also like Bcl11b, silencing of the FLC locus occurs at rates lower than that of cell division, giving rise to distinct mono- and bi-allelic expressing states that persist over multiple cell generations. In the vernalization system, FLC silencing was shown to occur in two steps: First, repressive H3K27me3 modifications nucleate near the promoter, producing a metastable (reversible) silent state. Second, these marks spread across the locus, locking the locus into a more stable silent state (Yang et al., 2017). With Bcl11b, we do not yet know whether chromatin modifications are causally responsible for activation, nor do we know whether the gene passes through a metastable intermediate as FLC does. In both systems, upstream trans-acting factors – Vin3 for FLC and Gata-3 and TCF-1 for Bcl11b – control the stochastic rate of silencing or activation, respectively, but do not deterministically specify the transcription rates of the individual gene. For FLC, it is not yet known whether additional parallel trans-acting steps are also required, as is the case with Bcl11b. Analyzing the dynamics of allelic silencing using the framework described above could provide insight into this question. While the schemes likely differ between the two systems, the many similarities in the dynamics of regulation between these two very different contexts suggest that stochastic epigenetic switches are likely to be prevalent.
Slow, stochastic epigenetic switches, similar to the one we describe here, may allow cells to tune the size and composition of differentiated tissues. By using trans-acting inputs that modulate activation probabilities, such epigenetic switches could translate differences in input duration to changes in the fraction of output cells activated (Bintu et al., 2016), a strategy that could enable tunable control of cellular proportions in a developing tissue or organ. Moreover, a striking aspect of this mechanism is its ability to generate populations of mature T cells that are mosaic in the status of their activation of the two Bcl11b alleles. Indeed, the differential distribution of mono-allelically expressing cells that we see among distinct functional T-cell subsets suggests the potential of non-uniform allelic activity to alter function or selective fitness. The increased fraction of mono-allelically expressing cells that appear when an enhancer complex is weakened is a strong phenotype at the single cell level that could be relevant to enhancer polymorphisms in natural populations, although its impact could easily be underestimated by more conventional gene expression analyses.
Here, we have illustrated a general approach that can reveal the dynamics of epigenetic control mechanisms, determine their prevalence in the genome, and elucidate their functional roles in multicellular organism development and function. Stochastic epigenetic switches, similar to the one uncovered here, may constitute fundamental building blocks of cell fate control circuits in mammalian cells. As cells transition from one developmental state to another, they undergo concerted transformations in the chemical modification states or physical conformations of many regulated genes. These changes could reflect more widespread roles for epigenetic mechanisms in controlling cell state transition timing.
Materials and methods
Key resources table
| Reagent type (species) or resource | Designation | Source or reference | Identifiers | Additional information |
|---|---|---|---|---|
| Recombinant DNA reagent | pTarget Bcl11b IRES-H2Bm Cherry-neo/3pUTR | This paper | N/A | Gene targeting vector with IRES-H2B-mCherry- loxP-neo-loxP cassette knocked into 3' UTR of Bcl11b |
| Recombinant DNA reagent | pTarget Bcl11b dEnh-hygro | This paper | N/A | Gene targeting vector with Enhancer replaced by hygromycin cassette |
| Recombinant DNA reagent | FRT-PGK-gb2- hygromycin-FRT cassette | Genebridges | Cat# A010 | |
| Recombinant DNA reagent | MSCV IRES H2B-mCerulean | Kueh et al., 2013 | N/A | |
| Recombinant DNA reagent | pCL-Eco | Imgenex | Cat# NBP2-29540 | |
| Strain, strain background (mouse) | Bcl11bYFP(neo)/mCh(neo) | This paper | N/A | Two color reporter mice generated from breeding animals homozygous for either Bcl11b YFP(neo) or Bcl11b mCh(neo). See Materials and methods for details. |
| Strain, strain background (mouse) | Bcl11bmCh(neo)/mCh(neo) | This paper | N/A | Homozygous Bcl11b mCh(neo) reporter mice used to generate two color reporter mice. Derived from Bcl11b YFP/mCh(neo) F0 chimeric mice. See Materials and methods for details. |
| Strain, strain background (mouse) | Bcl11bYFP/mCh(neo) | This paper | N/A | Control mice for comparing the effects of the enhancer on Bcl11b expression. Generated by targeting Bcl11b mCherry gene targeting vector to V6.5 mouse embryonic stem (ES) cells with single modified Bcl11b mCitrine dneo allele. See Materials and methods for details. |
| Strain, strain background (mouse) | Bcl11bYFPdEnh/mCh(neo) | This paper | N/A | Two color reporter mouse with Bcl11b enhancer deleted. Generated by targeting dEnh gene target vector to V6.5 mouse ES cells with genotype Bcl11b YFP/mCh(neo). See Materials and methods for details. |
| Strain, strain background (mouse) | Bcl11bYFPdEnh/dEnh | This paper | N/A | Homozygous deleted enhancer mice generated from Bcl11b YFP dEnh/mCh(neo) mice. See Materials and methods for details. |
| Strain, strain background (mouse) | CD45.1 C57BL/6: B6.SJL-Ptprca Pepcb/BoyJ | Jackson Laboratory | Stock No# 002014 | |
| Cell line (mouse) | OP9-DL1-GFP | Schmitt and Zúñiga-Pflücker, 2002 | N/A | |
| Cell line (mouse) | OP9-Mig | Schmitt and Zúñiga-Pflücker, 2002 | N/A | |
| Cell line (mouse) | OP9-DL1-hCD8 | Kueh et al., 2016 | N/A | |
| Cell line (human) | Human Phoenix-ECO | ATCC | Cat# CRL-3214 | |
| Antibody | Anti-mouse CD8a Biotin (clone 53–6.7) | eBioscience | Cat# 13-0081-86; RRID:AB_466348 | (1:100) |
| Antibody | Anti-mouse TCRb Biotin (clone H57-597) | eBioscience | Cat# 13-5961-85; RRID:AB_466820 | (1:100) |
| Antibody | Anti-mouse TCRgd Biotin (clone GL3) | eBioscience | Cat# 13-5711-85; RRID:AB_466669 | (1:100) |
| Antibody | Anti-mouse Ter119 Biotin (clone TER-119) | eBioscience | Cat# 13-5921-85; RRID:AB_466798 | (1:100) |
| Antibody | Anti-mouse NK1.1 Biotin (clone PK136) | eBioscience | Cat# 13-5941-85; RRID:AB_466805 | (1:100) |
| Antibody | Anti-mouse Gr-1 Biotin (clone RB6-8C5) | eBioscience | Cat# 13-5931-86; RRID:AB_466802 | (1:100) |
| Antibody | Anti-mouse CD11c Biotin (clone N418) | eBioscience | Cat# 13-0114-85; RRID:AB_466364 | (1:100) |
| Antibody | Anti-mouse CD11b Biotin (clone M1/70) | eBioscience | Cat# 13-0112-86; RRID:AB_466361 | (1:100) |
| Antibody | Anti-mouse CD19 Biotin (clone 1D3/6D5) | eBioscience | Cat# 13-0193-85; RRID:AB_657658 | (1:100) |
| Antibody | Anti-mouse CD3e Biotin (clone 145–2 C11) | eBioscience | Cat# 13-0031-85; RRID:AB_466320 | (1:100) |
| Antibody | Anti-human/mouse B220 Biotin (clone RA3-6B2) | eBioscience | Cat# 13-0452-85; RRID:AB_466450 | (1:100) |
| Antibody | Anti-mouse F4/80 Biotin (clone BM8) | eBioscience | Cat# 13-4801-85; RRID:AB_466658 | (1:100) |
| Antibody | Anti-mouse CD4 Biotin (clone GK1.5) | eBioscience | Cat# 13-0041-85; RRID:AB_466326 | (1:100) |
| Antibody | Anti-human/mouse CD44 eFluor 450 (clone IM7) | eBioscience | Cat# 48-0441-82; RRID:AB_1272246 | (1:300) |
| Antibody | Anti-mouse CD25 Brilliant Violet 510 (clone PC61) | Biolegend | Cat# 102041; RRID:AB_2562269 | (1:300) |
| Antibody | Anti-mouse CD117 (cKit) APC-eFluor 780 (clone 2B8) | eBioscience | Cat# 47-1171-82; RRID:AB_1272177 | (1:300) |
| Antibody | Anti-mouse HSA eFluor 450 (clone M1/69) | eBioscience | Cat# 48-0242-82; RRID:AB_1311169 | (1:300) |
| Antibody | Anti-mouse CD4 Brilliant Violet 510 (clone GK1.5) | Biolegend | Cat# 100449; RRID:AB_2564587 | (1:300) |
| Antibody | Anti-mouse CD8a APC (clone 53–6.7) | eBioscience | Cat# 17-0081-82; RRID:AB_469335 | (1:300) |
| Antibody | Anti-mouse TCRb APC-eFluor 780 (clone H57-597) | eBioscience | Cat# 47-5961-82; RRID:AB_1272173 | (1:300) |
| Antibody | Anti-mouse CD25 APC-eFluor 780 (clone PC61.5) | eBioscience | Cat# 47-0251-82; RRID:AB_1272179 | (1:300) |
| Antibody | Anti-mouse CD19 eFluor 450 (clone 1D3/6D5) | eBioscience | Cat# 48-0193-82; RRID:AB_2734905 | (1:300) |
| Antibody | Anti-mouse CD117 (cKit) APC (clone 2B8) | eBioscience | Cat# 17-1171-82; RRID:AB_469430 | (1:300) |
| Antibody | Anti-mouse CD45 APC-eFluor 780 (clone 30-F11) | eBioscience | Cat# 47-0451-82; RRID:AB_1548781 | (1:300) |
| Antibody | Anti-mouse CD25 APC (clone PC61.5) | eBioscience | Cat# 17-0251-82; RRID:AB_469366 | (1:300) |
| Antibody | Anti-mouse CD4 APC-eFluor 780 (clone GK1.5) | eBioscience | Cat# 47-0041-82; RRID:AB_11218896 | (1:300) |
| Antibody | Anti-mouse CD8a APC-eFluor 780 (clone 53–6.7) | eBioscience | Cat# 47-0081-82; RRID:AB_1272185 | (1:300) |
| Antibody | Anti-mouse CD45 APC (clone 30-F11) | eBioscience | Cat# 17-0451-82; RRID:AB_469392 | (1:300) |
| Antibody | Anti-mouse CD5 eFluor 450 (clone 53–7.3) | eBioscience | Cat# 48-0051-82; RRID:AB_1603250 | (1:300) |
| Antibody | Anti-mouse TCRgd APC (clone GL3) | eBioscience | Cat# 17-5711-82; RRID:AB_842756 | (1:300) |
| Antibody | Anti-mouse CD49b eFluor 450 (clone DX5) | eBioscience | Cat# 48-5971-82; RRID:AB_10671541 | (1:300) |
| Antibody | Anti-mouse NK1.1 APC (clone PK136) | eBioscience | Cat# 17-5941-82; RRID:AB_469479 | (1:300) |
| Antibody | Anti-mouse CD3e APC-eFluor 780 (clone 145–2 C11) | eBioscience | Cat# 47-0031-82; RRID:AB_11149861 | (1:300) |
| Antibody | Anti-mouse TCRb eFluor 450 (clone H57-597) | eBioscience | Cat# 48-5961-82; RRID:AB_11039532 | (1:300) |
| Antibody | Anti-mouse CD49b Biotin (clone DX5) | eBioscience | Cat# 13-5971-82; RRID:AB_466825 | (1:300) |
| Antibody | Anti-mouse CD62L APC (clone MEL-14) | eBioscience | Cat# 17-0621-82; RRID:AB_469410 | (1:300) |
| Antibody | Anti-mouse CD45.2 Brilliant Violet 510 (clone 104) | Biolegend | Cat# 109837; RRID:AB_2561393 | (1:300) |
| Antibody | Anti-mouse CD4 eFluor 450 (clone GK1.5) | eBioscience | Cat# 48-0041-82; RRID:AB_10718983 | (1:300) |
| Antibody | Anti-mouse CD45 eFluor 450 (clone 30-F11) | eBioscience | Cat# 48-0451-82; RRID:AB_1518806 | (1:300) |
| Antibody | Streptavidin PerCP-Cyanine5.5 | Biolegend | Cat# 405214; RRID:AB_2716577 | (1:300) |
| Antibody | Streptavidin Brilliant Violet 510 | Biolegend | Cat# 405234 | (1:300) |
| Peptide, recombinant protein | Recombinant Human Flt3-Ligand | PeproTech | Cat# 300–19 | |
| Peptide, recombinant protein | Recombinant Human IL-7 | PeproTech | Cat# 200–07 | |
| Peptide, recombinant protein | Recombinant Human Stem Cell Factor (SCF) | PeproTech | Cat# 300–07 | |
| Peptide, recombinant protein | Recombinant Mouse IL-6 | eBioscience | Cat# 14-8061-62 | |
| Peptide, recombinant protein | Recombinant Mouse Stem Cell Factor (SCF) | eBioscience | Cat# 34-8341-82 | |
| Peptide, recombinant protein | Recombinant Mouse IL-3 | eBioscience | Cat# 14-8031-62 | |
| Peptide, recombinant protein | Retronectin | Takara | Cat# T100B | |
| Peptide, recombinant protein | DL1-extIgG Protein | Varnum-Finney et al., 2000 | N/A | |
| Software, algorithm | FlowJo (v10.0.8) | Tree Star | N/A | |
| Software, algorithm | MATLAB (R2016a) | MathWorks | N/A | |
| Other | FuGENE 6 Transfection Reagent | Promega | Cat# E2691 | |
| Other | MACS Streptavidin Microbeads | Miltenyi Biotec | Cat# 130-048-101 | |
| Other | LS Columns | Miltenyi Biotec | Cat# 130-042-401 | |
| Other | 250mm-diameter PDMS circular micromesh arrays | Microsurfaces Pty Ltd | Cat# MMA-0250-100-08-01 |
Experimental model and subject details
Animals
Fo chimeric mice from Bcl11bYFP/mCh(neo) and Bcl11bYFPΔEnh/mCh(neo) ES-cell blastocyst injections were all made in our lab (described in Materials and method Details). Founder animals were brought to term and crossed in house to generate Bcl11bYFP(neo)/mCh(neo), Bcl11bYFP/mCh(neo), Bcl11bYFPΔEnh/mCh(neo), and Bcl11bYFPΔEnh/mCh(neo) mice. CD45.1 C57BL/6 mice were purchased from Jackson Laboratory. All adult animals were used between 5 and 12 weeks of age. Both male and female mice were used similarly in all studies. Animals used for these experiments were bred and maintained at the Animal Facilities at both the California Institute of Technology and the University of Washington, and animal protocols were reviewed and approved by the Institute Animal Care and Use Committees of both institutions (Protocols #1445 and #1409, California Institute of Technology; Protocol #4397–01, University of Washington).
Cells
Primary cells isolated from thymus, spleen, bone marrow, and fetal livers were cultured on a OP9-DL1 or OP9-control stromal monolayer system (Schmitt and Zúñiga-Pflücker, 2002) at 37°C in 5% CO2 conditions with standard culture medium [80% αMEM (Gibco), 20% Fetal Bovine Serum (Sigma-Aldrich), Pen-Strep-Glutamine (Gibco), 50 μM β-mercaptoethanol (Sigma)] supplemented with appropriate cytokines (described in Materials and method Details). Both OP9-DL1 and OP9-control cell lines were tested and found to be negative for mycoplasma contamination.
Method details
Construct designs
Request a detailed protocolGene targeting vectors for generating dual allelic Bcl11b fluorescent reporter and subsequent enhancer knockout were constructed using a two-step bacterial artificial chromosome (BAC) recombineering method. First, Bcl11b-BACs were modified to either insert a fluorescent reporter or disrupt the enhancer sequence with a drug selection marker. An internal ribosome entry site (IRES)-histone 2B-mCherry red fluorescent protein (mCh)-loxP-neomycin (neo)-loxP cassette with homology arms targeting the 3’-untranslated region (UTR) of Bcl11b was derived from a similar histone 2B-mCitrine yellow fluorescent protein (YFP) gene targeting vector version published previously (Kueh et al., 2016) and an IRES-H2B-mCherry-loxP-neomycin (neo)-loxP cassette. These two starting plasmids were digested with restriction enzymes NheI and HindIII (New England Biolabs) to exchange the fluorescent protein sequences. Homology arms flanking the 5’ and 3’ ends of the 1.9 kb enhancer (Enh) sequence to be replaced (chr12: 108,396,825–108,398,612, mm9 assembly; chr12:107,158,615–107,160,462, in mm10) were attached to a FRT-PGK-gb2-hygromycin (hygro)-FRT drug selection cassette through fusion PCR, and inserted into a cloning vector (pGEM-T-Easy, Promega). Next, restriction enzymes were used to release the homology-flanked fluorescent or drug reporter cassettes, and the resultant linear fragments were introduced into recombineering E. Coli strain SW102 containing appropriate BACs for specific targeting. The IRES-mCh-neo fragment was linearized with AatII, SalI-HF, ScaI-HF and knocked into a BAC containing the entire Bcl11b gene locus (RP24-282D6, from http://bacpac.chori.org). Restriction enyzmes XmnI, PspOMi, and SbfI released the FRT-hygro-FRT cassette used to replace the enhancer sequence in a BAC containing genomic regions downstream of the Bcl11b locus (RP23-445J15, from http://bacpac.chori.org). Correctly modified BACs were then selected using kanamycin or hygromycin in combination with chloramphenicol, and verified by PCR and pulse-field gel electrophoresis analysis using the restriction enzyme NotI (New England Biolabs).
A second recombineering reaction retrieved the targeting sequences from reporter modified Bcl11b-BACs. The retrieval vector used to fetch the targeting sequence from the modified Bcl11b-mCherry-neo BAC was made in a previous study (Kueh et al., 2016). For retrieval of the enhancer-disrupted sequence, homology arms for retrieval were first generated using fusion PCR, then cloned into a vector containing a Herpes Simplex Virus-Thymidine Kinase (HSV-TK) cassette using restriction enzymes NotI and SpeI (New England Biolabs). Both retrieval vectors were linearized with PacI and AscI (New England Biolabs), introduced into SW102 containing respective modified Bcl11b-BACs, and retrieved targeting sequences between the homologous ends to generate the desired gene targeting vectors. Clones that underwent correct retrieval reactions were selected using kanamycin or hygromycin in combination with ampicillin, and verified with restriction enzyme digests and sequencing.
The retroviral construct expressing IRES-H2B-mCerulean cyan fluorescent protein (CFP) used for timelapse imaging experiments was generated in a previous study (Kueh et al., 2013). A complete list of vectors used is provided in Key Resources Table.
Mouse generation
Request a detailed protocolA series of genetic modifications were performed to generate different Bcl11b reporter mouse strains used for this study (Figure 1—figure supplement 1). V6.5 mouse embryonic stem (ES) cells with a single modified Bcl11b allele expressing the IRES-H2B-mCitrine-loxp-neo-loxp fluorescent reporter were first transfected with Cre recombinase to excise the neomycin cassette. Subclones of this line with a correct deletion of the neomycin cassette were then targeted with the IRES-mCherry-neo gene targeting vector to generate dual allelic Bcl11b fluorescent reporter cells, and targeted again with the ΔEnh-hygro cassette to delete the enhancer in one allele. After each targeting event, recombinant ES cells grown on feeders were positively selected with antibiotics according to the cassette inserted, and negatively selected with G418. Resistant clones were passaged onto feeder-free conditions and screened using PCR and qPCR for correct targeting. Clones with the desired genotype were karyotyped for normal chromosome numbers before being injected into C57BL/6 blastocyst embryos or subjected to subsequent gene targeting.
F0 chimeric mice from Bcl11bYFP/mCh(neo) and Bcl11bYFPΔEnh/mCh(neo) ES-cell blastocyst injections were generated, and either analyzed at embryonic day 14.5 (E14.5) or brought to term for breeding. Bcl11bYFP/mCh(neo) F0 chimeric mice were crossed to C57BL/6 mice, and the offspring containing Bcl11b-IRES-mCherry-neo allele were then bred to homozygosity for this allele. Dual allelic Bcl11bYFP(neo)/mCh(neo) mice with identical Bcl11b alleles except for fluorescent protein reporters were generated from breeding Bcl11bmCh(neo)/mCh(neo) mice to previously produced Bcl11bYFP(neo)/YFP(neo) mice (Kueh et al., 2016), and were used for in vitro assay studies of bone marrow derived T-cells. Bcl11bYFPΔEnh/mCh(neo) mice were generated in a similar manner by first breeding to C57BL/6 mice to generate enhancer deleted heterozygotes, then crossing mice to Bcl11bmCh(neo)/mCh(neo). Bcl11bYFPΔEnh/YFPΔEnh mice were generated in parallel by crossing enhancer deleted heterozygotes together. For experiments comparing the effects of the enhancer on Bcl11b expression, direct control Bcl11bYFP/mCh(neo) mice were generated from breeding Bcl11bYFP/YFP and Bcl11bmCh(neo)/mCh(neo) animals. However, we have previously reported that the presence or absence of neo cassette does not affect the Bcl11b reporter locus (Kueh et al., 2016), and do not observe any differences in expression pattern in this study as well (see Figures 1 and 3).
Cell purification
Request a detailed protocolThymocytes and splenocytes were purified from lymphoid organs removed from 4- to 6-week-old normal and enhancer-deleted two-color Bcl11b reporter strains, and 2-month post-fetal liver precursor transplantation CD45.1 chimeras prior to flow cytometry analysis or fluorescent activated cell sorting (FACS). Harvested lymphoid organs were mechanically dissociated to make single cell suspensions that were re-suspended in Fc blocking solution with 2.4G2 hybridoma supernatant (prepared in the Rothenberg lab). Early stage thymocyte precursors to be analyzed (ETP, DN2A, DN2B, DN3: Figures 1C and 3B, and Figure 3—figure supplement 1) or sorted (DN2, DN3: Figures 3D and 6A), were first depleted of mature cell lineages using a biotin-streptavidin-magnetic bead removal method. Thymocyte suspensions were labeled with biotinylated lineage marker antibodies (CD8α, TCRβ, TCRγδ, Ter119, Gr-1, CD11c, CD11b, NK1.1), incubated with MACS Streptavidin Microbeads (Miltenyi, Biotec) in HBH buffer (HBSS (Gibco), 0.5% BSA (Sigma-Aldrich), 10 mM HEPES, (Gibco)) pre-filtered through cell separation magnet (BD Biosciences), and passed through a magnetic column (Miltenyi Biotec). Rare T-cell subsets found in the spleen (Figure 3—figure supplement 2) were enriched using a similar depletion protocol by labeling splenocytes with biotinylated antibodies CD19, CD11b, CD11c, and Gr-1. Later-stage thymocyte precursors analyzed (Figure 1D, Figure 3B, and Figure 3—figure supplements 1, 3, 4) or sorted (Figure 6A), and whole splenocyte populations analyzed (Figure 3—figure supplements 2, 3) were directly stained with conjugated fluorescent cell surface antibodies (see Supplementary file 1, Key Resources Table).
Figure 6
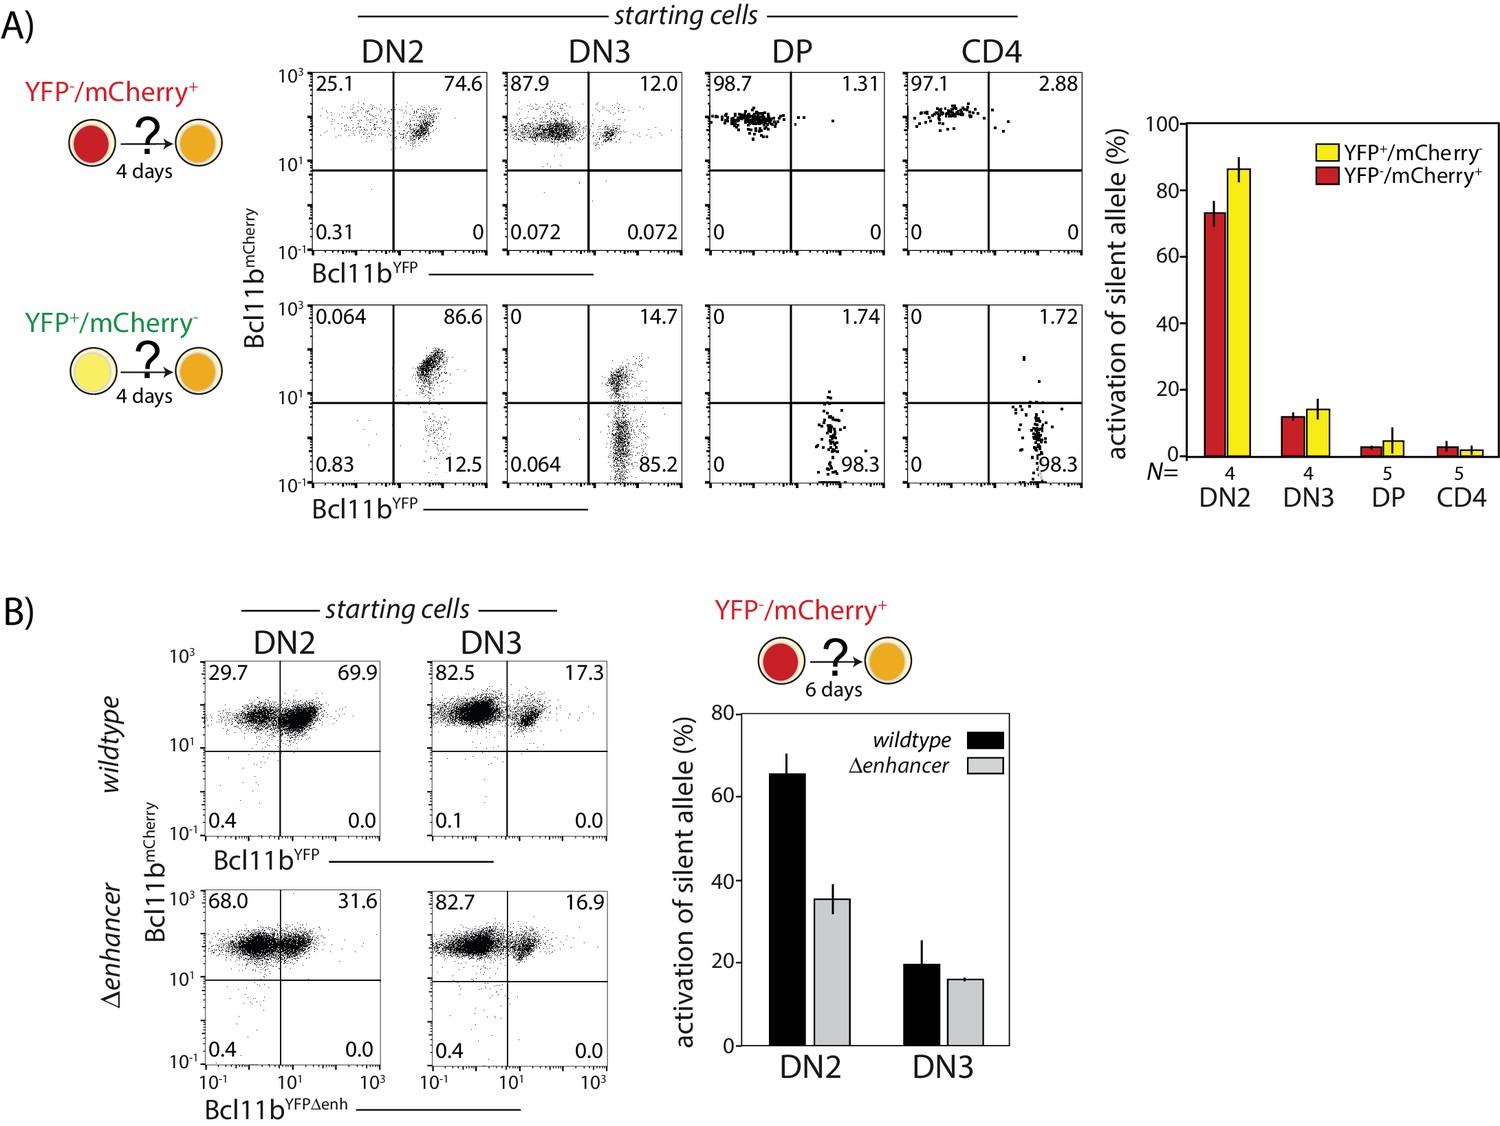
Probabilistic Bcl11b activation occurs within a limited developmental time window.
Cells expressing only one Bcl11b allele at the indicated stages were sorted from thymocytes, cultured for 4d on OP9-DL1 monolayers, and analyzed for activation of the initially inactive Bcl11b allele using flow cytometry. (A) Flow plots (left) show Bcl11b-mCh versus Bcl11b-YFP expression levels for descendants of cells that had mono-allelic expression at the indicated stages of development; bar charts (right) show the fraction of progenitors from different stages that activate the silent Bcl11b allele upon culture. Data represent mean and standard deviation of 4–5 replicates, derived from two independent experiments. The competence to activate the silent Bcl11b allele decreases upon progression to the DN3 stage and beyond. (B) Flow plots (left) show Bcl11b-mCh versus Bcl11b-YFP expression levels for DN2 or DN3 progenitors with either an intact YFP allele enhancer (top) or a disrupted YFP allele enhancer (bottom). Bar chart (right) shows the fraction of cells activating the silent Bcl11b allele upon re-culture. Data show that enhancer disruption reduces the Bcl11b activation advantage in DN2 cells as compared to DN3 cells. Data represent mean and standard deviation of three replicates from two independent experiments.
Bone Marrow (BM) cells were harvested from dissected femurs and tibiae of 2- to 3- month-old Bcl11bYFP(neo)/mCh(neo) mice. Fetal livers (FLs) were removed from F0 chimeric fetuses of pregnant surrogate mice at E14.5, individually disrupted mechanically via pipetting into whole organ suspension, and frozen down in freezing media (50% FBS, 40% αMEM, 10% DMSO) for liquid nitrogen storage. Prior to in vitro culture use, BM and thawed FL cell suspensions were blocked in 2.4G2 supernatant, tagged with biotinylated antibody lineage markers specific to BM (CD19, CD11b, CD11c, NK1.1, Ter119, CD3ε, Gr-1, B220) or FL (CD19, F4/80, CD11c, NK1.1, Ter119, Gr-1), and depleted of biotin-streptavidin-magnetically labeled mature lineage cells as described above. Eluted lineage depleted (Lin-) bone marrow progenitors were either frozen down in freezing media for storage in liquid nitrogen or used directly for in vitro cell culture assays of T-cell development, while Lin- fetal liver progenitors were immediately cultured.
In vitro differentiation of T-cell progenitors
Request a detailed protocolDN T-cell precursors used for in vitro studies were generated by culturing BM and FL stem and progenitor cells on a OP9-DL1 stromal monolayer culture system (Schmitt and Zúñiga-Pflücker, 2002), following previously detailed methods (Kueh et al., 2016) with adapted variations as described below. To promote the DN T-cell development, purified or thawed Lin- progenitors were cultured on OP9-DL1 stromal cell monolayers (Schmitt and Zúñiga-Pflücker, 2002) plated on tissue-culture treated plates (Corning) using standard culture medium [80% αMEM (Gibco), 20% Fetal Bovine Serum (Sigma-Aldrich), Pen-Strep-Glutamine (Gibco), 50 μM β-mercaptoethanol (Sigma)], grown at 37°C in 5% CO2 conditions, and supplemented with cytokines. All in vitro T-cell generation cultures of Bcl11b-YFP/mCh Lin- BM precursors were supplemented with 5 ng/mL Flt-3L (Peprotech) and 5 ng/mL IL-7 (Peprotech), and were sorted after 6 or seven total days of culture following transduction with a retroviral vector expressing CFP 1 day prior (Figures 2, 4F and 5A, and Figure 2—figure supplement 1, Figure 4—figure supplements 1–2). Lin- fetal liver precursors were cultured with 5 ng/mL Flt-3L and 1 ng/mL IL-7 for the indicated number of days before analysis or sorting. For experiments in which Bcl11b locus activation was compared in the presence and absence of Notch signals, DN2 progenitors were cultured in parallel with OP9-DL1 stroma and with OP9-Control (without DL1 expression), respectively, as previously described (Kueh et al., 2016).
Sorted thymocytes (Figures 3D and 6A), BM-derived DN2 progenitors (Figure 5A), and FL-DN progenitors (Figure 6B) were seeded manually onto 6000 OP9-DL1 or OP9-Control feeder cells per well in 96-well plates, cultured in standard medium supplemented with 5 ng/mL Flt-3L and either 5 ng/mL IL-7 (BM) or 1 ng/mL IL-7 (Thymocytes and FL), and harvested for analysis after the indicated number of days.
Flow cytometry and cell sorting
Request a detailed protocolUnless otherwise noted, flow cytometry analysis and fluorescent-activated cell sorting of all in vitro and ex vivo lymphocytes were prepared using the procedures outlined. Briefly, cultured cells on tissue culture plates and primary cells from lymphoid organs were prepared as single cell suspensions, incubated in 2.4G2 Fc blocking solution, stained with respective surface cell markers as indicated (see Supplementary file 1, Key Resources Table), resuspended in HBH, filtered through a 40 μm nylon mesh, and analyzed using a benchtop MacsQuant VYB flow cytometer (Miltenyi Biotec, Auburn, CA) or sorted with Sony Synergy Sorter (Sony Biotechnology, Inc, San Jose, CA). Both instruments contain capabilities to detect mCherry fluorescence by 561 nm laser excitation. All antibodies used in these experiments are standard, commercially available monoclonal reagents widely established to characterize immune cell populations in the mouse; details are given in Supplementary file 1. Acquired flow cytometry data were all analyzed with FlowJo software (Tree Star).
Timelapse imaging
Request a detailed protocolTimelapse imaging of live-cells was used to study Bcl11b gene expression dynamics in single cells (Figures 2 and 4F, and Figure 2—figure supplement 1, Figure 4—figure supplements 1–2, and Video 1). To prepare for multi-day imaging, PDMS micromesh arrays (250 μm hole diameter, Microsurfaces, AU) containing small microwells that prevent seeded cells from migrating out of a single imaging field of view on 40x objective were adhered to 24-well glass-bottomed plates (Mattek, Ashland, MA). To prevent overcrowding in microwells and enable proper cell tracking, non-GFP expressing OP9-DL1, described in Kueh et al., 2016, and sorted CFP+ DN2 progenitors were plated at appropriate densities to achieve ~8 cells/microwell and ~1 cell/microwell, respectively. Cells were cultured in standard medium using Phenol Red-free αMEM (Gibco) and supplemented with 5 ng/mL Flt-3L and 5 ng/mL IL-7.
Image segmentation and analysis
Request a detailed protocolCells were segmented using image processing workflow implemented in MATLAB (Mathworks, Natick, MA), as previously described in detail (Kueh et al., 2013; Kueh et al., 2016). Briefly, this workflow involved: (1) Correction for uneven fluorescence illumination, calculated from a fluorescent slide with uniform intensity, followed by background subtraction; (2) Automated cell segmentation, using an Laplacian filter-based edge detection algorithm, followed by exclusion of non-cell objects by size and shape selection. Cell segmentations were then subject to manual inspection, and segmented objects that did not correspond to cells were then eliminated. For each data set, automated segmentation parameters were chosen such that the fraction of incorrectly identified cells was <1% of the total number of segmented cells. To calculate fluorescence intensities for segmented cells, we first calculated average intensity levels for an annulus surrounding the segmented cell, and subtracted this background value from image intensities in the cell interior. This additional subtraction was performed to remove auto-fluorescence contributions from OP9-DL1 feeder cells to intensity measurements. Fluorescence intensity measurements were either displayed for clonal cell lineages confined within individual microwells (Figure 2B, C and Figure 2—figure supplement 1A, Figure 4—figure supplement 2B), or in a two-dimensional heat map showing the intensity distributions for different indicated time windows for all 218 microwells in a single imaging experiment (Figures 2B–D and 4F, and Figure 4—figure supplement 1).
To obtain the time evolution of Bcl11b population fractions, we fit the 2D histograms of Bcl11b-YFP and Bcl11b-RFP levels, given by y and r respectively, to a sum of four 2D Gaussian functions:
Each 2D Gaussian function is given by:
Here, we define the four populations to correspond to the non-expressing, yellow mono-allelic, red mono-allelic and bi-allelic populations respectively (Figure 4—figure supplement 1). Here, Ni corresponds to the volume under the Gaussian function when integrated over r and y. When fitted to experimental 2D histogram, Ni provides an estimate of the number of cells within a given population.
We performed our fitting in two steps: (1) we first obtained the means, standard deviations and correlation coefficients of the Bcl11b non-expressing population by fitting the first 2D Gaussian function to a 2D histogram of Bcl11b-YFP and Bcl11b-RFP levels of cells at the beginning of the experiment (within the time window 0 hr), which were sorted to have both Bcl11b alleles inactive. This fit to the initial non-expressing Bcl11b population is crucial for accurate determination of different Bcl11b allelic populations using the 4-Gaussian fit approach. (2) To obtain a time series of Bcl11b allelic population fractions from single-cell data, we then fit the constrained 4-Gaussian model to 2D histograms of Bcl11b-YFP and RFP levels obtained across successive time bins, fixing the parameters for the first Gaussian, and allowing the means, standard deviations and correlation coefficients of the remaining Gaussians, j = 2….4 to vary within bounds set by the observed fluorescence distributions of the Bcl11b allelic-expressing population. From these fits, we then obtain the observed fraction of cells in the ith state in a time window centered on time t:
To estimate confidence bounds, we also perform error analysis to get the confidence bounds for , given by:
Here, represents the error in the estimation of from least squares fitting.
Model analysis and fitting
Request a detailed protocolModels for Bcl11b activation (Cis-only, Sequential trans-cis, Parallele trans-cis; Figure 4A, Appendix) were numerically simulated using an ordinary differential equation solver in MATLAB. The predicted time course from these models were fit to experimental data, using a least-squares procedure with the following free parameters: the cis- and trans- activation rates (kC and kT respectively), and the fraction of cells in each Bcl11b non-expressing sub-state, constrained to equal one at t = 0 (sequential and parallel trans-cis models only). For both yellow/red mono-allelic and bi-allelic expressing populations fractions, there is a clear lag in their rise kinetics of ~15–20 hr (Figure 4B), even though all bi-allelic and mono-allelic expressing cells are all already discernible after the earliest measured time interval (~5 hr, Figure 4—figure supplement 1, red arrows). This lag in measured population fraction data occurs, because the earliest Bcl11b expressing cells still have fluorescent reporter levels that are very similar to the non-expressing cell populations, and are therefore not detected by the constrained Gaussian feature described above. Thus, to correct for this lag, we introduced detection time delay into the fitting functions for the three Bcl11b –expressing populations, as follows:
Here, denotes the time delay in the detection of the ith allelic expression state, taken to be the time at which the detected fraction of cells in the ith state increases to a value significantly greater than zero. Note that as RFP and YFP differed in their accumulation rates and detection thresholds, they showed different time delays for detection. We evaluated the goodness of each model fit by calculating its reduced chi-squared value, defined as:
where the summation is taken over all allelic expressing states i and all time points j, subject to the time lag defined above, and the number of degrees freedom (d.f) is defined as the number of fitted data points, minus the number of fitting parameters. To compare whether the sequential or parallel trans-cis models provided a significantly better fit to the data compared to the cis- only model, we then took the ratio of reduced chi-squared values for the two compared fits (i.e. their F values), and evaluated for statistical difference using the F-test. Qualitative predictions for perturbing specific reaction steps (Figure 5—figure supplement 1) were obtained by performing a series of simulations with increasing magnitude of perturbation to the same ending time point. In accordance with experimental observations showing some inactivation of the Bcl11b locus upon Notch withdrawal (Figure 5A,B), perturbations involved both a reduction of the forward rate constant, and an increase in the rate of a reverse reaction, together with a graded attenuation in the perturbation after activation of one Bcl11b allele (see Figure 5—figure supplement 1, and Appendix for a comprehensive description). Parameters were chosen based on the best fits of the unperturbed time course (Figure 4B), although the direction of the predicted shifts in phase space do not depend on the exact parameters being chosen (Figure 5C,D, and Figure 5—figure supplement 1).
To generate predictions for allelic state distributions from single clones (Figure 4D,E), we performed Monte-Carlo simulations of clonal single proliferating progenitor lineages, using Markov transition probabilities determined by best-fit rate constants to sequential or parallel trans-cis models (see Appendix). Here, the cell division time was taken to be 20 hr, corresponding to rates of cell expansion observed in experiments, and measurements of clonal allelic distributions were taken at 100 hr (i.e. after five cell divisions), also matching the time of experimental sampling. Probabilities per cell division for each transition were obtained by converting the continuous-time models to a discrete Markov chain, and these probabilities were taken to be independent between two daughters of the same cell, consistent with the first-order kinetics of these transitions in our models. To test experimental data against each model, we obtained the expected probability of having clones with dual-allelic expression together with mono-allelic expression from two alleles (Y + R + D) or from a single allele (Y + D and R + D) clones, for each model, and compared the observed frequencies from clonal lineage data using a chi-squared test.
Radiation chimeras
Request a detailed protocolFetal liver precursor transplanted CD45.1 chimeras were generated to study the long-term T-cell potential of cells without Bcl11b enhancer in mice. Individual fetal liver whole organ suspensions were thawed and split for depletion protocols indicated above or stimulated in standard medium supplemented with 50 ng/mL IL-6 (eBioscience), 50 ng/mL SCF (eBioscience), and 20 ng/mL IL-3 (eBioscience) for 2 days to enrich for hematopoietic stem cell (HSC) progenitors. CD45.1 C57BL/6 mice were subjected to sublethal radiation of 1000 rads from a cesium source. Cells were re-suspended in PBS and 106 cells in a volume of 200 μL were injected retro-orbitally into anesthesized, irradiated mice using 31G, 6 mm insulin syringes (BD). Comprehensive splenocyte analysis was performed on 2-month post-transplantation chimeras by sacrificing mice and harvesting spleen and thymus organs following protocols indicated above (Figure 3—figure supplement 3).
Retroviral transduction on Retronectin-DL1-coated plates
Request a detailed protocolRetroviral particles were packaged by transient cotransfection of the Phoenix-Eco packaging cell line with the retroviral construct and the pCL-Eco plasmid (Imgenex) using FuGENE 6 (Promega). Viral supernatants were collected at 2 and 3 days after transfection and immediately frozen at −80°C until use. To infect BM-derived T-cell progenitors, 33 μg/mL retronectin (Clontech) and 2.67 μg/mL of DL1-extracellular domain fused to human IgG1 Fc protein (Varnum-Finney et al., 2000) were added in a volume of 500 μL per well in 24-well tissue culture plates (Costar, Corning) and incubated overnight. Viral supernatants were added next day into coated wells and spun down at 2000 rcf for 2 hr at room temperature. BM-derived T-cell progenitors used for viral transduction were cultured for 5 days according to conditions described above, disaggregated, filtered through a 40 μm nylon mesh, and 106 cells transferred onto each retronectin/DL1-coated virus-bound 24-well supplemented with 5 ng/mL SCF (Peprotech), 5 ng/mL Flt3-L, and 5 ng/mL IL-7.
Quantification and statistical analysis
Request a detailed protocolThe sample size for each experiment, and number of independent experiments are stated in the Figures and Figure Legends. In Figure 4B, the best fits of the different models were evaluated by comparing sum-squared errors using the F-test (Figure 4C), adjusted for different degrees of freedom for each model. A chi-squared test was applied to compare experimental data against model predictions shown in Figure 4F. Data that had a calculated p-value<0.05 was considered statistical significant, and exact P-values are reported in the figure legends. Bar chart data shown (Figure 6A,B) represent mean and standard deviation.
Figure 7
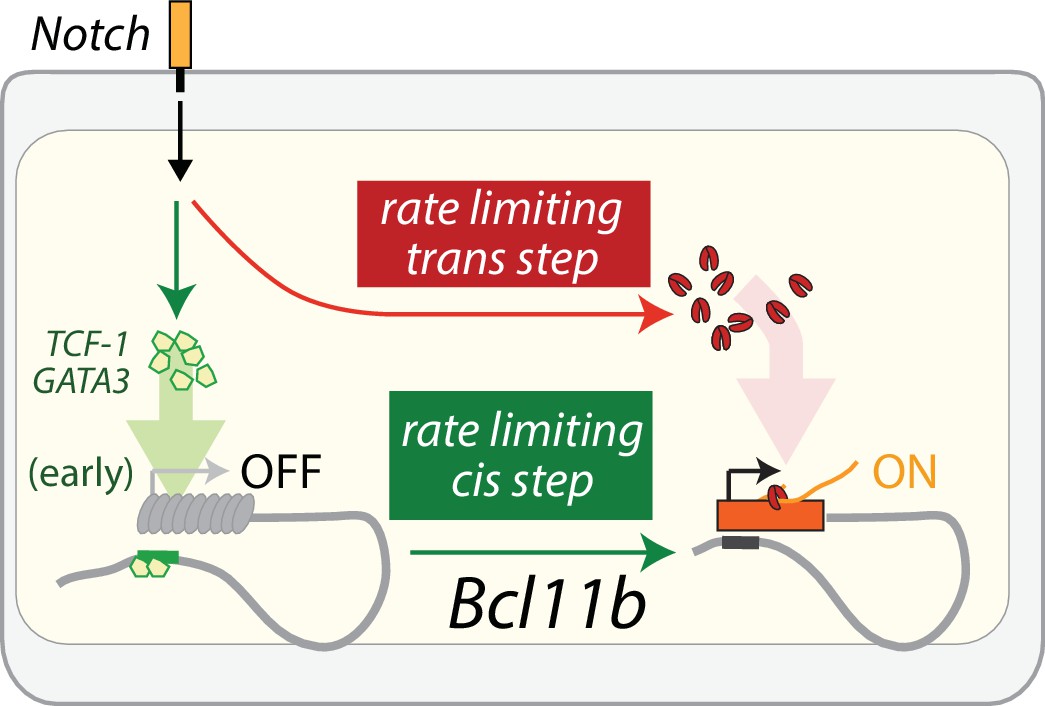
Model of Bcl11b regulation by parallel cis and trans-limiting steps.
Bcl11b activation requires two rate-limiting steps: a switch of the Bcl11b locus from an inactive to active epigenetic state, and the activation of a trans factor is necessary for transcription of Bcl11b from an activated locus. Notch signaling activates TCF-1 and GATA3 in early thymic progenitors (García-Ojeda et al., 2013; Scripture-Adams et al., 2014; Weber et al., 2011), and these two factors may act on the identified distal enhancer to control the rate-limiting cis step on the Bcl11b locus (green). In parallel, Notch promotes the activation of a trans factor (red) that is necessary for transcription from a cis-activated Bcl11b locus. The cis and trans-limiting steps together control the dynamics of Bcl11b expression and T-cell lineage commitment.
Appendix 1
Introduction
We describe a series of dynamical models that aim to clarify the interplay between global (trans) and locus-specific (cis) mechanisms in the control of Bcl11b activation and T-lineage commitment. We first use these models to understand the dynamics of normal Bc11b activation in an initial population of DN2 progenitors that are inactive for both Bcl11b copies (Figure 4). Next, to distinguish between these different models, we will make predictions about their behavior on a clonal lineage level (Figure 4D–E), and their responses to perturbations of different activation steps (Figure 5C-D and Figure 4—figure supplement 2, Figure 5—figure supplement 1), which we will test experimentally. In these models, we do not explicitly model the ETP to DN2 transition, as our experiments all start with cells that have already turned on CD25; however, as we discuss below, our analysis of the sequential and parallel trans-cis models suggest that some of the molecular events we consider could occur prior to the ETP-DN2 transition. We note that these models are simplified representations of more complex underlying systems, and a full understanding of the dynamics of the complete system will involve additional processes not accounted for here. However, we use these minimal models to constrain experimental data, evaluate the plausibility of broad classes of mechanisms, and provide a starting point for further investigation.
Simple cis-activation model
In this model, activation of Bcl11b involves a single, slow first-order step that takes place in cis, that is on the locus of the Bcl11b gene itself. This activation step is controlled independently for two copies of Bcl11b in a single cell, and with the same rate constant. Under these assumptions, the fraction of non-expressing, mono-allelic and bi-allelic Bcl11b expressing cells evolve over time according to the following dynamical equations:
Here is the first-order rate constant of the slow cis-acting step on the Bcl11b locus. In our experiments, starting DN2 progenitors were sorted to have no Bcl11b expression on either copy. Thus, in our model fitting, we take all starting cells to be in a non-expressing state, following this initial condition:
(2)
Accordingly, all other variables are set to zero. Following this initial condition, we performed least-squares fitting, varying to provide the best fit to experimental data (Figure 4B). We note that in this and subsequent fits, experimental data were shifted by a fixed time lag, to account for delays in the appearance of fluorescent protein expression.
As seen from best least-squares fit, this model is a poor description of the experimentally observed dynamics of Bcl11b activation from DN2 (Figure 4B–C): this is because the fraction of bi-allelic expressing cells increases more slowly compared to that of the mono-allelic expressing cells at the earliest time points. To see how this this time lag arises, we can solve for this model analytically, to derive the following solutions:
Where is time in non-dimensional units. At early time points, where , we can expand these solutions using a power series to obtain:
At early time points, the fraction of bi-allelic expressing cells is approximately the square of fraction of the mono-allelic expressing cells, and would therefore increase at a slower rate relative to mono-allelic expressing cells.
Sequential trans-cis activation model
In this model, two rate-limiting steps are required for activation of Bcl11b, a trans-acting step, which occurs in the nucleus away from the Bcl11b locus, and a cis-acting step, which occurs independently on each Bcl11b locus. The trans step precedes, and is necessary for, the cis step. Such a model could describe a reaction scheme, where an initial limiting step, occurring away from the Bcl11b locus, activates a regulatory factor that facilitates the cis- activation step in a permissive fashion. This regulatory factor could be a chromatin-modifying enzyme, a transcription factor, or any other protein that serves to enable locus remodeling. We note that in this model, it is possible that the trans-acting step occurs before the DN2 transition (Figure 4A, gray arrows).
There are five states, a trans-inactive state , where this trans factor is absent, and four states, , , , and , where the trans factor is present, and two copies of Bcl11b exist in either active or inactive states. The time evolution of the fraction of DN2 progenitors in these different states are given by:
Here, and correspond to the first-order rate constants for the trans and cis-acting steps respectively. The value of these rate constants were determined using least-squares fitting to experimental data, subject to the constraint that the initial DN2 progenitors that we sorted are all inactive for both copies of Bcl11b, and must exist in either trans-active or trans-inactive states:
(8)
This constraint results in one additional fitting parameter to the model. The best fit trajectory is shown in the main text (Figure 4B), and best-fit parameters are shown in Appendix 1—table 1. Unlike the simple cis-activation model, this model can give rise to a rise in the fraction of bi-allelic expressing fraction concurrent with the mono-allelic expressing fraction (Figure 4B–C); thus, from least-squares fitting of experimental data alone, the sequential activation model can plausibly explain experimentally observed population dynamics.
Appendix 1—table 1
Best fit parameters of the sequential trans-cis activation model to data, with confidence intervals.
https://doi.org/10.7554/eLife.37851.029| Parameter | Units | Best-fit | Lower bound | Upper bound |
|---|---|---|---|---|
| 1/hr | ||||
| 1/hr | ||||
| I |
Parallel trans-cis-activation model
In this model, cis-acting and trans-acting steps are also required for activation of Bcl11b, similar to the sequential activation model. However, in contrast to the sequential model, cis and trans steps occur in parallel with each other, such that they occur in either order. In this model, the trans step could represent activation of a trans factor necessary for transcription of a cis-activated locus. For instance, the trans-acting step could correspond to the activation of a factor that promotes the polymerase recruitment.
In this model, there are four trans-inactive states and four trans-active states , each corresponding to different states of locus activation. The time evolution of the fraction of cells in these states are given by:
Here, and correspond to the first-order rate constants for the trans- and cis- acting steps. As experiments start with cells that do not express Bcl11b, the following constraint describes the fitting of our models:
(10)
This constraint results in four additional free parameters to the least-squares fit. Upon performing a least-square fit to experimental data, we find that this model also recapitulates the early rise in the fraction of bi-allelic expressing cells, as observed in the data (Figure 4B–C; see Appendix 1—table 2 for best-fit parameter values). Of note, our model fit suggests that a significant fraction of DN2 progenitors may already exist in a state where one or both Bcl11b alleles are already activated in cis (Appendix 1—table 2). This feature of our fit will enable us to distinguish between the sequential and parallel activation models using clonal lineage data, as we discuss further below.
Appendix 1—table 2
Best fit parameters of the parallel trans-cis activation model to data, with confidence intervals.
https://doi.org/10.7554/eLife.37851.030| Parameter | Units | Best-fit | Lower bound | Upper bound |
|---|---|---|---|---|
| 1/hr | ||||
| 1/hr | ||||
| (fraction) | ||||
| , | (fraction) | |||
| (fraction) |
Comparative analysis of sequential and parallel trans-cis activation models
Clonal heterogeneity analysis
So far, both sequential and parallel trans-cis activation models provide a reasonable fit to the population dynamics of mono-allelic and bi-allelic cell fractions starting from non-expressing progenitors (Figure 4B–C). How can we further distinguish between these two models? So far, we have only considered predictions based on the behavior of whole cell populations; however, analysis of correlations within individual lineage trees can allow discrimination of distinct dynamic mechanisms, as was demonstrated in recent work and in classic experiments (Luria and Delbrück, 1943; Hormoz et al., 2016; Blanpain and Simons, 2013). As these two models differ in activation state trajectories taken during Bcl11b activation, they would be expected to generate distinct distributions of allelic activation states in single clonal lineages.
To derive Bcl11b activation state distributions expected from either sequential or parallel activation models, we first reformulate these models (Equations 7 and 9) as discrete time Markov Chains (Gardiner, 2009), where each time step represents a single cell cycle. First, let be the total number of states. Next, define a random state variable , corresponding to the state of the cell at the number . For the sequential model (Equation 7), the list of states is , with ; for the parallel model (Equation 9), the list of states is , with . In our descriptions below, we will enumerate all the states as in such a specified order.
Next, we define , a transition matrix with elements, where represents the probability of a cell transitioning from state to state in a single cell cycle. For a given cell cycle time , we can solve the differential equations in Equations 7 and 9 to obtain corresponding transition probabilities, that is . In our simulations, we first solve for these transition probabilities, using the best-fit rate constants in Appendix 1—table 1 and Appendix 1—table 2. These experiments also used a cell cycle time of hr. This was chosen in accordance with the amount of cell expansion observed in imaging experiments, though our conclusions are not expected to depend on the exact value of the cell division time. With this transition probability matrix, we can then simulate state transitions across a lineage of dividing cells, according to the following formula:
(11)
Here represents the state of the cell at the () th cell cycle. In the Monte-Carlo simulations, each cell gives rise to two cells at each cell division, and each daughter cell chooses its fate randomly and independently from its sibling, based on this formula. This process is repeated iteratively for every descendant from a single ancestor until a designated stopping time ( cell cycles, or hr, corresponding to the end of the imaging experiment), whereby a complete lineage tree is generated.
From these clonal lineage simulations, we find the sequential and parallel trans-cis activation models yield divergent predictions of heterogeneity in Bcl11b allelic activation at the level of single clones. For the sequential activation model, non-expressing ancestors predominantly generate a mixture of progeny with mono-allelic expression from both Bcl11b copies prior to bi-allelic Bcl11b activation (Figure 4D–E). While some clones only express a single specific Bcl11b copy prior to bi-allelic activation, these clones were rare relative to those with mono-allelic expression from each of the two alleles (Figure 4D). This is because all non-expressing progenitors still have both Bcl11b copies in a cis-inactive state; thus, upon cell division, all daughters of a non-expressing parent retain the same probability of activating either allele.
By contrast, the parallel trans-cis activation model gave rise to a large frequency of clones with mono-allelic expression from only one specific allele (Figure 4D–E), either red or yellow, varying between, but not within, different clones. This reflects the accumulation of non-expressing progenitors that have a single Bcl11b copy present in an open state, but lack the trans-acting factors necessary to induce expression from this opened locus ( total, Appendix 1—table 2). These clones pass through a single specific mono-allelic activation intermediate prior to bi-allelic activation. Additionally, in the parallel activation model, a small percentage of clones transition directly to a bi-allelic expressing state without first passing through a mono-allelic state (Figure 4D–E), a behavior that does not occur for the sequential activation model. This ‘tunneling’ of non-expressing cells to a bi-allelic expression state reflects the existence of non-expressing cells with both alleles open that still lack the critical trans-acting step to enable their expression. For these cells, activation of the trans-acting step causes both alleles to turn on simultaneously.
In our experimentally observed distributions of allelic activation states, we found that individual clones predominantly showed mono-allelic expression from only one allele (Figure 4F, 7/9 clones observed), but only rarely showed mono-allelic expression of both alleles (Figure 4F, 1/9 clones observed). This distribution of single-specific mono-allelic clones was significantly different from the fractions predicted for the sequential activation model (, = 6.8, d.f. = 1), but not significantly different from predictions for the parallel activation model.
Furthermore, the experimentally observed distributions also showed evidence for simultaneous activation of both alleles from a non-expressing state (Figure 4E, 1/9 clones), consistent with the occurrence of a parallel trans-activation event in a DN2 progenitor with both Bcl11b alleles pre-activated in cis, which is only allowed in the parallel activation model. Taken together, the experimental clonal lineage data favor the parallel activation model as an explanation for the underlying kinetic processes controlling Bcl11b activation, suggesting that the trans- acting step necessary for Bcl11b activation occurs in parallel with the cis-level step on the Bcl11b locus.
Effects of perturbation of cis and trans activation steps
To further discriminate between sequential and parallel trans-cis activation events, and to gain insights into the molecular mechanisms underlying control of the trans-acting step, we analyzed the predicted effects of perturbing different reaction steps for each model. We then tested these predictions by removing the Notch signaling ligand DL1, an essential T-cell developmental signal that controls Bcl11b activation probabilities. Here, we show that perturbations of the reaction steps in different models generate distinct shifts in the distribution of mono-allelic and bi-allelic expressing cells, which can be compared to experiments for model discrimination. In this simulation analysis (Figures 5C-D and Figure 5—figure supplement 1), we perturbed both cis- and trans-acting steps in the two models in the same way, by reducing its forward rate while introducing a non-zero backward rate. This assumption of reversibility reflects our previous observations that Bcl11b can turn back off in a small fraction of cells. We previously noted that although Bcl11b expression maintenance rapidly becomes Notch-independent, there is a small percentage of cells that can lose Bcl11b expression again shortly after activation, if Notch signaling is removed (Kueh et al., 2016). Thus, building on this observation, we reduced the forward rate constant by a fraction , while concomitantly increasing the back rate constant by the same amount . Also, in accordance with experimental observations (We attenuated Notch-dependency as described because experiments showed that cells with both Bcl11b alleles active show a reduced rate of reversion to an inactive state upon Notch signaling withdrawal. The molecular basis for this attenuation in Notch dependency is currently unclear, but likely involves involve a parallel process occurring in the nuclei of progenitors to stabilize a Notch-driven T-lineage program over time.), the effect of each perturbation on the change in rate constants was further reduced a multiplicative factor for transitions to and from a dual-allele expressing state. The perturbed rate constants are labeled in the state transition diagrams in Figure 5—figure supplement 1, and their definitions, as described here, as listed in Appendix 1—tables 3–6. We note that, while the magnitudes of the experimentally observed shifts depend on these chosen values, the directions of these shifts in phase space upon perturbation - corresponding to the increases or decreases in ratio of bi-allelic to mono-allelic expressing cells - are not dependent on the specific values of chosen constants, and thus represents a robust qualitative prediction of the modeling.
By numerically simulating these models, we found that different perturbations generated distinct shifts in Bcl11b mono-allelic to bi-allelic ratios that could then be used to distinguish between effects of Notch on the cis versus trans steps. Specifically:
When cis-acting steps are perturbed in both the sequential and parallel activation models, non-expressing or mono-allelic expressing starting progenitors reach a final state with reduced bi-allelic expression, and either reduced (sequential activation model) or increased (parallel activation model) mono-allelic expression (Figures 5C and Figure 5—figure supplement 1, blue arrows). However, the ratio of bi-allelic to mono-allelic expressing cells invariably decreases, such that the line connecting initial to final states in phase space makes a smaller angle with the -axis when perturbation is applied. This result does not depend on the exact perturbation strengths specified by , and also does not depend on whether perturbations are reduced for transitions involving the bi-allelic state (), or whether they remain the same () (See Figure 5—figure supplement 1).
When the trans-acting step in the sequential activation model is perturbed, progenitors starting without Bcl11b expression (Figure 5—figure supplement 1, sequential model) reach a final state with a reduced fraction of mono-allelic and bi-allelic expressing cells. Progenitors starting with mono or bi-allelic expression are not affected (Figure 5—figure supplement 1, sequential model).
When the trans-acting step in the parallel activation model is perturbed, non-expressing and mono-allelic progenitors reach a final state with reduced mono-allelic and bi-allelic expression, but also show a decrease in the ratio of mono-allelic to bi-allelic expressing cells (Figure 5D). As explained above, this increase in cannot occur with inhibition of the cis-acting step in either the sequential or parallel model, and cannot occur when starting with mono-allelic expressing cells in the sequential activation model. Hence, this shift distinguishes the parallel from the sequential activation model. Here, we note that bi-allelic cells show a proportionately smaller decrease relative to mono-allelic cells, because transitions involving this state are impacted less by the perturbation (). If all transition rates were affected uniformly (), both mono-allelic and bi-allelic cells would be affected similarly, such that the ratio of the two populations would remain the same (Figure 5—figure supplement 1).
Furthermore, when starting from a bi-allelic expressing state, perturbation of the trans step causes direct transition to a non-expressing state, without passage through a mono-allelic expressing intermediate (Figure 5—figure supplement 1, parallel model). This bi-allelic inactivation represents the reversion of the progenitor to a state where cells still maintain two cis-active Bcl11b alleles cis, but have now inactivated a parallel trans-acting step necessary for expression from a cis-opened locus. As this bi-allelic shutoff would not be predicted to happen upon perturbation of any other step in either model, it provides an additional signature of the parallel activation model.
Taken together, this analysis suggests that the sequential and parallel activation models could potentially be distinguished by analyzing changes in the fractions of non-expressing, mono-allelic, and bi-allelic cells in response to perturbation, if this perturbation involved a disruption of the trans-acting step for Bcl11b expression.
To test these predictions, we sorted DN2 progenitors with different numbers of active Bcl11b alleles, cultured them in vitro in either the presence (unperturbed condition) or absence (perturbed condition) of Notch signaling, and then analyzed allelic activation states after four days using flow cytometry.
Consistent with parallel activation model, Notch withdrawal reduced the proportion of mono-allelic to bi-allelic expression in cells that started with zero or one active copies of Bcl11b (Figure 5A–B). It also caused the direct transition of bi-allelic expressing cells to a non-expressing state, without passing through a mono-allelic intermediate state, as can be seen in the flow cytometry analysis of the effects of Notch removal on progenitors expressing both copies of Bcl11b (Figure 5A, green arrow). These experiments reveal a strong correlation at the single-cell level between expression levels of Bcl11b-YFP and Bcl11b-mCherry alleles, in cells that are shutting off their expression, suggesting that the inactivation of Bcl11b upon Notch withdrawal occurred in a highly synchronous manner for two alleles.
Taken together, our results support the parallel activation model over sequential activation model, and indicate that Notch signaling effectively represents one parallel trans-acting step necessary for Bcl11b expression.
Appendix 1—table 3
Perturbing the cis-acting step in the sequential activation model.
https://doi.org/10.7554/eLife.37851.031| Parameter | Description |
|---|---|
| cis-activation rate, from non-expressing to mono-allelic state | |
| cis-activation rate, from mono-allelic to bi-allelic state | |
| back cis-activation rate, from mono-allelic to non-expressing state | |
| back cis-activation rate, from bi-allelic to mono-allelic state | |
| trans-activation rate | |
| 0 to 0.35 | |
| 0.4 |
Appendix 1—table 4
Perturbing the trans-acting step in the sequential activation model.
https://doi.org/10.7554/eLife.37851.032| Parameter | Description |
|---|---|
| cis-activation rate | |
| trans-activation rate | |
| back trans-activation rate | |
| 0 to 0.35 |
Appendix 1—table 5
Perturbing the cis-acting step in the parallel activation model.
https://doi.org/10.7554/eLife.37851.033| Parameter | Description |
|---|---|
| cis-activation rate, from non-expressing to mono-allelic state | |
| cis-activation rate, from mono-allelic to bi-allelic state | |
| back cis-activation rate, from mono-allelic to non-expressing state | |
| back cis-activation rate, from bi-allelic to mono-allelic state | |
| trans-activation rate | |
| 0 to 0.35 | |
| 0.4 |
Appendix 1—table 6
Perturbing the trans-acting step in the parallel activation model.
https://doi.org/10.7554/eLife.37851.034| Parameter | Description |
|---|---|
| cis-activation rate | |
| trans-activation rate, from non-expressing/mono-allelic state | |
| trans-activation rate, from bi-allelic state | |
| back trans-activation rate, from non-expressing/mono-allelic state | |
| back trans-activation rate, from bi-allelic state | |
| 0 to 0.65 | |
| 0.2 |
Data availability
Imaging data, along with MATLAB image processing scripts have been deposited in github: https://github.com/KuehLabUW/ictrack/ (copy archived at https://github.com/elifesciences-publications/ictrack). Source data for Figs. 2,3,4,5, Figure 3-figure supplements 1,2 and 3 have also been included.
References
-
The multifaceted roles of Bcl11b in Thymic and peripheral T cells: impact on immune diseasesThe Journal of Immunology 193:2059–2065.https://doi.org/10.4049/jimmunol.1400930
-
DNA methylation patterns and epigenetic memoryGenes & Development 16:6–21.https://doi.org/10.1101/gad.947102
-
Unravelling stem cell dynamics by lineage tracingNature Reviews Molecular Cell Biology 14:489–502.https://doi.org/10.1038/nrm3625
-
Eukaryotic transcriptional dynamics: from single molecules to cell populationsNature Reviews Genetics 14:572–584.https://doi.org/10.1038/nrg3484
-
X chromosome regulation: diverse patterns in development, tissues and diseaseNature Reviews Genetics 15:367–378.https://doi.org/10.1038/nrg3687
-
Stochastic gene expression in a single cellScience 297:1183–1186.https://doi.org/10.1126/science.1070919
-
Genome architecture and expressionCurrent Opinion in Genetics & Development 22:59–61.https://doi.org/10.1016/j.gde.2012.03.003
-
Formation of chromosomal domains by loop extrusionCell Reports 15:2038–2049.https://doi.org/10.1016/j.celrep.2016.04.085
-
BookStochastic Methods: A Handbook for the Natural and Social Sciences (fourth edition)Springer.
-
Noncoding RNAs and epigenetic mechanisms during X-chromosome inactivationAnnual Review of Cell and Developmental Biology 30:561–580.https://doi.org/10.1146/annurev-cellbio-101512-122415
-
The gap gene networkCellular and Molecular Life Sciences 68:243–274.https://doi.org/10.1007/s00018-010-0536-y
-
A monoallelic-to-biallelic T-cell transcriptional switch regulates GATA3 abundanceGenes & Development 29:1930–1941.https://doi.org/10.1101/gad.265025.115
-
Mutations of Bacteria from virus sensitivity to virus resistanceGenetics 28:491–511.
-
Napoleon Is in EquilibriumAnnual Review of Condensed Matter Physics 6:85–111.https://doi.org/10.1146/annurev-conmatphys-031214-014558
-
DNA methylation and late replication probably aid cell memory, and type I DNA reeling could aid chromosome folding and enhancer functionPhilosophical Transactions of the Royal Society B: Biological Sciences 326:285–297.https://doi.org/10.1098/rstb.1990.0012
-
GATA-3 dose-dependent checkpoints in early T cell commitmentThe Journal of Immunology 193:3470–3491.https://doi.org/10.4049/jimmunol.1301663
-
Histone core modifications regulating nucleosome structure and dynamicsNature Reviews Molecular Cell Biology 15:703–708.https://doi.org/10.1038/nrm3890
-
Molecular dissection of prethymic progenitor entry into the T lymphocyte developmental pathwayThe Journal of Immunology 179:421–438.https://doi.org/10.4049/jimmunol.179.1.421
-
Immobilization of notch ligand, Delta-1, is required for induction of notch signalingJournal of Cell Science 113:4313–4318.
Article and author information
Author details
Ellen V Rothenberg

Funding
California Institute for Regenerative Medicine (Graduate Student Award)
- Kenneth KH Ng
Howard Hughes Medical Institute (Investigator)
- Michael B Elowitz
National Institutes of Health (R01AI095943)
- Ellen V. Rothenberg
National Institutes of Health (R01AI083514)
- Ellen V. Rothenberg
National Institutes of Health (R01HL119102)
- Ellen V. Rothenberg
National Institutes of Health (R00HL119638)
- Hao Yuan Kueh
John H. Tietze Foundation Trust (Stem Cell Scientist Award)
- Hao Yuan Kueh
The funders had no role in study design, data collection and interpretation, or the decision to submit the work for publication.
Acknowledgements
We thank M Lerica Gutierrez Quiloan for mouse genotyping and maintenance; N Verduzco and I Soto for animal husbandry; RA Diamond, K Beadle, and D Perez for cell sorting. We also thank members of Kueh, Rothenberg and Elowitz labs for feedback, and T Mitchison for valuable discussions. We also thank Sandy Nandagopal, Pulin Li, Zeba Wunderlich and Nick Pease for comments. This work was funded by an NIH K99/R00 Award (5R00HL119638), a Tietze Foundation Stem Cell Scientist Award, and a CRI/Irvington Postdoctoral Fellowship (to HYK); NIH grants R01AI095943, R01AI083514, and R01HL119102 (to EVR), California Institute for Regenerative Medicine Bridges to Stem Cell Research (to KKHN); and the Louis A Garfinkle Memorial Laboratory Fund, the Al Sherman Foundation, and the Albert Billings Ruddock Professorship (to EVR).
Ethics
Animal experimentation: This study was performed in strict accordance with the recommendations in the Guide for the Care and Use of Laboratory Animals of the National Institutes of Health. Animals were bred and maintained in either the Laboratory Animal Facility of the California Institute of Technology, or that of the University of Washington. Animal protocols were reviewed and approved by the Institute Animal Care and Use Committees (IACUC) of the California Institute of Technology (Protocols #1445 and #1409) and the University of Washington Protocol #4397-01.
Copyright
© 2018, Ng et al.
This article is distributed under the terms of the Creative Commons Attribution License, which permits unrestricted use and redistribution provided that the original author and source are credited.
Metrics
-
- 5,238
- views
-
- 767
- downloads
-
- 82
- citations
Views, downloads and citations are aggregated across all versions of this paper published by eLife.
Citations by DOI
-
- 82
- citations for umbrella DOI https://doi.org/10.7554/eLife.37851
Download links
A two-part list of links to download the article, or parts of the article, in various formats.
Downloads (link to download the article as PDF)
Open citations (links to open the citations from this article in various online reference manager services)
Cite this article (links to download the citations from this article in formats compatible with various reference manager tools)
A stochastic epigenetic switch controls the dynamics of T-cell lineage commitment
eLife 7:e37851.
https://doi.org/10.7554/eLife.37851


