Membrane insertion of α-xenorhabdolysin in near-atomic detail
- Max Planck Institute of Molecular Physiology, Germany
- The University of Texas, United States
Figures
Figure 1 with 6 supplements
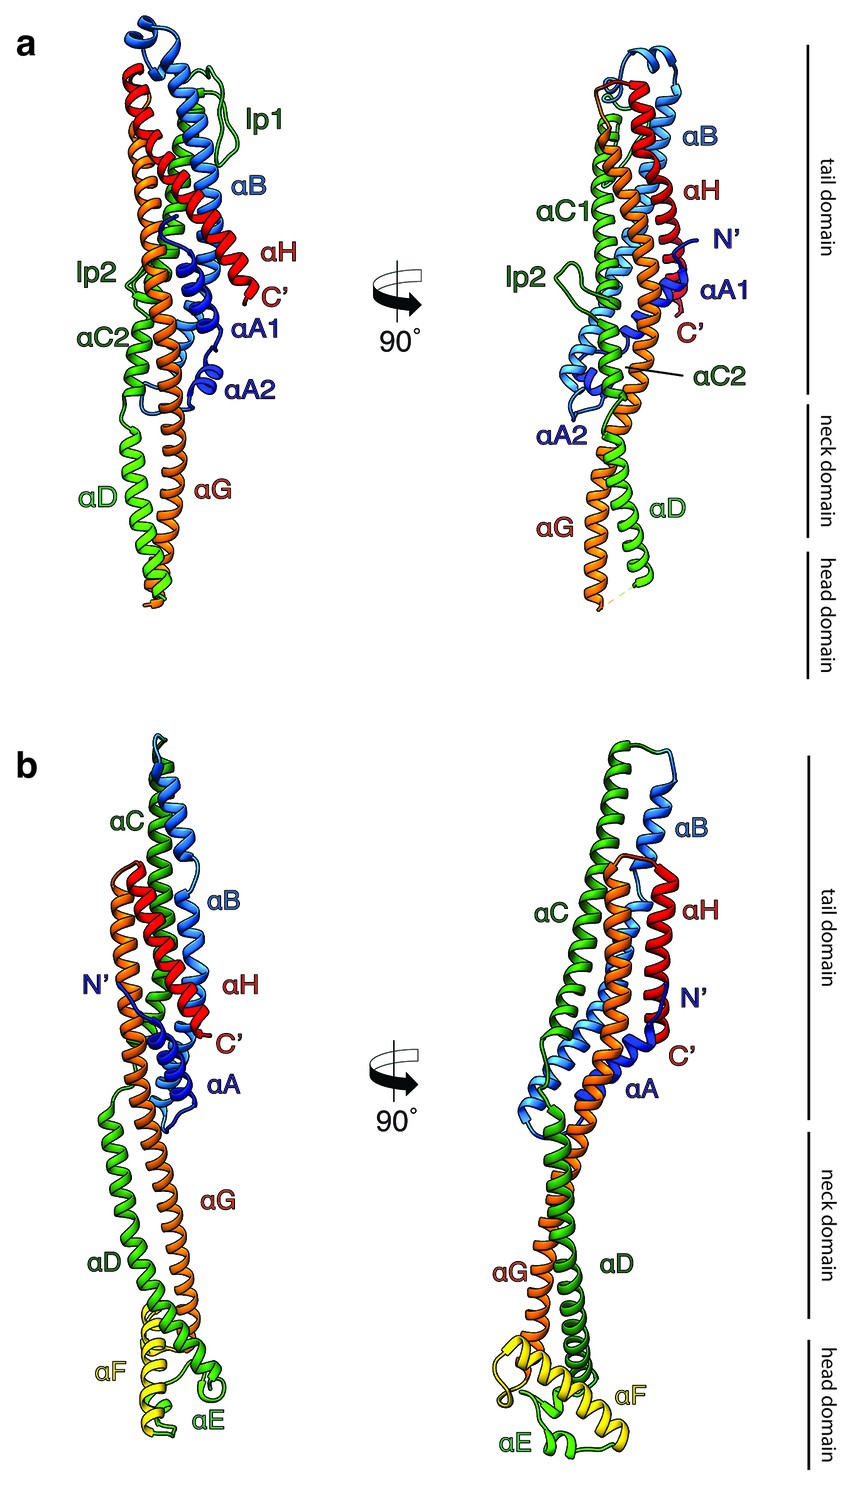
Crystal structures of XaxA and XaxB in their soluble monomeric form.
(a) Ribbon representation of the atomic model of the XaxA soluble monomer. (b) Ribbon representation of the XaxB soluble monomer. Each helix is depicted in a different color and labeled accordingly.
Figure 1—figure supplement 1

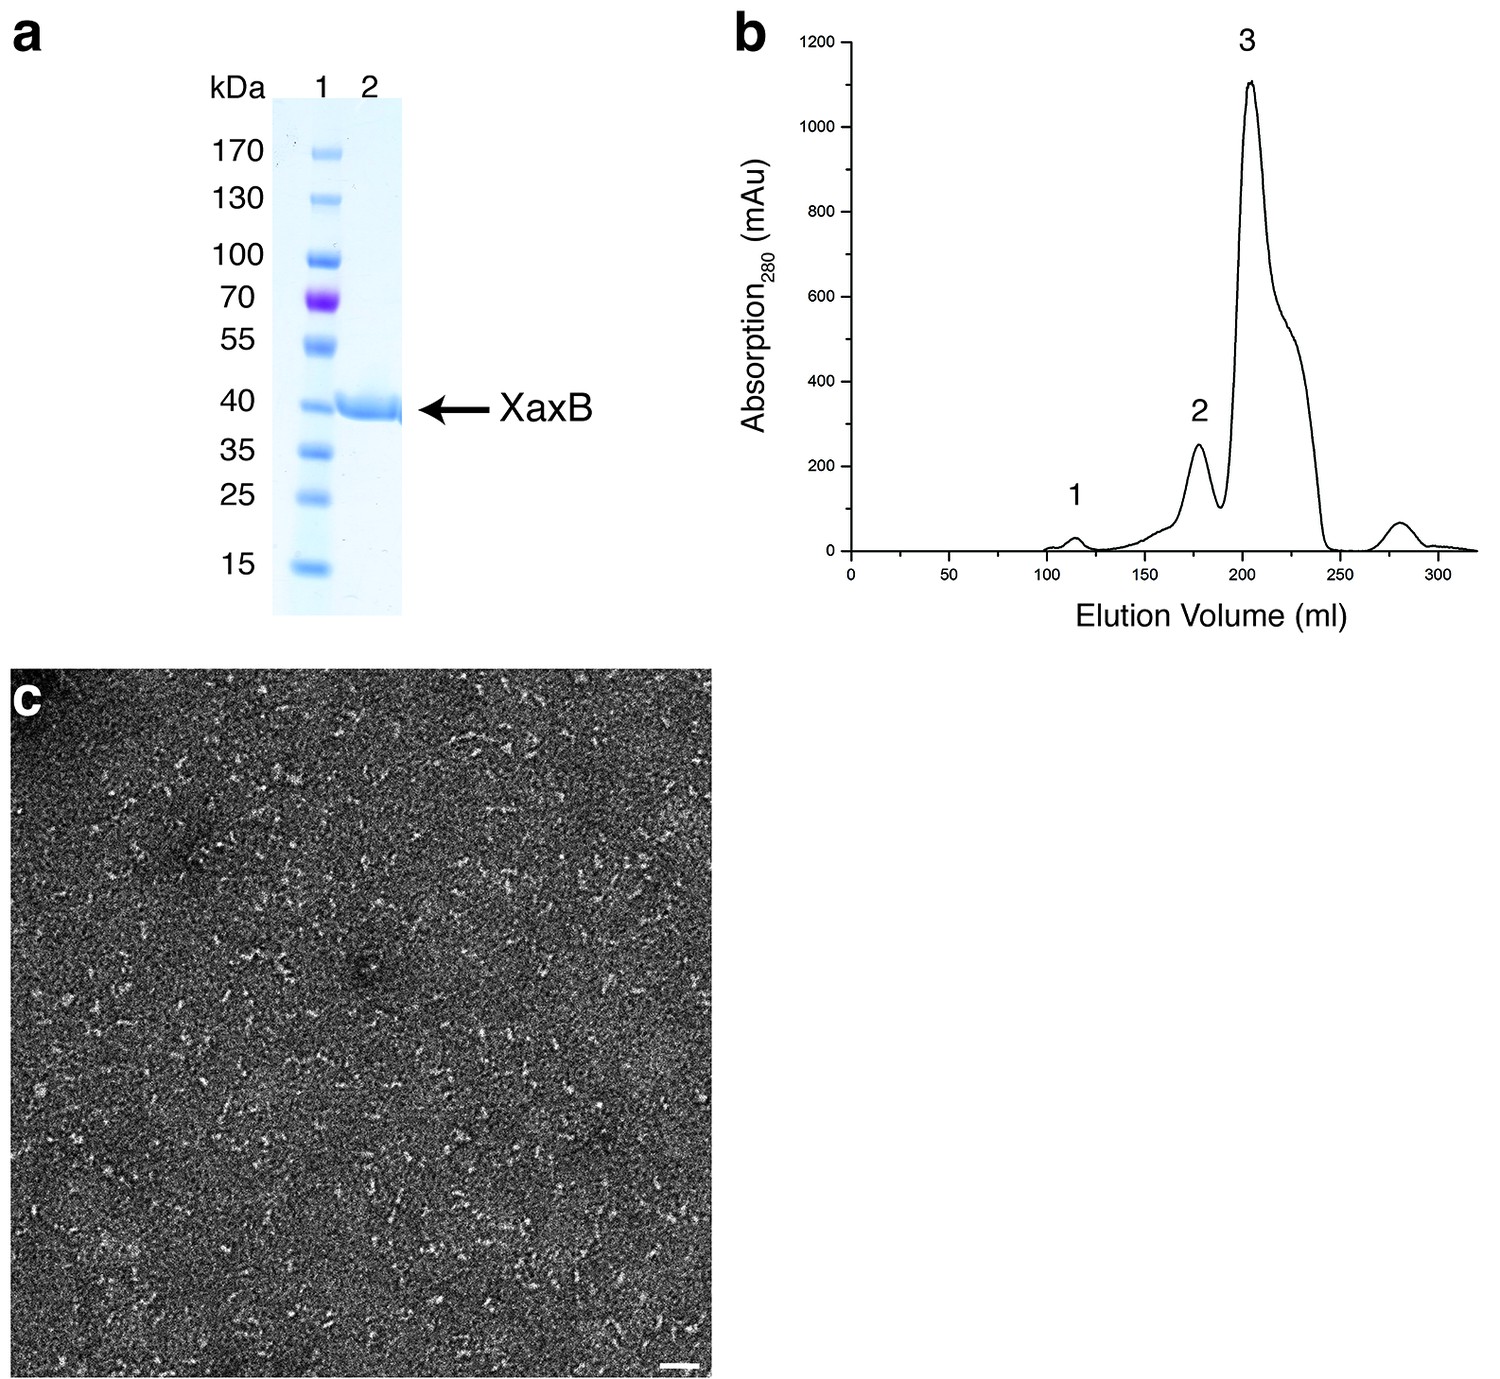
Purification and negative stain EM of XaxA.
(a-b) SDS-PAGE (a) of the monomer fraction (peak 3) from the size exclusion chromatography of XaxA (b). Peaks 1 and 2 correspond to the void volume and aggregation of XaxA by the hydrophobic head domains, respectively. Lane 1: molecular weight marker, lane 2: protein. (c) Representative electron micrograph of negatively stained XaxA from peak 3 in (b). Scale bar, 50 nm. (d–e) Representative electron micrograph (d) and 2-D class averages (e) of negatively stained XaxA clusters from peak 2 in (b). Scale bars, 50 nm (d) and 10 nm (e).
Figure 1—figure supplement 2
Purification and negative stain EM of XaxB.
(a-b) SDS-PAGE (a) of the monomer fraction (peak 3) from the size exclusion chromatography of XaxB (b). Peaks 1 and 2 correspond to the void volume and possibly dimers of XaxB in solution. Lane 1: molecular weight marker, lane 2: protein. (c) Representative electron micrograph of negatively stained XaxB from peak 3 in (b). Scale bar, 50 nm.
Figure 1—figure supplement 3

Analytical size exclusion chromatography and negative stain EM of XaxAB.
(a) Size exclusion chromatography profile of XaxAB after incubation overnight without detergent. (b) Representative electron micrograph of negatively stained XaxAB after incubation overnight without detergent. Scale bars, 50 nm. Arrow indicates the fraction analyzed by negative stain electron microscopy.
Figure 1—figure supplement 4

Comparison of XaxA and XaxB with ClyA-type toxins.
(a) Comparison of the soluble monomers of ClyA-type toxins (pdb-IDs: ClyA: 1QOY, NheA: 4K1P, Hbl-B: 2NRJ, Cry6Aa: 5KUC). (b) Comparison of XaxA and XaxB protomers with the ClyA protomer (pdb-IDs: ClyA: 2WCD). Protomers are rotated 90° in respect to the soluble monomers in a. Relevant helices are colored corresponding to their structural equivalent of XaxA and XaxB.
Figure 1—figure supplement 5
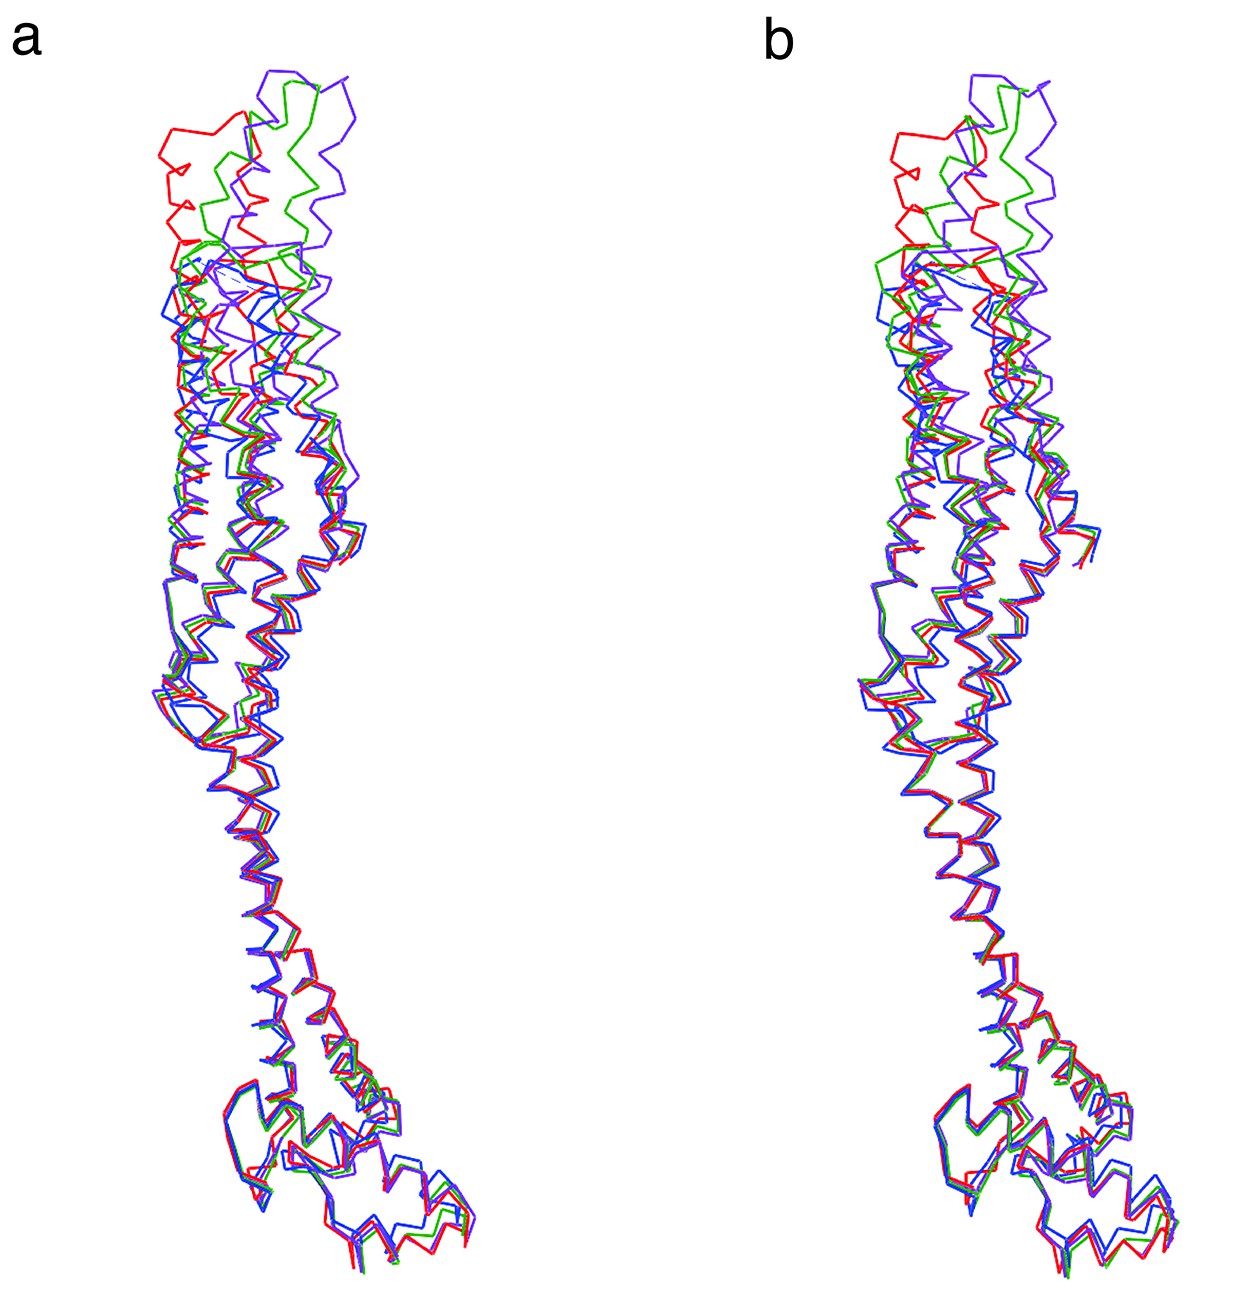
Superposition in stereo representation of the four XaxB molecules in the asymmetric unit.
(a) Stereo left eye. (b) Stereo right eye. Images were generated with Chimera UCSF. Molecules are depicted as backbone chain trace. Molecules A, B, C, and D are shown in red, green, blue and purple, respectively.
Figure 1—figure supplement 6
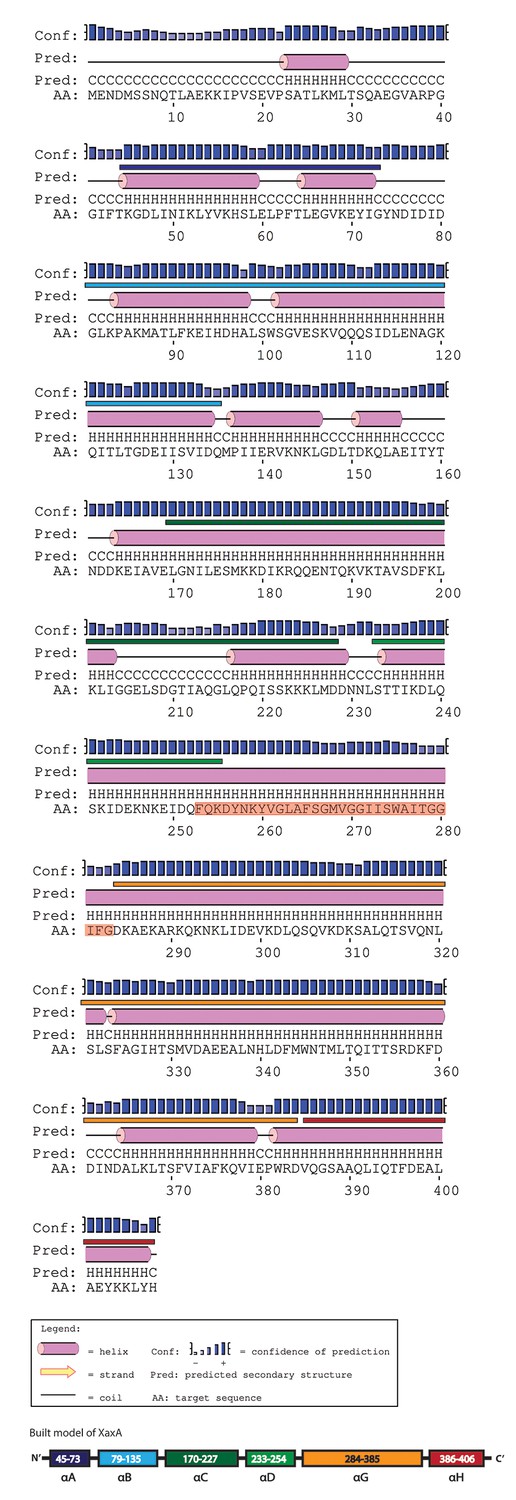
Secondary structure prediction of XaxA generated by PSIPRED.
The secondary structure of the built model is labeled above the prediction in the colors assigned to the different helices in Figure 1. The transmembrane sequence of XaxA is highlighted in red.
Figure 2

Interactions in the head domain of the XaxB monomer.
(a) The head domain of XaxB is stabilized by hydrophobic and electrostatic interactions including putative salt bridges. (b) The hydrophobic face of the amphipathic helix αE is shielded in the soluble monomer by hydrophobic interactions with the rest of the head domain. Figures are colored by degree of conservation based on a sequence alignment of XaxB with homologous sequences from different bacterial species from 100% (magenta) to 0% (cyan).
Figure 3 with 9 supplements
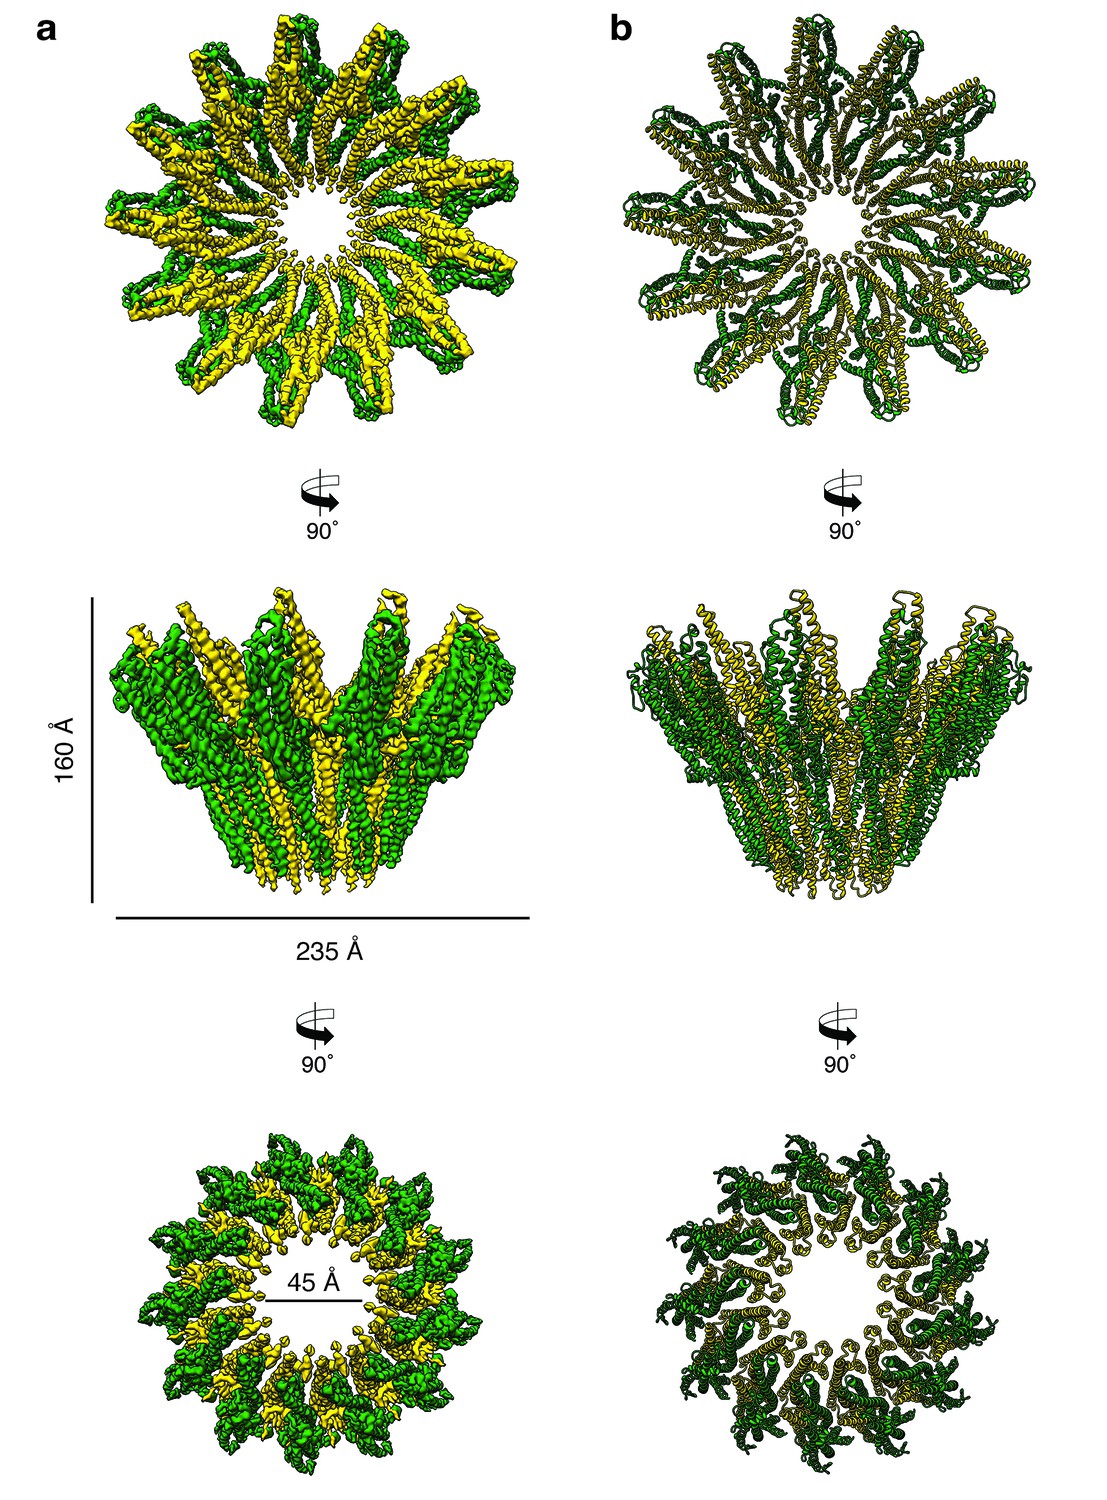
Cryo-EM structure of the tridecameric XaxAB pore complex.
(a) Cryo-EM density map of tridecameric XaxAB pores shown as top, side and bottom view. XaxA and XaxB are colored in green and yellow, respectively. (b) Ribbon representation of the atomic model of XaxAB. Colors shown as in (a).
Figure 3—figure supplement 1
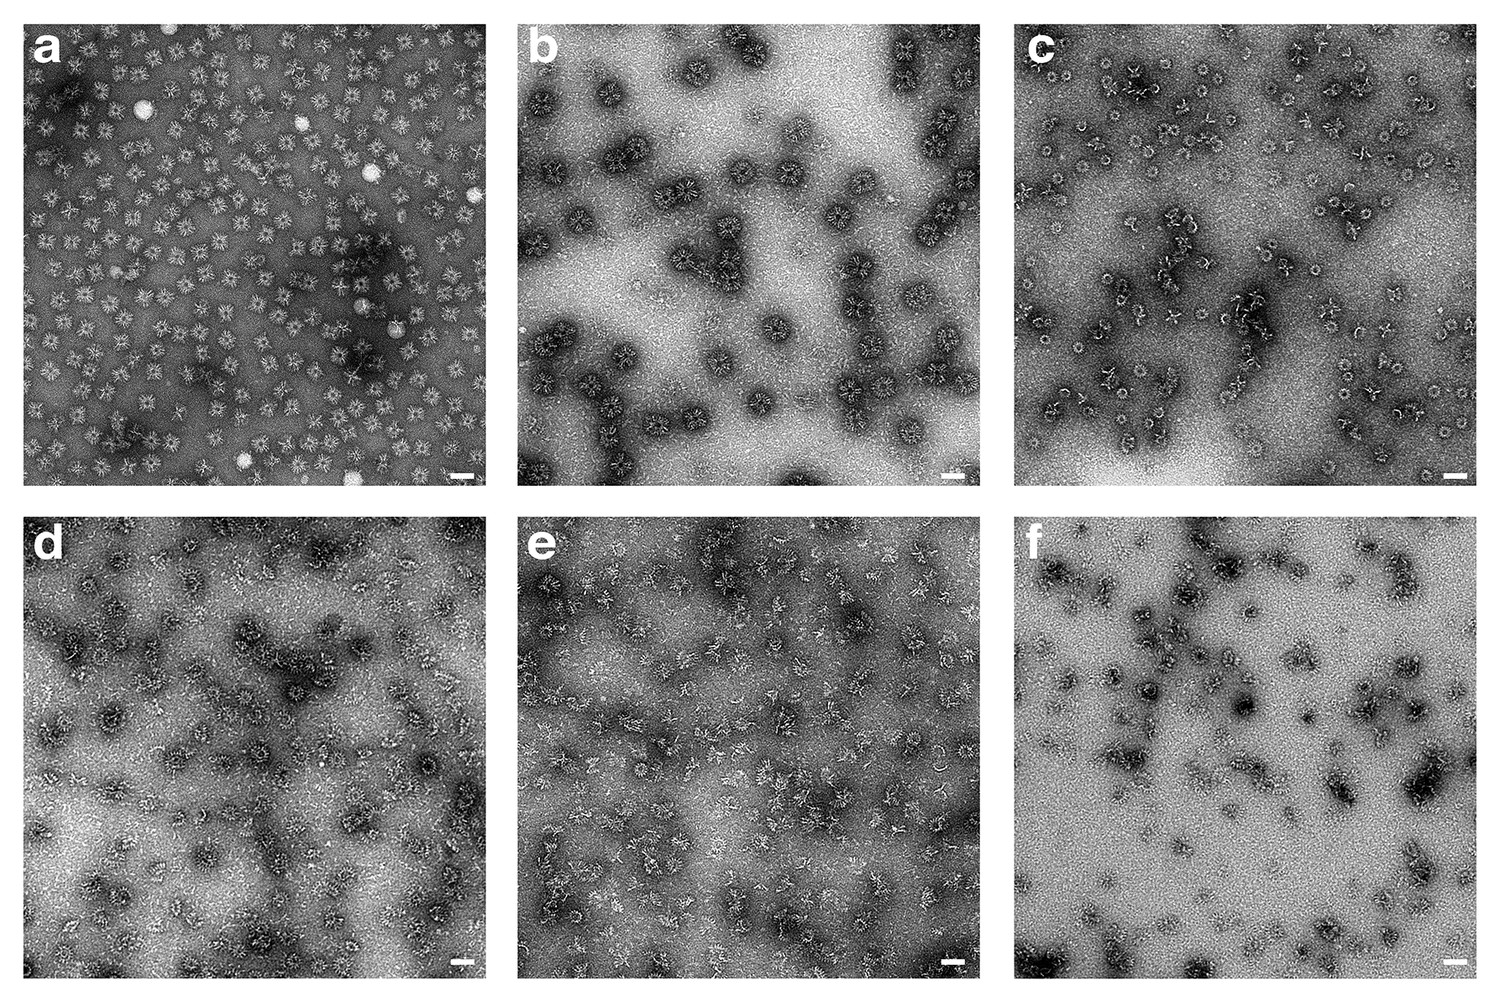
Pore formation of XaxAB induced by different detergents and analyzed by negative stain EM.
(a-f) Representative micrographs of negatively stained XaxAB pore complexes formed by incubation with different detergents, in particular n-Octyl-β-D-glucopyranoside (OG) (a), Lauryl maltose neopentyl glycol (LMNG) (b), 6-Cyclohexyl-1-hexyl-β-D-maltoside (Cymal-6) (c), 7-Cyclohexyl-1-hexyl-β-D-maltoside (Cymal-7) (d), 3-[(3-Cholamidopropyl)-dimethylammonio]−1-propane sulfonate] (CHAPS) (e), and Digitonin (f). Scale bars, 50 nm.
Figure 3—figure supplement 2
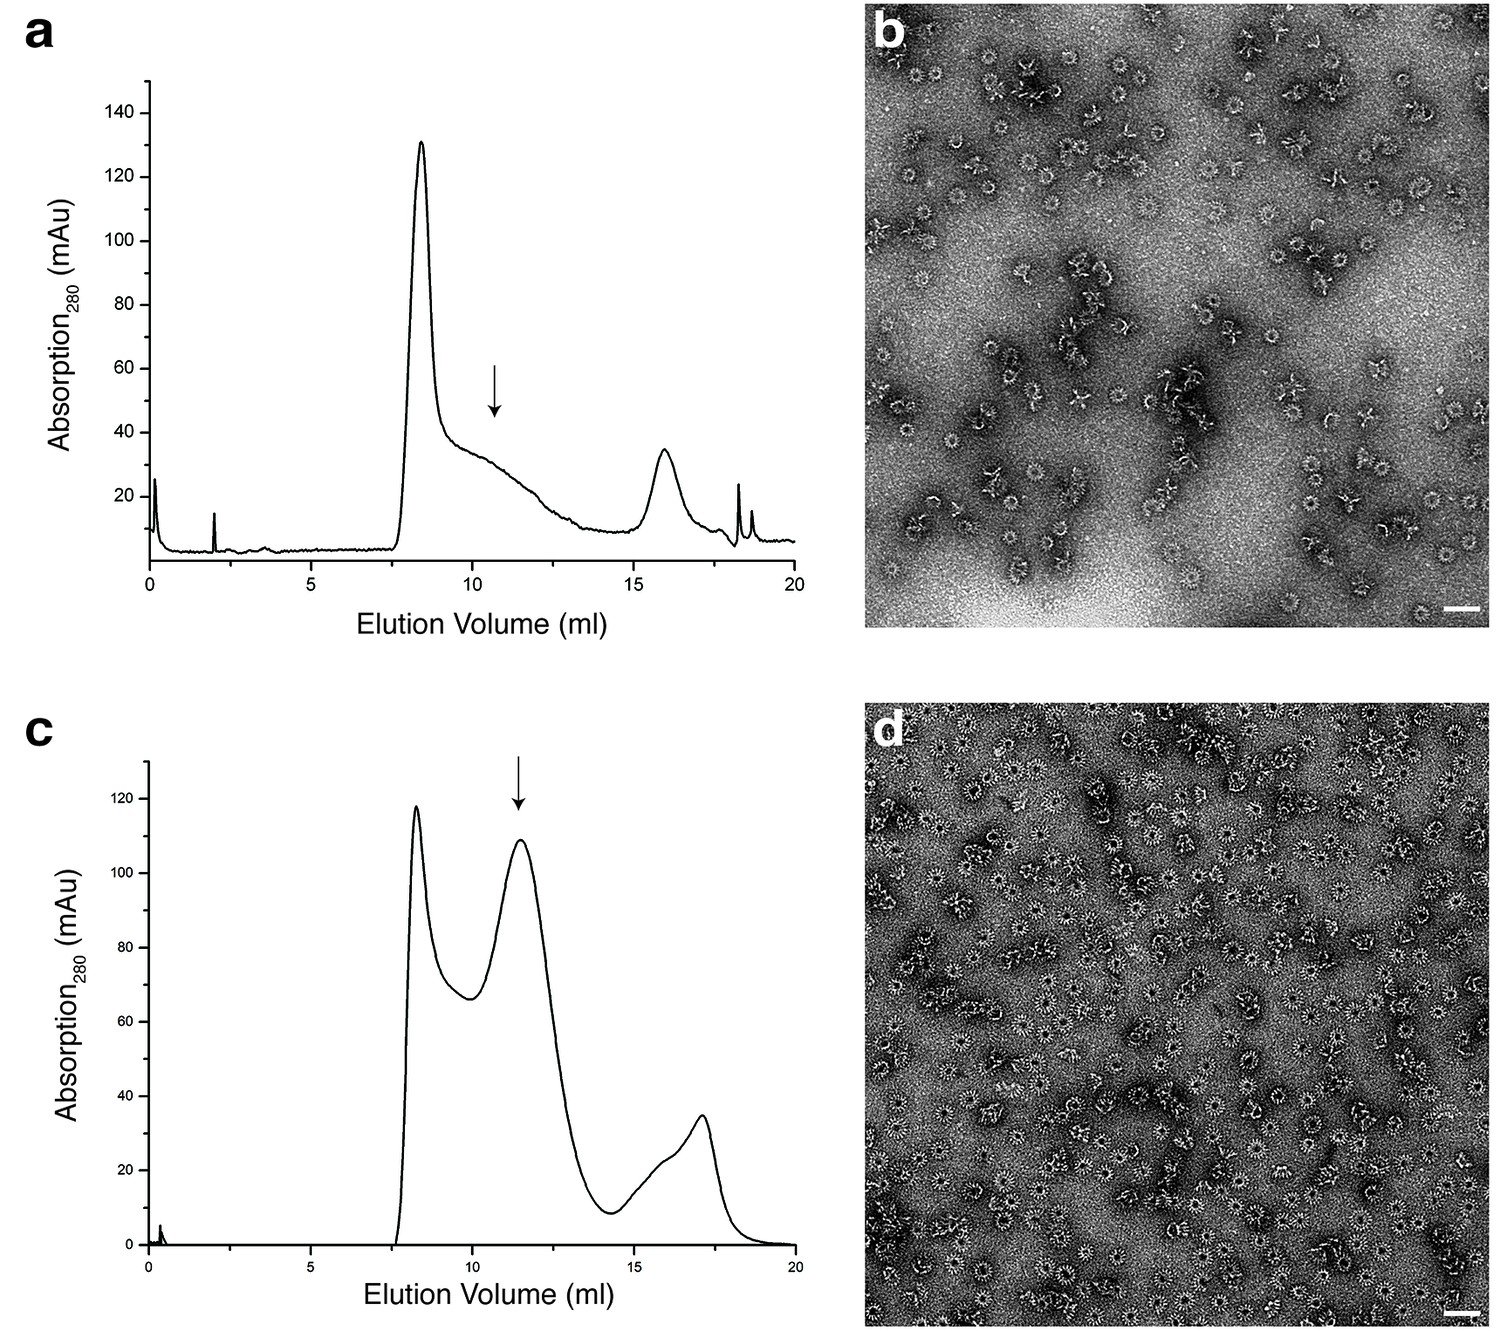
Analytical size exclusion chromatography and negative stain EM of XaxAB in Cymal-6 and amphipols.
(a) Size exclusion chromatography profile of XaxAB after incubation overnight with Cymal-6. (b) Representative electron micrograph of negatively stained XaxAB after incubation overnight with Cymal-6 (c). (c–d) Size exclusion profile (c) and representative electron micrograph (d) of the negatively stained XaxAB pore complex in amphipols. Scale bars, 50 nm. Arrows indicate fractions analyzed by negative stain electron microscopy.
Figure 3—figure supplement 3
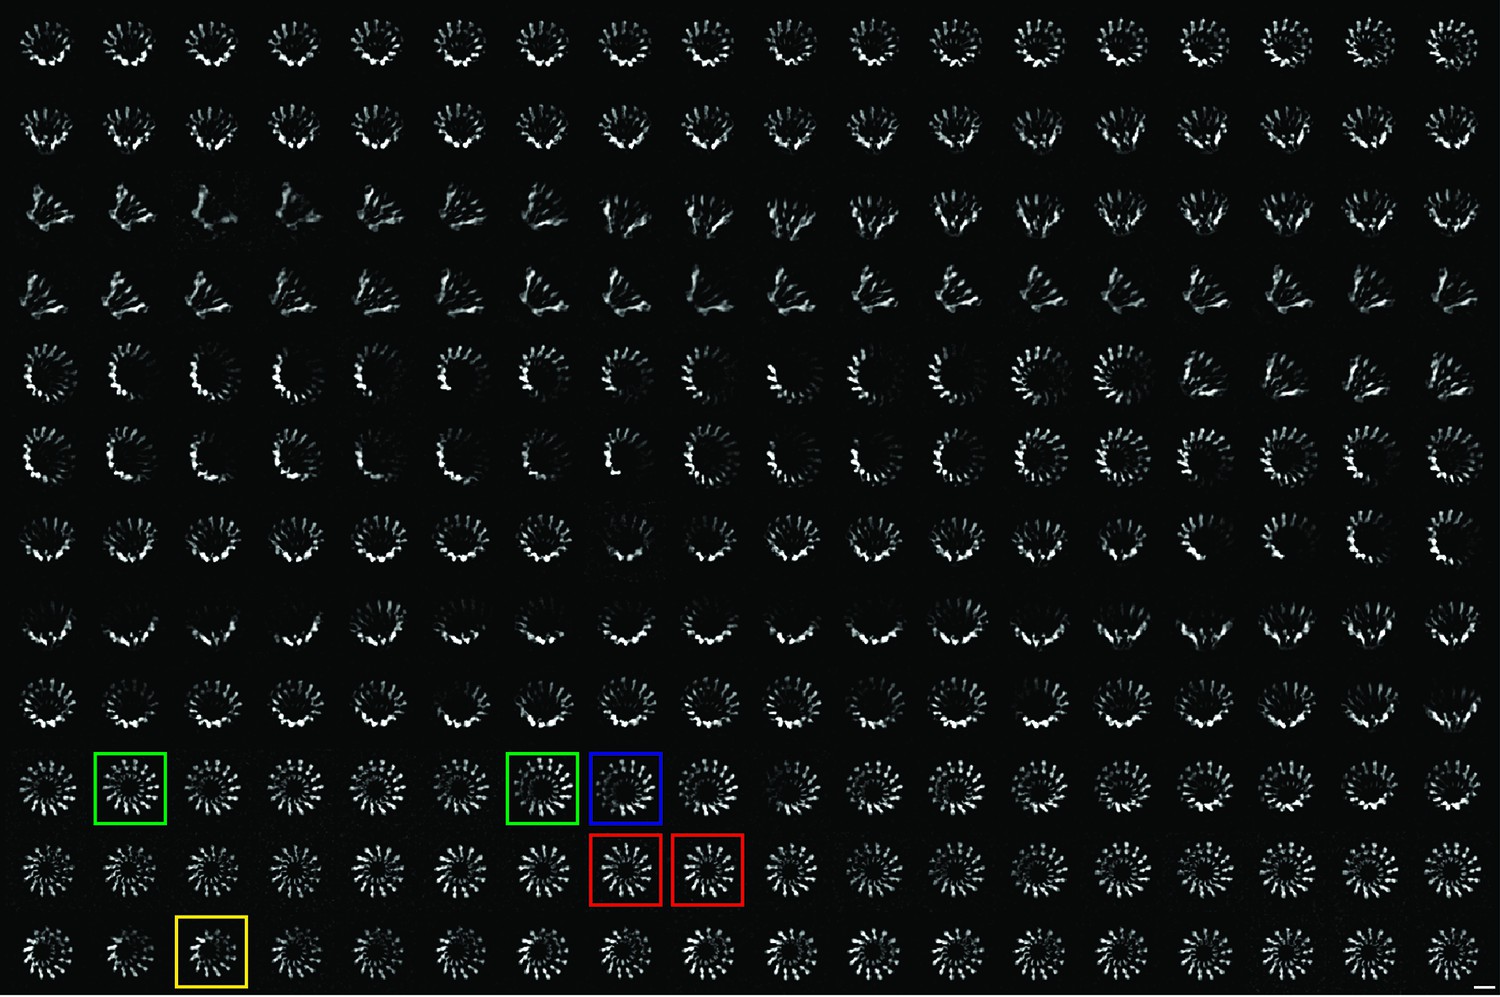
2-D class averages of XaxAB pores with different numbers of subunits.
Representative class averages of top views showing XaxAB pores with 12, 13, 14, and 15 subunits are highlighted in yellow, red, green and blue, respectively. Scale bar, 10 nm.
Figure 3—figure supplement 4

Single particle processing workflow of XaxAB structure determination.
During 3-D refinement a mask excluding the amphipol ring is applied to improve alignment of the particles during 3-D reconstruction.
Figure 3—figure supplement 5
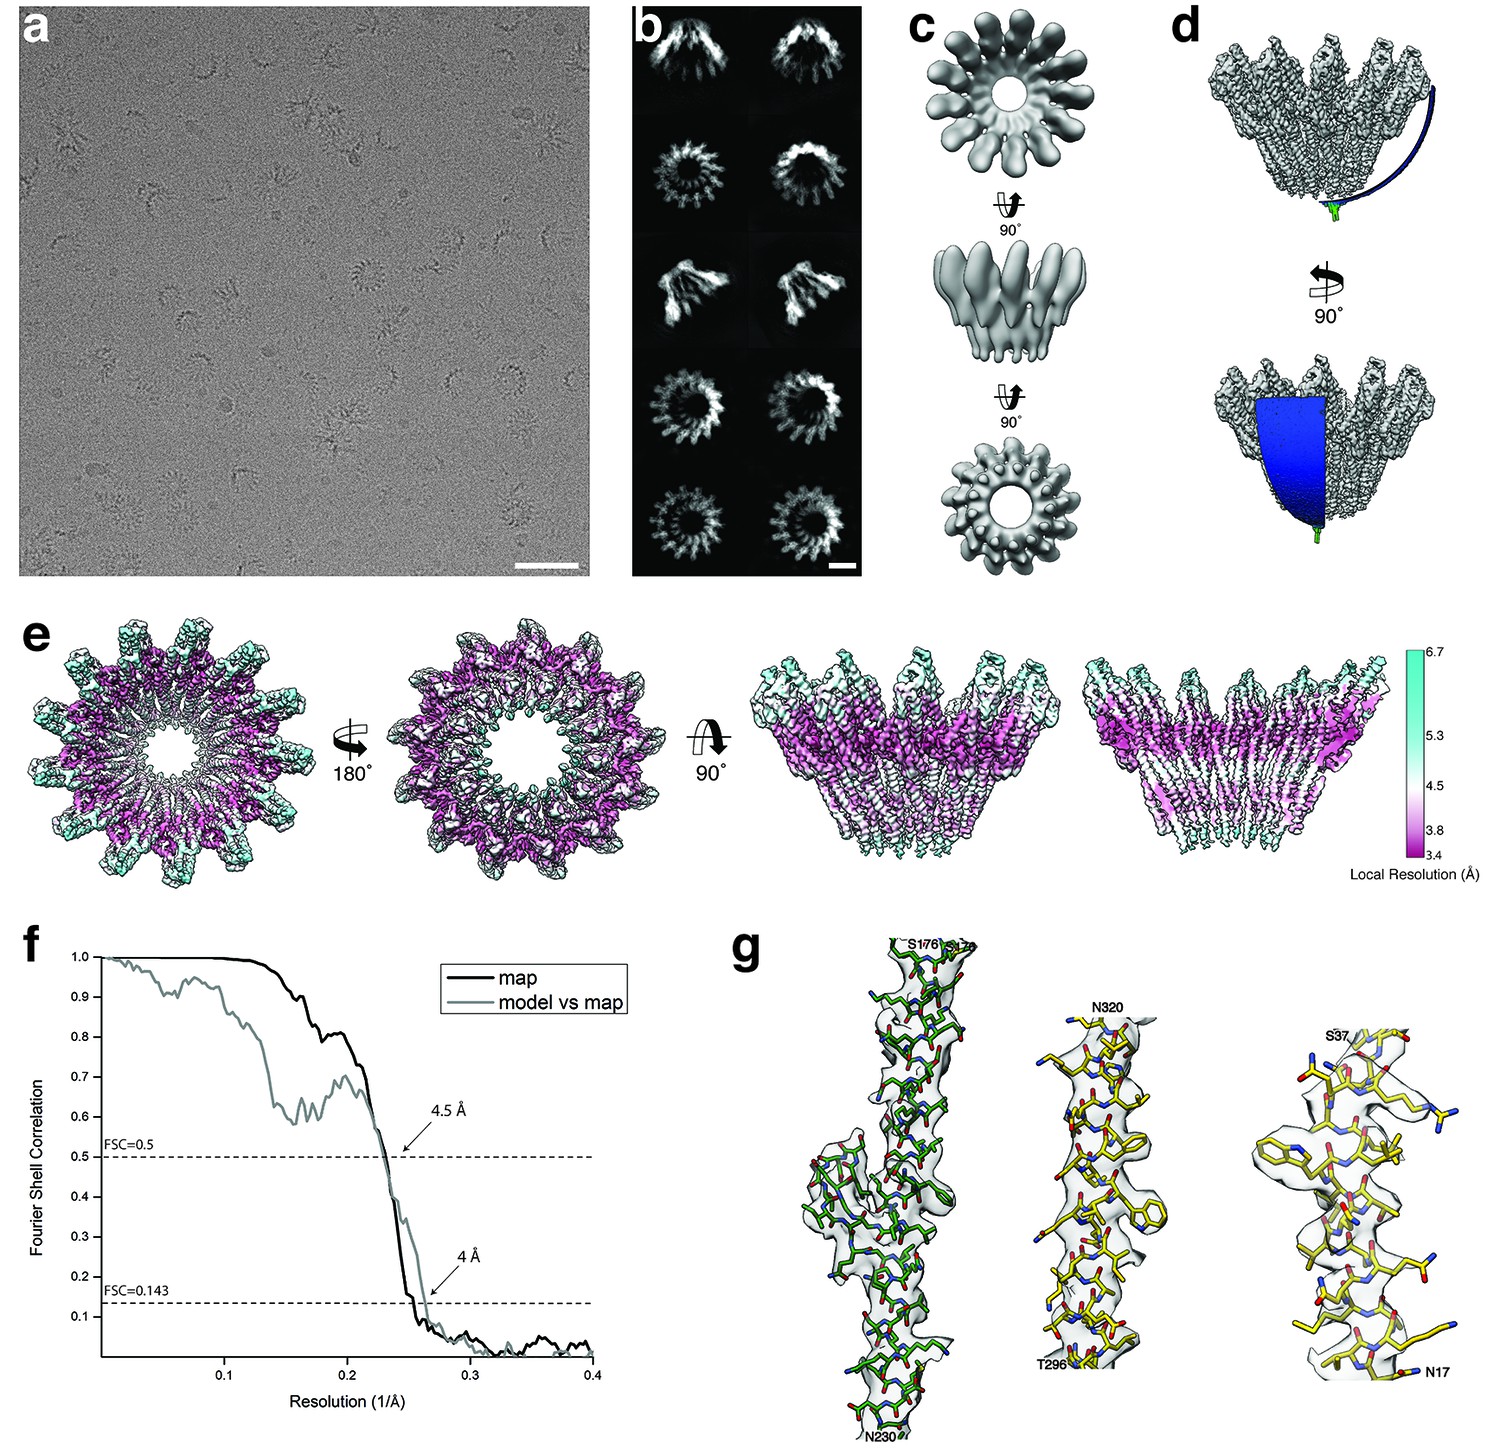
Cryo-EM structure of tridecameric XaxAB.
(a-b) Representative digital micrograph (a) and selected 2-D class averages (b) of the XaxAB toxin complex embedded in vitrified ice. Scale bars, 50 nm (a), and 10 nm (b). (c) Ab initio 3-D reconstruction generated with RVIPER. (d) Angular distribution of the particles. (e) Cryo-EM density map of XaxAB colored according to the local resolution. (f) Fourier Shell Correlation (FSC) curves between maps from two independently refined half data sets (black) and the final map versus the atomic model (grey). The 0.143 criterion shows an average resolution of 4 Å. (g) Representative regions of the density with fitted atomic models of XaxA (green) and XaxB (yellow).
Figure 3—figure supplement 6
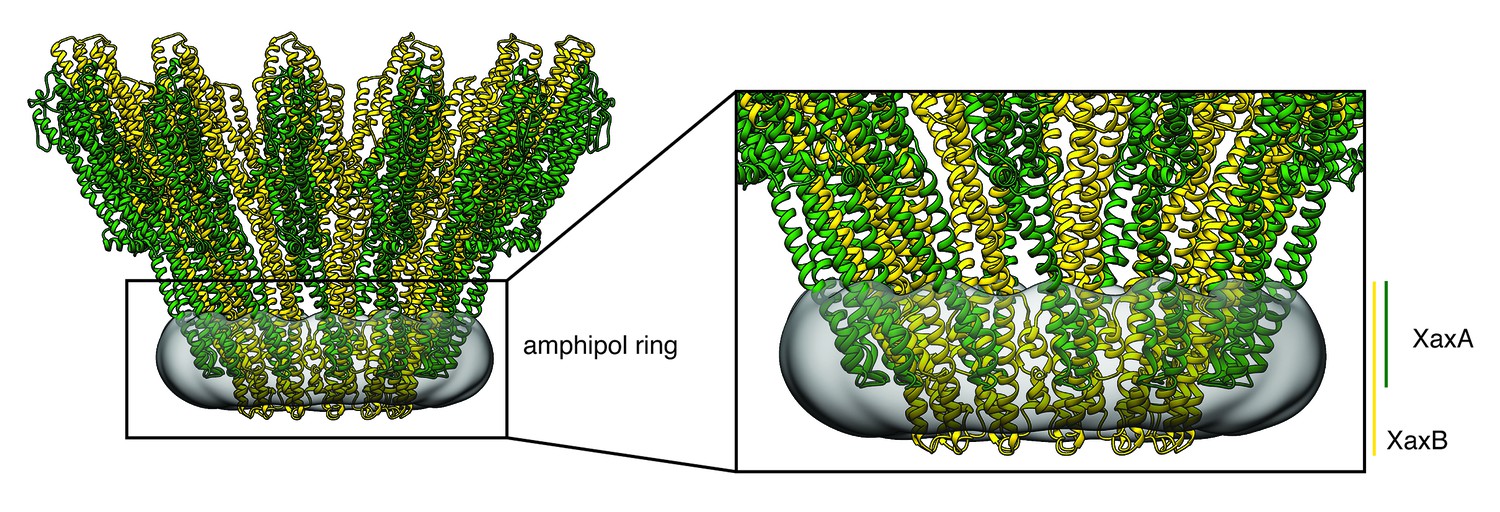
Transmembrane domains of XaxAB embedded in amphipols.
The amphipol density is shown in transparent grey at a lower threshold to allow better visualization. Protomers of XaxA and XaxB are depicted in green and yellow, respectively.
Figure 3—figure supplement 7
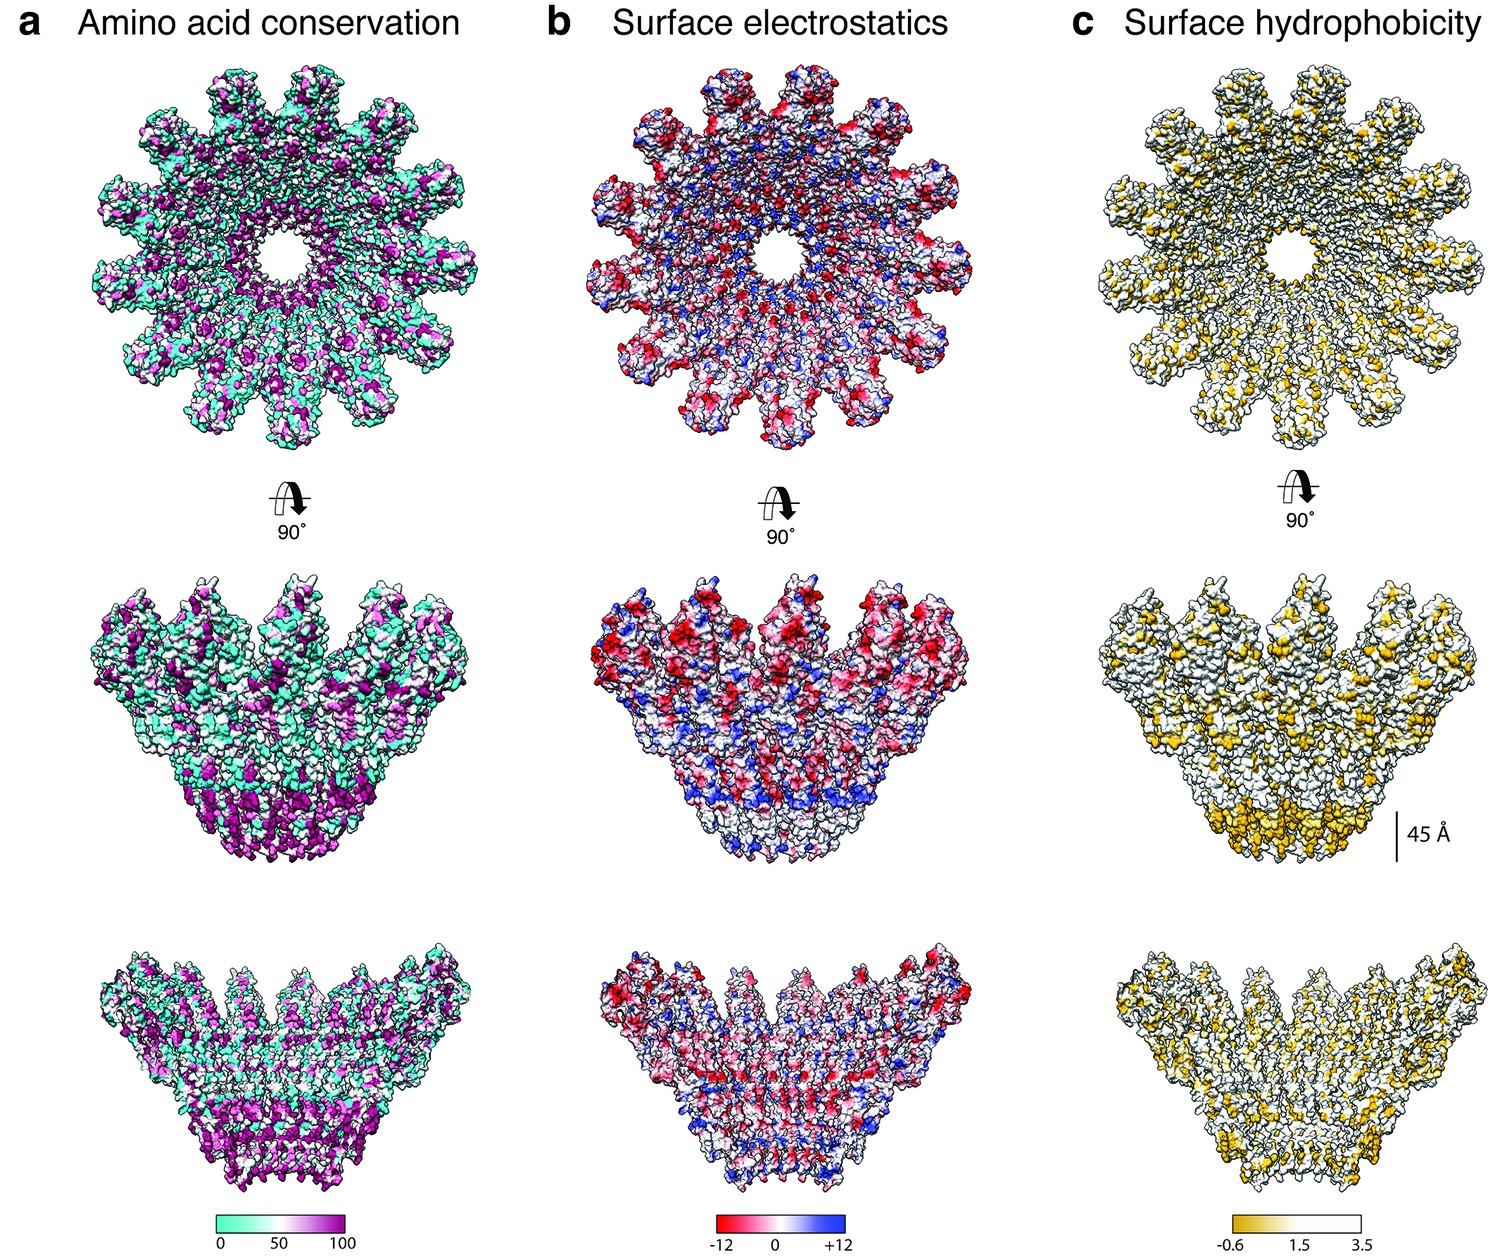
Biophysical properties of the XaxAB pore.
(a-c) Top and side views on the surface and the inside of the pore complex, showing the conservation of residues (a), the surface electrostatic Coulomb potential at pH 7.5 (b), and the surface hydrophobicity (c). Conserved residues are shown in magenta, positively and negatively charged surfaces are colored in blue and red, respectively and hydrophobic patches are depicted in orange.
Figure 3—figure supplement 8
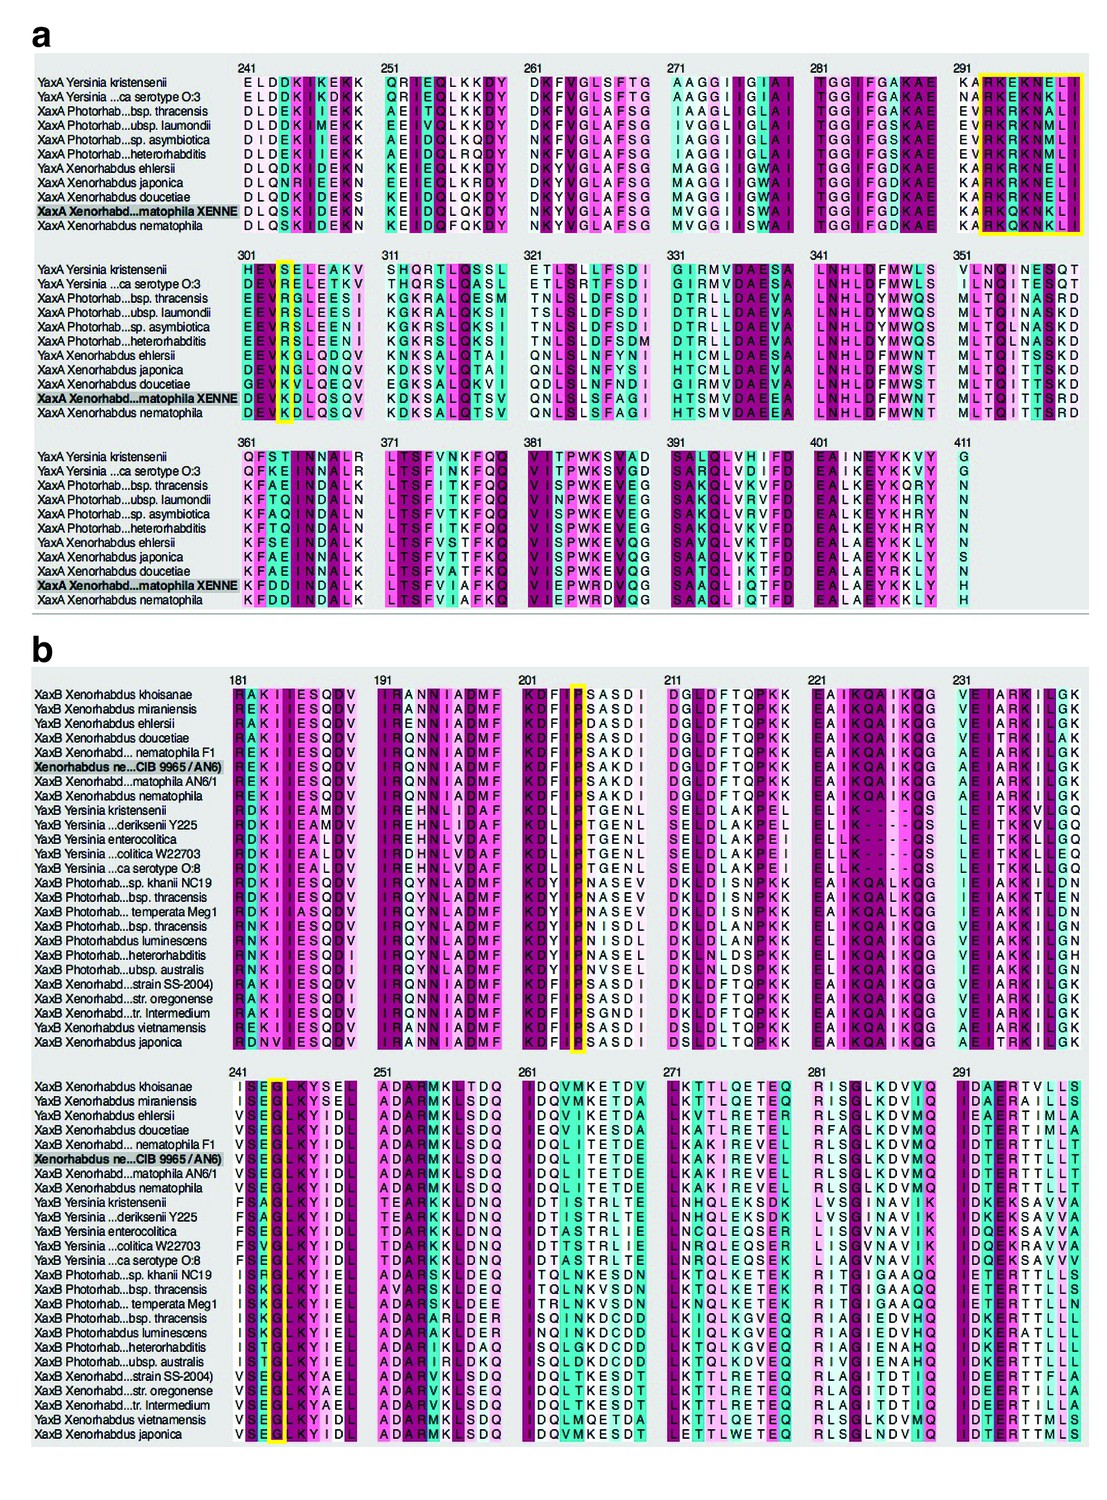
Amino acid sequence alignment and conservation of the transmembrane region of XaxA (a) and XaxB (b).
Yellow boxes highlight the conserved positively charged region in XaxA (a) and the conserved proline (P204) and glycine (G243) residues located at the hinge regions of XaxB (b).
Figure 3—figure supplement 9

Comparison of the XaxAB pore complex with other α-PFTs.
(a, b) Top (a) and side (b) views of the XaxAB, ClyA (pdb-ID: 2WCD) and FraC (pdb-ID: 4TSY) pore complexes. (c) Surface electrostatic Coulomb potential at pH 7.5 on the inside of the XaxAB, ClyA and FraC pore complexes. Positively and negatively charged surfaces are shown in blue and red, respectively. The membrane is indicated by a grey band.
Figure 4 with 1 supplement
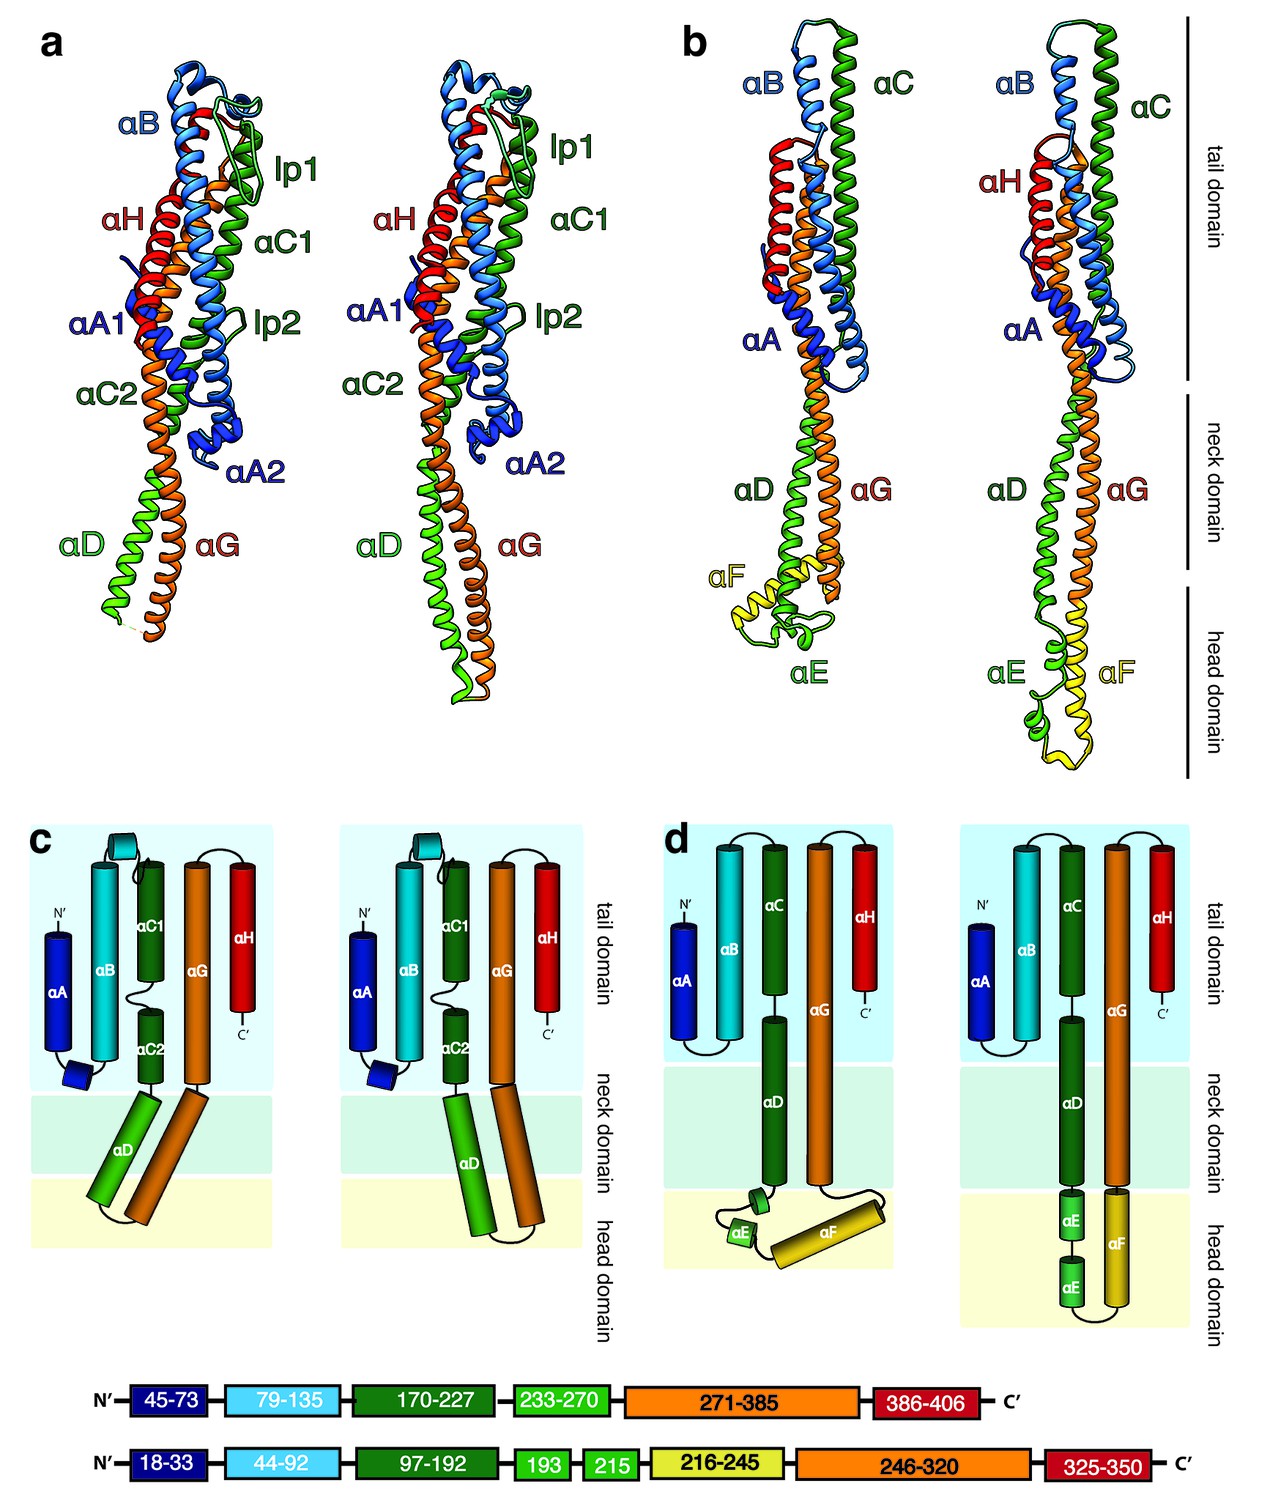
Structures of the soluble monomer and protomer of XaxA and XaxB.
(a) Ribbon representation of the atomic model of the XaxA monomer (left) and protomer (right). (b) Ribbon representation of the XaxB monomer (left) and protomer (right). (c–d) Topology diagram depicting helices and domain organization of XaxA (c) and XaxB (d). Each helix is shown in a different color and labeled accordingly.
Figure 4—figure supplement 1
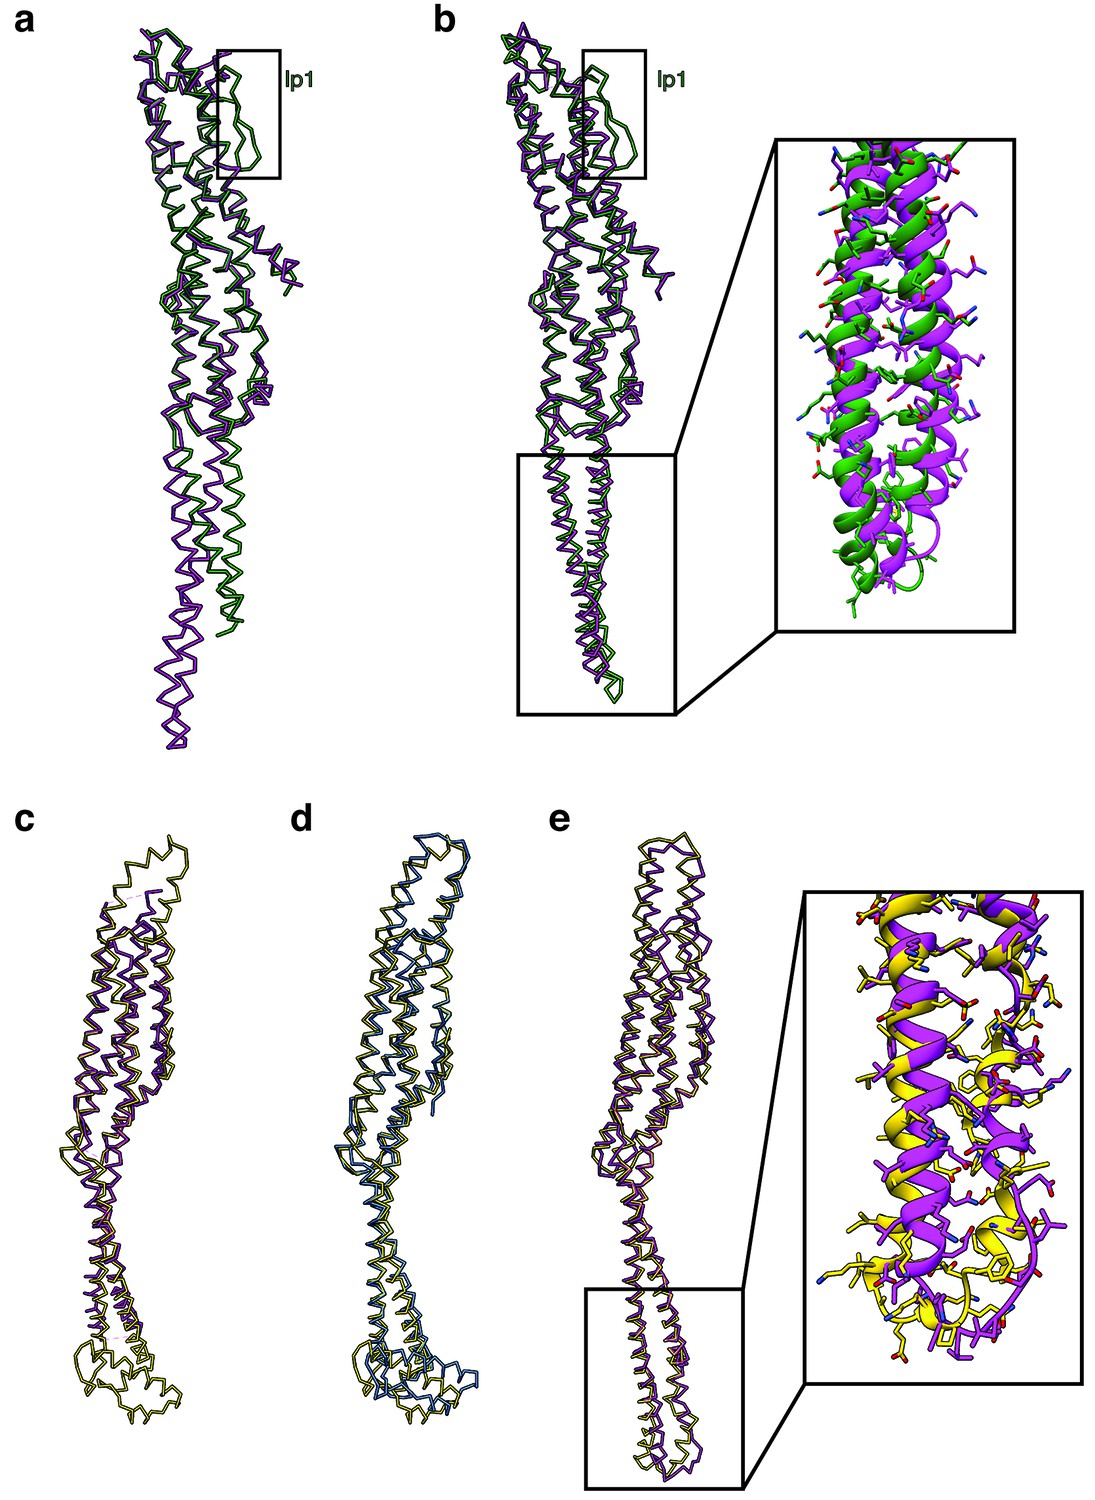
Comparison of XaxAB and YaxAB.
(a). Superposition of the XaxA (green) and YaxA (pink) (pdb:6EK7) crystal structures. (b) Superposition of the cryo-EM structures of XaxA (green) and YaxA protomers (pink, pdb: 6EL1). Inset: Close up view on the head domain. (c-d) Superposition of the XaxB (yellow), YaxB (pink, pdb: 6EK8) and PaxB (blue, pdb: 6EK4) crystal structures. (e) Superposition of the cryo-EM structures of the XaxB (green) and YaxB protomers (pink, pdb: 6EL1). Inset: Close up view on the head domain.
Figure 5
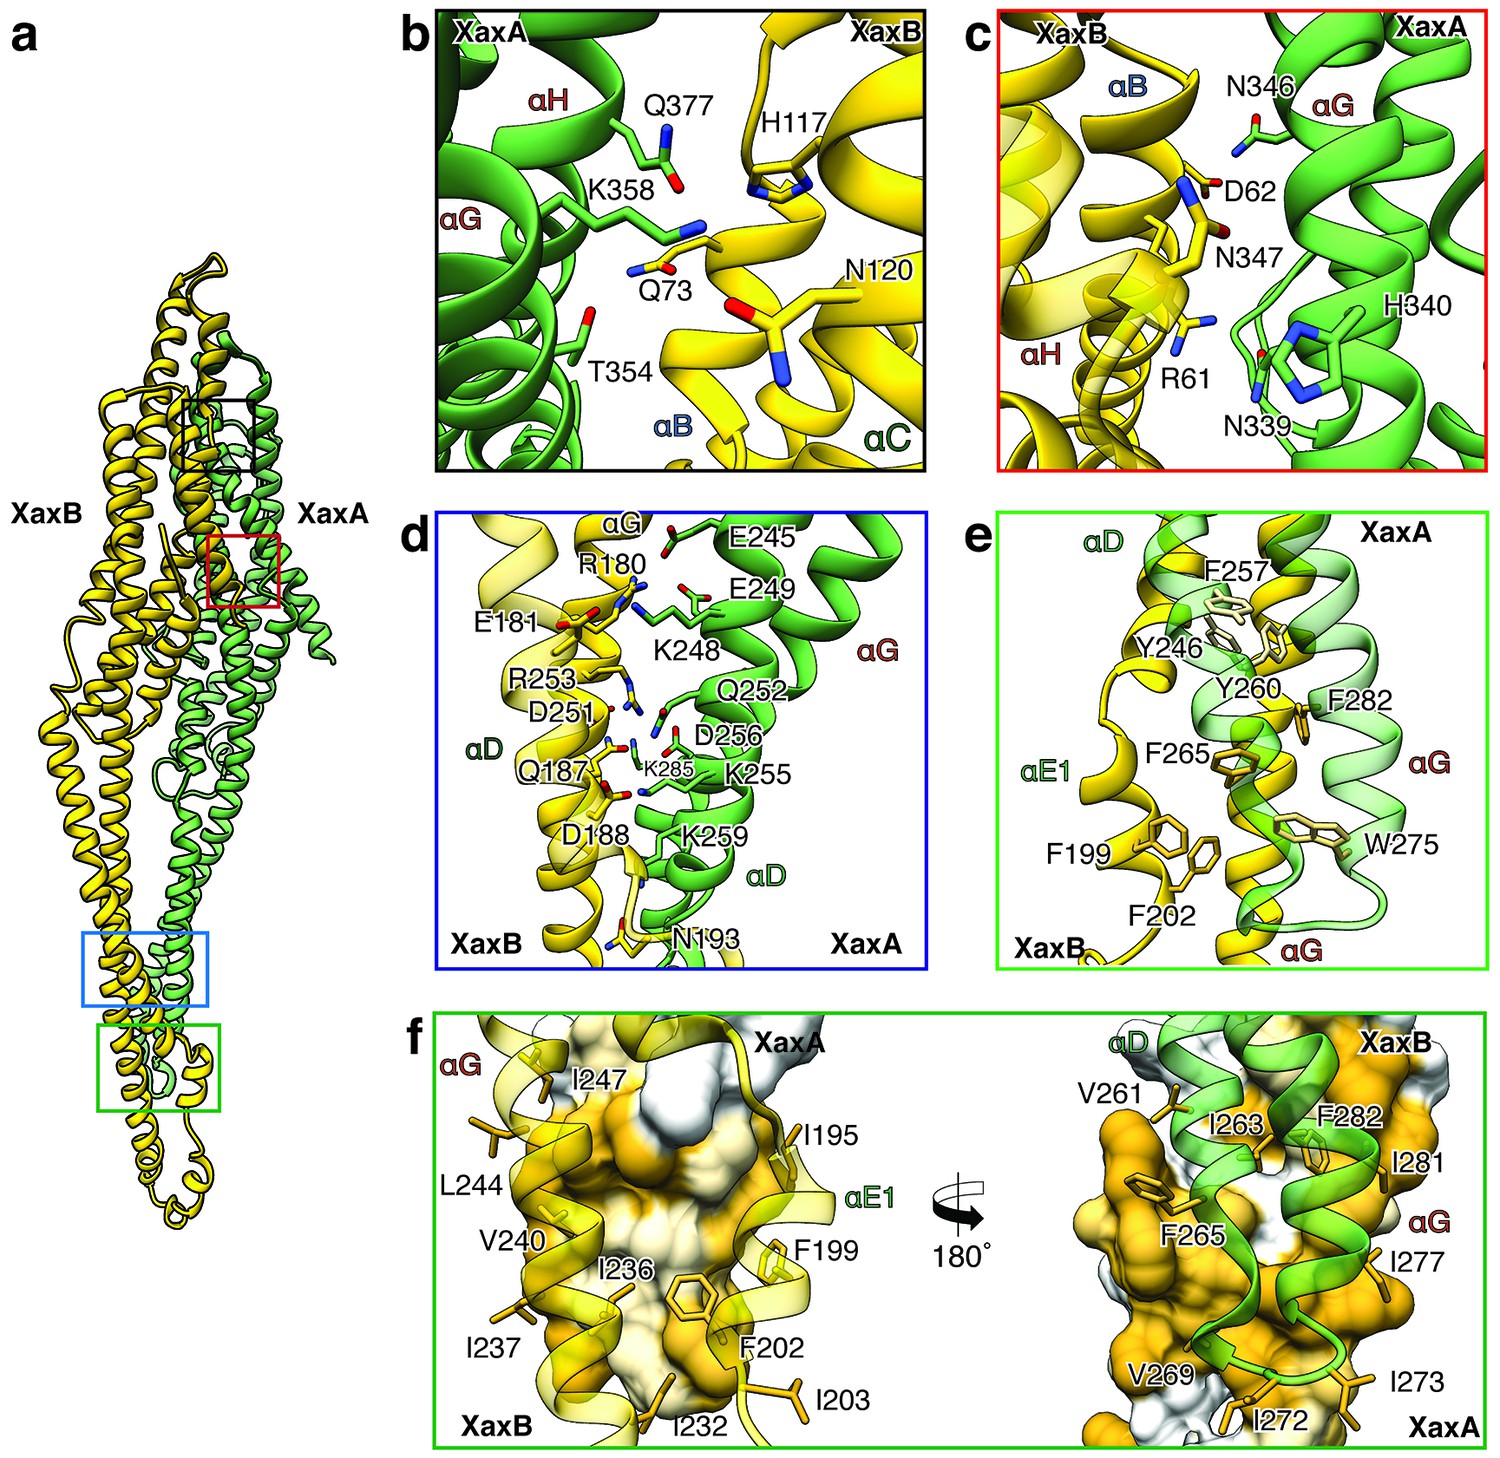
XaxAB heterodimer interactions in the pore complex.
(a) Overview of interaction interfaces between XaxA and XaxB. (b–c) Network of putative hydrogen bonds between the tail domains. (d) Putative salt bridges in the junction connecting the neck and head domains. (e) The hydrophobic head domains of XaxA and XaxB are stabilized by a cluster of aromatic amino acids. (f) Hydrophobic interface between the transmembrane domain of XaxA and XaxB in one subunit of the pore. Left: XaxB is depicted in ribbon and XaxA in surface representation colored by hydrophobicity. Right: XaxA is depicted in ribbon representation and XaxB in surface representation colored by hydrophobicity. Protomers of XaxA and XaxB are depicted in green and yellow, respectively. Helices not involved in the interaction are shown in a lighter color for visualization purposes.
Figure 6
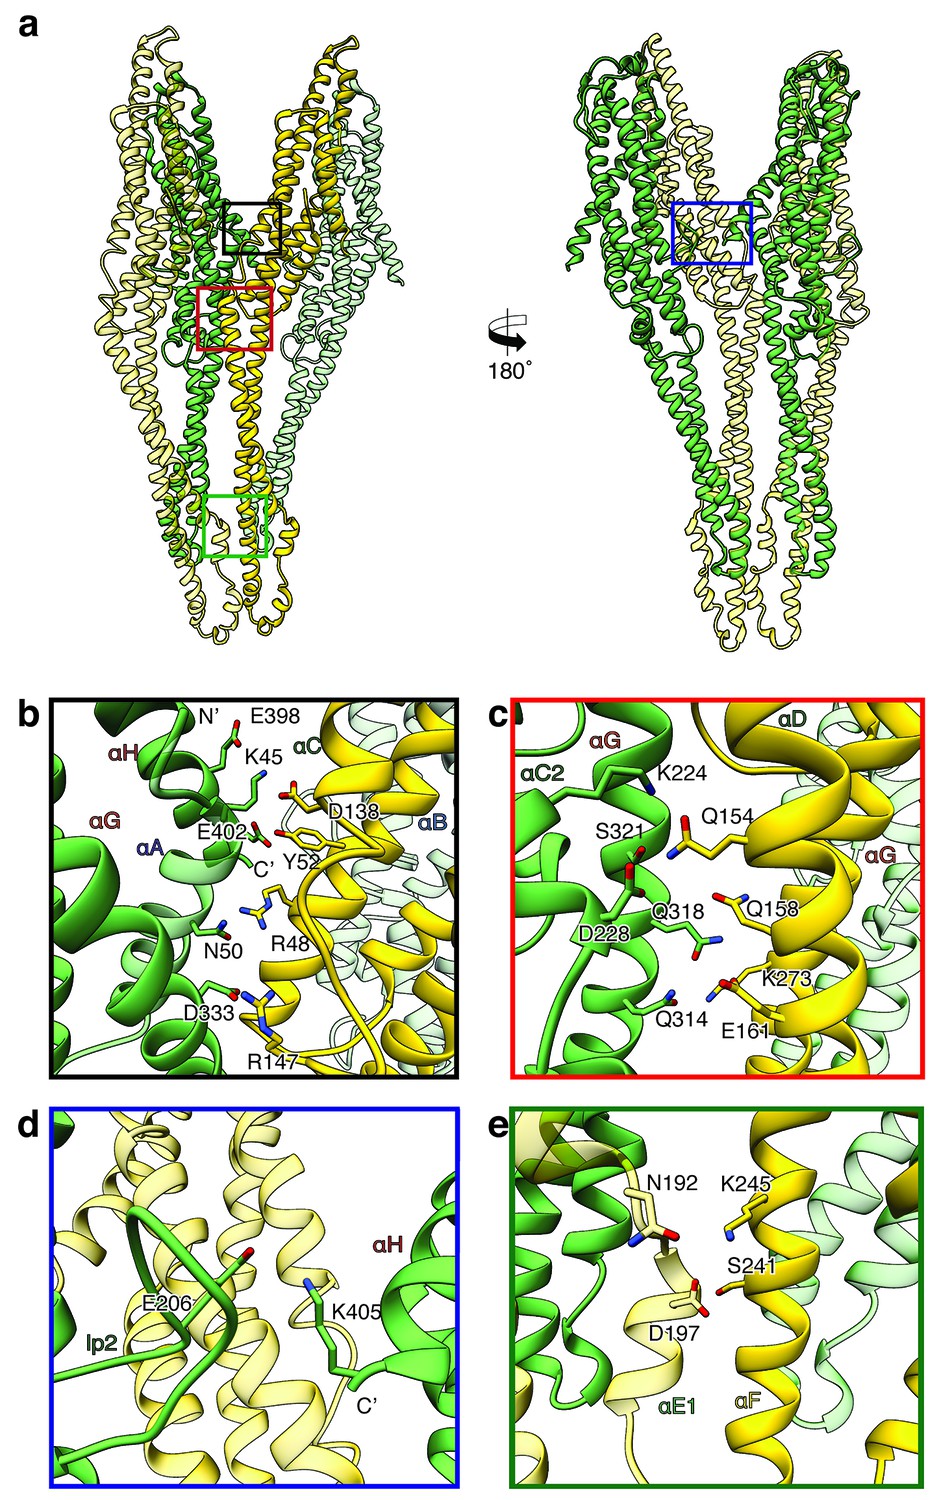
Inter-subunit interfaces of the XaxAB pore complex.
(a) Overview of four prominent inter-subunit interfaces. (b,c) The tail domain of XaxA forms an extensive putative hydrogen network with the tail and neck domain of the adjacent XaxB. (d) A putative salt bridge formed between the C-terminus and the loop connecting αC1 and αC2 of neighboring XaxA protomers further stabilizes the pore complex. (e) Stabilization of the transmembrane pore by additional putative hydrogen bonds and a salt bridge formed between XaxA and XaxB from the adjacent subunit. Protomers of XaxA and XaxB are depicted in green and yellow, respectively. Helices not involved in the interaction are shown in a lighter color for visualization purposes.
Figure 7
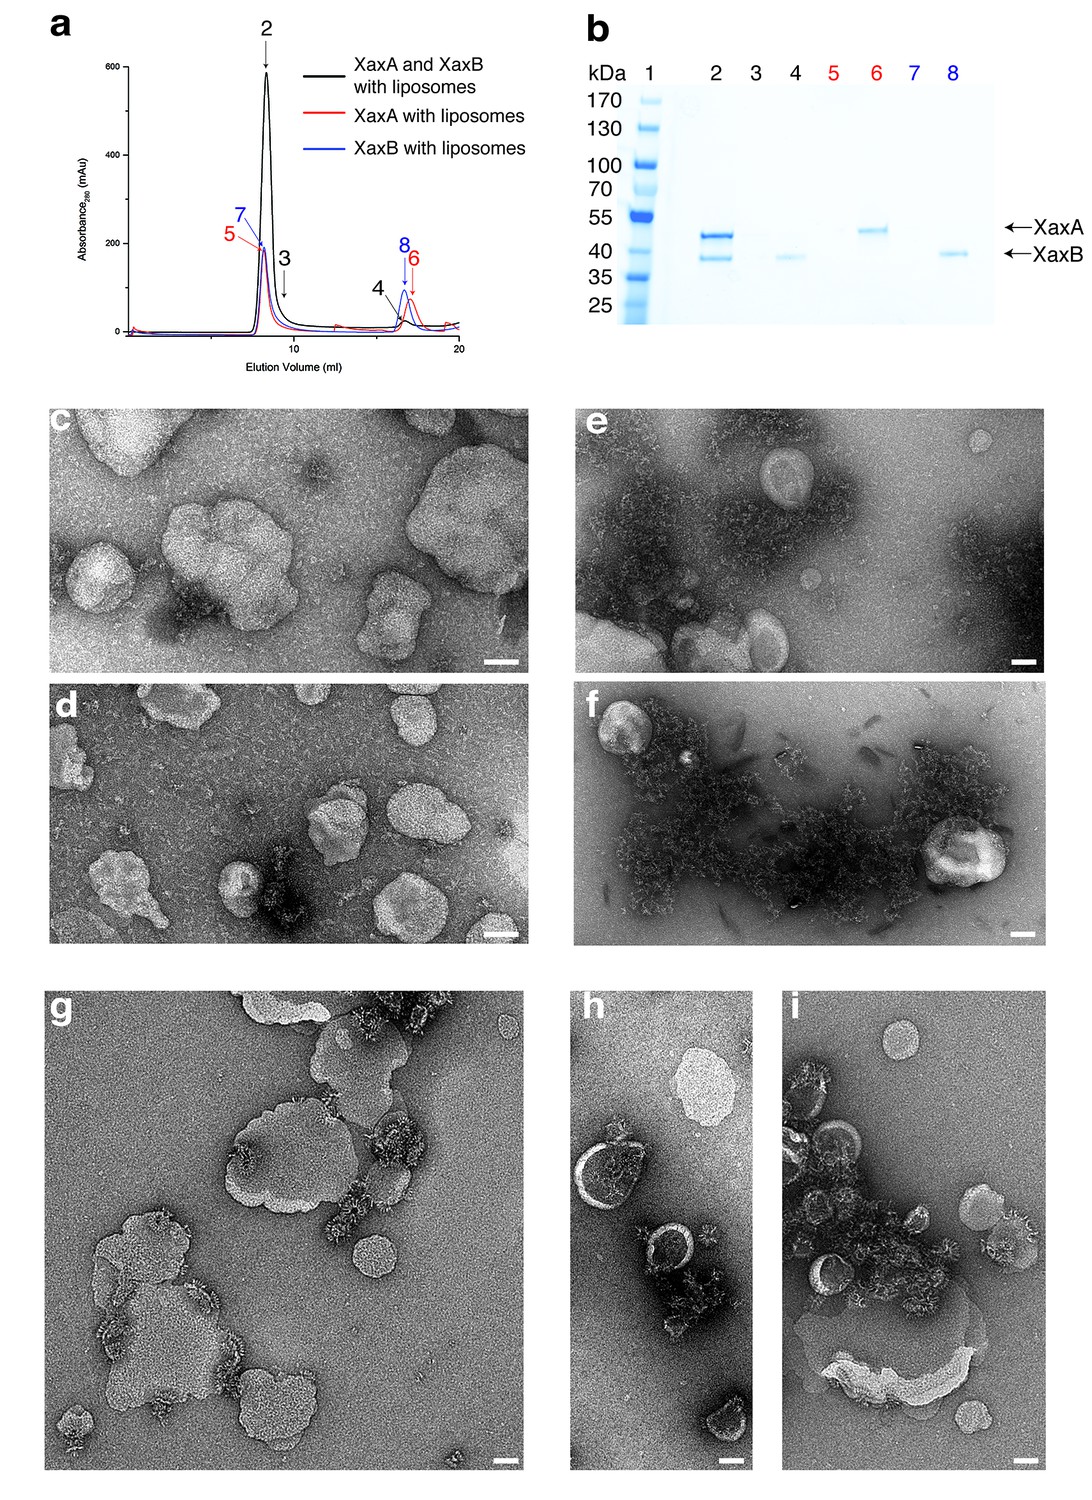
XaxAB reconstitution in liposomes.
(a) Size exclusion profiles of XaxA (red) and XaxB (blue) alone and of a 1:1 mixture of XaxA and XaxB (black) after incubation with liposomes. Arrows and numbers indicate the fractions corresponding to the lanes in the SDS-PAGE gel. (b) SDS-PAGE of the peak fractions of (a). Lane 1: molecular weight marker, lanes 2–3, 4: void volume and monomeric peak of the XaxA/XaxB mixture, lanes 5–6: void volume and monomer peak of XaxA, lanes 7–8: void volume and monomer peak of XaxB. (c–d) Negative stain EM of XaxA reconstitutions into POPC (c) or BPL (d) liposomes. (e–f) Negative stain EM of XaxB reconstitutions into POPC (e) or BPL (f) liposomes. (g–i) Negative stain EM of XaxAB reconstitutions into POPC (g) or BPL (h–i) liposomes. Scale bars 50 nm.
Figure 8
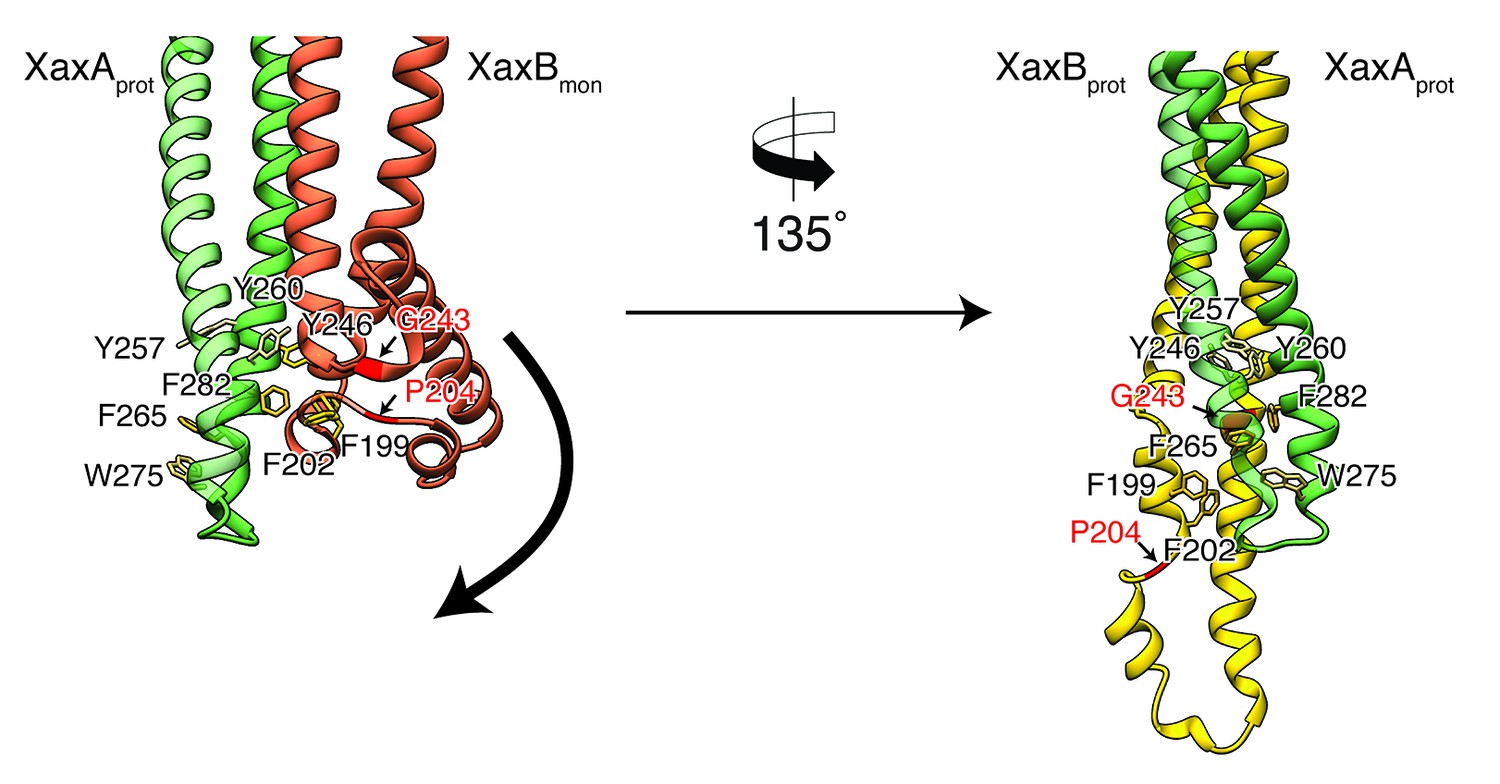
Model for membrane insertion.
A heterodimer model was built with XaxA in protomeric (XaxAprot) and XaxB in monomeric (XaxBmon) conformation to mimic a possible intermediate state (left) and compared to the conformation in the pore complex (right). An aromatic cluster at the bottom of the head domain of the XaxAprot-XaxBmon heterodimer possibly triggers the conformational change of XaxB when exposed to a lipid membrane. Swinging out of the amphipathic helix αE happens at two hinge regions at the position of conserved proline (P204) and glycine (G243) residues, respectively (highlighted in red and marked with arrows). After membrane insertion, the aromatic residues interact with each other, stabilizing the new conformation. The soluble monomer of XaxB is shown in orange. Protomers of XaxA and XaxB are depicted in green and yellow, respectively.
Figure 9 with 2 supplements
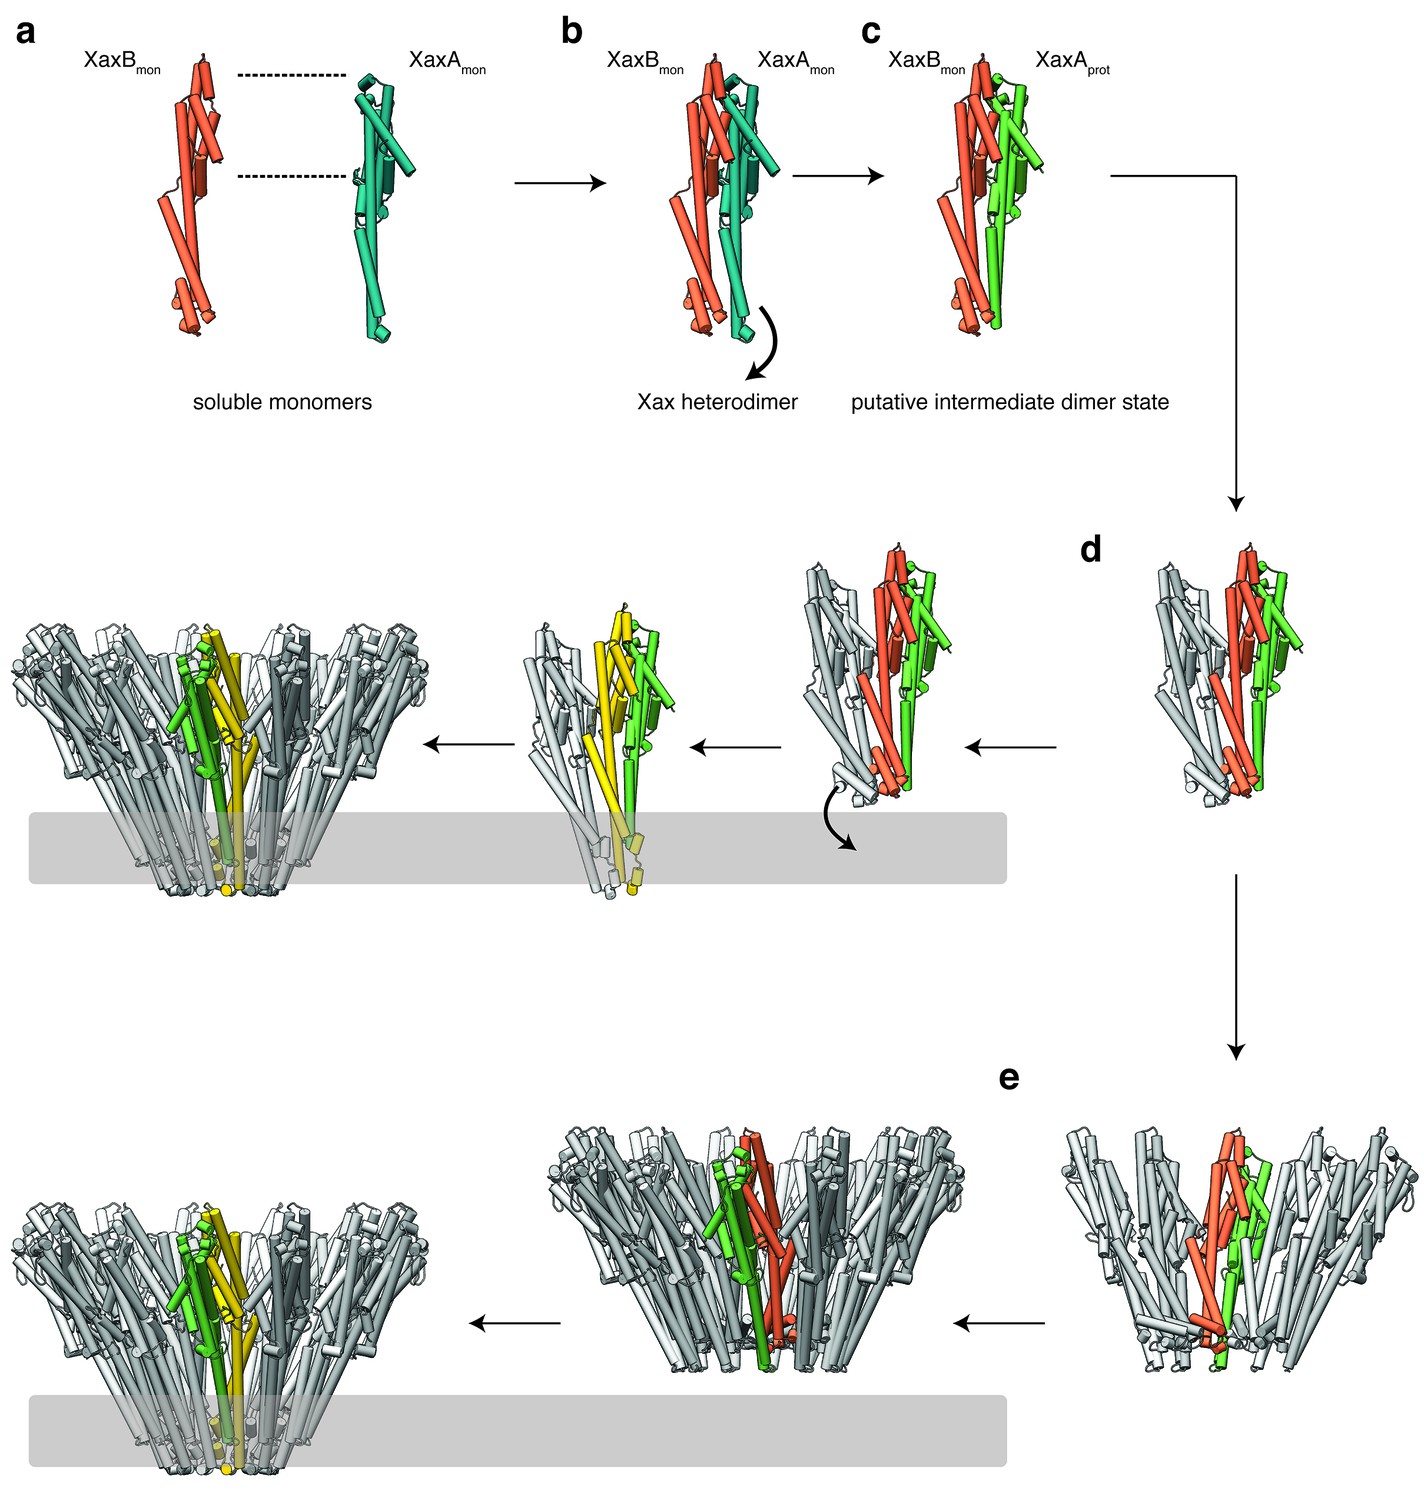
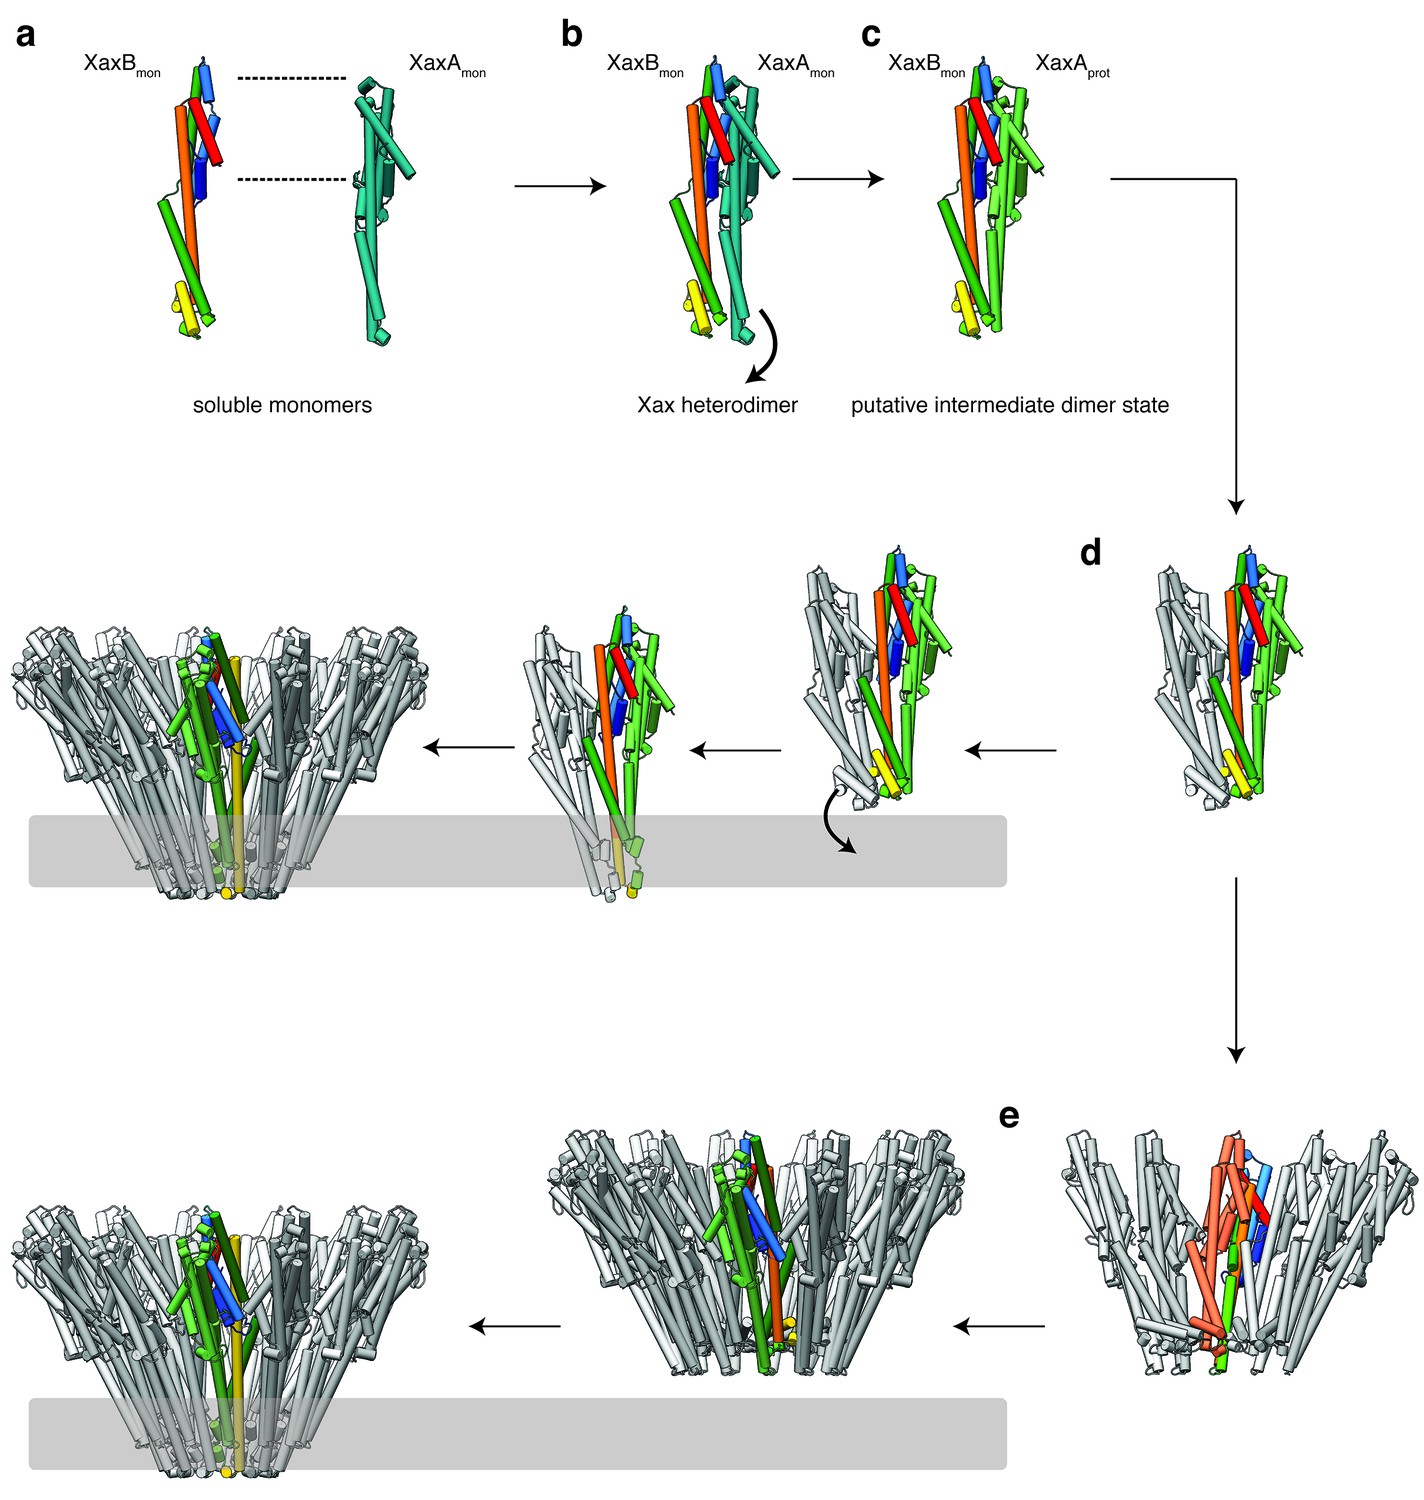
Mechanism of pore formation.
(a) XaxA and XaxB dimerize in solution. (b–c) The major interaction site in the heterodimer is between the tail domains of XaxA and XaxB (b). This interaction induces neck and head domain (αD, αG) of XaxA to shift towards XaxB (αD, αG) activating XaxB for oligomerization interaction (c) and membrane insertion by clashing with the loop between αE and αF. (d–e) Interactions of aromatic residues at the bottom of the head domain with the membrane trigger the conformational changes that lead to membrane insertion. Membrane insertion happens either directly (d) or after a pre-pore complex is formed (e). The soluble monomer of XaxA and XaxB is shown in teal and orange, respectively. After the conformational change of the soluble monomers, XaxA and XaxB protomers are depicted in green and yellow, respectively.
Figure 9—figure supplement 1

Mechanism of pore formation.
(a) XaxA and XaxB dimerize in solution. (b–c) The major interaction site in the heterodimer is between the tail domains of XaxA and XaxB (b). This interaction induces neck and head domain (αD, αG) of XaxA to shift toward XaxB (αD, αG) activating XaxB for oligomerization interaction (c) and membrane insertion by clashing with the loop between αE, αF. (d–e) Interactions of aromatic residues at the bottom of the head domain with the membrane trigger the conformational changes that lead to membrane insertion. Membrane insertion happens either directly (d) or after a pre-pore complex is formed (e). For better visualization, the helices of the soluble monomer and protomer of XaxA are depicted in the different colors established in Figure 4. The soluble monomer and protomer after the conformational change of XaxB are shown in orange and yellow, respectively.
Figure 9—figure supplement 2
Mechanism of pore formation.
(a) XaxA and XaxB dimerize in solution. (b–c) The major interaction site in the heterodimer is between the tail domains of XaxA and XaxB (b). This interaction induces neck and head domain (αD, αG) of XaxA to shift toward XaxB (αD, αG) activating XaxB for oligomerization interaction (c) and membrane insertion by clashing with the loop between αE, αF. (d–e) Interactions of aromatic residues at the bottom of the head domain with the membrane trigger the conformational changes that lead to membrane insertion. Membrane insertion happens either directly (d) or after a prepore complex is formed (e). For better visualization, the helices of the soluble monomer and protomer of XaxB are depicted in the different colors established in Figure 4. The soluble monomer and protomer after the conformational change of XaxA are shown in teal and green, respectively.
Videos
Video 1
Cryo-EM map of XaxAB in its pore state.
Molecular model and cryo-EM map of the tridecameric XaxAB pore complex from Xenorhabdus nematophila, showing the overall structure of the pore complex. XaxA and XaxB subunits are colored in green and yellow, respectively.
Video 2
Dimerization and conformational change of XaxA and XaxB leading to the final pore complex.
Starting from the soluble monomers of XaxA and XaxB, the video focuses on the conformational changes during dimerization and membrane insertion.
Video 3
Interaction between the head domains of XaxA and XaxB contributes to membrane insertion of XaxB.
The video highlights possible intermediate interactions and clashes during oligomerization and membrane insertion. It starts with XaxA and XaxB in their monomeric conformation in the position of the respective protomers in the pore. Then shifts to XaxA in its pore conformation, followed by a conformational change in XaxB leading to the final XaxAB in the pore complex. Dimerization of the soluble monomers would introduce a large sterical clash between the head domains. Therefore, the soluble monomer of XaxA must transition to its protomeric form prior to oligomerization. The remaining smaller sterical clash of XaxA with the loop between helices αD, αG in the head domain of XaxB probably destabilizes its conformation and activates XaxB for membrane insertion.
Tables
Table 1
Data collection and refinement statistics.
https://doi.org/10.7554/eLife.38017.010| XaxA | XaxB | ||
|---|---|---|---|
| Data collection | |||
| Wavelength (Å) | SLS PETRA | 2.07505 1.8233 | 0.97793 |
| Resolution range (Å) | 44.48–2.5 (2.589–2.5) | 48.15–3.4 (3.521–3.4) | |
| Space group | P 21 21 21 | P 21 21 21 | |
| Cell dimensions a, b, c (Å) | 67.27 90.83 153.03 | 88.7 99.41 194.15 | |
| α, β, γ (°) | 90 90 90 | 90 90 90 | |
| Molecule no. in AU | 2 | 4 | |
| Total reflections | 996,585 (92,922) | 961,813 (91,076) | |
| Unique reflections | 33,174 (3,258) | 24,297 (2,378) | |
| Multiplicity | 30.0 (28.5) | 39.6 (38.3) | |
| Completeness (%) | 99.91 (99.94) | 99.91 (99.96) | |
| Mean I/σ(I) | 25.11 (2.38) | 14.23 (0.82) | |
| Wilson B-factor | 58.45 | 137.29 | |
| R-merge | 0.1055 (1.722) | 0.2846 (6.285) | |
| R-meas | 0.1073 (1.753) | 0.2883 (6.369) | |
| CC1/2 | 1 (0.872) | 0.999 (0.493) | |
| CC* | 1 (0.965) | 1 (0.813) | |
| Refinement | |||
| Reflections used in refinement | 33,167 (3,257) | 24,289 (2377) | |
| Reflections used for R-free | 1659 (173) | 1215 (119) | |
| Rwork/Rfree (%) | 23.84/28.57 (35.19/42.56) | 26.38/30.52 (37.37/40.11) | |
| CC(work)/CC(free) | 0.958/0.943 (0.786/0.715) | 0.957/0.941 (0.613/0.442) | |
| Average B-factor (Å2) | 77.47 | 142.42 | |
| No. atoms in AU | 5373 | 10,624 | |
| Macromolecules | 5348 | 10,624 | |
| Solvent | 249 | ||
| Protein residues | 678 | 1329 | |
| r.m.s. deviations: | |||
| RMS (bonds) | 0.004 | 0.004 | |
| RMS (angles) | 0.87 | 0.72 | |
| Ramachandran favored (%) | 99.4 | 97.50 | |
| Ramachandran allowed (%) | 0.6 | 2.20 | |
| Ramachandran outliers (%) | 0.00 | 0.3 | |
| Rotamer outliers (%) | 1.32 | 3.82 | |
| Clashscore | 3.69 | 3.99 | |
-
Values for the highest resolution shell are inside brackets.
*For XaxA multiple datasets were collected from one crystal at the PXIII-X06DA beamline at the Swiss Light Source and at the DESY PETRA III beamline P11.
Table 2
EM data collection and refinement statistics of XaxAB.
https://doi.org/10.7554/eLife.38017.022| Data collection | |
|---|---|
| Microscope | Titan Krios (Cs corrected, XFEG) |
| Voltage (kV) | 300 |
| Camera | Falcon III (counting mode) |
| Magnification | 59 k |
| Pixel size (Å) | 1.11 |
| Number of frames | 180 |
| Total electron dose (e-/Å2) | 44 |
| Exposure time (s) | 60 |
| Defocus range (µm) | 1.0–2.6 |
| Number of particles | 139,286 |
| Atomic Model Composition | |
| Non-Hydrogen atoms | 72,436 |
| Protein Residues | 9139 |
| Refinement (Phenix) | |
| RMSD bond | 0.006 |
| RMSD angle | 0.98 |
| Model to map fit, CC mask | 0.85 |
| Resolution (FSC@0.143, Å) | 4.0 |
| Map sharpening B-Factor (Å2) | −170 |
| Validation | |
| Clashscore, all atoms | 4.68 |
| Poor Rotamers (%) | 0.92 |
| Favored rotamers (%) | 94.56 |
| Ramachandran outliers (%) | 0 |
| Ramachandran favored (%) | 97.42 |
| Molprobity score | 1.35 |
Key resources table
| Reagent type (species) or resource | Designation | Source or reference | Identifiers | Additional information |
|---|---|---|---|---|
| Gene (Xenorhabdus nematophila) | XaxA | N/A | NCBI Reference sequence: FN667742.1 | Genes ordered from GenScript |
| Gene (X. nematophila) | XaxB | N/A | NCBI Reference sequence: FN667742.1 | Genes ordered from GenScript |
| Cell line (Escherichia coli) | BL21-CodonPlus (DE3)-RIPL | Agilent Technologies | Agilent: 230280–41 | |
| Recombinant DNA reagent | pET19b | Novagen | Merck: 69677 | |
| Chemical compound, drug | Cymal-6 | Anatrace | Anatrace: 228579-27-9 | |
| Chemical compound, drug | Amphipol A8-35 | Anatrace | Anatrace: 1423685-21-5 | |
| Software, algorithm | SPHIRE software package | Moriya et al. (2017) PMID: 28570515 | ||
| Software, algorithm | Gautomatch | N/A | http://www.mrc-lmb.cam.ac.uk/kzhang/ | |
| Software, algorithm | Phenix | Terwilliger et al. (2008) PMID: 18094468 | ||
| Software, algorithm | UCSF Chimera | Pettersen et al. (2004) PMID: 15264254 | ||
| Software, algorithm | hkl2map | Pape and Schneider, 2004 ISSN: 0021–8890 | ||
| Software, algorithm | Crank2 | Pannu et al. (2011) PMID: 21460451 |
Additional files
-
Transparent reporting form
- https://doi.org/10.7554/eLife.38017.035
Download links
A two-part list of links to download the article, or parts of the article, in various formats.
Downloads (link to download the article as PDF)
Open citations (links to open the citations from this article in various online reference manager services)
Cite this article (links to download the citations from this article in formats compatible with various reference manager tools)
Membrane insertion of α-xenorhabdolysin in near-atomic detail
eLife 7:e38017.
https://doi.org/10.7554/eLife.38017


