Cumulative mitochondrial activity correlates with ototoxin susceptibility in zebrafish mechanosensory hair cells
- University of Washington, United States
Figures
Figure 1 with 1 supplement
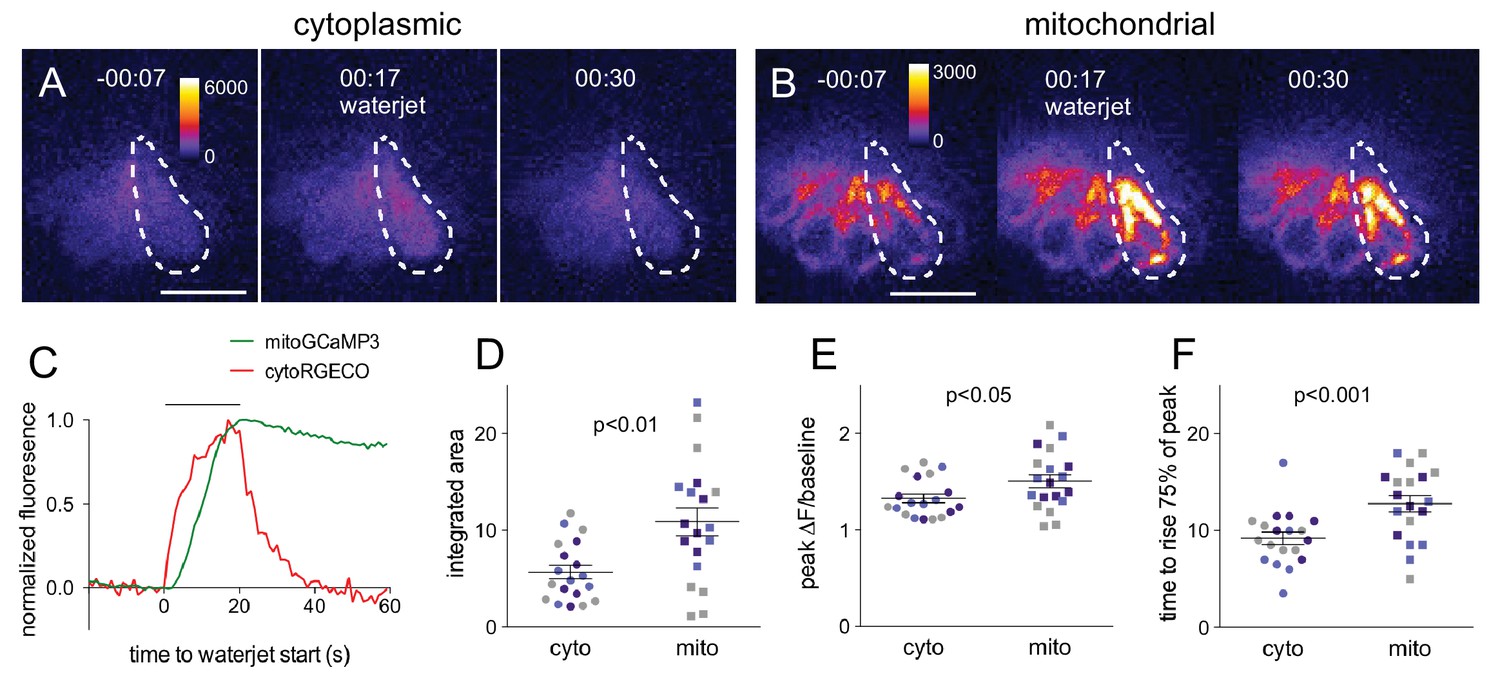
Mitochondrial Ca2+ increases in response to hair cell stimulation.
Frames from a time-lapse calcium imaging video acquired from Tg[myo6b:RGECO]vo10Tg fish (A) and Tg[myo6b:mitoGCaMP3]w119 fish (B) during waterjet stimulation at 10 Hz. For each condition, fluorescence is shown before, during, and after stimulation (left, middle, right, respectively). (C) Normalized fluorescence of the example cell outlined by the dotted line in A and B. Hair cells were imaged from a lateral view, as indicated in the schematic shown in Figure 1—figure supplement 1A. Summary data of the integrated area (D), peak fluorescence (E), and rise time (F) for the cytoplasmic and mitochondrial calcium signal. Colored points indicate matched values from the same experiment. Values for (D): cyto vs. mito: 5.6 ± 0.7 vs 11 ± 1.3; mean ± SE; n = 19 cells; (E): cyto vs. mito: 1.3 ± 0.04 vs 1.5 ± 0.06; mean ± SE; n = 21 cells; (F): cyto vs. mito: 8.9 ± 0.7 s vs 13 ± 0.9 s; mean ± SE; n = 19 vs 21 cells. Cells were analyzed from 10 different fish across three different experiments. Two-tailed unpaired Student’s t test was used to assess significance. Scale bar = 10 μm.
Figure 1—figure supplement 1
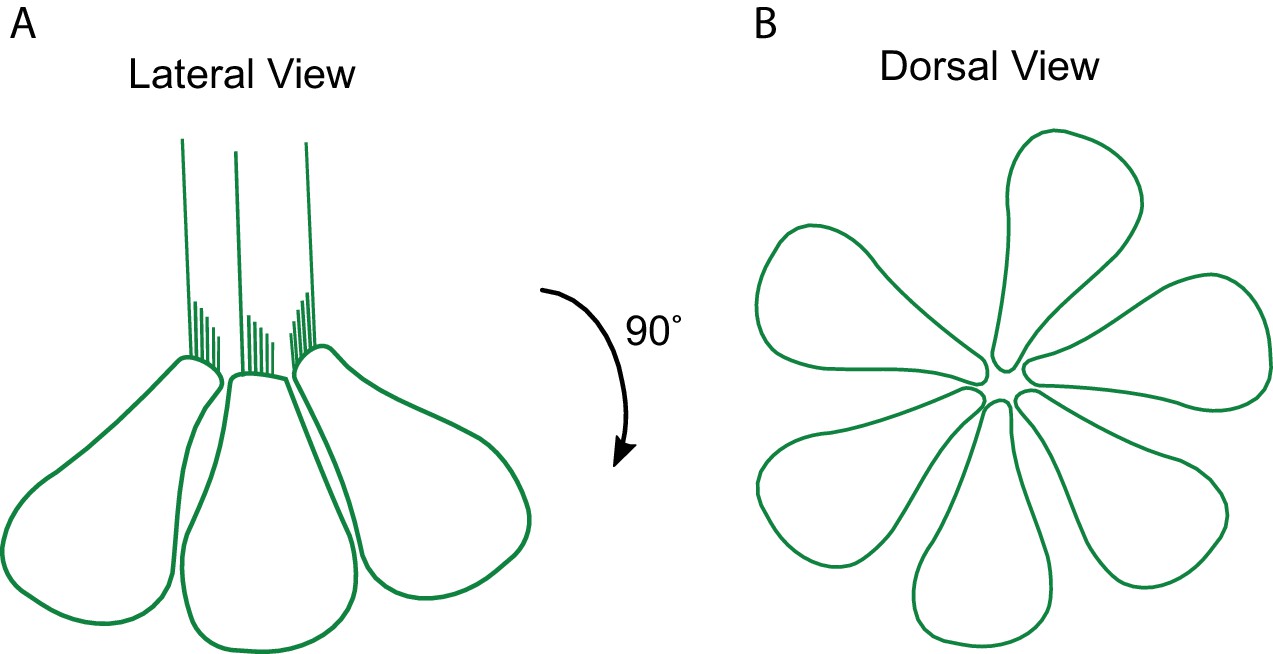
Orientation of imaging plane.
(A) For the waterjet experiments (shown in Figure 1), hair cells were imaged from a lateral view. (B) In all other experiments, hair cells were imaged dorsally to ventrally; thus, maximum projections are shown from a dorsal view.
Figure 2

Acute mitochondrial activity is reduced in the absence of MET.
(A, B) Maximum projections of hair cells from WT/Het and sputnik mutant siblings incubated in JC-1 dye. Hair cells were imaged from a dorsal view, as indicated in the schematic shown in Figure 1—figure supplement 1B. (C) Mean JC-1 fluorescence plotted as a ratio of red:green. WT/Het: 0.25 ± 0.24 n = 8 fish; Mutant: 0.05 ± 0.07 n = 8 fish; mean ratio ± SD. Mann-Whitney U test was used to assess significance. Value for each fish represents the mean of 3 neuromasts. Scale bar = 5 μm.
Figure 3
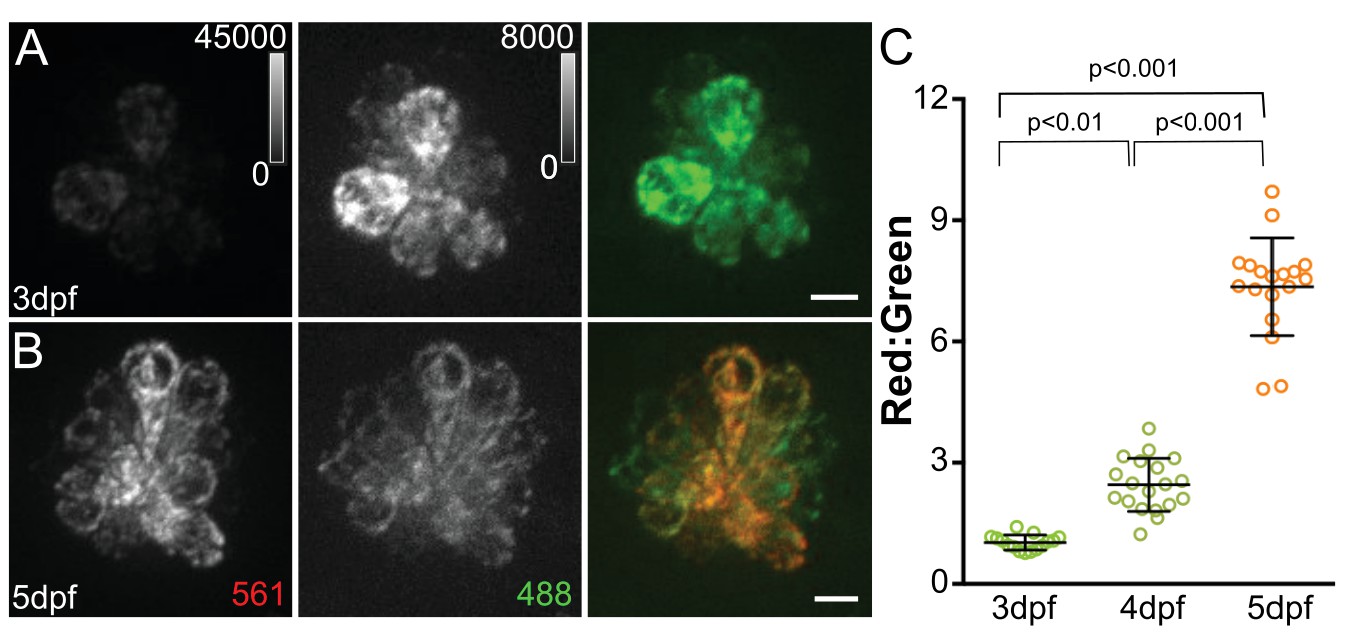
MitoTimer fluorescence ratio increases with neuromast maturation.
Maximum projections of hair cells from Tg[myo6b:mitoTimer]w208 fish at 3dpf (A) and 5dpf (B). (C) Mean mitoTimer fluorescence plotted as ratio of red:green at 3, 4, and 5dpf. 3dpf: 1.03 ± 0.05, 4dpf: 2.47 ± 0.66, 5dpf: 7.58 ± 1.2; mean ratio ±SD; n = 15–18 fish. Significance was analyzed by Kruskal-Wallis test with Dunn’s post-test. Value for each fish represents the mean of 2–3 neuromasts. Scale bar = 5 μm.
Figure 4 with 2 supplements
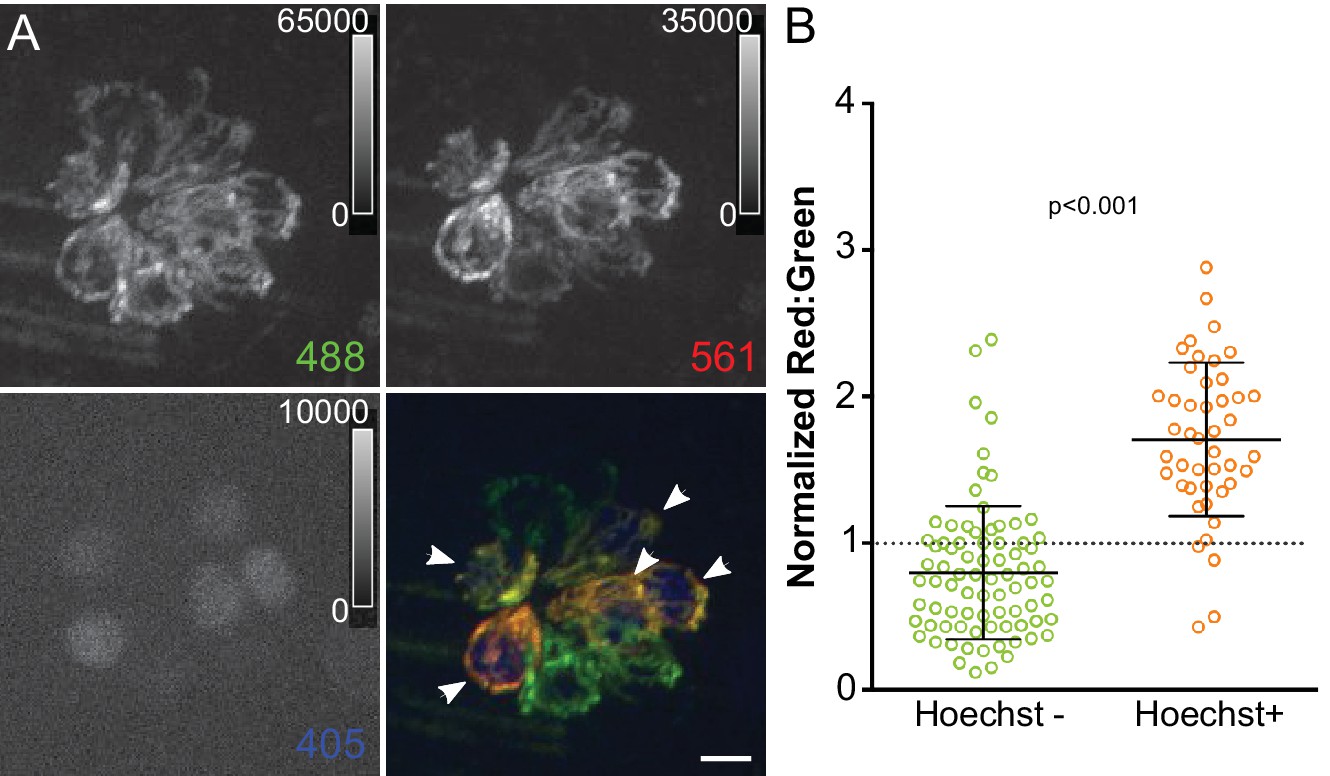
Mitochondrial oxidation corresponds with hair cell age and mechanotransduction activity.
(A) Maximum projection of mitoTimer expressing hair cells co-labeled with Hoechst. Hair cells were imaged at 4dpf, 24 hr after Hoechst treatment. Arrowheads mark Hoechst-positive cells. (B) mitoTimer fluorescence ratio for cells that are positive for Hoechst staining compared to Hoechst negative cells. mitoTimer ratios are normalized to the median, which is indicated by the dotted line. Hoechst positive: 1.71 ± 0.52, n = 45 cells; Hoechst negative: 0.80 ± 0.45, n = 80 cells; mean ratio (normalized) ±SD; five fish, three neuromasts per fish. Mann-Whitney U test was used to assess significance. Scale bar = 5 μm.
Figure 4—figure supplement 1
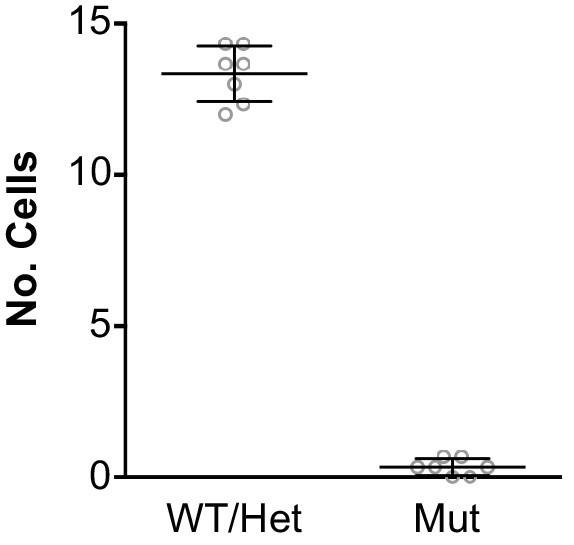
Hoechst nuclear labeling is MET-dependent.
Mean number of Hoechst-positive hair cells per neuromast in age-matched WTHet and sputnik mutant siblings. WTHet: 13.3 ± 0.92; Mut: 0.33 ± 0.27; mean ±SD; n = 7 fish per group; Mann-Whitney U test p = 0006. Values for each fish represent the mean of 3 neuromasts. Hair cells were imaged at 5dpf, just following Hoechst treatment. The lack of labeling in mutant hair cell suggests that Hoechst nuclear labeling is MET-dependent.
Figure 4—figure supplement 2

Hoechst incubation does not affect mitoTimer ratio compared to control.
Mean mitoTimer fluorescence ratio with and without Hoechst incubation. Incubation: 1.51 ±. 093, n = 105 cells; No incubation: 1.48 ± 1.08, n = 119 cells; mean ratio ±SD; Mann-Whitney U test p = 0.34; five fish, three neuromasts per fish.
Figure 5 with 1 supplement
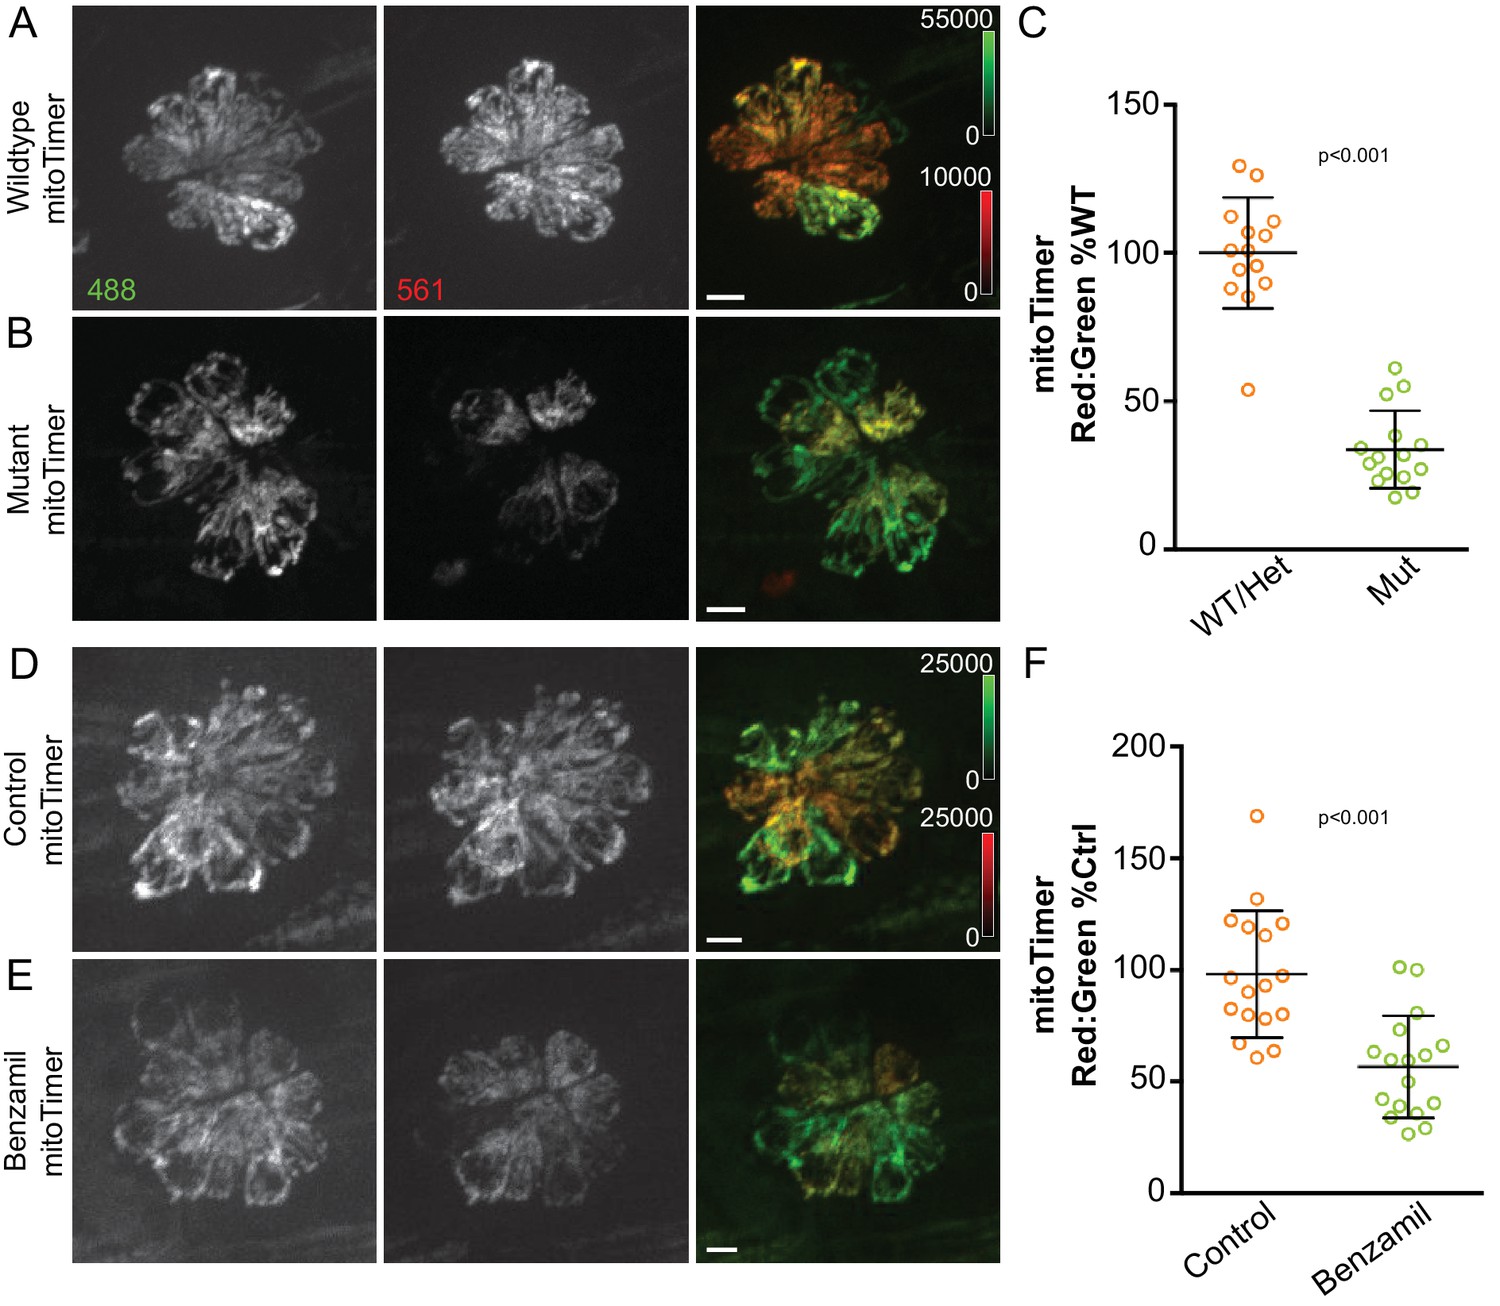
Mitochondrial activity depends on hair cell mechanotransduction.
(A, B) Maximum projections of hair cells from WT/Het and sputnik mutant siblings crossed to Tg[myo6b:mitoTimer]w208. (C) mitoTimer mean fluorescence ratio for WT/Het and sputnik larvae. WT/Het: 100 ± 18.7, n = 14 fish; Mutant: 34 ± 13.1,15 mutant fish; mean (% WT/Het)±SD. Value for each fish represents the mean of 2–4 neuromasts. (D, E) Maximum projections of mitoTimer-expressing hair cells from control larvae and larvae incubated in 200 μM benzamil. (F) mitoTimer mean fluorescence ratio for larvae incubated in benzamil compared to DMSO control. Control: 100 ± 28.7; Treated: 56.6 ± 22.7, n = 17 fish per group; mean (% Control)±SD. Value for each fish represents the mean of 2–4 neuromasts. Mann-Whitney U test was used to assess significance. All larvae imaged at 5dpf. Scale bar = 5 μm.
Figure 5—figure supplement 1
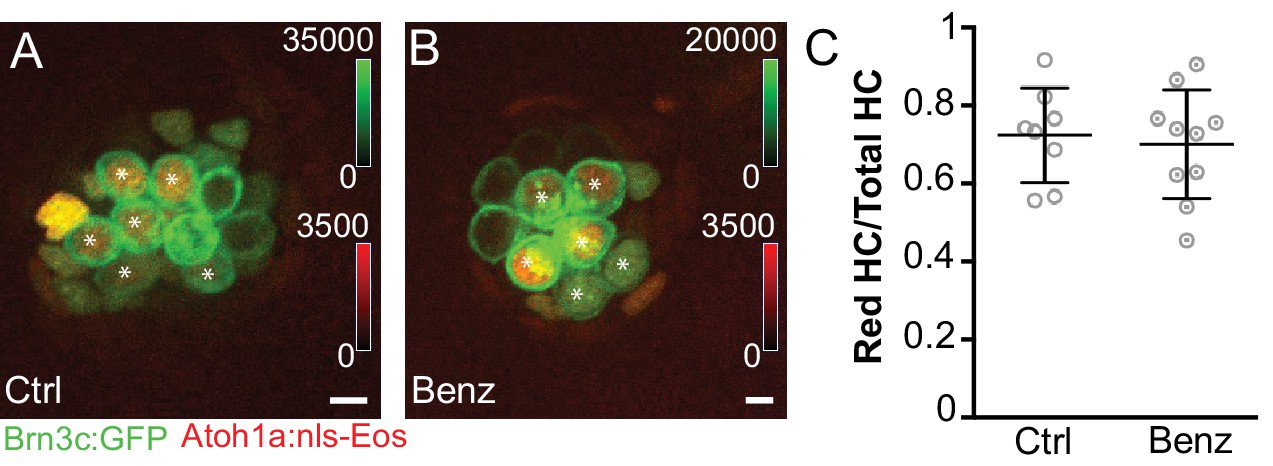
Reduced hair cell activity does not influence hair cell turnover.
Maximum projects of (A) DMSO control and (B) benzamil-treated fish expressing hair cell-specific membrane GFP (Tg[Pou4f3:gap43-GFP]) and photoconverted, nuclear localized EOS (Tg[Atoh1a:nls-Eos]w214) at 5dpf. (C) The ratio of red label-retaining hair cells to total number of hair cells per neuromast counted at 5dpf. There is no difference between control and treated groups, indicating that reduced MET does not lead to increased hair cell turnover. Control: 0.72 ± 0.12, n = 8 control fish; Treated: 0.70 ± 0.14, mean ratio ±SD, n = 10 fish; 2–3 neuromasts analyzed per fish; Mann-Whitney U test, p = 0.76. Asterisks indicate hair cells with label-retaining nuclei. Scale bar = 5 μm.
Figure 6
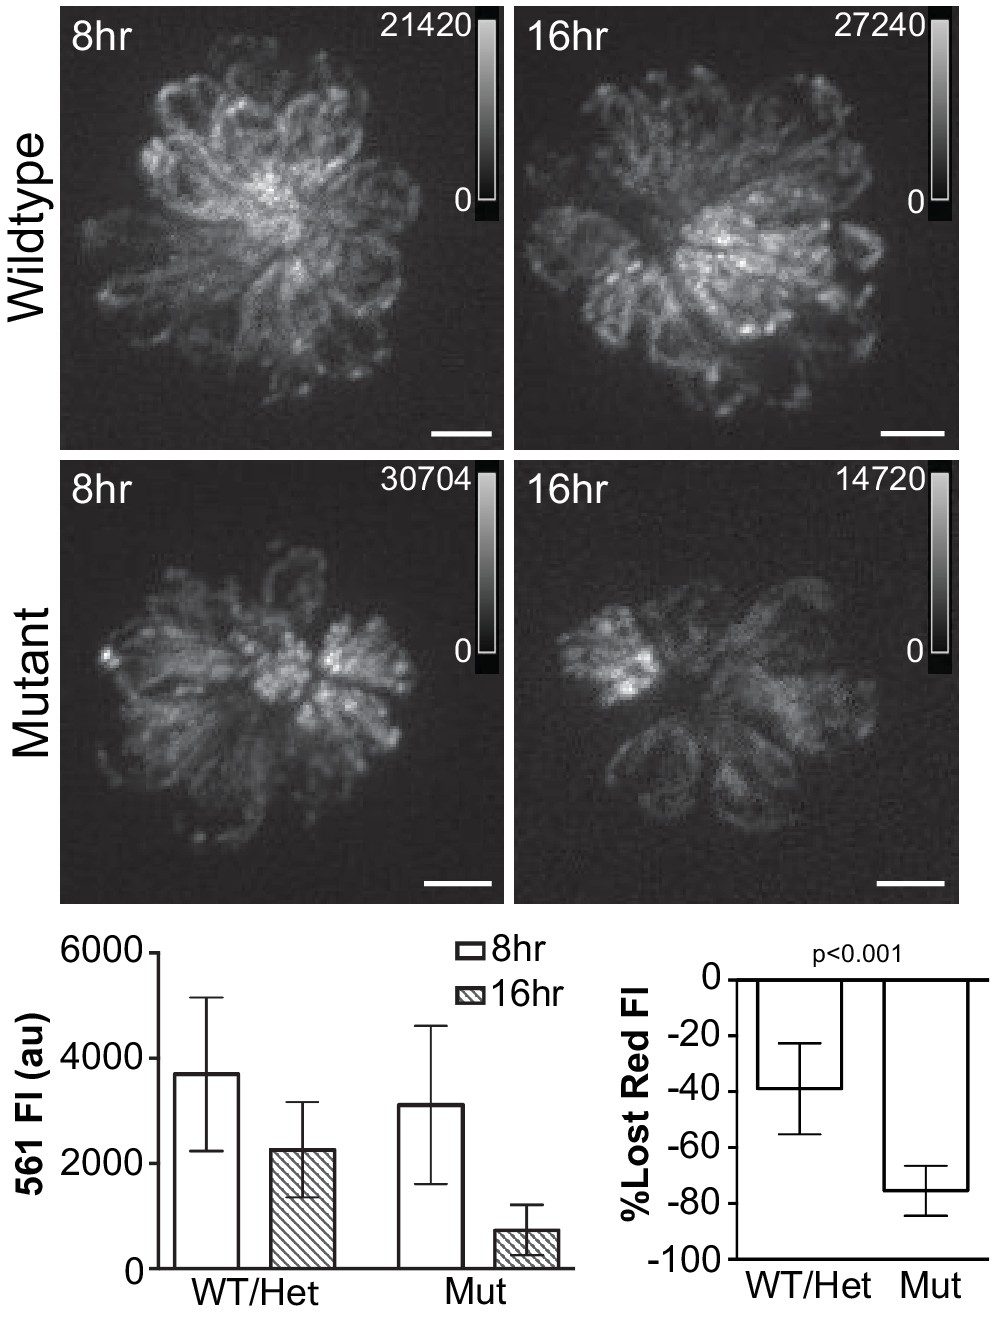
Hair cell activity influences mitochondrial turnover.
(A, B) Maximum projections of mitoEos red fluorescence 8 and 16 hr after photoconversion in wildtype and sputnik fish crossed to Tg[myo6b:mitoEos]w207. (C) Mean red fluorescence decreases over time in both wildtype and mutant fish. WT/Het: 8 hr, 3696 ± 1083; 16 hr, 2257 ± 604; Mutant: 8 hr, 2942 ± 878; 16 hr, 721 ± 262, mean ± SD. (D) The loss of red fluorescence is significantly greater in mutant animals. WT/Het: 38.9 ± 16.4; Mutant: 75.5 ± 8.9; mean (% lost)±SD. n = 9 fish per group. Value for each fish represents the mean of 3 neuromasts. Significance analyzed by Mann-Whitney U test. Scale bar = 5 μm.
Figure 7 with 4 supplements
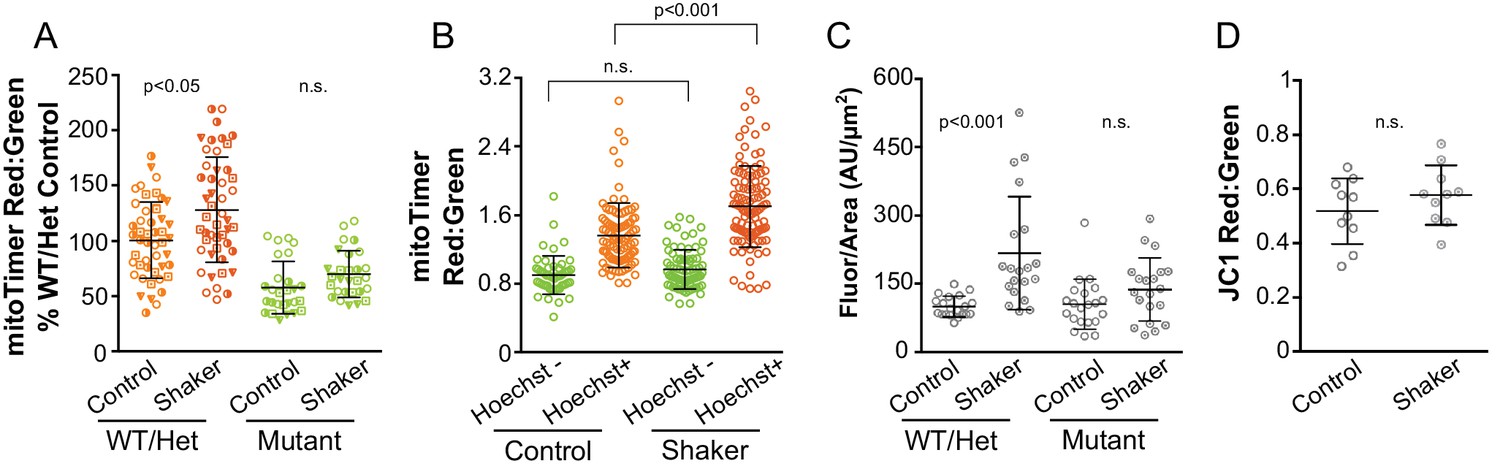
Sustained hair cell stimulation through orbital shaking increases cumulative mitochondrial activity and hair cell oxidation.
(A) mitoTimer fluorescence ratio measured from hair cells in WT/Het and sputnik mutants following 24 hr of orbital shaking. Symbols indicate matched values from the same experiment. WT/Het Control: 100 ± 34 n = 47 fish; WT/Het Orbital shaker: 128 ± 47 n = 48 fish; Mutant Control: 58 ± 24 n = 27 fish; Mutant Orbital shaker: 70 ± 21 n = 28 fish; mean (%WT/Het Control) ± SD. (B) mitoTimer fluorescence ratio for cells that are positive for Hoechst staining compared to Hoechst negative cells following 24 hr of orbital stimulation. Fluorescence was measured at 5dpf, 24 hr after Hoechst treatment and orbital rotation. Hoechst-positive Control: 1.36 ± 0.37, n = 94 cells; Hoechst-negative Control: 0.90 ± 0.22, n = 52 cells; Hoechst-positive Orbital Shaker: 1.70 ± 0.47, n = 105 cells; Hoechst-negative Orbital Shaker: 0.97 ± 0.23, n = 77 cells; mean ratio ± SD; 10 fish per group. (C) CellROX green fluorescence measured from hair cells in WT/Het and sputnik mutants following 24 hr of orbital shaking. WT/Het Control: 100 ± 23 n = 20 fish, WT/Het Orbital shaker: 217 ± 124 n = 20 fish, Mutant Control: 105 ± 55 n = 21 fish, Mutant Orbital shaker: 138 ± 58 n = 20 fish; mean (%WT/Het Control) ± SD. (D) JC-1 fluorescence ratio measured from hair cells following 24 hr of orbital stimulation. Control: 0.52 ± 0.12; Orbital Shaker: 0.58 ± 0.11; n = 10 fish per group; Mann-Whitney U test, p = 0.32. Values for each fish represent the mean of 2–3 neuromasts. Significance analyzed by Kruskal-Wallis test with Dunn’s post-test. All larvae imaged at 5dpf.
Figure 7—figure supplement 1
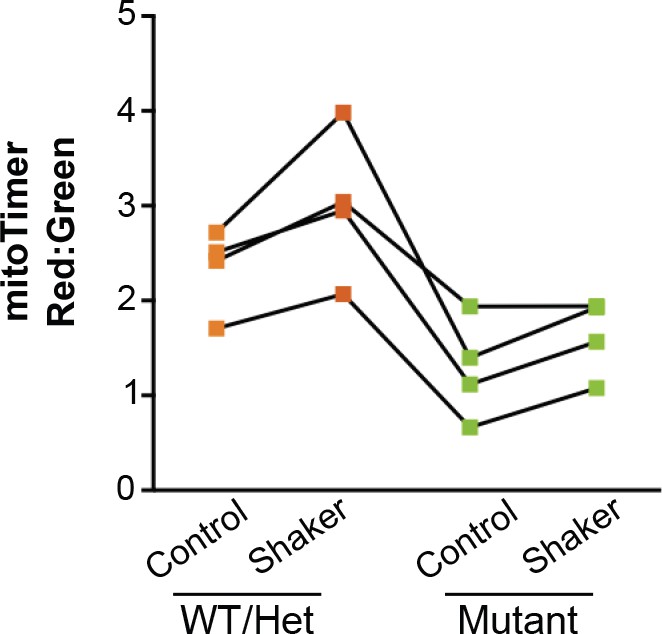
Mito Timer fluorescence ratio measured from hair cells in WT/Het and sputnik mutants following 24 hr of orbital shaking.
Graph shows the mean ratios, from four experiments, of the data presented as normalized values in Figure 7A. Each point represents the mean value of a group within each of four independent experiments. Groups for each experiment are connected by a black line.
Figure 7—figure supplement 2
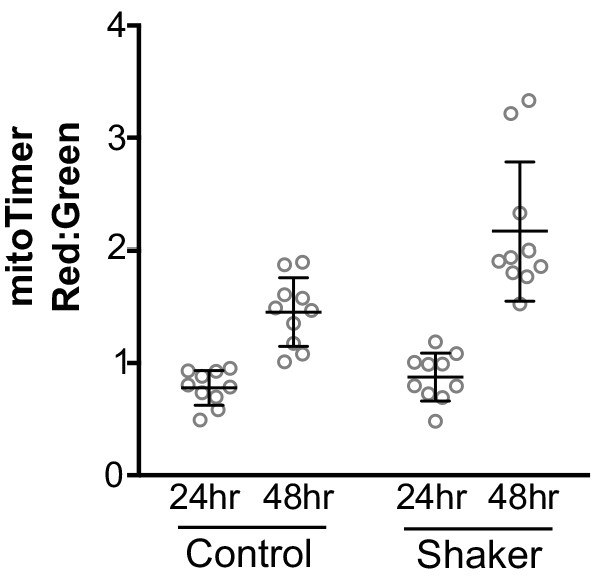
Changes in mitoTimer fluorescence ratios after orbital shaking is time-dependent.
mitoTimer fluorescence ratio measured from hair cells in after 24 or 48 hr of orbital shaking. 24 hr Control: 0.77 ± 0.15; 48 hr Control: 1.45 ± 0.31; 24 hr Orbital shaker: 0.88 ± 0.21; 48 hr Orbital shaker: 2.17 ± 0.62; mean ratio ±SD; n = 10 fish, 2–3 neuromasts analyzed per fish. Two-way ANOVA shows a significant difference with respect to shaker condition (p = 0.0013) and to time (p < 0.0001), and an interaction factor of p = 0.0119.
Figure 7—figure supplement 3
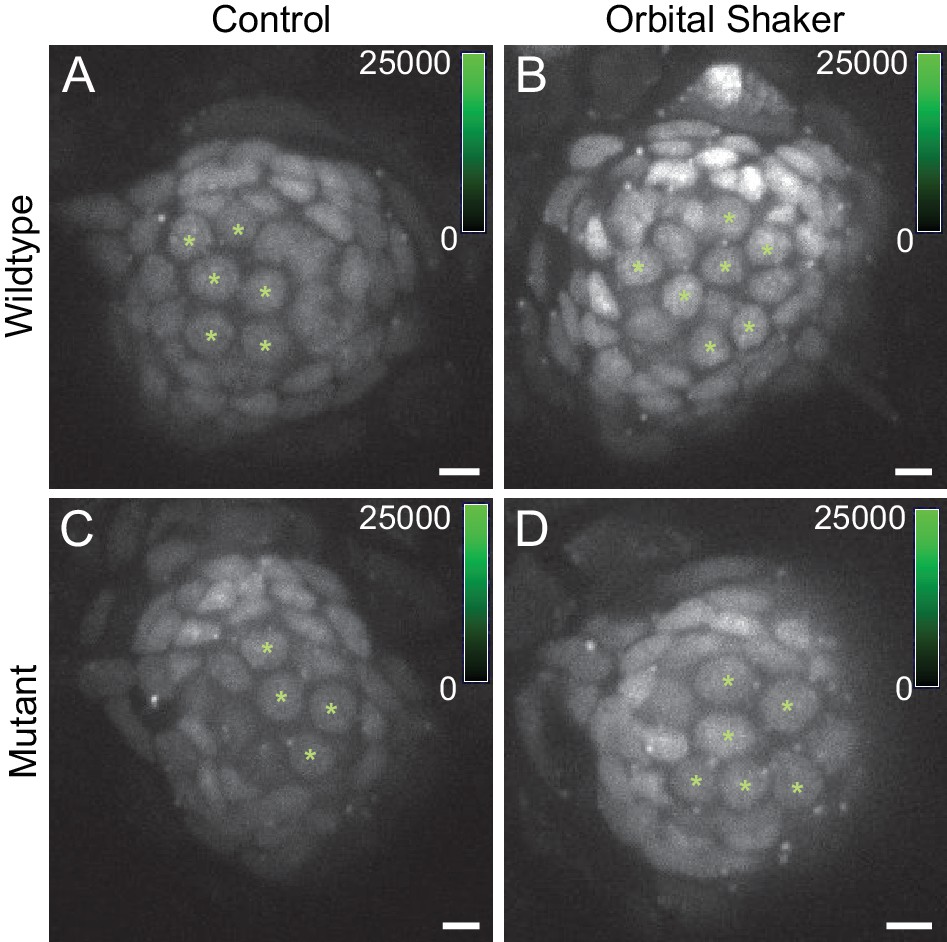
Hair cell oxidation increases with sustained stimulation via orbital shaking.
(A,C) CellROX green fluorescence labeling in WT/Het and sputnik mutants in the no-shaker control condition. (B,D) CellROX green fluorescence in WT/Het and sputnik mutants after 24 hr of orbital shaking. CellROX green labels hair cell and support cell nuclei. Asterisks indicate hair cells, identified based on nuclear shape and location. Scale bar = 5 μm.
Figure 7—figure supplement 4

Mitochondrial polarization does not shift with short-term hair cell stimulation.
Mean JC-1 fluorescence ratio measured following 90 min of orbital stimulation. Larvae were incubated in JC-1 just prior to orbital shaking. Control: 0.58 ± 0.17; Orbital Shaker: 0.57 ± 0.08; mean ratio ± SD, n = 10 fish per group, 2–3 neuromasts per fish; Mann-Whitney U test, p = 0.91).
Figure 8 with 1 supplement
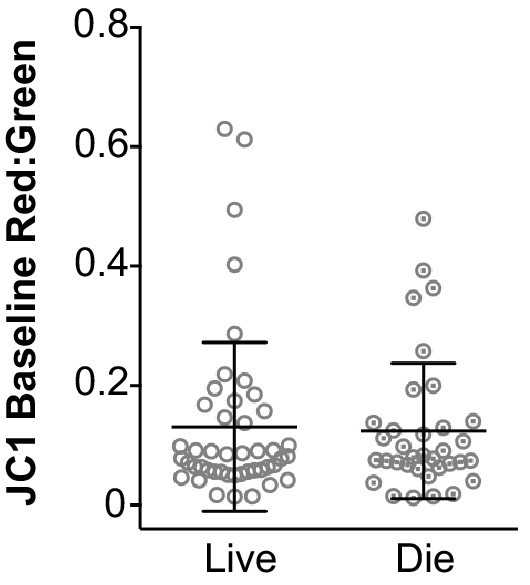
Acute mitochondrial activity does not correspond with likelihood of hair cell death in response to 50 μM neomycin exposure.
Baseline mean fluorescence ratio of JC-1 for living and dying cells. Living cells: 0.13 ± 0.14, n = 46; dying cells: 0.12 ± 0.11, n = 35; mean ratio ± SD; six fish, 2–3 neuromasts per fish; Mann-Whitney U test, p = 0.60. Fluorescence measurements were taken just prior to neomycin treatment.
Figure 8—figure supplement 1

Baseline calcium levels do not correspond with likelihood of hair cell death in response to 50 μM neomycin exposure.
Mean intensity of mitoGCaMP3 and cytoRGECO for living and dying cells. mitoGCaMP3 live: 1769 ± 794, n = 78 cells; mitoGCaMP3 die: 1701 ± 753, mean ± SD, n = 28 cells; two-tailed Student’s t-test, p = 0.69; RGECO live: 1248 ± 538, n = 46 cells; RGECO die: 1457 ± 459.7, mean ± SD, n = 35 cells; two-tailed Student’s t-test, p = 0.07; five fish, 2–3 neuromasts per fish. Fluorescence measurements taken just prior to neomycin addition.
Figure 9
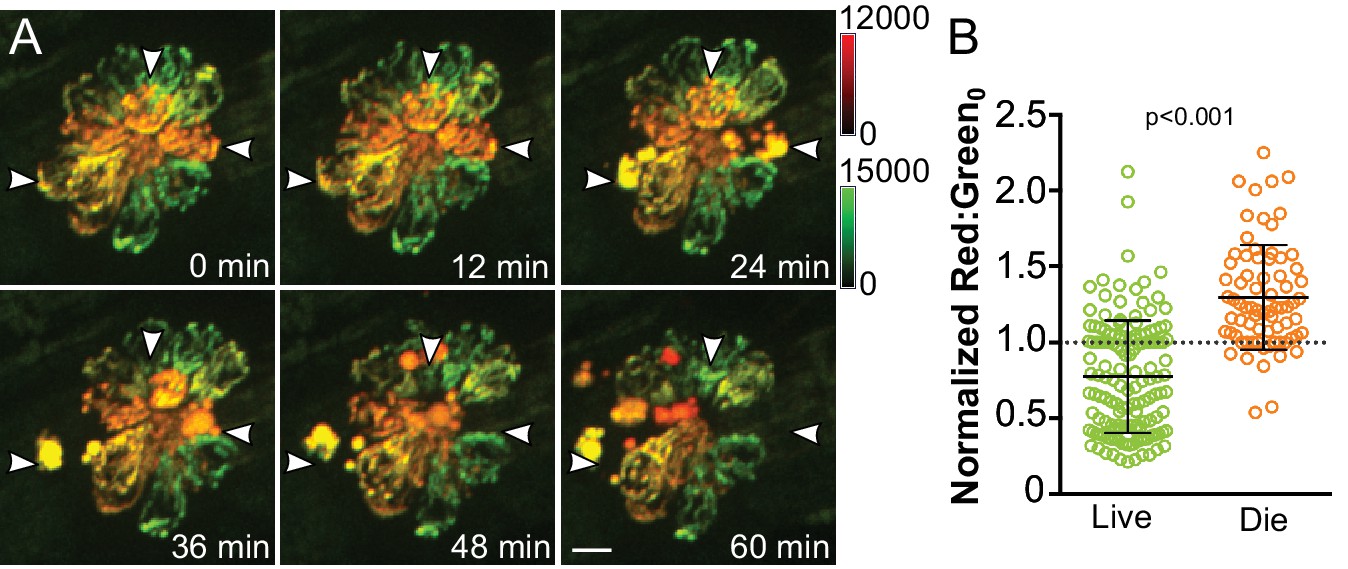
Cumulative mitochondrial activity reflects the likelihood of hair cell death following neomycin-induced damage.
(A) Frames from a time-lapse imaging video acquired from Tg[myo6b:mitoTimer]w208 fish treated with 50 μM neomycin. Images are maximum projections. Arrowheads indicate dying cells. (B) Baseline mitoTimer fluorescence ratio for living and dying cells following neomycin exposure. mitoTimer ratios are normalized to the median, which is indicated by the dotted line. Live: 0.77 ± 0.37, n = 142 cells; Die: 1.30 ± 0.34, n = 74 cells; mean ratio (normalized) ±SD; six fish, 2–3 neuromasts per fish. Mann-Whitney U test was used to assess significance. Scale bar = 5 μm.
Figure 10
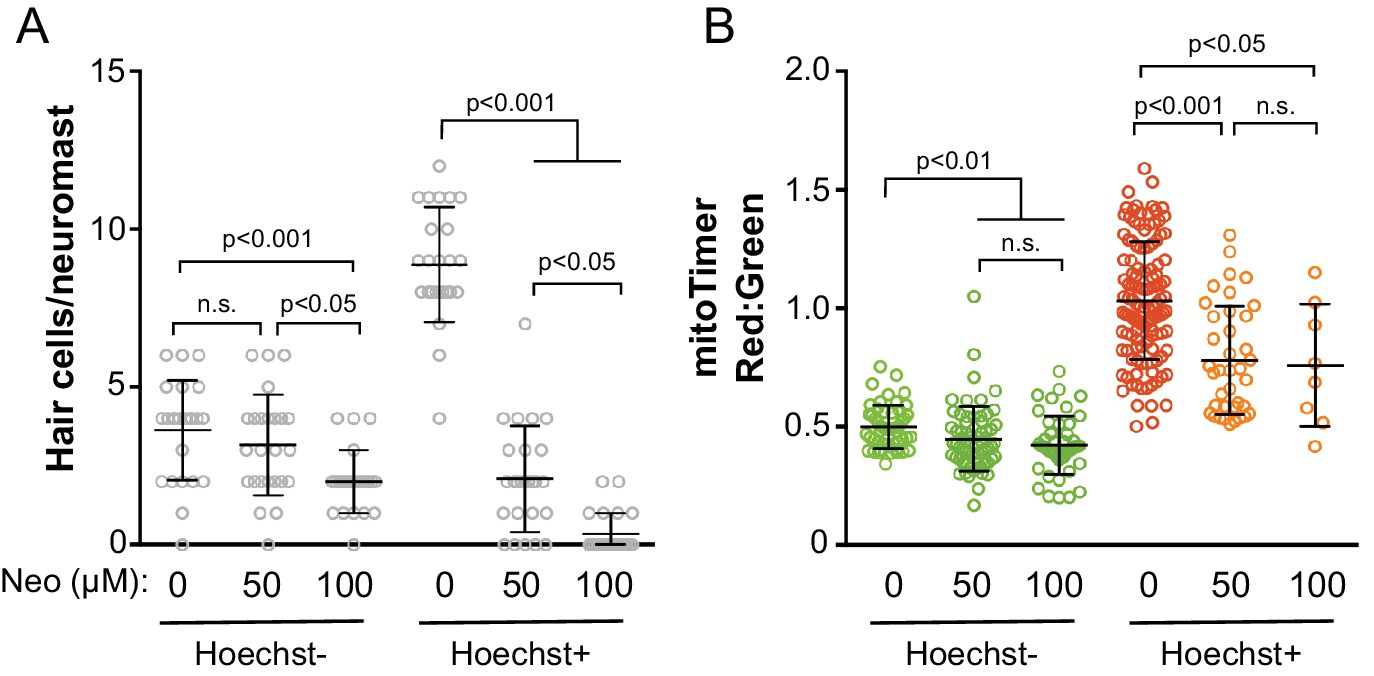
Older and historically more active hair cells exhibit greater susceptibility to neomycin.
(A) Cell counts of the remaining hair cells per neuromast following neomycin treatment. Control Hoechst-: 3.63 ± 1.58; 50 μM Neo Hoechst-: 3.16 ± 1.60; 100 μM Neo Hoechst-: 2.00 ± 1.00; Control Hoechst+: 8.88 ± 1.83; 50 μM Neo Hoechst+: 2.08 ± 1.68; 100 μM Neo Hoechst+: 0.35 ± 0.65; mean cells ± SD; n = 24 neuromasts Control, 25 neuromasts 50 μM Neo, and 23 neuromasts 100 μM Neo. (B) Mean mitoTimer ratios for surviving hair cells following neomycin treatment. Control Hoechst-: 0.50 ± 0.09, n = 52 cells; 50 μM Neo Hoechst-: 0.45 ± 0.14, n = 64 cells; 100 μM Neo Hoechst-: 0.42 ± 0.12, n = 46 cells; Control Hoechst+: 1.03 ± 0.25 n = 124 cells; 50 μM Neo Hoechst+: 0.78 ± 0.23, n = 38 cells; 100 μM Neo Hoechst+: 0.76 ± 0.25, n = 8 cells; mean ratio ±SD; nine fish per group. Significance analyzed by Kruskal-Wallis test with Dunn’s post-test.
Videos
Video 1
Dynamic changes in hair cell cytoplasmic and mitochondrial Ca2+ fluorescence with waterjet stimulation.
Time-lapse video of a lateral line neuromast acquired from Tg[myo6b:RGECO]vo10Tg (left) and Tg[myo6b:mitoGCaMP3]w119 (right) crossed fish. Hair cells were stimulated with a 10 Hz pressure wave, the timing of which is indicated (min:sec). Scale bar = 5 μm.
Video 2
Differential cell death after low-dose neomycin exposure among mitoTimer-expressing hair cells.
Time-lapse video of a lateral line neuromast from a Tg[myo6b:mitoTimer]w208 fish exposed to 50 μM neomycin. Still frames from this time-laspe video are shown in Figure 9. Scale bar = 5 μm.
Tables
Key resources table
| Reagent type (species) or resource | Designation | Source or reference | Identifiers | Additional information |
| Strain, strain background (Danio rerio) | mitoTimer | This paper | Tg(myosin6b:mitoTimer)w208; Gateway cloing and Tol2-mediated transgenesis. | |
| Strain, strain background (Danio rerio) | mitoEos | This paper | Tg(myosin6b:mitoEos)w207; Gateway cloing and Tol2-mediated transgenesis | |
| Strain, strain background (Danio rerio) | nlsEos | This paper | Tg(atoh1a:nls-Eos)w214; CRISPR Knock-In | |
| Strain, strain background (Danio rerio) | mitoGCaMP3 | PMID: 25031409 | ZFIN:ZDB-TGCONSTRCT-141008–1 | Tg(myosin6b:mitoGCaMP3)w119 |
| Strain, strain background (Danio rerio) | cytoRGECO | PMID: 25114259 | ZFIN:ZDB-TGCONSTRCT-150114–2 | Tg(myosin6b:R-GECO1)vo10Tg |
| Strain, strain background (Danio rerio) | Cdh23 mutant (sputnik) | PMID: 9491988 | ZFIN:ZDB-GENO-170526–2 | Cdh23tj264 mutant |
| Chemical compound, drug | Benzamil | Sigma-Aldrich | Sigma-Aldrich:B2417-50MG | |
| Chemical compound, drug | Hoechst 33258 | ThermoFisher | ThermoFisher:H3569 | |
| Software, algorithm | GraphPad Prism | GraphPad Software | www.graphpad.com | |
| Software, algorithm | Slidebook | Intelligent Imaging Innovations (3i) | www.intelligent-imaging.com | |
| Software, algorithm | Fiji | PMID: 22743772 | ||
| Software, algorithm | MATLAB | MathWorks | www.mathworks.com |
Additional files
-
Transparent reporting form
- https://doi.org/10.7554/eLife.38062.023
Download links
A two-part list of links to download the article, or parts of the article, in various formats.
Downloads (link to download the article as PDF)
Open citations (links to open the citations from this article in various online reference manager services)
Cite this article (links to download the citations from this article in formats compatible with various reference manager tools)
Cumulative mitochondrial activity correlates with ototoxin susceptibility in zebrafish mechanosensory hair cells
eLife 7:e38062.
https://doi.org/10.7554/eLife.38062


