Receptor-mediated dimerization of JAK2 FERM domains is required for JAK2 activation
- Genentech, Inc., United States
Figures
Figure 1 with 1 supplement
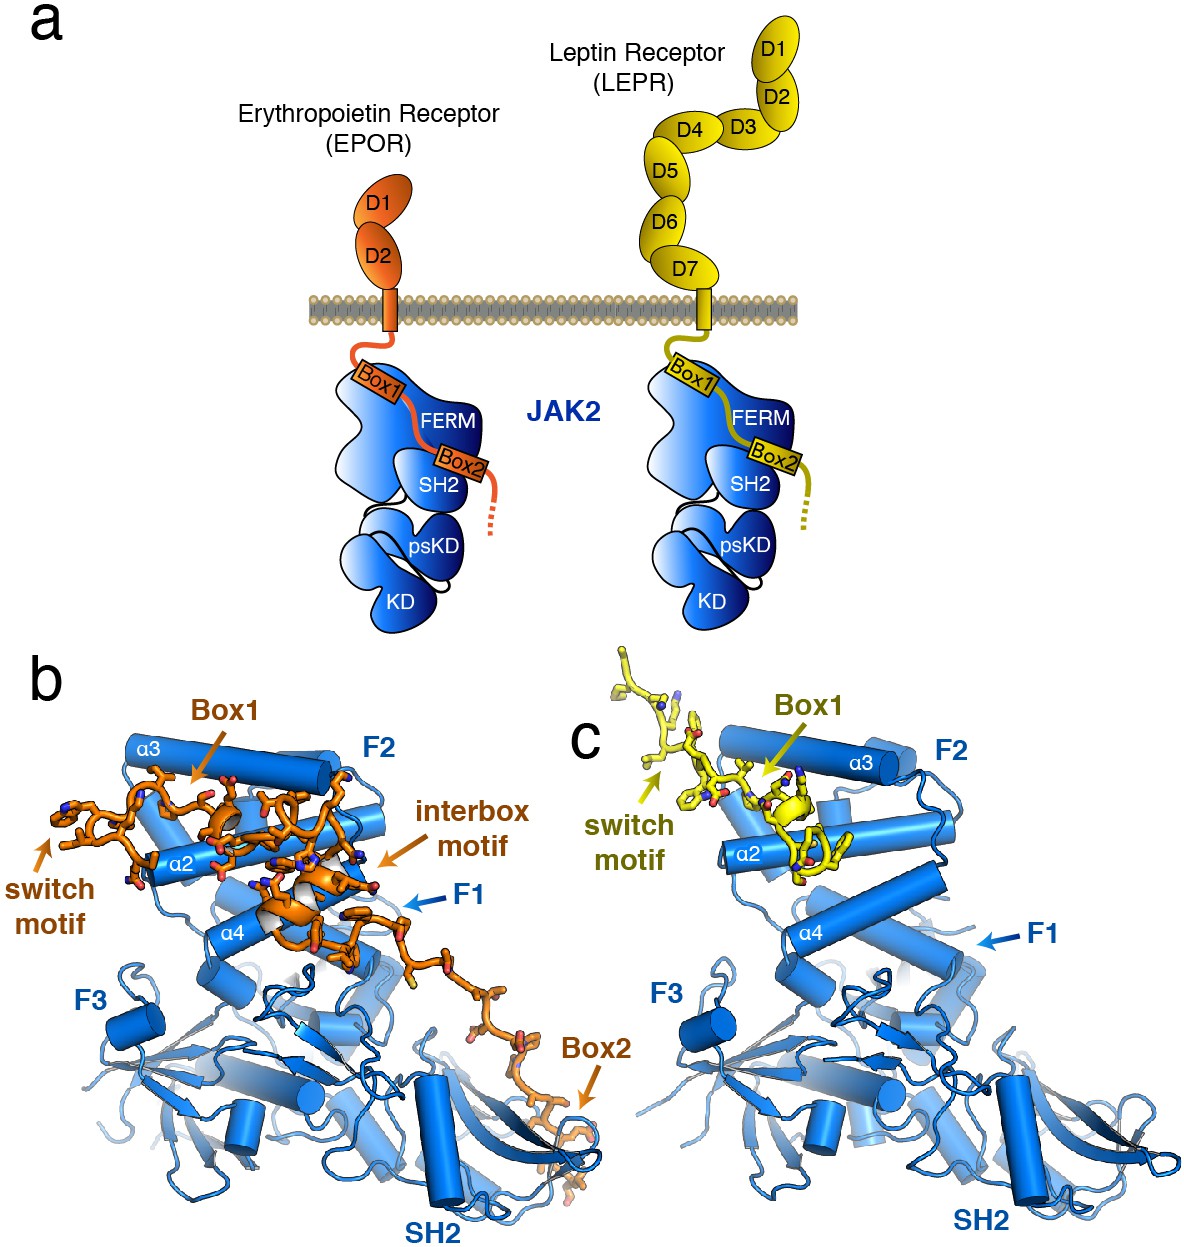
The structure of the JAK2 FERM–SH2 domain bound to EPOR and LEPR.
(a) Schematic representation of erythropoietin receptor (EPOR) and leptin receptor (LEPR) bound to JAK2. Each receptor binds to JAK2 via a box1 interaction with the FERM domain, and a box2 interaction with the SH2 domain. (b,c) The crystal structures of EPOR and LEPR bound to JAK2 at 2.65 and 2.83 Å respectively. (b) Cartoon representation of residues 279 to 335 of EPOR bound to JAK2 FERM–SH2. JAK2 is shown in blue, and EPOR shown in orange. (c) Cartoon representation of residues 866 to 885 of LEPR bound to JAK2. JAK2 is shown in blue, and LEPR shown in yellow.
Figure 1—figure supplement 1
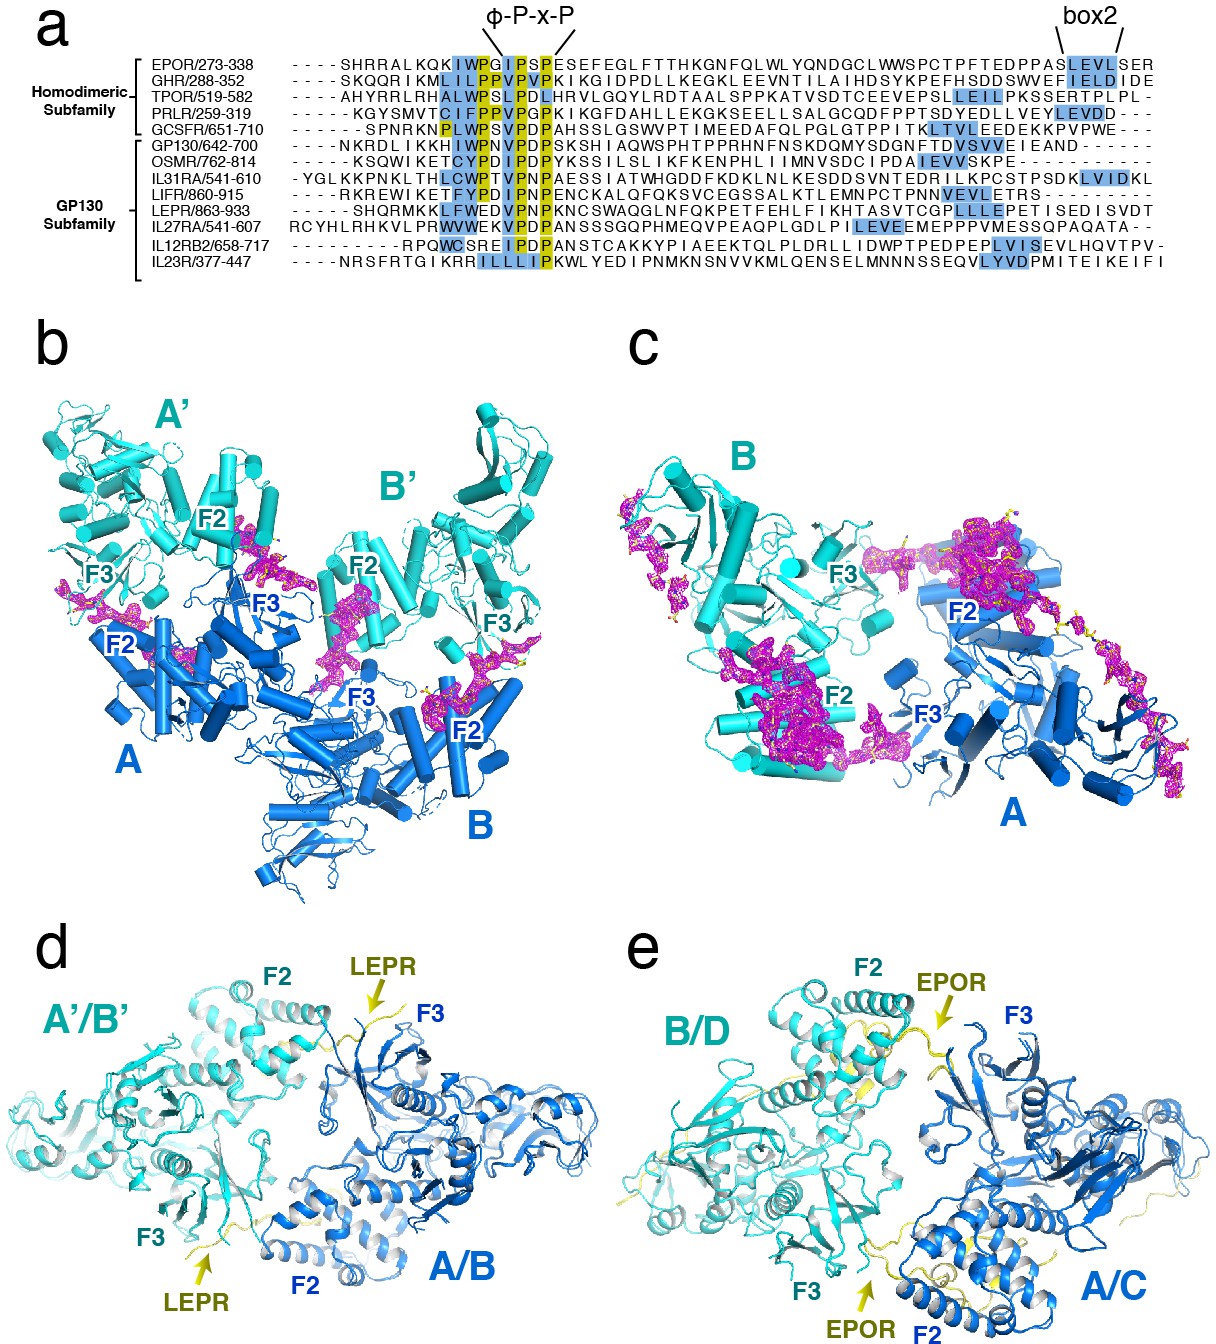
Sequence and electron density for JAK2 bound receptors EPOR and LEPR.
(a) Alignment (centered on box1 motif) of intracellular domains of cytokine receptors from the homodimeric/growth hormone and gp130 subfamilies. Sequences start just C-terminal from the transmembrane domain, and end just after the predicted box2 motif. (b) Cartoon depiction of the JAK2/LEPR structure, showing the A and B chains (blue) dimerized with symmetry-related chains A’ and B’ (teal). Electron density for LEPR (contoured at 1.0σ) is shown in magenta. (c) Cartoon depiction of JAK2/EPOR structure, showing the dimer composed of the A chain (blue) and B chain (teal). In the JAK2/EPOR assymetric unit, there is also a second dimer (C and D chains) that is not shown for clarity. Electron density for EPOR (contoured at 1.0σ) is shown in magenta. (d) Alignment of the JAK2/LEPR A-A’ and B-B’ dimers. The A and B chains were aligned to generate the figure. (e) Alignment of the JAK2/EPOR A-B and C-D (chains are blue and teal, respectively) dimers. The A and C chains were aligned to generate the figure.
Figure 2 with 1 supplement
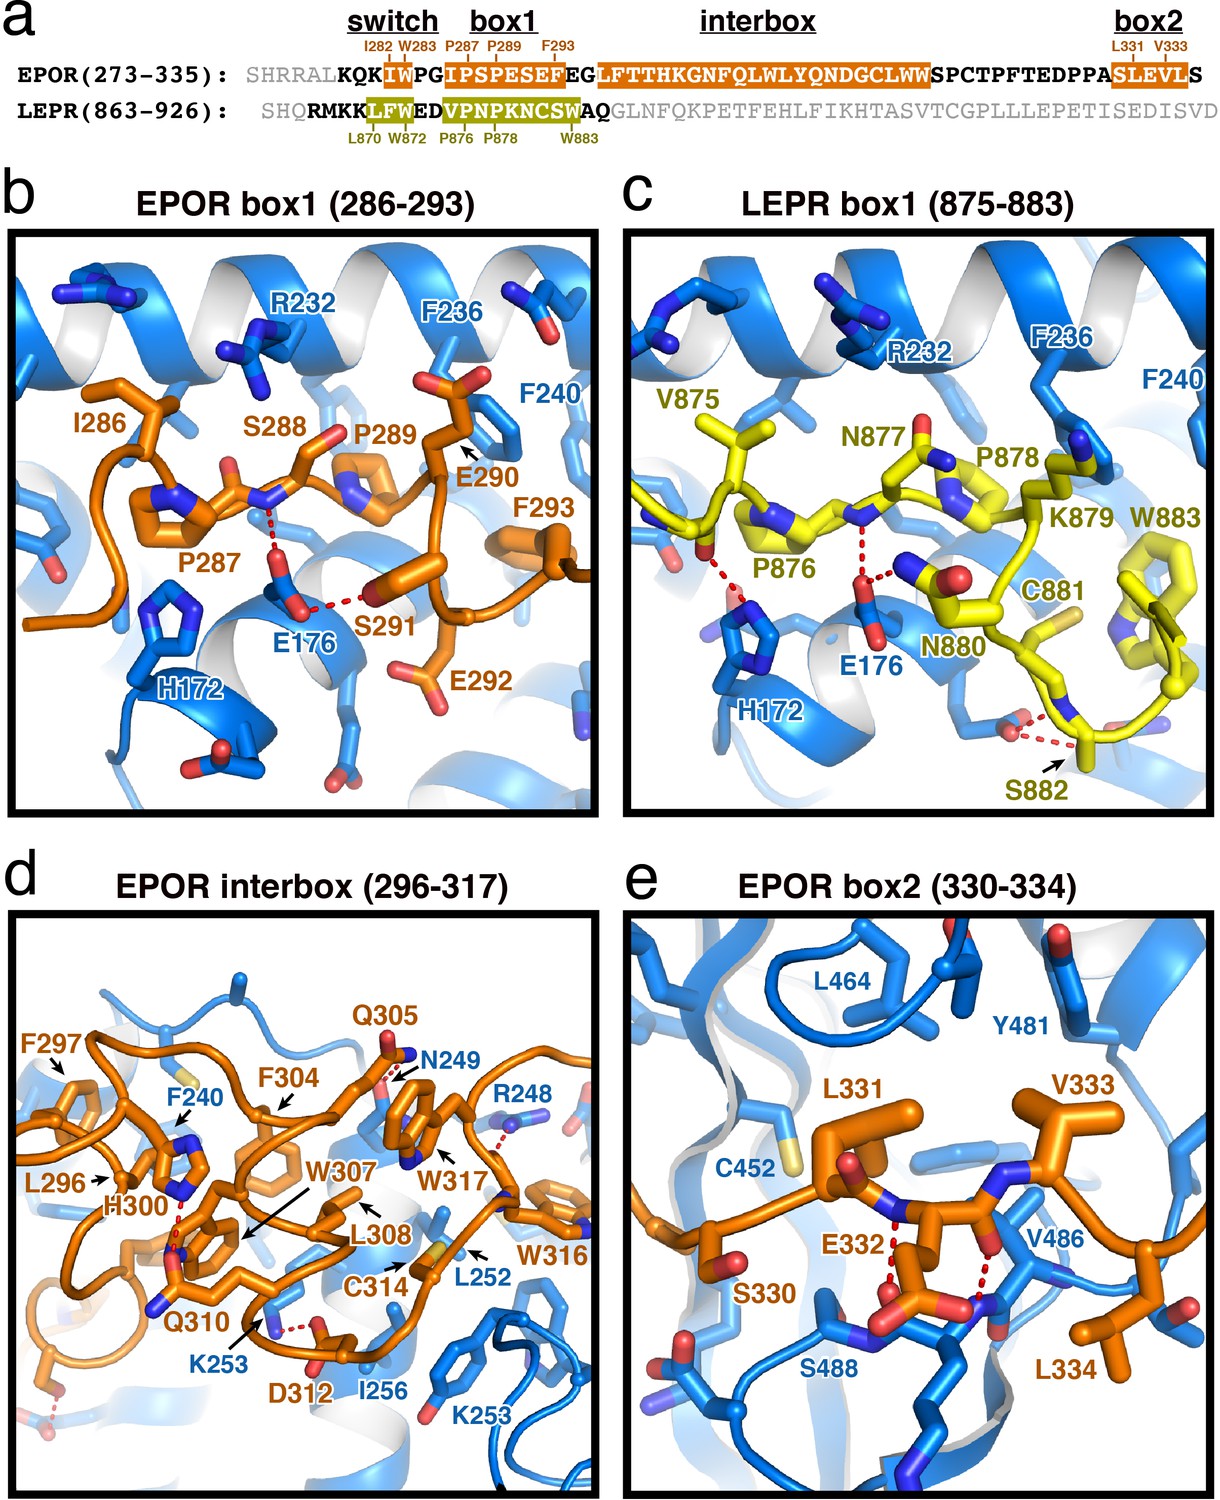
EPOR and LEPR interactions with JAK2.
(a) Alignment of the intracellular receptor sequences of human EPOR and LEPR that interact with JAK2. Sequences begin at the first residue after termination of the transmembrane domain. Sequences were aligned using the φ-Pro-X-Pro motif as an anchor sequence. (b–e) Detailed views of interactions between JAK2 and (b) EPOR box1, (c) LEPR box1, (d) EPOR interbox region, and (e) EPOR box2. EPOR and LEPR are colored in orange and yellow, respectively, with amino acid side chains shown as sticks. JAK2 is colored blue, with amino acid side chains shown as sticks. Key residues are labeled for reference.
Figure 2—figure supplement 1
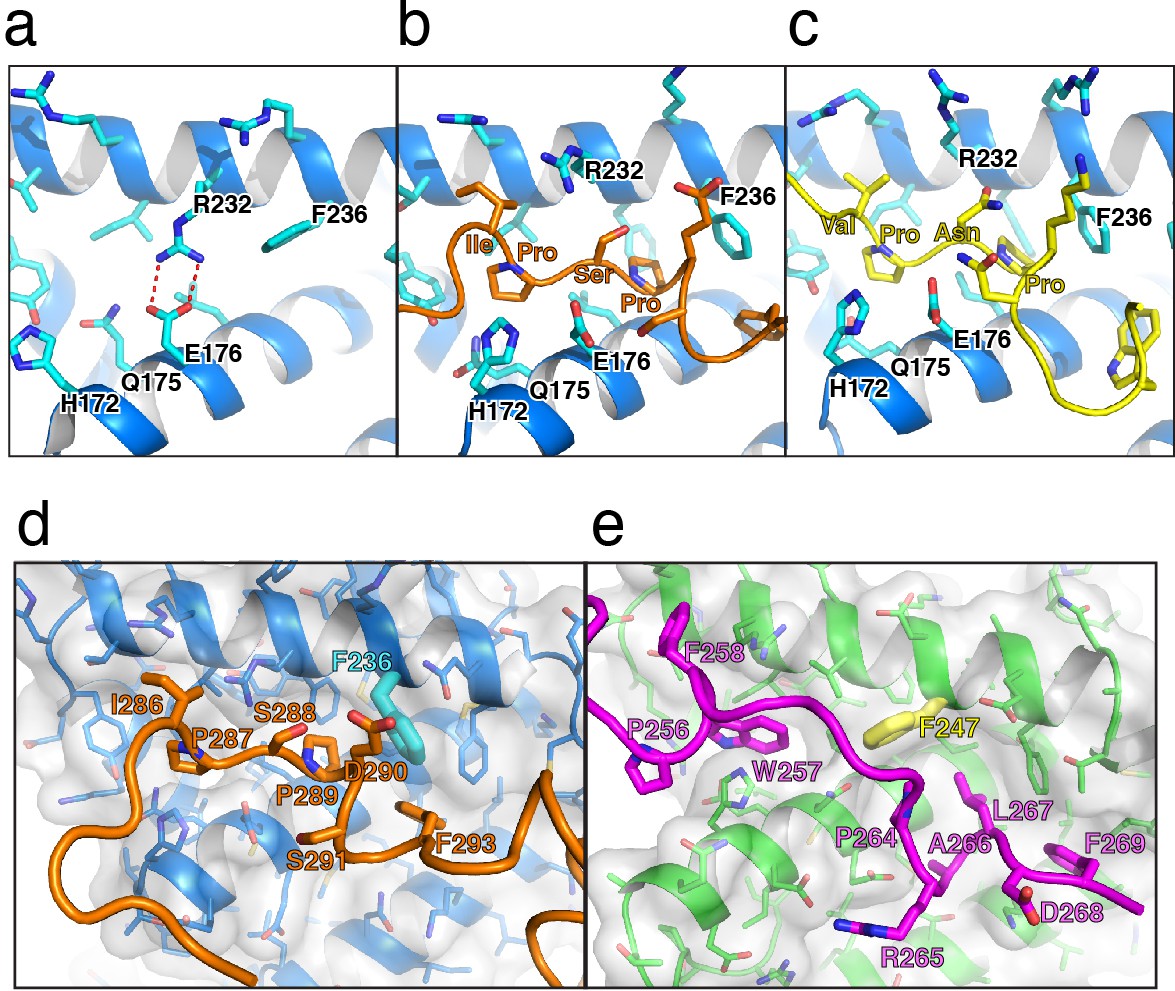
Structural analysis of receptor box1 interactions.
(a–c) Cartoon models comparing the box1-binding sites in the (a) apo JAK2 (PDB 4Z32), (b) JAK2/EPOR, and (c) JAK2/LEPR structures, all shown from the same perspective. The JAK2 cartoon model is shown in dark blue, with key JAK2 residues are shown as sticks in teal. EPOR is shown in orange, and LEPR is shown in yellow. (d–e) Cartoon models comparing the (d) JAK2/EPOR box1 interaction to the (e) JAK1/IFNLR1 box1 interaction (PDB 5IXD). JAK2 is shown in blue with grey transparent surface displayed, with EPOR shown in orange. JAK1 is shown in green with grey transparent surface displayed, and IFNLR1 shown in magenta. Key receptor and JAK residues are labeled and shown as stick models. JAK2 F236 and JAK1 F247 are highlighted.
Figure 3 with 1 supplement
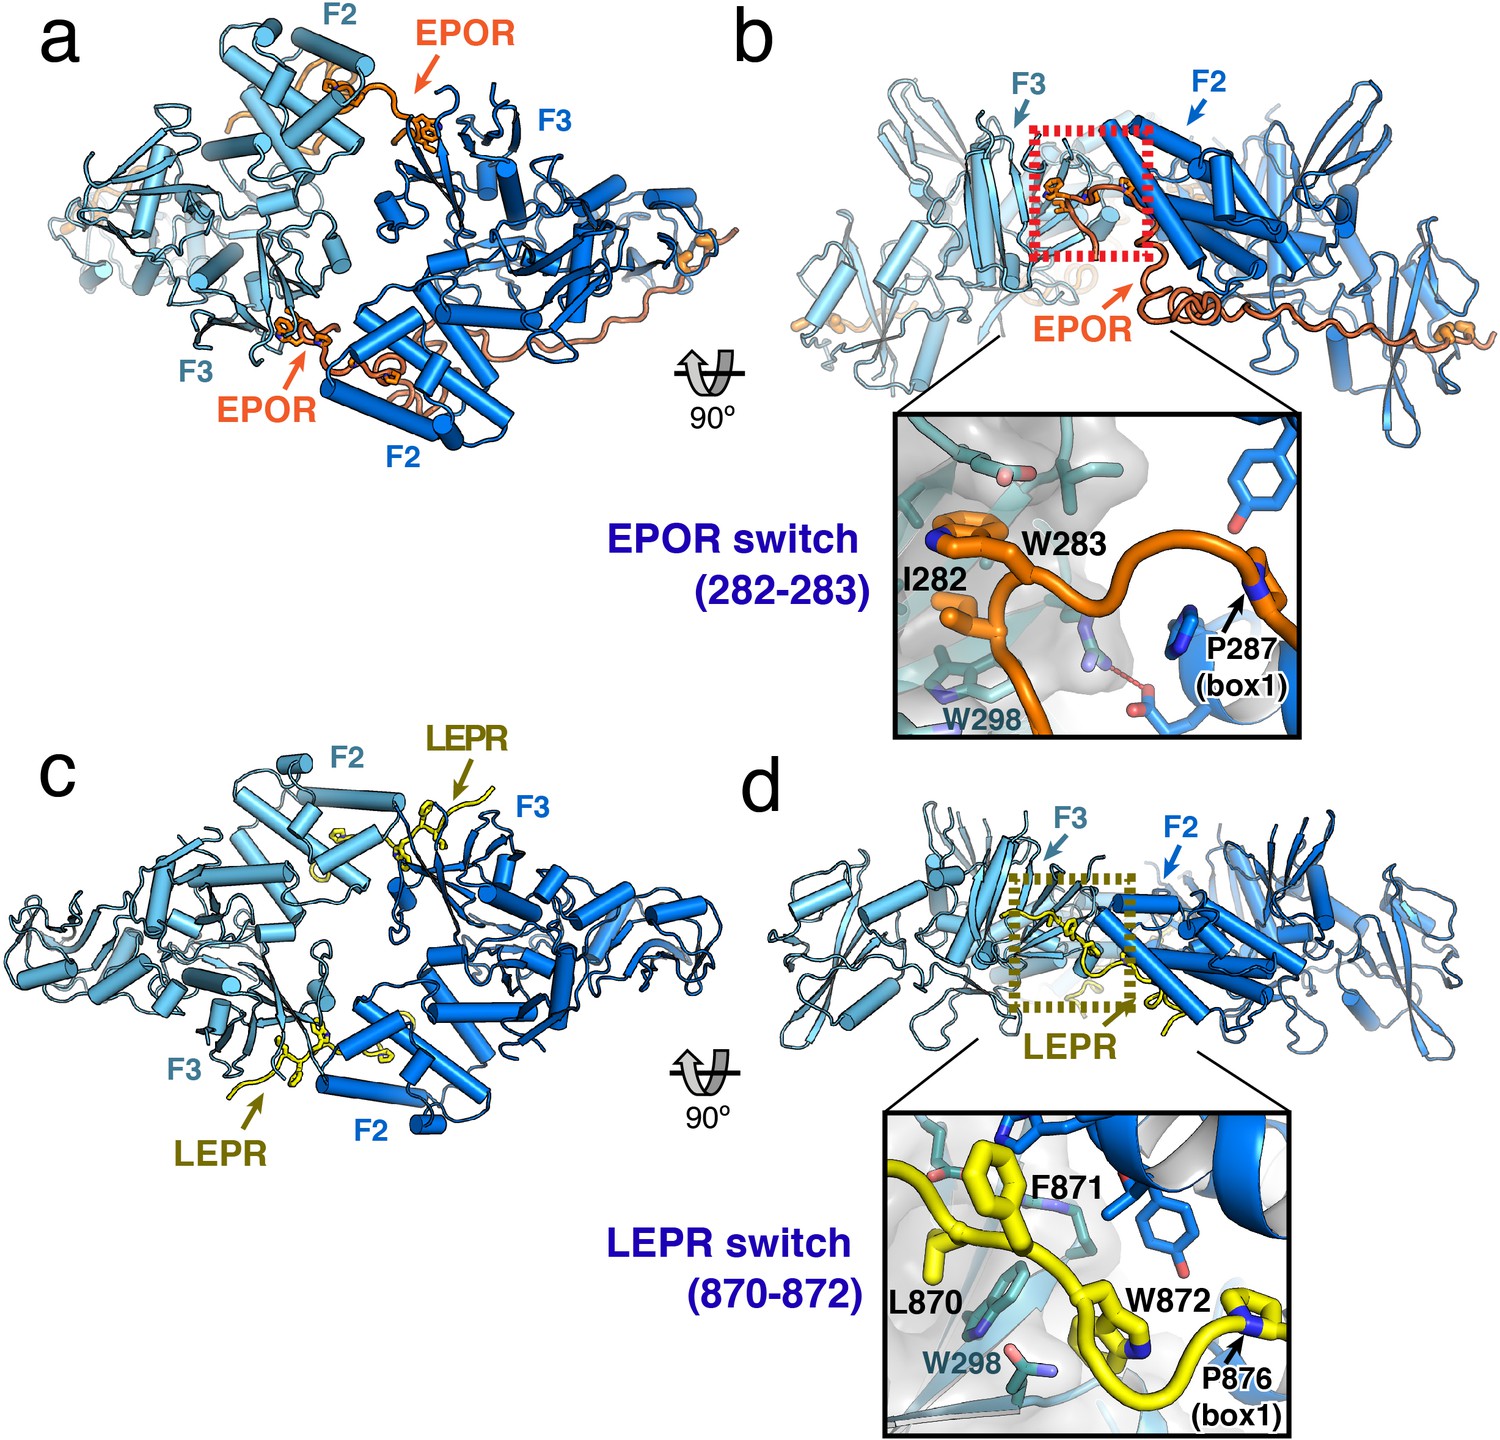
JAK2/EPOR and JAK2/LEPR dimerization is mediated by the receptor ‘switch’ regions.
(a) Top and (b) side views of the JAK2/EPOR dimer displayed as a cartoon model, with JAK2 monomers shown in blue and teal, and EPOR shown in orange. Inset box in (b) shows a close-up view of the EPOR switch residues Ile282 and Trp283, shown as stick models. Box1 residue Pro287 is also shown for reference. (c) Top and (d) side views of the JAK2/LEPR dimer displayed as cartoon models, with JAK2 monomers shown in blue and teal as in (a) and (b), and with LEPR shown in yellow. As in (b), the inset box shows a close-in view of the LEPR switch residues 870–872, displayed as stick models. Pro876 from the LEPR box1 sequence is also shown for reference.
Figure 3—figure supplement 1
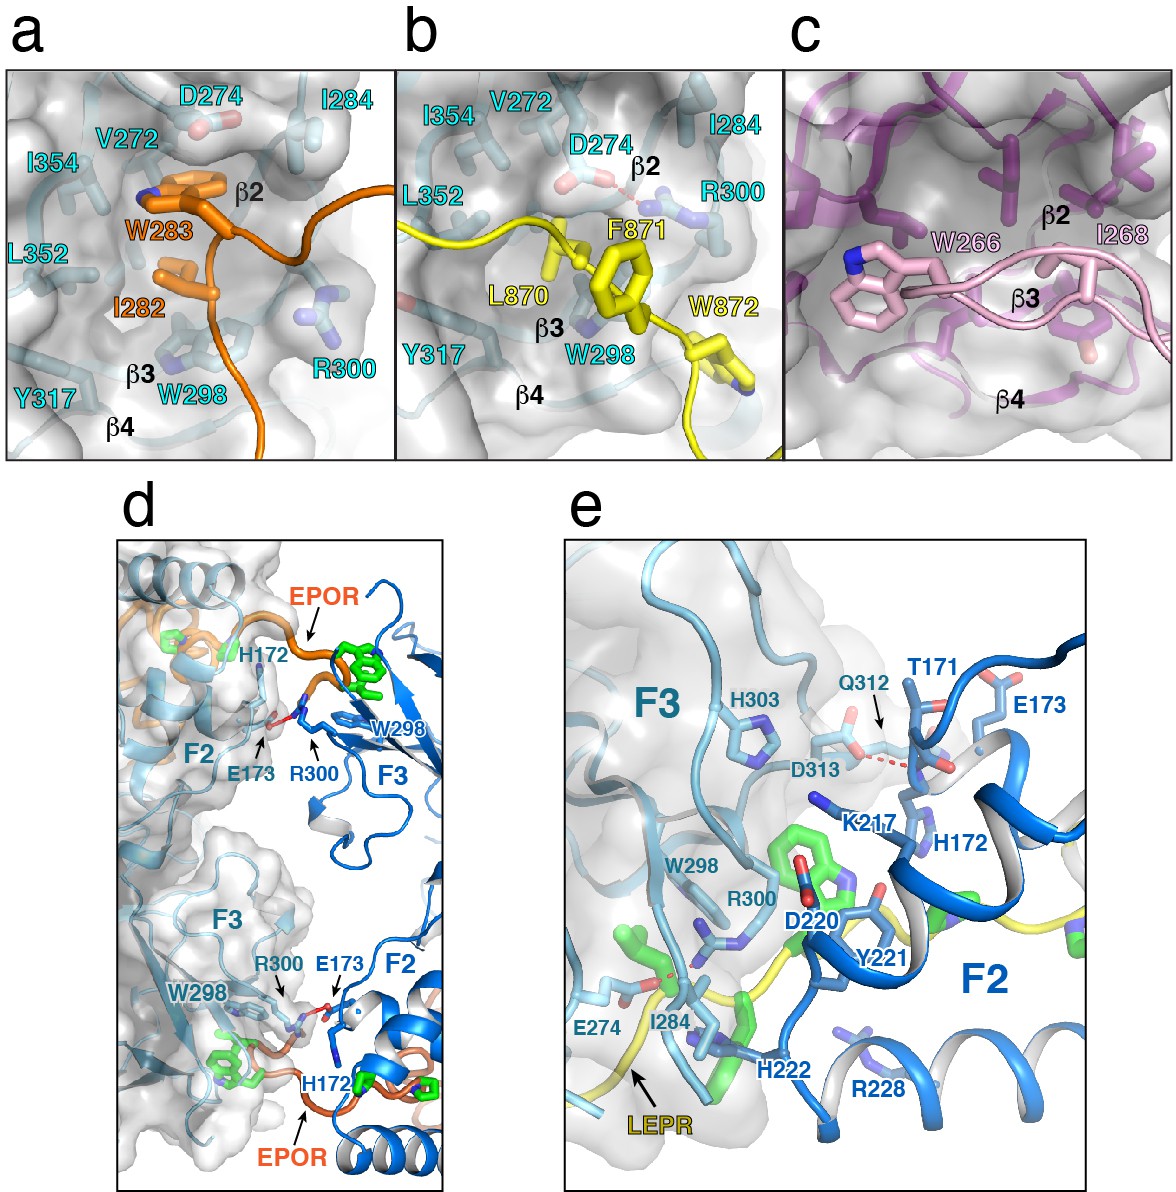
Structural analysis of receptor ‘switch’ region interactions with JAK2 F3 subdomain.
To highlight the switch/F3 interaction, cartoon depictions of (a) EPOR residues Ile262 and Trp263 and (b) LEPR residues Leu870, Phe871, and Trp872 interacting with the second JAK2 F3 subdomain are shown. JAK2 is shown in light blue as a cartoon model with stick sidechains, and a grey transparent surface. EPOR and LEPR are shown in orange and yellow, respectively, with the key sidechains shown as stick models. (c) A comparable view of homodimeric interaction between Focal Adhesion Kinase FERM F3 residue Trp266 and an opposing F3 subdomain is displayed. The FAK F3 subdomain is shown in purple as a cartoon with stick sidechains displayed, and the interacting F3 loop containing Trp266 is shown as a light pink cartoon, with Trp266 shown as a stick model. (d) The bridged dimer interaction seen between chain A and chain B in the JAK2/EPOR assymetric unit are shown. For the JAK2 on the left, shown in light teal, grey transparent surface is also displayed to better highlight the boundaries between the JAK2 molecules. EPOR is shown in orange, with key residues labeled and shown as green stick models. (e) A similar interaction interface for JAK2/LEPR chain A and its symmetry related molecule are shown. Only one interface is shown because the second is a symmetry related mirror image. JAK2 is shown as in (d), with LEPR shown in yellow with key residues labeled and highlighted in green as stick models.
Figure 4 with 1 supplement
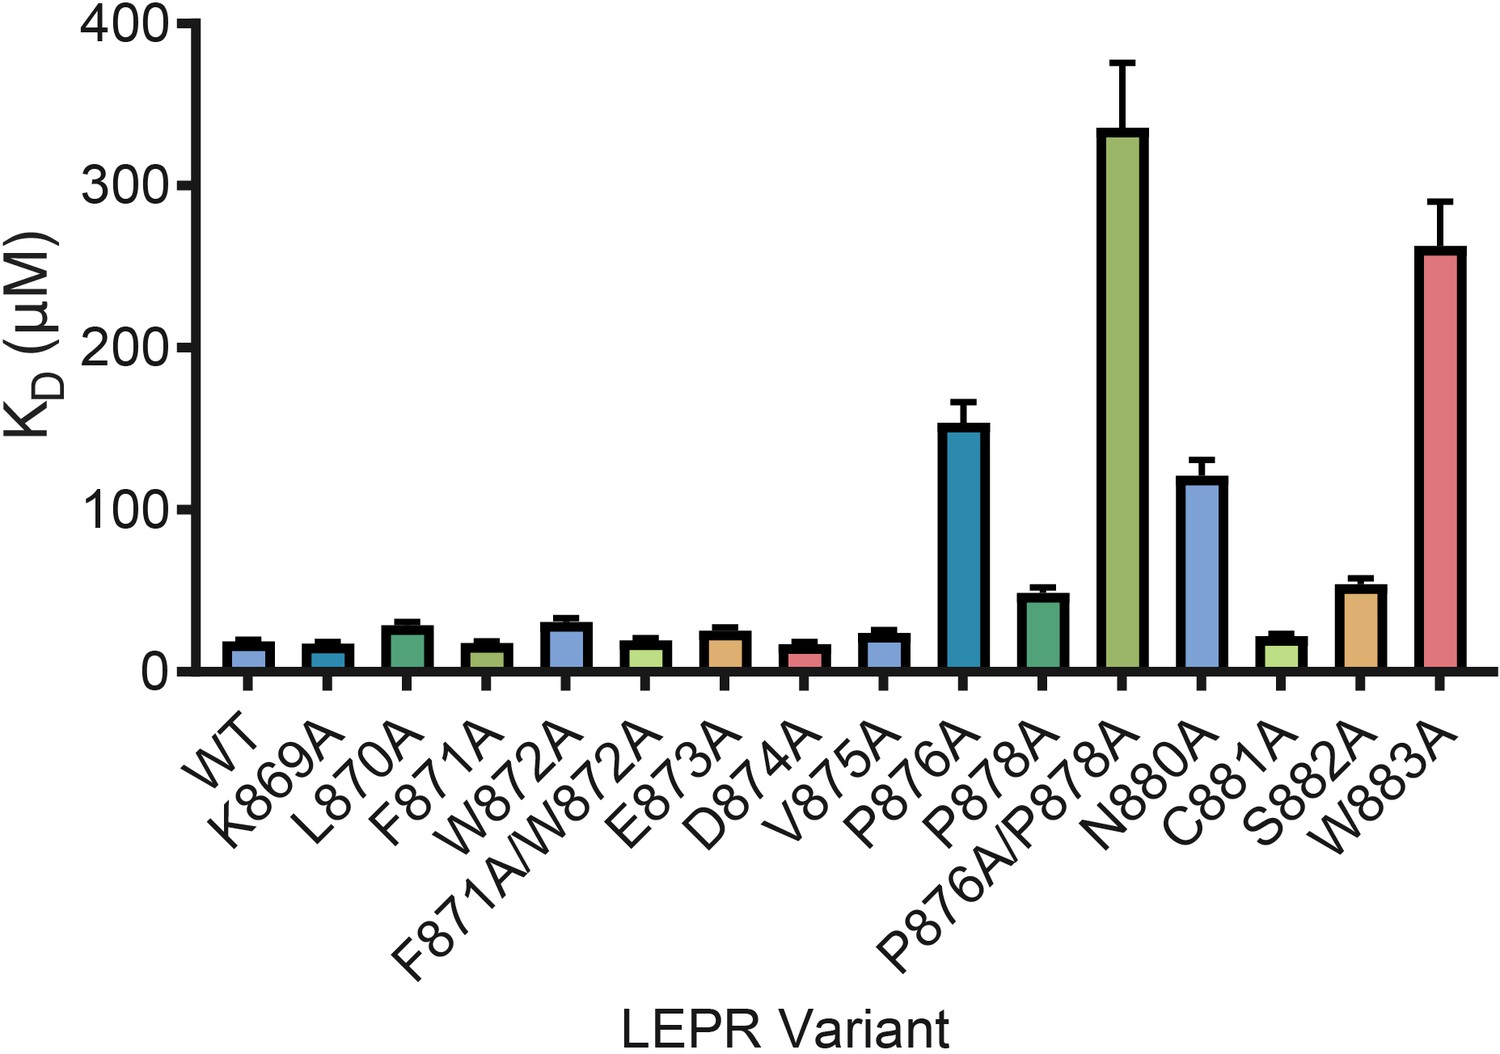
LEPR switch residues are dispensable for binding to JAK2.
Biolayer Interferometry was used to measure equilibrium affinity constants (KD) for the binding of in vitro translated human LEPR (residues 863–933) containing the listed mutations to wild-type JAK2 FERM–SH2 protein (residues 36–514). The KD ± standard error of three replicate experiments is represented as a bar graph.
Figure 4—figure supplement 1
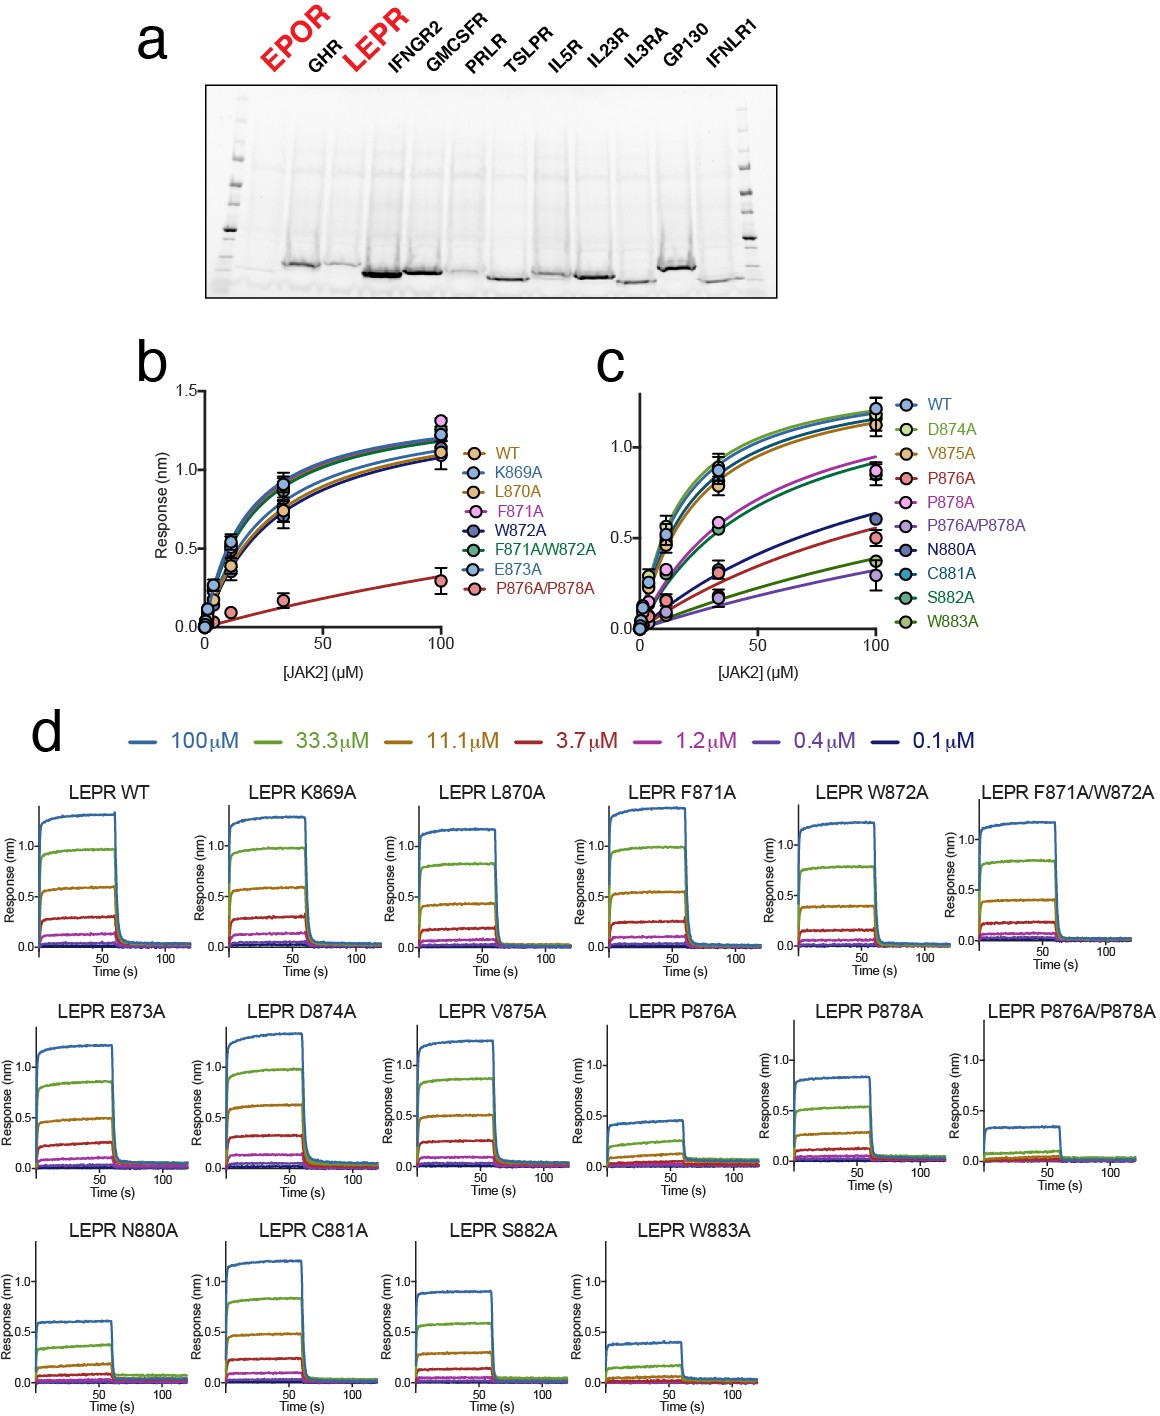
Biolayer interferometry (BLI) analysis of the JAK2/LEPR interaction.
(a) SDS-PAGE gel of in vitro translated receptor peptides. EPOR and LEPR lanes are highlighted in red. (b–c) Affinity plots used to calculate steady state affinity (KD) values for the interaction between JAK2 and biotinylated LEPR peptides (residues 863–933) that contained alanine mutations as the listed positions. Circles and error bars depict the mean response ± SEM for three independent experiments. The ± value associated with each calculated KD is a measure of how well that parameter is defined by the model fitting procedure for that dataset. (d) Raw sensorgram data for representative JAK2/LEPR BLI experiments.
Figure 5 with 1 supplement
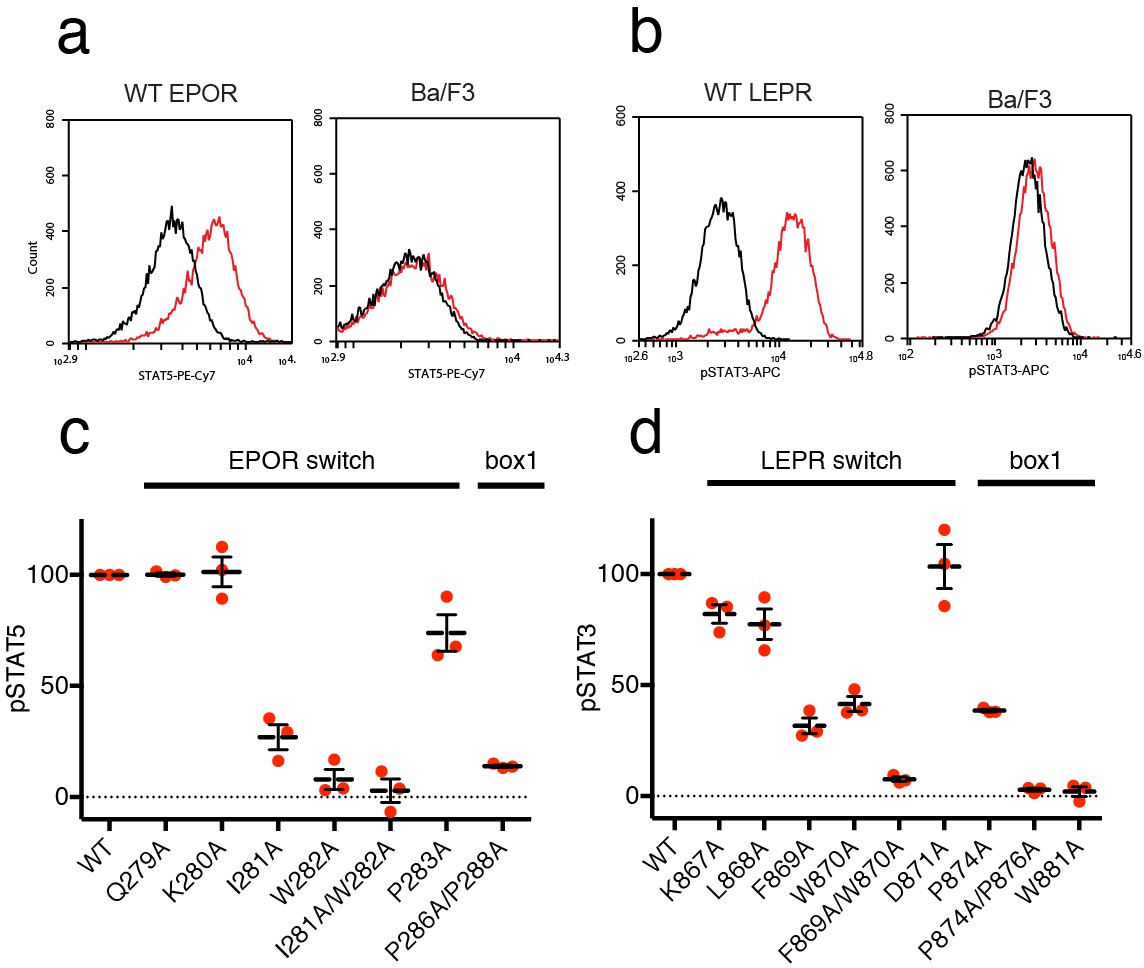
EPOR and LEPR switch residues are required for Epo and Leptin-induced STAT phosphorylation.
(a,b) Stable Ba/F3 cell lines expressing wild-type, full length mouse EPOR or LEPR were generated and analyzed for STAT phosphorylation by flow cytometry after stimulation with EPO or leptin. (a) Representative plots comparing phospho-STAT5 staining of parental Ba/F3 cells or Ba/F3 cells expressing EPOR. Cells were stimulated with 1 nM mouse EPO for 15 min before fixation, staining, and analysis. (b) Representative plots comparing phospho-STAT3 staining of parental Ba/F3 cells or Ba/F3 cells expressing LEPR. Cells were stimulated with 100 pM mouse Leptin for 4 hr prior to fixation, staining, and analysis. (c) Analysis of STAT5 phosphorylation by flow cytometry for EPOR wild-type, switch region, and box1 mutants, stimulated with 1 nM EPO as in (a). Mean levels of STAT5 phosphorylation were assessed in three separate experiments, with wild-type signal representing 100% in all three experiments. (d) Analysis of STAT3 phosphorylation by flow cytometry for LEPR wild-type, switch region, and box1 mutants, stimulated with 100 pM Leptin, as in (b). Mean levels of STAT3 phosphorylation was assessed in three separate experiments, with wild-type signal representing 100% in all three experiments. Error bars represent standard error of the mean (SEM).
Figure 5—figure supplement 1
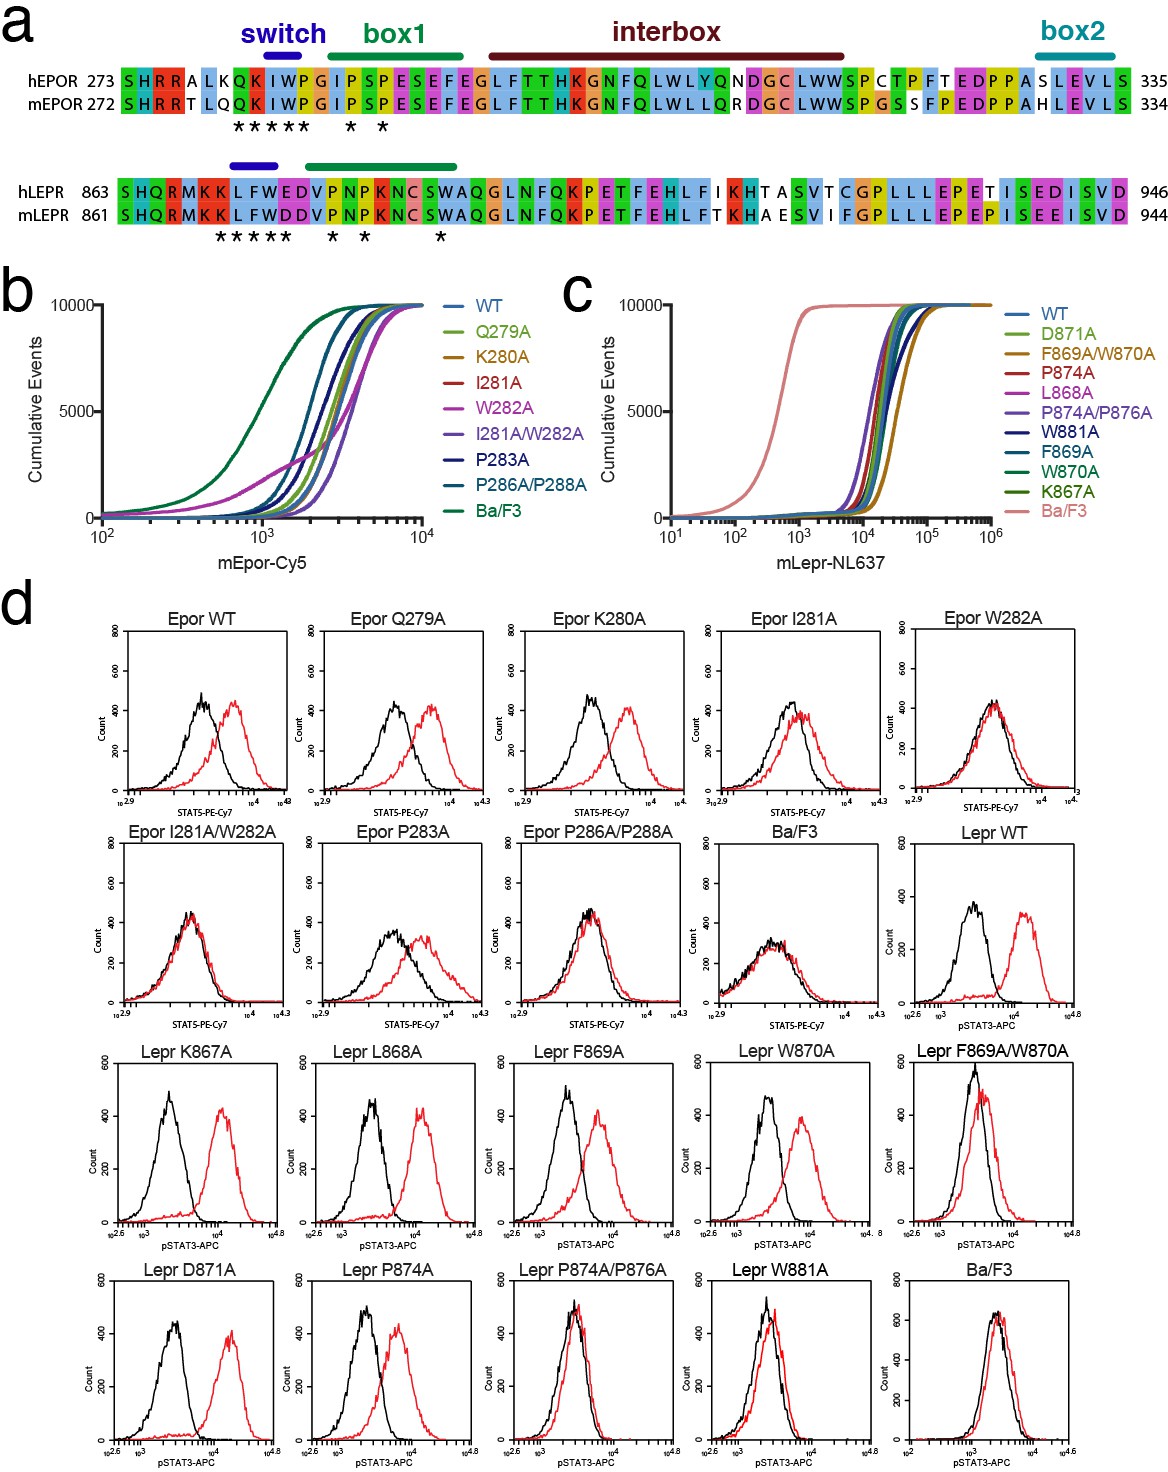
Analysis of Ba/F3 stable cell lines expressing EPOR or LEPR mutants.
(a) Alignment of human and mouse sequences for EPOR and LEPR. Note the numbering differences for mouse versus human (minus one residue for EPOR and minus two residues for LEPR). Residues in the switch region and box1, which are mutated in our experiments, are completely conserved between human and mouse. (b–c) Receptor surface staining for stable cell lines expressing (b) EPOR variants and (c) LEPR variants. Plots represent cumulative events (Y axis) at or below a given staining level (X axis). (d) Representative raw flow cytometry histograms showing the phospho-STAT5 (EPOR) or phospho-STAT3 (LEPR) staining in unstimulated cells (black trace) or cells stimulated with cytokine (red trace) as described in Materials and methods.
Figure 6 with 1 supplement
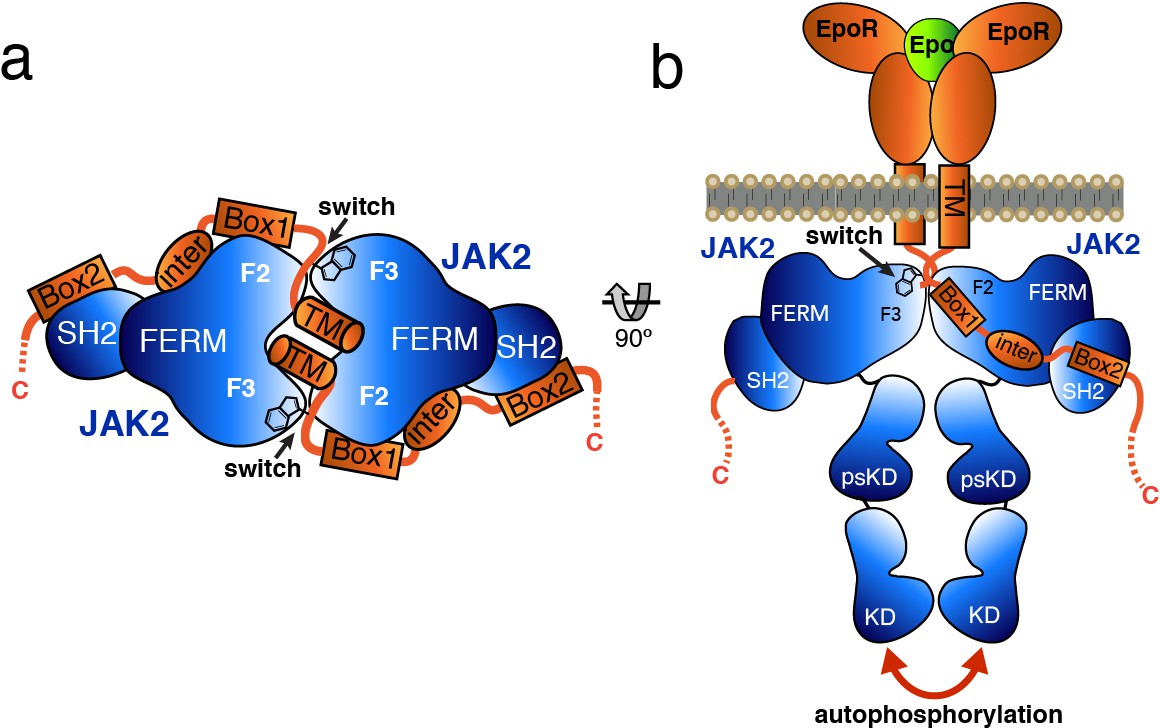
Model for JAK2 dimerization and activation.
(a) Schematic diagram showing a top view of the JAK2/EPOR dimer, with the EPOR switch regions engaged and transmembrane (TM) domains displayed. (b) Schematic representation of the activation of JAK2 upon EPO-induced EPOR TM rearrangement and JAK2 dimerization.
Figure 6—figure supplement 1
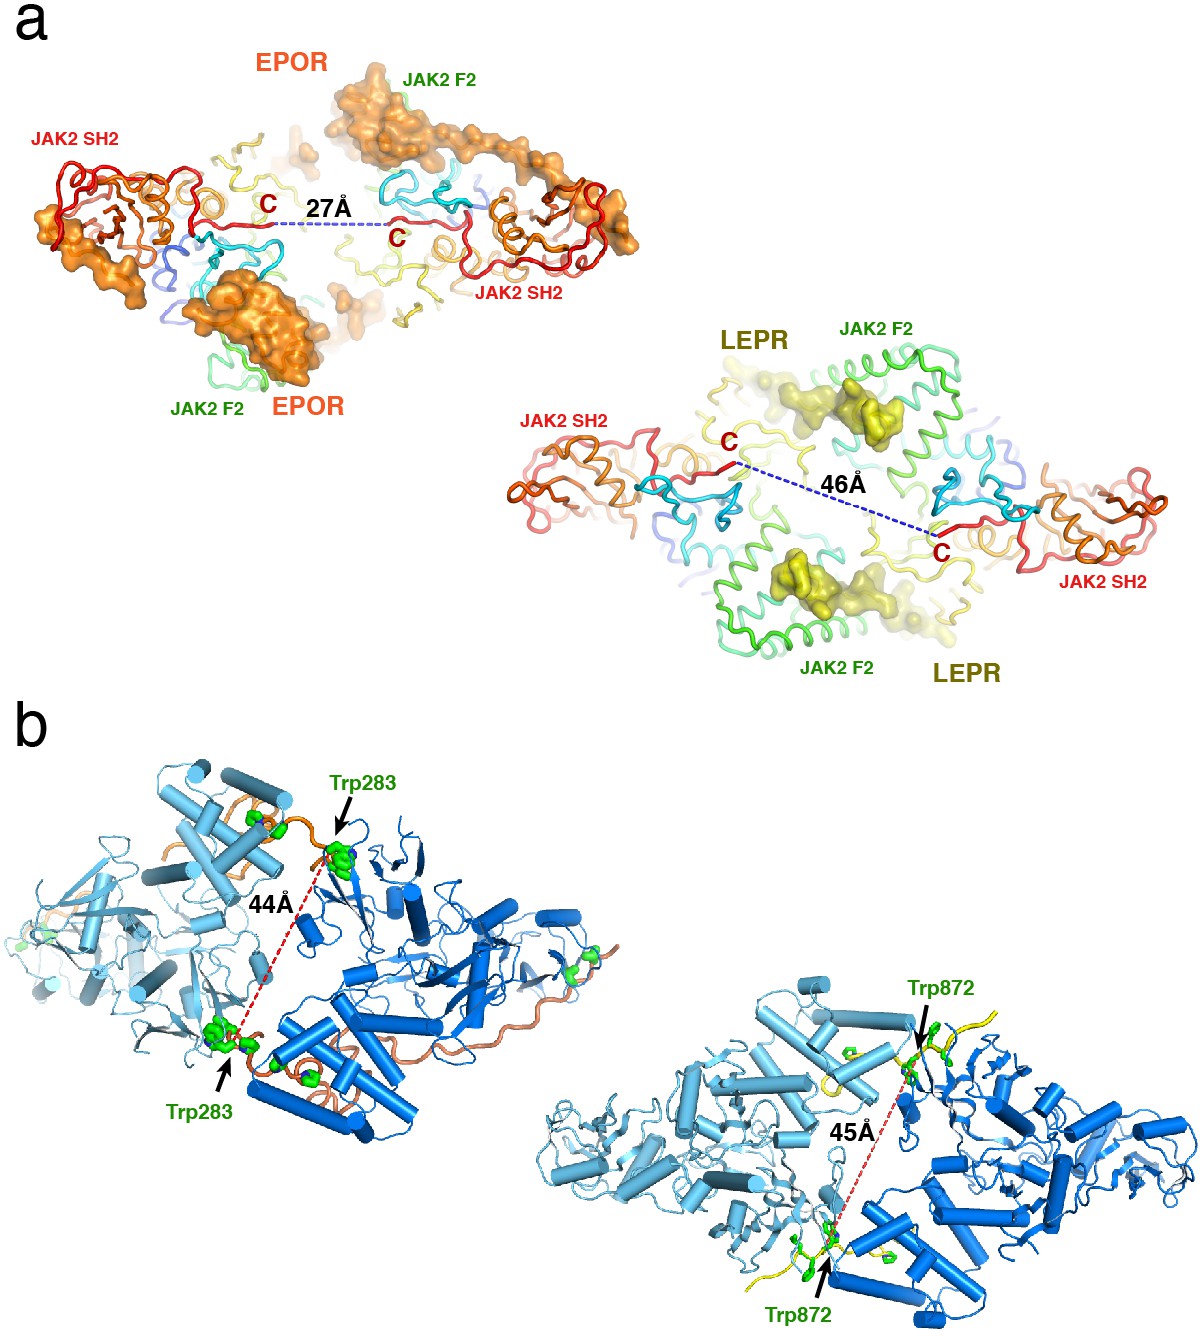
Analysis of the JAK2/EPOR and JAK2/LEPR dimers.
(a) An ‘underside’ view of the JAK2/EPOR (left) and JAK2/LEPR (right) dimers to illustrate the distance between the C-termini (residue 515) of the two JAK2 SH2 domains. Each JAK2 is shown as a cartoon and colored in rainbow from N terminus (blue) to C-terminus (red). EPOR and LEPR are shown as orange and yellow surfaces, respectively. (b) ‘Top’ views of JAK2/EPOR (left) and JAK2/LEPR (right) to illustrate the distance between EPOR Trp283 residues or LEPR Trp872 residues in the two dimers. JAK2 monomers are colored in dark and light blue, and EPOR and LEPR are colored in orange and yellow, as above.
Tables
Table 1
Data collection and refinement statistics.
https://doi.org/10.7554/eLife.38089.004| JAK2/EPOR | JAK2/LEPR | |
|---|---|---|
| Data collection | ALS 5.0.1 | SSRL 12–2 |
| Space group | C2 | P6522 |
| Cell dimensions | ||
| a, b, c (Å) | 178.49, 114.88, 179.82 | 263.87, 263.87, 101.08 |
| α, β, γ (°) | 90, 93.2, 90 | 90, 90, 120 |
| Resolution (Å) | 48.44–2.65 (2.74–2.65) | 43.19–2.83 (2.93–2.83) |
| Rsym or Rmerge | 0.073 (0.865) | 0.105 (1.60) |
| I / σI | 13.1 (1.3) | 21.8 (2.0) |
| Completeness (%) | 99.5 (97.9) | 99.6 (99.5) |
| Redundancy | 3.4 (3.3) | 13.4 (13.7) |
| CC1/2 | 0.99 (0.63) | 0.99 (0.80) |
| Refinement | ||
| Resolution (Å) | 48.44–2.65 (2.75–2.65) | 43.19–2.83 (2.93–2.83) |
| No. reflections | 104,921 (10,233) | 49,498 (4853) |
| Rwork/Rfree | 0.222/0.260 | 0.228/0.241 |
| No. atoms | 16599 | 7601 |
| Protein | 16454 | 7569 |
| Ligand/ion | N/A | 5 |
| Water | 145 | 27 |
| B-factors | 71.32 | 106.19 |
| Protein | 71.48 | 106.30 |
| Ligand/ion | N/A | 104.80 |
| Water | 53.65 | 74.23 |
| R.M.S. deviations | ||
| Bond lengths (Å) | 0.003 | 0.004 |
| Bond angles (°) | 0.85 | 0.63 |
-
Values in parentheses are for highest-resolution shell.
Key resources table
| Reagent type (species) or resource | Designation | Source or reference | Identification | Additional information |
|---|---|---|---|---|
| Biological sample (Mus musculus) | Erythropoietin | R and D systems | 959-ME | Concentration (1 nM) |
| Biological sample (Mus musculus) | Leptin | R and D systems | 498-OB | Concentration (100 pM) |
| Antibody (Capra aegagrus) | Anti-human leptin receptor polyclonal antibody | R and D systems | AF497 | Concentration (12.5 ng/uL) |
| Antibody (Equus africanus) | NorthernLights NL637- conjugated anti-goat monoclonal secondary antibody | R and D systems | NL002 | Dilution (1:200) |
| Biological sample (Mus musculus) | Epo-Fc fusion | Abcam | ab170076 | Concentration (12.5 ng/uL) |
| Antibody (Mus musculus) | Anti-human phospho-Stat3 monoclonal antibody | eBioscience/ ThermoFisher | 17-9033-41 | Dilution (1:40) |
| Antibody (Mus musculus) | Anti-human phospho-Stat5 monoclonal antibody | eBioscience/ ThermoFisher | 25-9010-42 | Dilution (1:40) |
| Other | Ni-NTA Superflow resin | Qiagen | 30430 | |
| Other | Glutathione Sepharose 4B resin | GE healthcare | 17075605 | |
| Other | Superdex 200 Hi-load 16/60 column | GE healthcare | 28989335 | |
| Chemical compound, drug | EDTA-free protease inhibitors | Roche | 11836170001 | |
| Commercial assay or kit | BirA biotinylation kit | Avidity | BirA500 | |
| Commercial assay or kit | QuikChange II XL Site-Directed Mutagenesis Kit | Agilent | 200522 | |
| Commercial assay or kit | ExiProgen ProXpress PCR Template Kit | Bioneer | K-7400 | |
| Commercial assay or kit | ExiProgen EC1 Protein Synthesis Kit | Bioneer | EK-77161 | |
| Chemical compound, drug | RPMI-1640 | produced in house | ||
| Chemical compound, drug | DMEM | produced in house | ||
| Chemical compound, drug | 1X Antibiotic- Antimycotic | Gibco | 15240062 | |
| Chemical compound, drug | 1% NEAA | Gibco | 11140050 | |
| Chemical compound, drug | TrypLE Express | Gibco | 12604013 | |
| Chemical compound, drug | FugeneHD | Promega | E2311 | |
| Chemical compound, drug | Retro-X Concentrator | Clontech/Takara | 631456 | |
| Chemical compound, drug | polybrene | Millipore | TR-1003-G | |
| Chemical compound, drug | Flow Cytometry Staining Buffer | ThermoFisher | 00-4222-26 | |
| Antibody (Rattus norvegicus) | anti-mouse CD16/CD32 monoclonal antibody (BD Fc Block) | BD Bioscience | 553141 | Dilution (1:200) |
| Chemical compound, drug | IC-fixation buffer | ThermoFisher | 00-8222-49 |
Additional files
-
Transparent reporting form
- https://doi.org/10.7554/eLife.38089.015
Download links
A two-part list of links to download the article, or parts of the article, in various formats.
Downloads (link to download the article as PDF)
Open citations (links to open the citations from this article in various online reference manager services)
Cite this article (links to download the citations from this article in formats compatible with various reference manager tools)
Receptor-mediated dimerization of JAK2 FERM domains is required for JAK2 activation
eLife 7:e38089.
https://doi.org/10.7554/eLife.38089


