Aurora kinase A localises to mitochondria to control organelle dynamics and energy production
- UMR 6290, France
- UBL, Genetics and Development Institute of Rennes (IGDR), France
- ENS de Lyon, France
- CNRS UMR 5242, France
- INRA USC 1370, France
- U1016, Institut Cochin, France
- UMR 8104, France
- Sorbonne Paris Cité, France
- SFR Biosit, UMS CNRS 3480- US INSERM 018, Université de Rennes, France
- Equipes labélisées Ligue Contre Le Cancer, France
- Faculté de Médecine, Université Laval, Canada
Figures
Figure 1 with 3 supplements
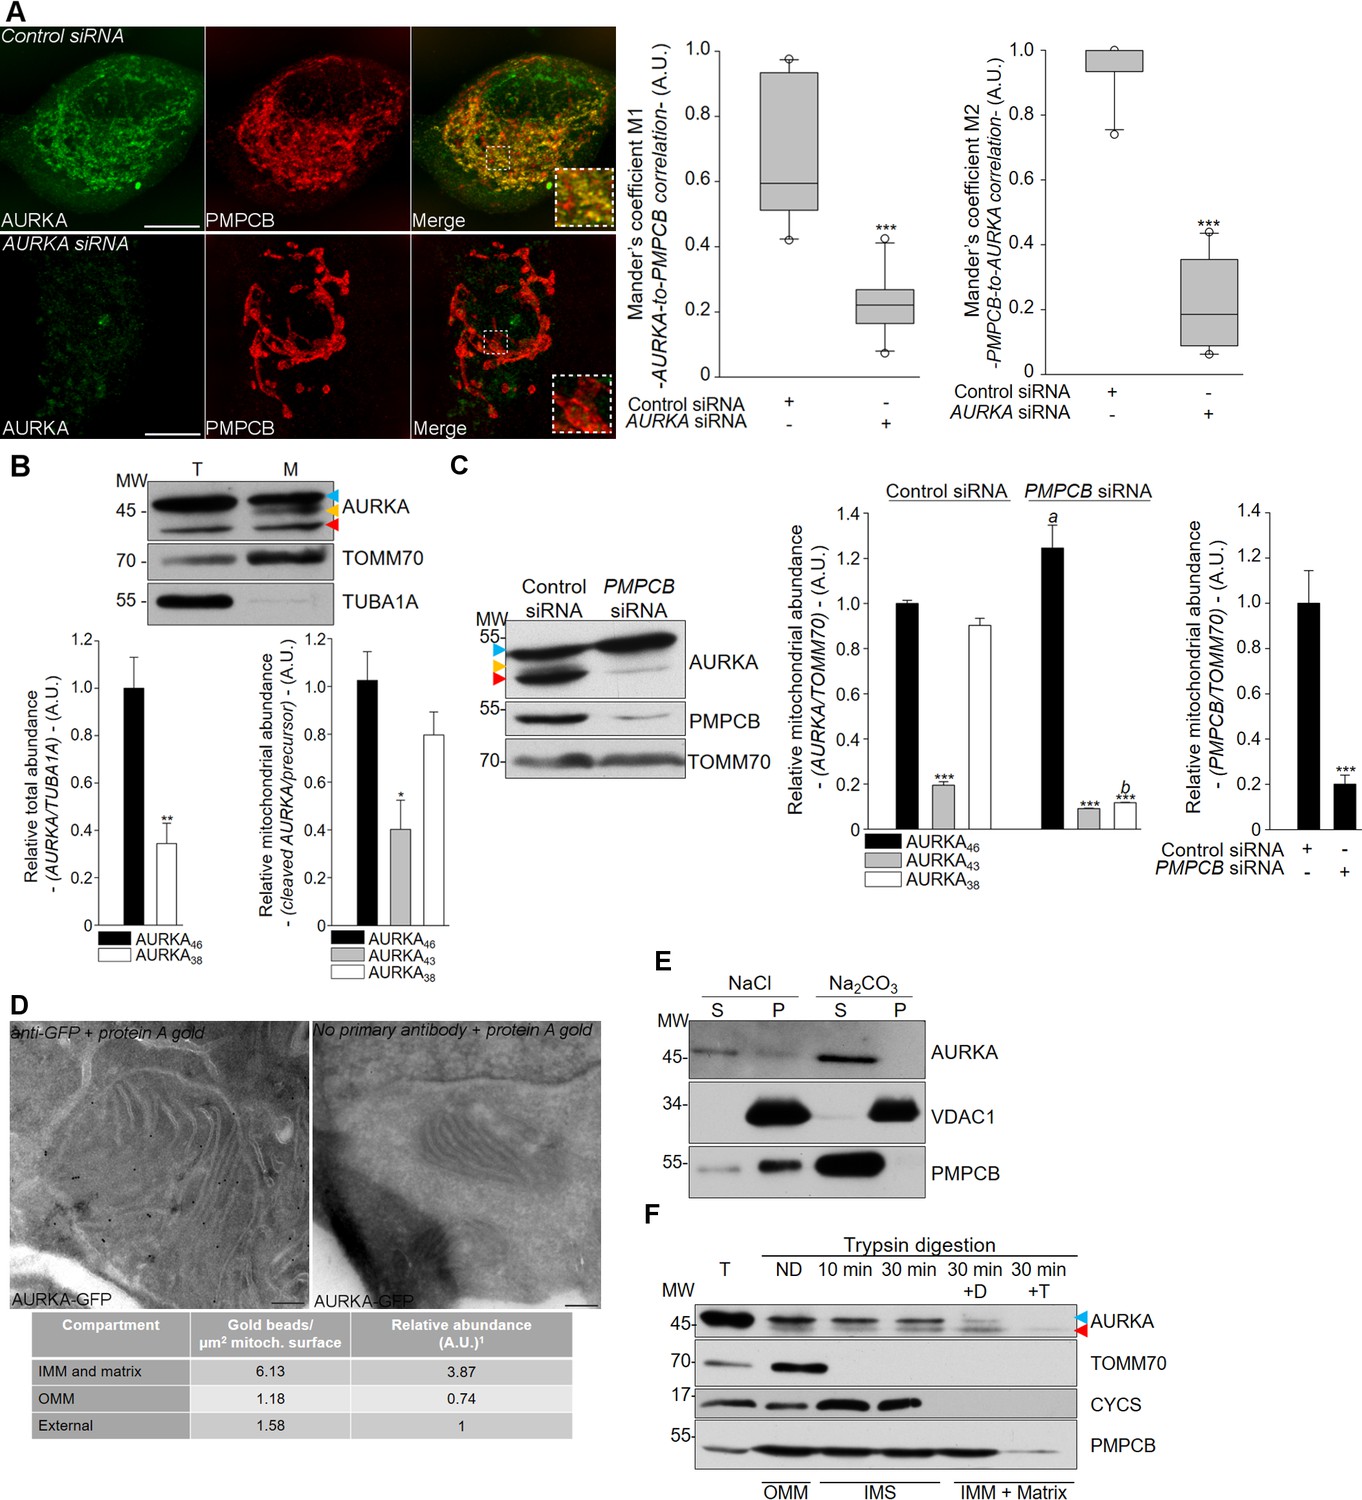
AURKA localises to mitochondria and it is imported into the mitochondrial matrix.
(A) (Left) Immunofluorescence micrographs of MCF7 cells transfected with control (top panels) or AURKA-specific siRNA (bottom panels); cells were stained for endogenous AURKA (left panels) and with PMPCB (middle panels) for mitochondria. Inset: higher magnification of the dotted area. Scale bar: 10 µm. (Right) Mander’s M1 and M2 co-localisation coefficients (Bolte and Cordelières, 2006) between AURKA and PMPCB on confocal pictures as in (A). n = 10 cells per condition; one representative experiment (of three) is shown. Whiskers extend from the 5th to the 95th percentiles. Outliers are indicated by white dots. (B) (Top) Lysates from total (T) and mitochondrial (M) fractions of HEK293 cells. Controls: TOMM70 (efficiency of mitochondrial isolation), TUBA1A (absence of cytosolic contaminations). (Bottom) Quantification of the abundance of each AURKA isoform in total or mitochondrial fractions. n = 3 independent experiments. (C) (Left) Intramitochondrial cleavage of endogenous AURKA in mitochondrial fractions of HEK293 cells transfected with control or PMPCB-specific siRNAs. (Right) Abundance of AURKA isoforms normalised against that of TOMM70 in control and PMPCB-depleted HEK293 cells. n = 3 independent experiments. (D) (Left) Localisation of ectopic AURKA-GFP in HEK293 cells by immunogold transmission electron microscopy (TEM) and (right) corresponding control condition without primary antibody. Table: number of gold beads per µm² of mitochondrial surface in the indicated mitochondrial subcompartments or non-mitochondrial cell surface (External). The relative abundance was then calculated by dividing the number of gold particles in each mitochondrial compartment by the number of ‘External’ particles. n = 20 images per condition from two independent experiments. Scale bar: 200 nm. (E) Isolation of mitochondrial soluble (S) and pellet (P) fractions by Na2CO3 extraction of mitochondrial fractions from HEK293 cells. Control cells were treated with NaCl. (F) Mitochondrial fractions from HEK293 cells digested with trypsin to degrade the OMM and blotted for endogenous AURKA. T = total lysate; ND = non digested mitochondrial fraction. To degrade the IMM and access the matrix, trypsin was combined with digitonin (+D) or Triton X-100 (+T). Controls for submitochondrial localisation: TOMM70 (OMM), CYCS (Inner Mitochondrial Space, IMS) and PMPCB (matrix). The submitochondrial compartments are indicated in the bottom part of the blot. AURKA46, AURKA43 and AURKA38 are indicated by blue, yellow and red flags, respectively. A.U.: arbitrary units. Data represent means ±s.e.m. *p<0.05, **p<0.01, ***p<0.001 compared to the ‘Control siRNA’ condition (A), ‘AURKA46’ condition (B and C). aP <0.01 and bP <0.001 compared to the corresponding cleaved isoform in the ‘Control siRNA’ condition in (C). NS: not significant.
Figure 1—figure supplement 1
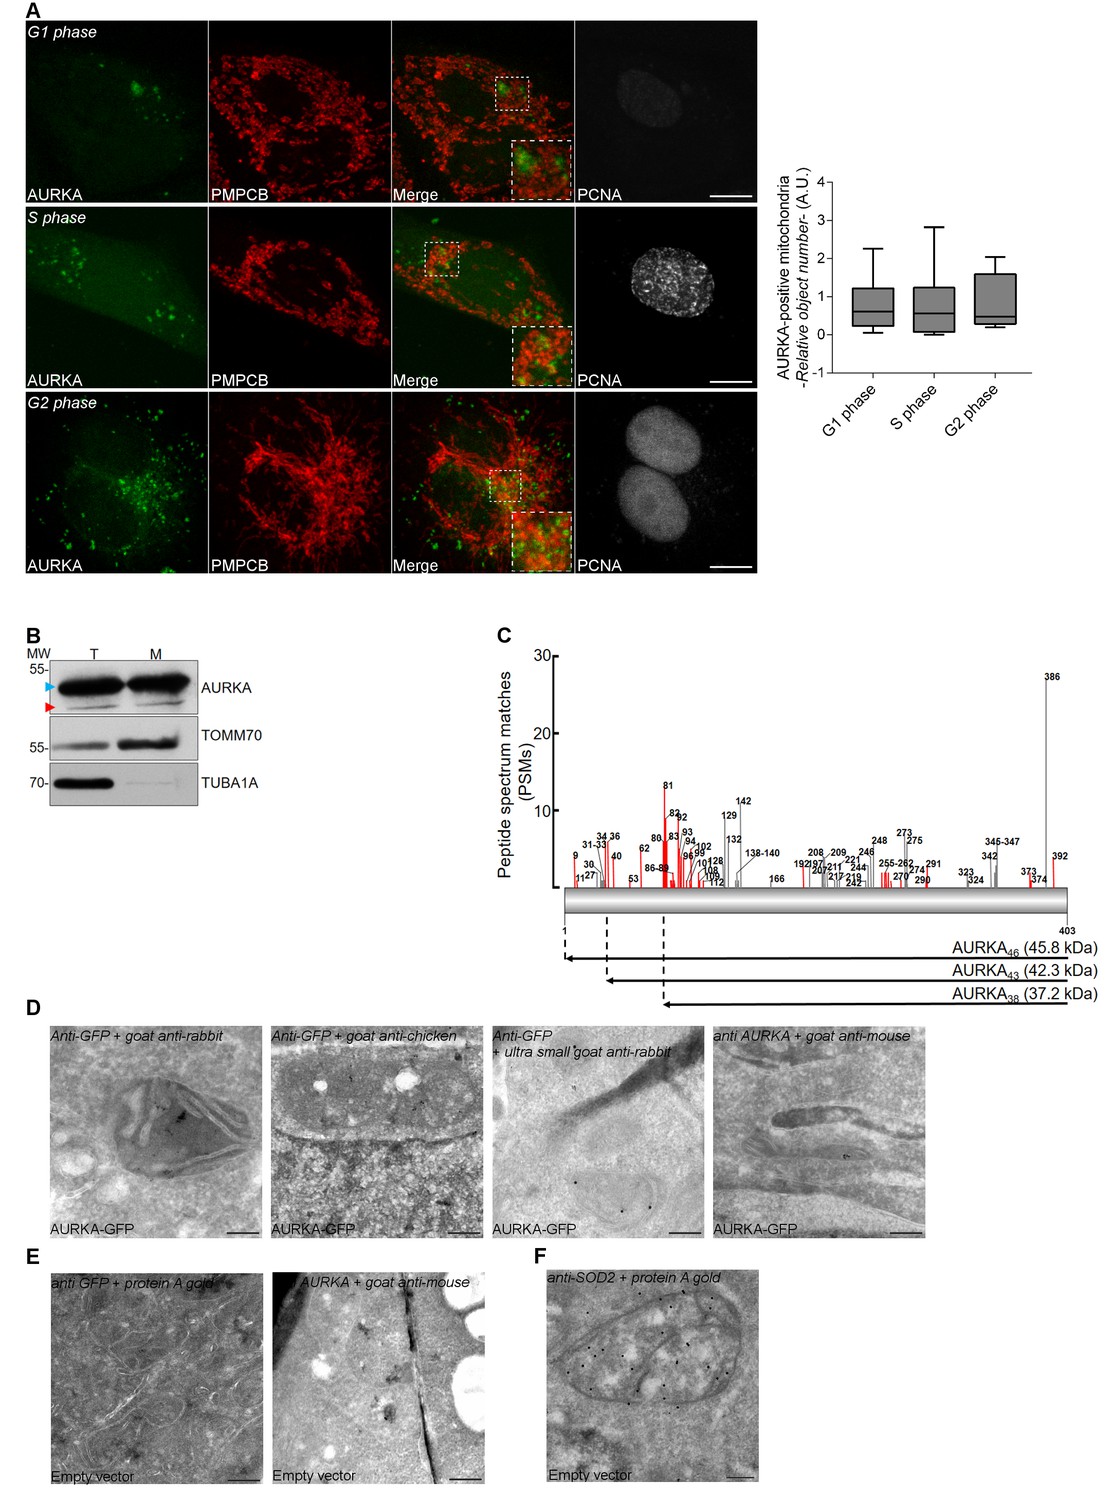
Identification of semi-tryptic peptides corresponding to the cleavage of AURKA in the mitochondrial matrix.
(A) Representative fluorescence images and corresponding quantification of the number of AURKA-positive objects co-localising with mitochondria in MCF7 cells in G1, S or G2 phase. Mitochondria were stained with PMPCB and the cell cycle phase was determined by using a PCNA-mCherry fluorescent reporter. Insets represents co-localisation sites between AURKA-positive objects and mitochondria. AURKA-positive objects are relative to the total number of AURKA-positive objects. n = 30 cells per condition from three representative experiments. Data extend from the 10th to the 90th percentile. All comparisons were not significant. Scale bar: 10 µm. (B) Representative western blot illustrating the cleavage of endogenous AURKA using a polyclonal anti-AURKA primary antibody. AURKA46 and AURKA38 are indicated by blue and red flags, respectively. (C) Localisation of the cleavage sites of AURKA triggered by putative mitochondrial proteases. The cleavage sites identified by the analysis of AURKA N- and C-ragged semi-tryptic peptides are indicated numerically relative to the amino acid sequence of human AURKA. The lengths of the lines are proportional to the number of peptide spectrum matches (PSMs) assigned to each peptide. Cleavage sites shown in grey derive from peptides containing aromatic residues (Phe, Tyr, Trp) that spontaneously give rise to truncated semi-tryptic fragments during MS/MS analysis. The cleavage sites shown in red originate from semi-tryptic peptides, devoid of aromatic residues, which are potentially generated by the action of mitochondrial proteases. Cleavages sites that occur predominantly were assigned to the mitochondrial-processing peptidase PMPCB (sites 34–36) and a second unknown mitochondrial protease (sites 81–82). The lengths of AURKA polypeptides generated from the putative cleavage by these proteases are represented relative to the full-length protein (403 amino acids, 45.8 kDa). (D–F). Representative control TEM micrographs illustrating anti-GFP or anti-AURKA primary antibodies used in conjunction with the indicated secondary antibodies in cells transfected with an empty vector or with AURKA-GFP (D–E), and the localisation of SOD2 in the mitochondrial matrix (F). Control: no primary antibody (E, last panel). Scale bar: 200 nm.
Figure 1—figure supplement 2
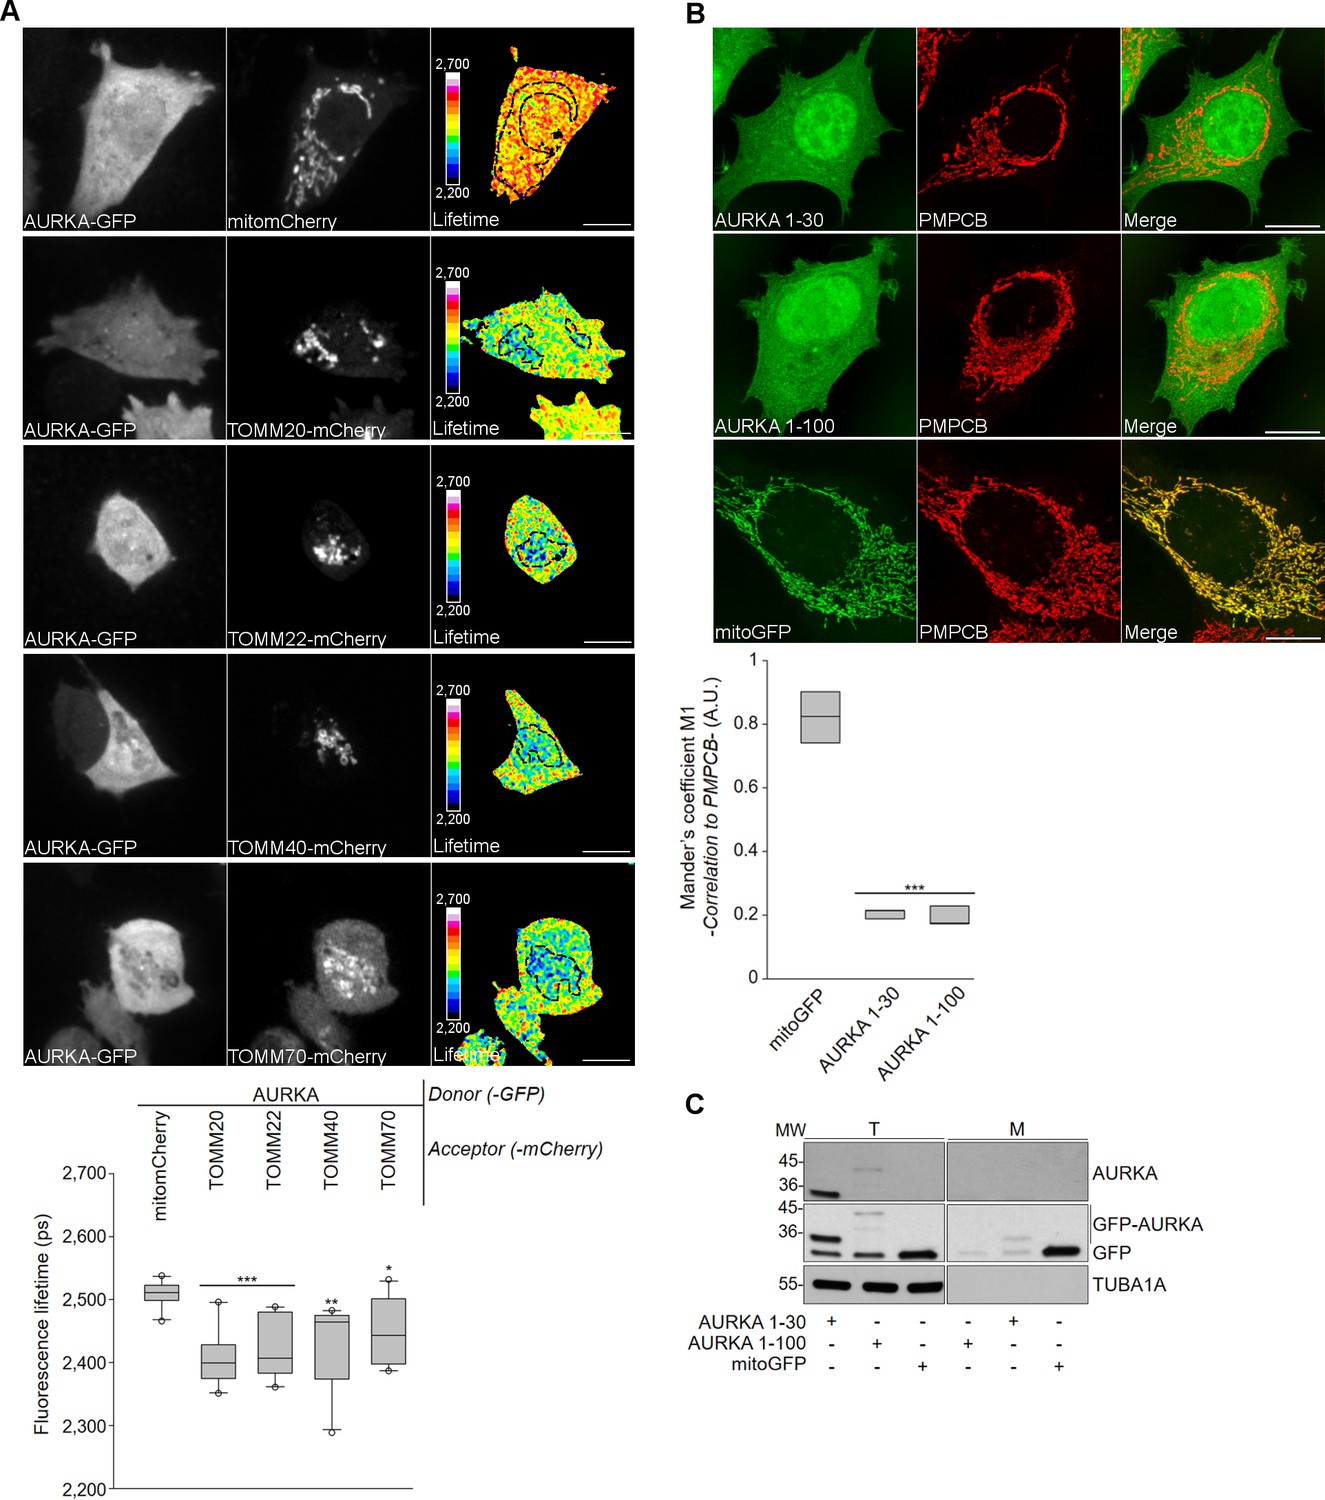
AURKA is imported into mitochondria via TOMM and its MTS is located at the N-terminus.
(A) Representative fluorescence and lifetime images and corresponding quantification of the decrease in GFP lifetime for the indicated donor-acceptor pairs in the mitochondria (dotted area) of MCF7 cells. Pseudocolour scale: pixel-by-pixel lifetime. n = 10 cells per condition from one representative experiment (of three). (B) (Top) Confocal images of MCF7 cells transfected with cDNAs coding for the first 30 or 100 amino acids of AURKA fused to GFP (AURKA 1–30 (top row), AURKA 1–100 (middle row) respectively) or mitoGFP (bottom row). Mitochondria were stained with PMPCB (middle column). (Bottom) Mander’s M1 co-localisation coefficient between AURKA variants or mitoGFP and PMPCB. n = 30 cells per condition from three representative experiments. Scale bar: 10 µm. (C) Representative western blot of total and mitochondrial fractions of HEK293 cells transfected with AURKA 1–30, 1–100 or mitoGFP. Data extend from the 10th to the 90th percentile. *p<0.05, **p<0.01, ***p<0.001 compared to the ‘AURKA-GFP/mitomCherry’ donor-acceptor pair (A) or the ‘mitoGFP’ condition (B).
Figure 1—figure supplement 3
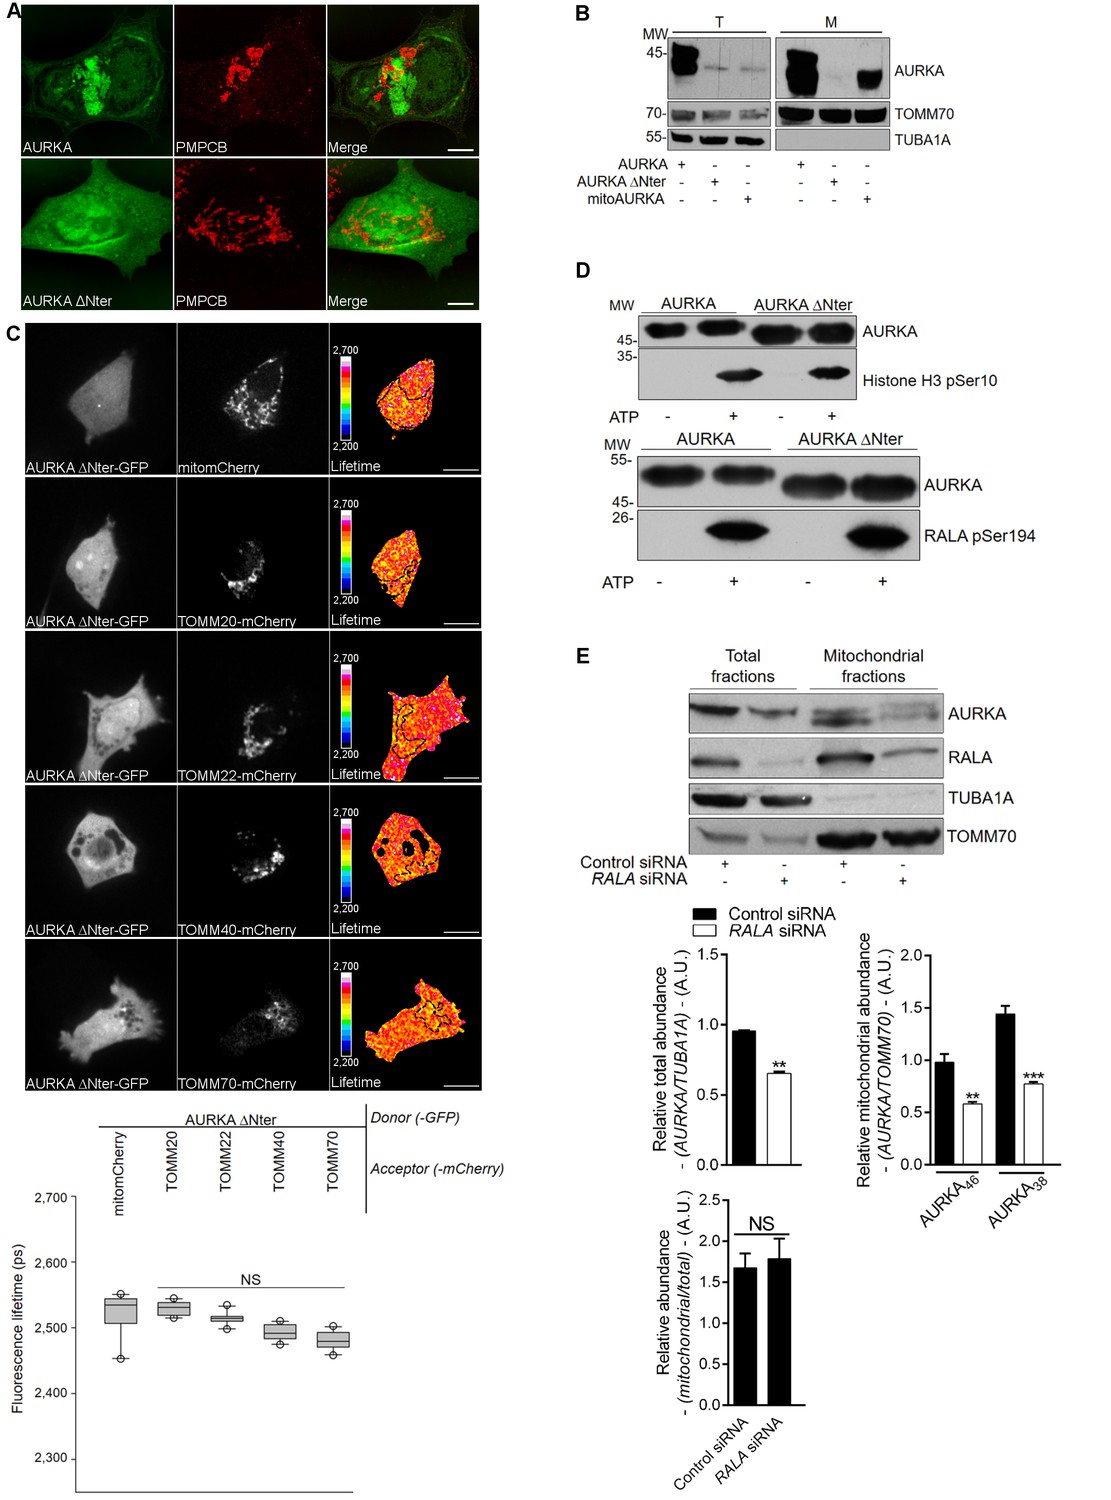
Kinase activities and mitochondrial localisation of AURKA ΔNter or mitoAURKA.
(A) Confocal images of MCF7 cells transfected with AURKA-GFP or AURKA ΔNter-GFP. Mitochondria are stained with PMPCB. (B) Protein abundance of AURKA, AURKA ΔNter and mitoAURKA all fused to a 6xHis tag in total (T) and mitochondrial (M) fractions of HEK293 cells. Membranes were western-blotted for AURKA, TOMM70 (mitochondria) and TUBA1A (cytosol). Of note, AURKA ΔNter and mitoAURKA have lower expression efficiencies than does normal AURKA. (C) Representative fluorescence and lifetime images of MCF7 cells over-expressing AURKA ΔNter and mitomCherry or the indicated TOMM subunits all fused to mCherry and GFP lifetime quantifications of the indicated donor-acceptor pairs in mitochondria (dotted area). n = 10 images from one representative experiment (of three). (D) Representative in vitro kinase assays performed by incubating purified AURKA-GFP or AURKA ΔNter-GFP kinases with histone H3 (top) or RALA (bottom) in the presence or absence of ATP for 30 min at 37°C. Membranes were blotted for AURKA, phsopho-Ser10 histone H3 and phospho-Ser194 RALA. (E) (Top) Intramitochondrial cleavage of endogenous AURKA in mitochondrial fractions of HEK293 cells transfected with control or RALA-specific siRNAs. (Bottom) Abundance of total AURKA normalised against that of TUBA1A (left panel), of AURKA isoforms normalised against that of TOMM70 in control and RALA-depleted HEK293 cells (middle panel), and of mitochondrial RALA normalised against the abundance of total RALA in control and RALA-depleted cells. n = 3 independent experiments. *p<0.05, **p<0.01 or ***p<0.001 compared to each corresponding ‘Control siRNA’ condition. NS: not significant.
Figure 2
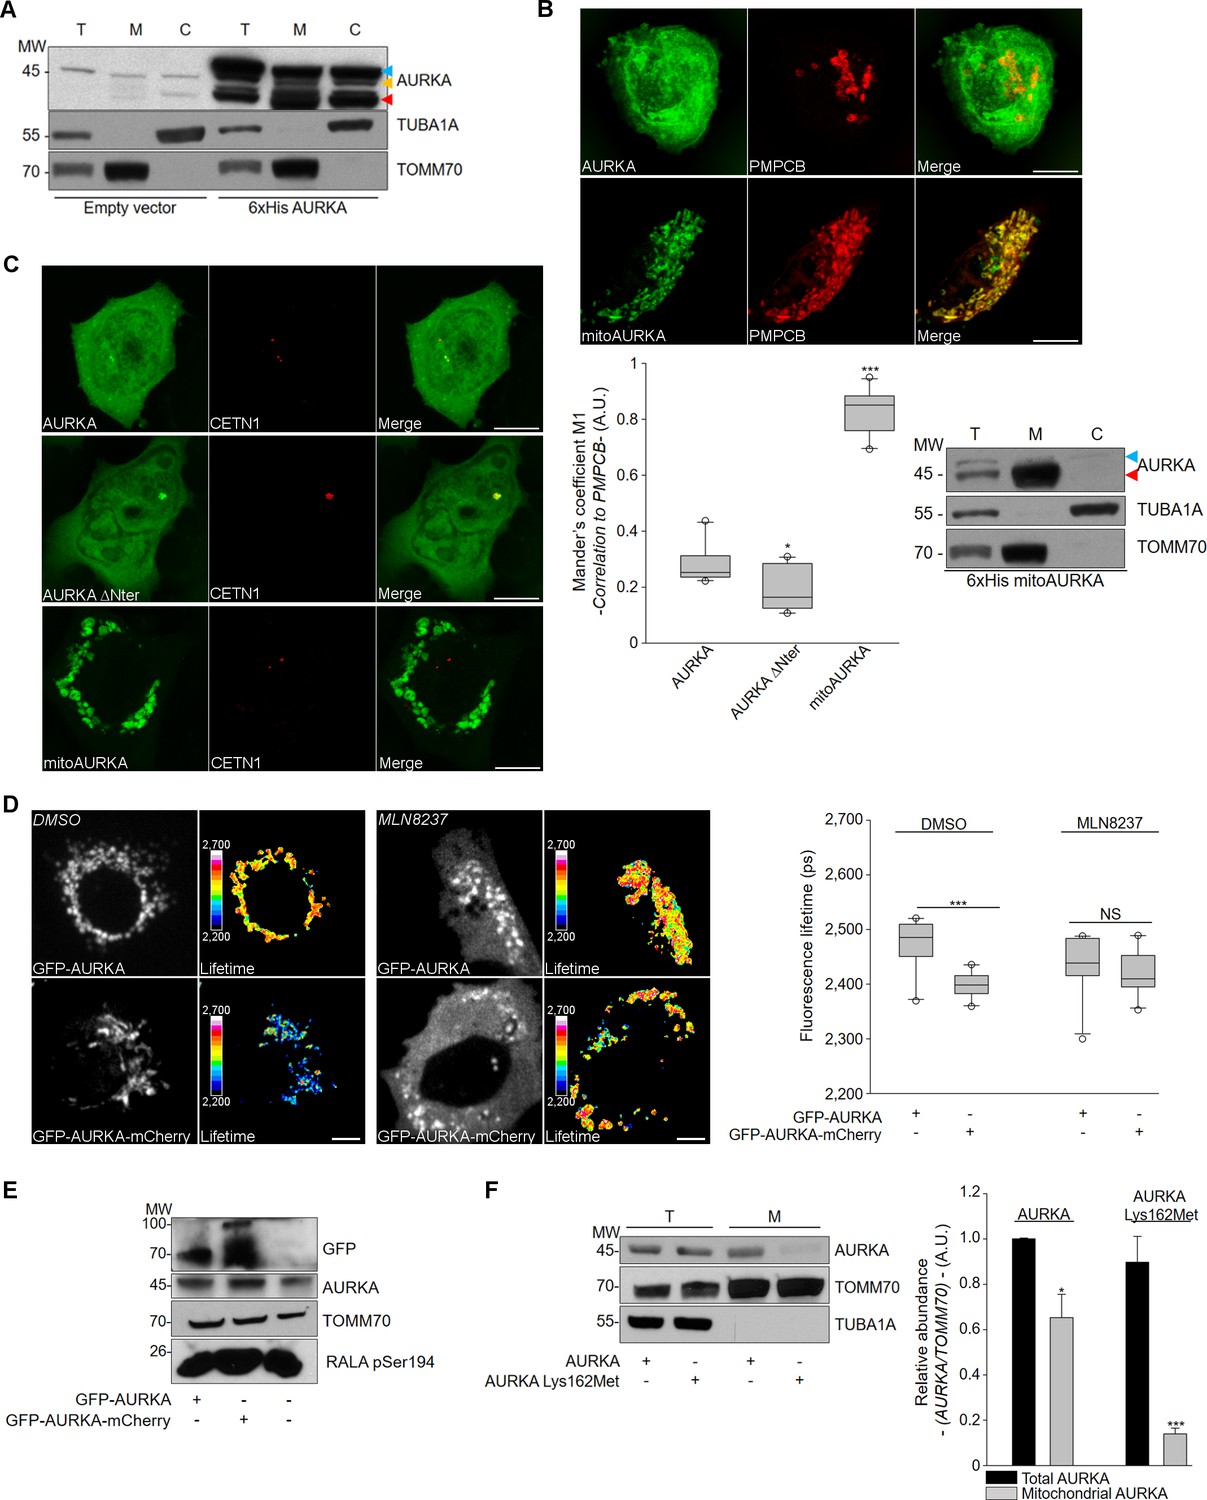
AURKA is exported to the cytosol after intramitochondrial cleavage and it is active in the mitochondrion.
(A) Representative western blot of the intramitochondrial cleavage of endogenous and 6xHis AURKA in total (T), mitochondrial (M) and cytosolic (C) fractions from HEK293 cells. (B) (Top) Confocal images of MCF7 cells transfected with AURKA-GFP or mitoAURKA-GFP. Mitochondria were stained with PMPCB. (Bottom left) Mander’s M1 co-localisation coefficient between AURKA-GFP, AURKA ΔNter-GFP or mitoAURKA-GFP and PMPCB. n = 10 cells per condition from one representative experiment (of three). (Bottom right) Mitochondrial cleavage of mitoAURKA 6xHis cDNA in total (T), mitochondrial (M) and cytosolic (C) fractions from HEK293 cells. (C) Representative confocal images of MCF7 cells transfected as indicated. CETN1-iRFP670: centrosome marker. (D) (Left) Representative fluorescence (GFP channel) and lifetime images of MCF7 cells showing the mitochondrial localisation of GFP-AURKA or GFP-AURKA-mCherry expressed under the control of the minimal AURKA promoter (Bertolin et al., 2016) and treated with DMSO or with the AURKA inhibitor MLN8237 (Alisertib). (Right) Corresponding ifetime quantifications. n = 10 cells per condition from one representative experiment (of three). Scale bar: 10 µm. (E) Representative western blot of mitochondrial fractions obtained from MCF7 cells expressing GFP-AURKA or GFP-AURKA-mCherry as in (D). (F) (Left) Abundance of AURKA and AURKA Lys162Met 6xHis cDNA and normalised to that of TOMM70 in total and mitochondrial fractions of HEK293; (right) corresponding quantification. AURKA was detected with an anti-His antibody. n = 3 independent experiments. Scale bar: 10 µm. AURKA46 and AURKA38 are indicated by blue and red flags, respectively. A.U.: arbitrary units. Data represent means ±s.e.m. *p<0.05, ***p<0.001 compared to the compared to the ‘AURKA-GFP’ condition (B), the corresponding ‘GFP-AURKA’ condition (D) or to each ‘Total AURKA’ condition (F). NS: not significant.
Figure 3 with 3 supplements
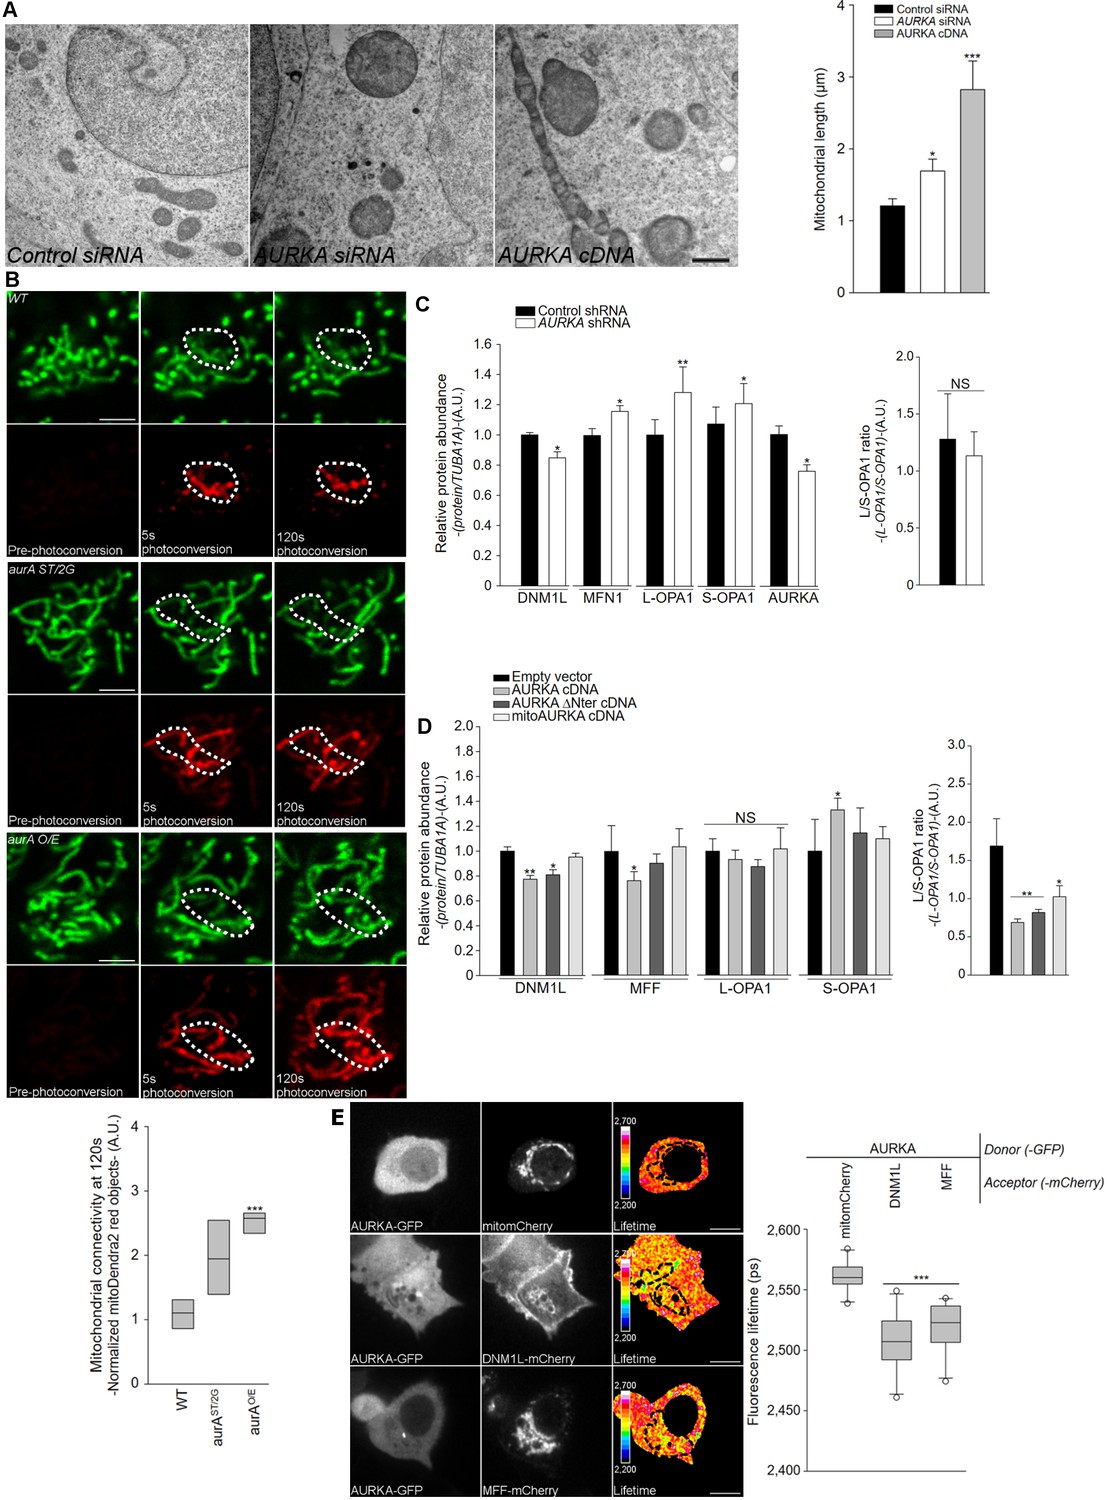
AURKA promotes mitochondrial fusion in cellulo and in vivo.
(A) Mitochondrial ultrastructure of HEK293 cells by TEM transfected with control (first panel) or AURKA-specific (second panel) siRNAs, or with a cDNA encoding AURKA (third panel); quantification of mitochondrial length (fourth panel). n = 20 images per condition from two independent experiments. Scale bar: 200 nm. (B) MitoDendra2 photoconversion analysis for mitochondrial connectivity in wildtype (WT) flies, AURKA null (AurA ST/2G) and gain-of-function (AurA O/E) Drosophila mutants. Photoconversion area: dotted line. n = 80 images per condition from eight independent pupae obtained from three independent crossings. Scale bar: 5 µm. A.U.: arbitrary units. (C) Quantification of the abundance of the indicated mitochondrial fusion and fission proteins of total lysates of HEK293 cells transfected with control or AURKA-specific shRNAs. (D) Quantification of the indicated mitochondrial proteins from total lysates of HEK293 cells transfected with an empty vector, 6xHis AURKA or the indicated variants all fused to a 6xHis tag and blotted. n = 3 independent experiments. (E) FRET by FLIM analysis on MCF7 cells expressing AURKA-GFP together with DNM1L-mCherry, MFF-mCherry or with a mitochondrially-targeted mCherry (mitomCherry) used as a control. Mitochondria: dotted area. (Right panels). Pseudocolour scale: pixel-by-pixel lifetime. Scale bar: 10 µm. Data represent means ±s.e.m., *p<0.05, **p<0.01, ***p<0.001 compared to the corresponding ‘Control siRNA’ condition (A, C), ‘WT’ genotype at 5 s after photoconversion (B), the ‘Empty vector’ condition (D) or ‘AURKA-GFP/mitomCherry’ donor-acceptor pair (E).
Figure 3—figure supplement 1
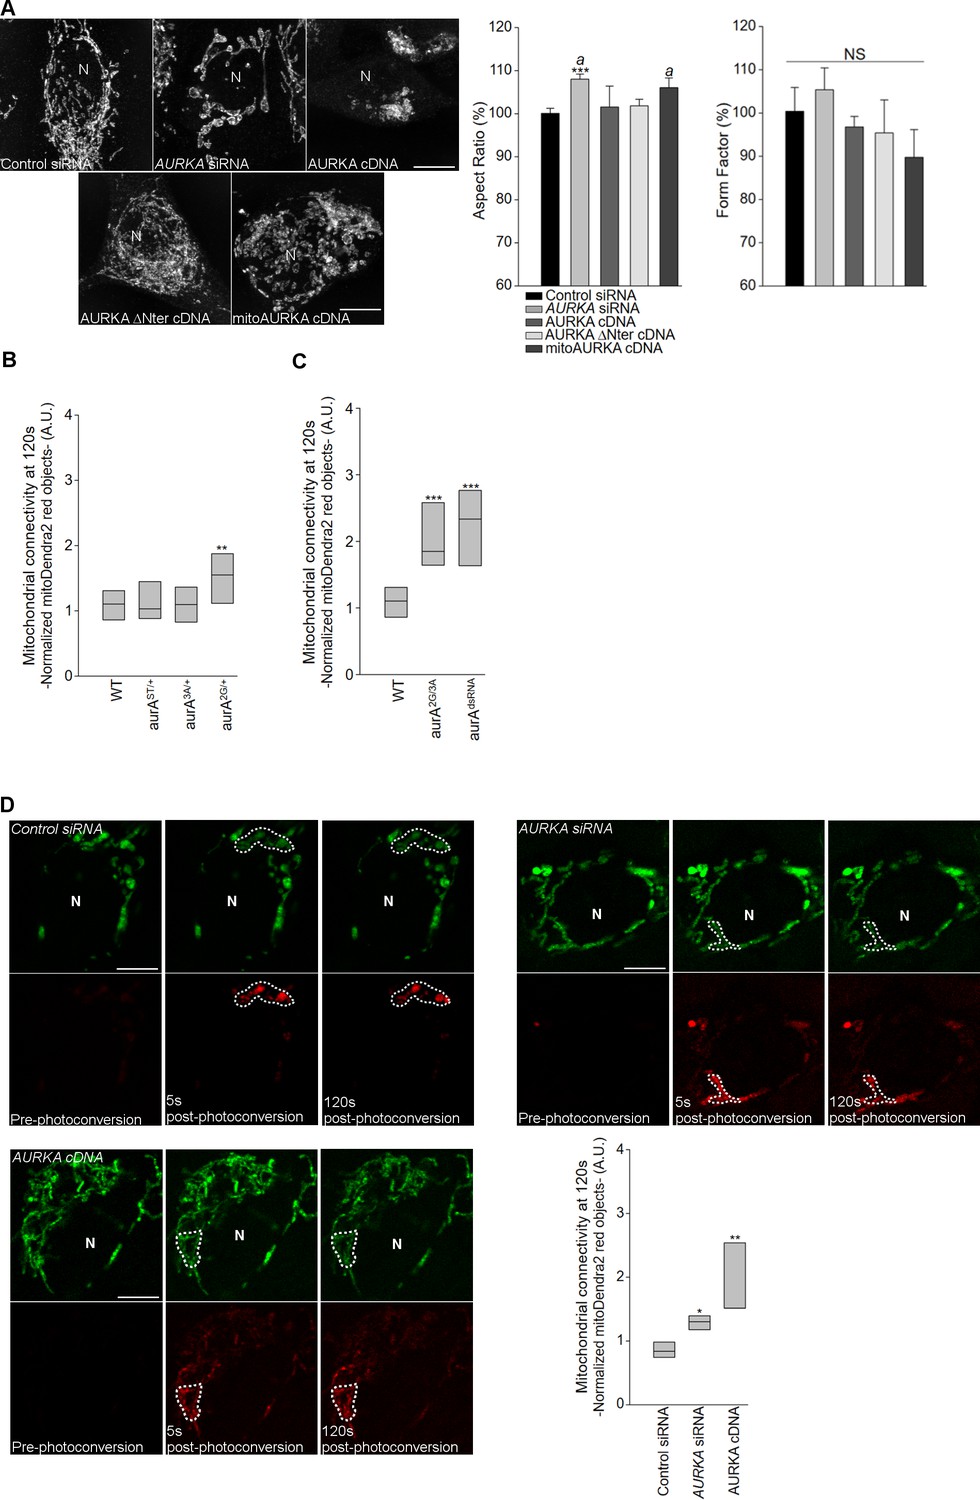
AURKA remodels the mitochondrial network by increasing mitochondrial connectivity.
(A) (Left) Representative micrographs of the mitochondrial networks of MCF7 cells transfected with control or AURKA-specific siRNAs or overexpressing normal AURKA or the indicated AURKA variants all fused to a 6xHis tag. Mitochondria were stained with PMPCB. N: nucleus. Scale bar: 10 µm. (Right) Corresponding quantification of mitochondrial length (determined by aspect ratio) and branching (determined by form factor). n = 30 cells per condition from one representative experiment (of three). (B–C) Calculation of the number of red mitochondria at 120 s after photoconversion normalised against the quantity of mitochondria in the ROI 5 s after photoconversion of Drosophila pupae under the ST/+, 3A/+or 2 G/+genetic backgrounds (B), and under the 2G/3A genetic background or in flies harbouring an RNAi against aurA (aurAdsRNA) (C). n = 80 images per condition from eight independent pupae obtained from three independent crossings. A.U.: arbitrary units. (D) Representative micrographs showing the red and green species of mitoDendra2 at and 5 s and 120 s after photoconversion and analysis of normalised red mitochondria at 120 s after photoconversion in MCF7 cells transfected with a control or AURKA-specific siRNAs, or a cDNA encoding AURKA fused to a 6xHis tag. The photoconversion area is indicated by a dotted line. n = 30 images per condition from three independent experiments. A.U.: arbitrary units. Data represent means ±s.e.m. *p<0.05, **p<0.01, ***p<0.001 compared to each corresponding ‘Control siRNA’ condition (A), the ‘WT’ genotype (B–C), or the ‘Control siRNA condition at 5 s after photoconversion’ (D). aP <0.05 compared to the ‘AURKA cDNA’ condition. NS: not significant.
Figure 3—figure supplement 2
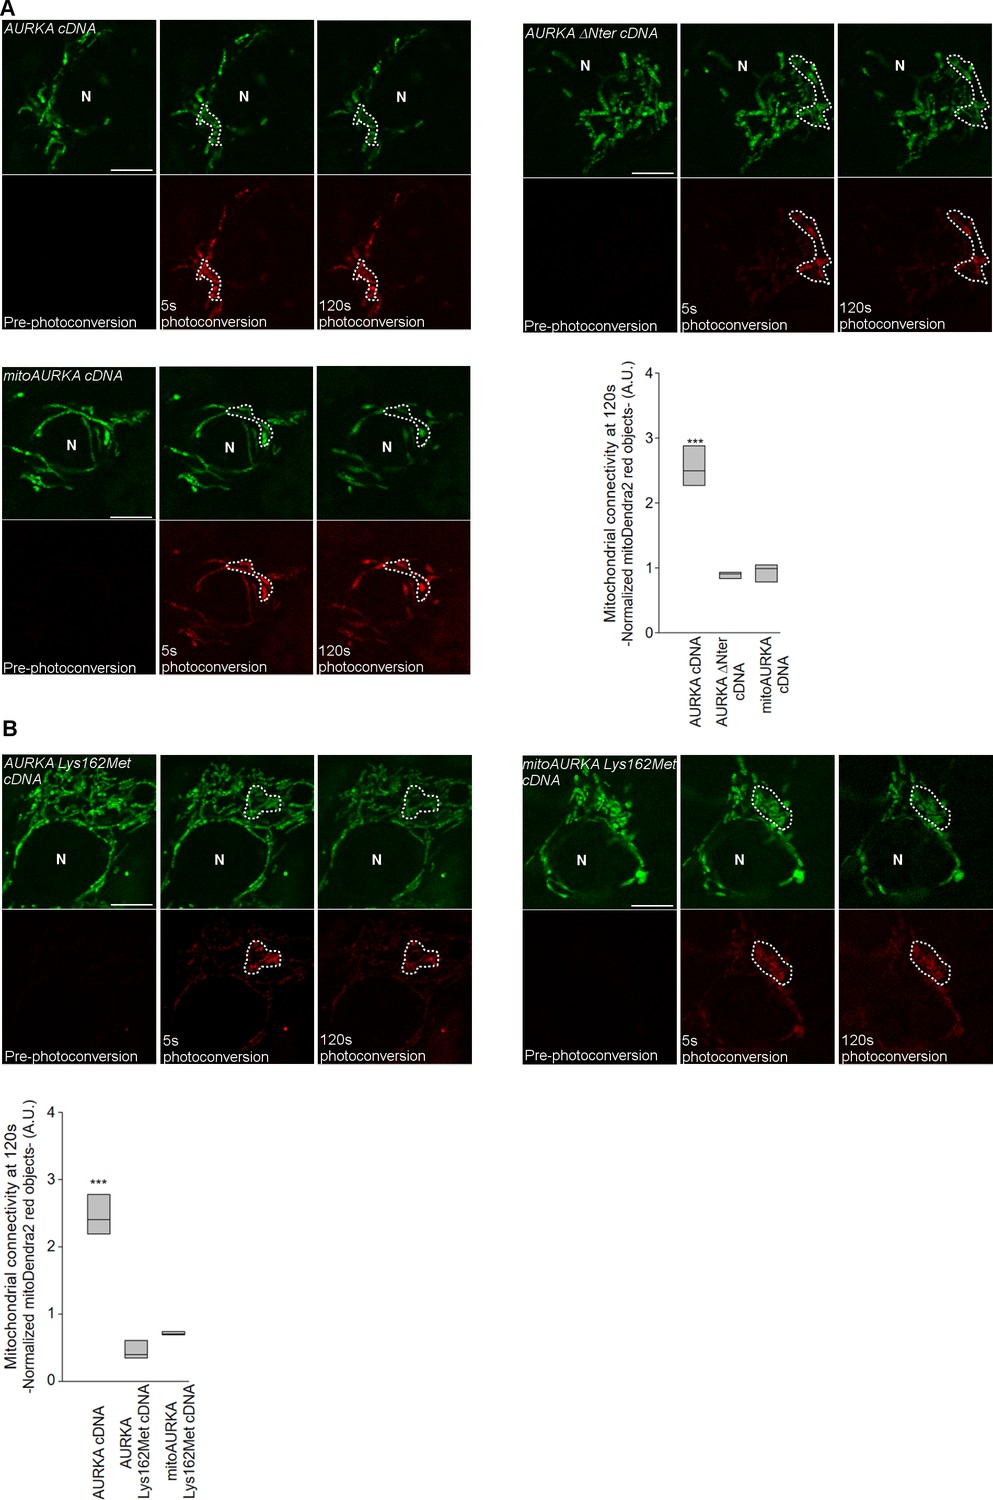
Mitochondrial connectivity requires the import/export cycle of AURKA and its catalytic activity.
(A–B) Representative micrographs showing the red and green species of mitoDendra2 before and 5 s and 120 s after photoconversion, and analysis of the number of red mitochondria at 120 s after photoconversion normalised against the quantity of mitochondria in the Region of Interest (ROI) 5 s after photoconversion in MCF7 cells transfected with AURKA 6xHis, AURKA ΔNter or mitoAURKA 6xHis cDNAs (A), and AURKA Lys162Met 6xHis or mitoAURKA Lys162Met 6xHis cDNAs (B). The photoconversion area is indicated by a dotted line. n = 30 images per condition from three independent experiments. N: nucleus. Scale bar: 5 µm. ***p<0.001 compared to all other conditions.
Figure 3—figure supplement 3
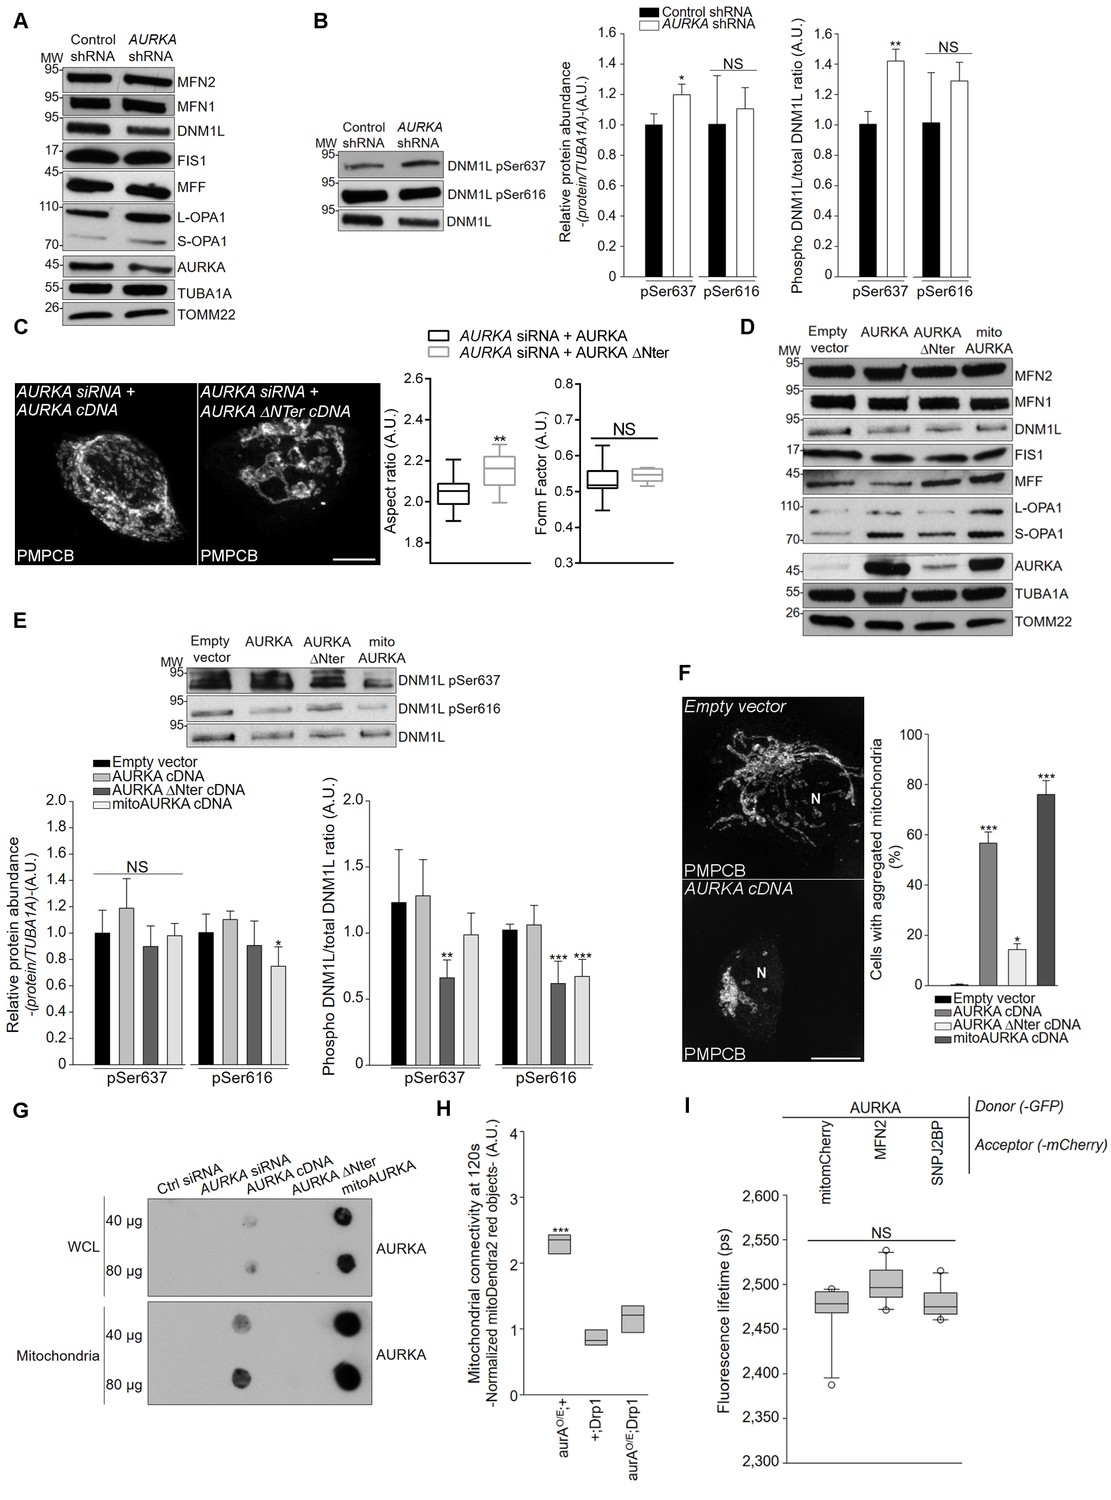
AURKA regulates mitochondrial fission when expressed at physiological levels while ectopic AURKA drives mitochondrial clustering and enhances mitochondrial fusion.
(A) Total lysates of HEK293 cells transfected with control or AURKA-specific shRNAs and blotted for the indicated mitochondrial fusion and fission proteins. TOMM22: loading control. (B) Western blot of total lysates of HEK293 cells transfected as indicated and immunoblotted for total DNM1L or for phosphorylated Ser637 and Ser616 (pSer637 and pSer616 respectively) and quantification of the levels of total DNM1L, pSer637 DNM1L, and pSer616 DNM1L normalised to TUBA1A, and of the abundance of pSer637 DNM1L and pSer616 DNM1L each normalised to total DNM1L. n = 3 independent experiments. (C) Representative micrograph (left) and quantification (right) of the length and the branching of the mitochondrial network in MCF7 cells transfected with an AURKA-specific siRNA and expressing normal or ΔNter AURKA under the endogenous AURKA promoter. n = 30 images per condition obtained from three independent experiments. Scale bar: 10 µm. (D) Total lysates of HEK293 cells transfected with an empty vector, AURKA or the indicated variants all fused to a 6xHis tag and blotted for the indicated mitochondrial fusion and fission proteins. TOMM22: loading control. (E) Representative blot and corresponding quantification of the levels of total DNM1L, pSer637 DNM1L, and pSer616 DNM1L normalised to TUBA1A, and of the abundance of pSer637 DNM1L and pSer616 DNM1L each normalised to total DNM1L in cells transfected as in (D). n = 3 independent experiments. (F) Representative micrograph (left) and quantification (right) of mitochondrial clusters observed in MCF7 cells under the indicated transfection conditions. N: nucleus. n = 30 images per condition obtained from three independent experiments. Scale bar: 10 µm. (G) Representative dot-blot filter retardation assays of whole cell lysates (WCL) and mitochondrial fractions from HEK293 cells transfected with 6xHis AURKA-cDNA, AURKAΔNter or mitoAURKA. Only SDS-insoluble aggregates are retained on the membrane. Forty or 80 µg of protein was loaded (as indicated) and immunoblotted for AURKA. (H) Analysis of the number of red mitochondria at 120 s after photoconversion normalised against the quantity of mitochondria in the ROI 5 s after photoconversion in Drosophila pupae over-expressing AurA with or without over-expressing Drp1. n = 80 images per condition from eight independent pupae obtained from three independent crossings. (I) GFP lifetime quantifications of the indicated donor-acceptor pairs in mitochondria. n = 10 images from one representative experiment (of three). Data represent means ±s.e.m; boxplot data range from the 10th to the 90th percentile. *p<0.05, **p<0.01, ***p<0.001 compared to the corresponding ‘Control shRNA’ condition (B), to the ‘AURKA siRNA + AURKA’ condition (C), to the ‘Empty vector’ condition (E, F), or to the aurAO/E; +’ condition (H). NS: not significant.
Figure 4
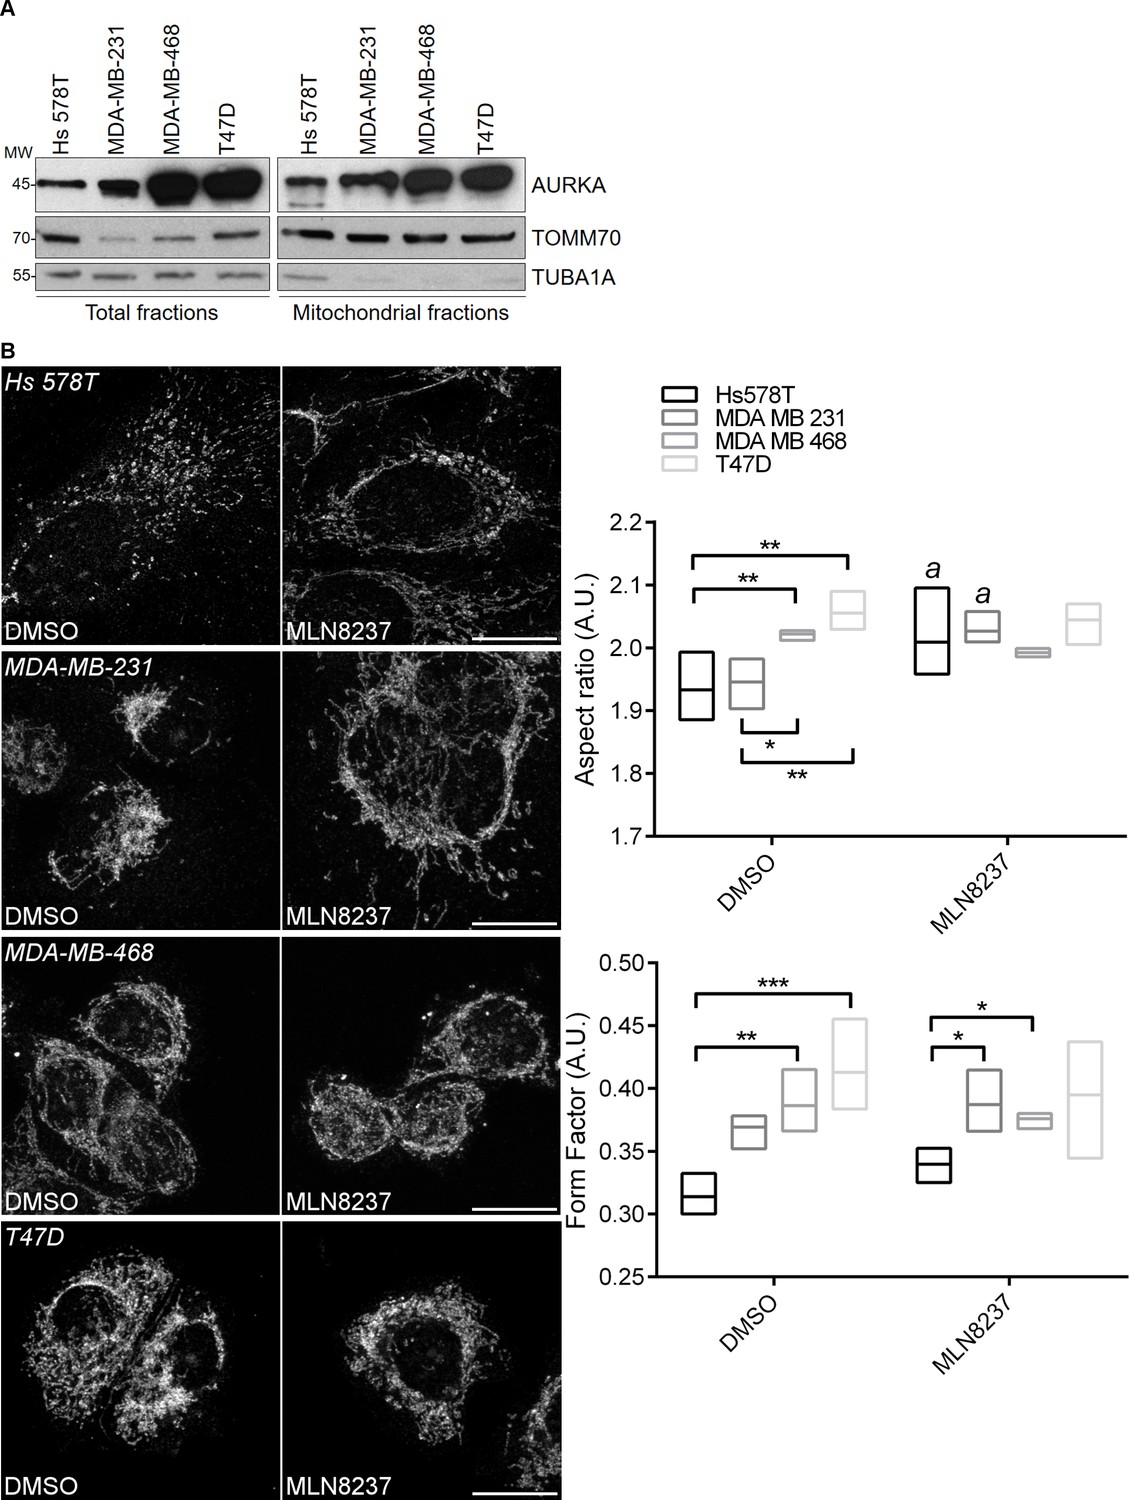
AURKA regulates mitochondrial dynamics in four carcinoma cell lines.
(A) Representative western blots (of three) of total and mitochondrial fractions from Hs578T, MDA-MB-231, MDA-MB-468 and T47D carcinoma cells, which were probed for endogenous AURKA, TOMM70 and TUBA1A. (B) Representative fluorescence micrographs and corresponding quantifications of mitochondrial length (aspect ratio) and branching (form factor), and illustrating the mitochondrial network morphology in each of the four cell lines used in (A). Mitochondria were stained with an anti-PMPCB antibody. Where indicated, cells were treated with 100 nM MLN8237 for 3 hr prior to fixation. Scale bar: 10 µm. *p<0.05, **p<0.01, ***p<0.001 for the indicated comparisons, a = P < 0.05 compared to the corresponding ‘DMSO’ condition.
Figure 5 with 1 supplement
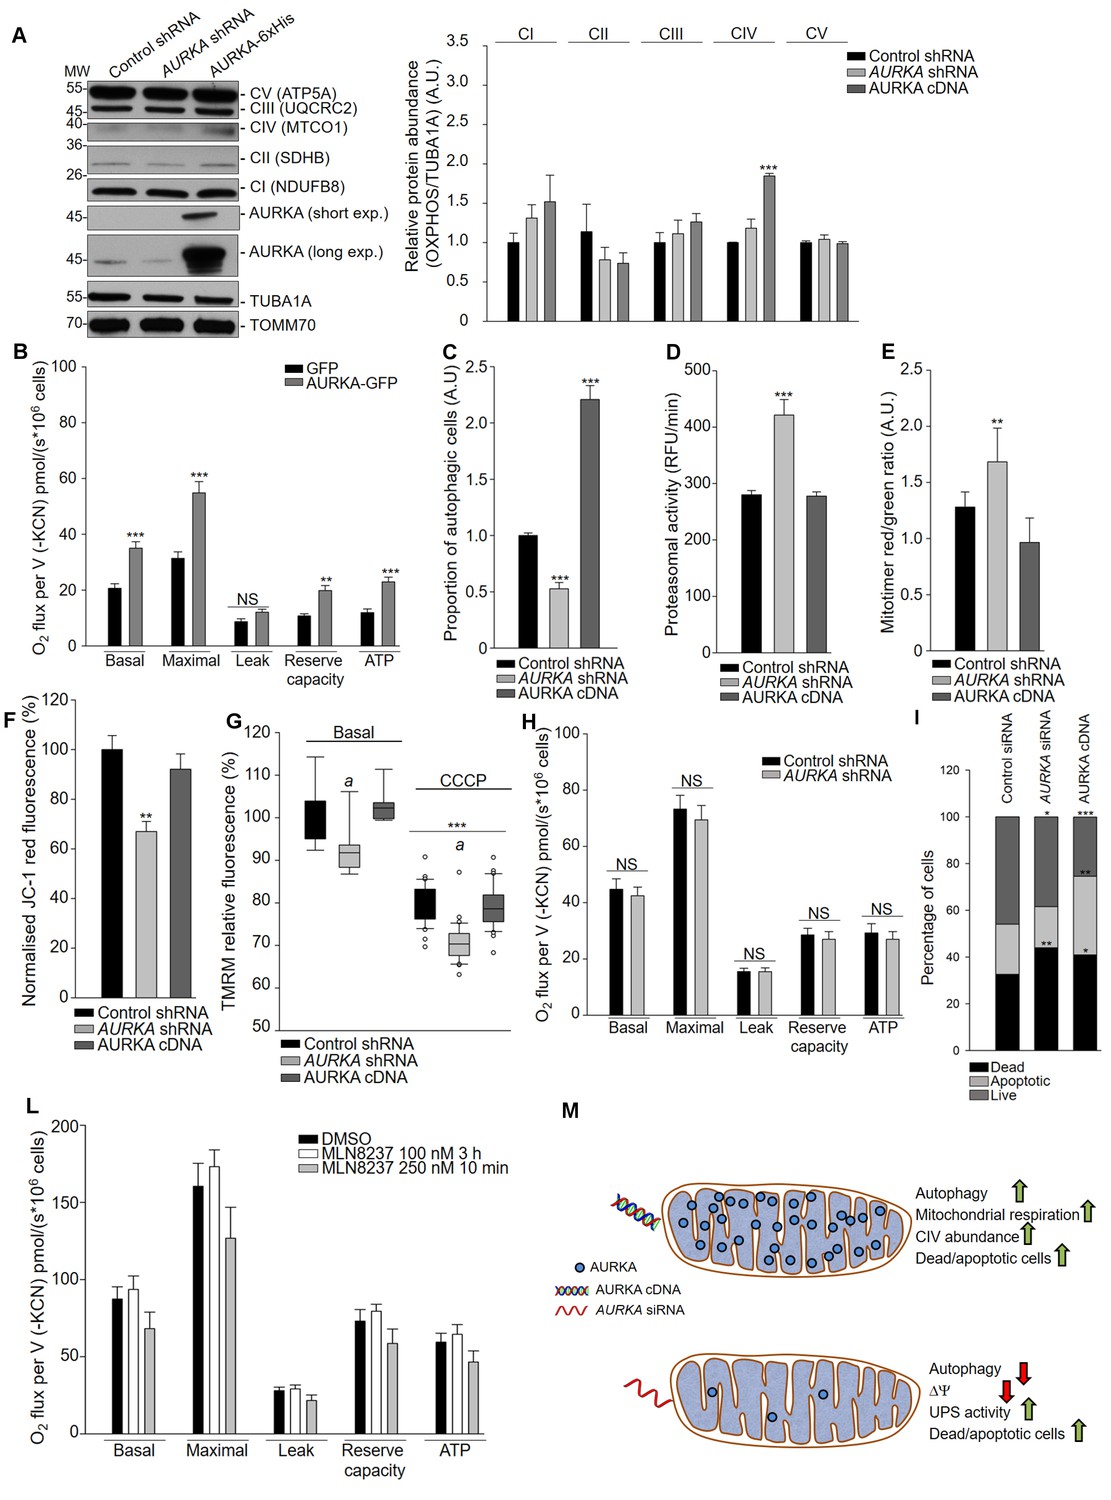
Ectopic AURKA increases mitochondrial respiration together with the abundance and the functionality of the mitochondrial respiratory chain.
(A) (Top) Western blot of total lysates of HEK293 cells transfected as indicated and (bottom) corresponding quantification of the relative abundances of the indicated oxidative phosphorylation complexes subunits, representing the abundance of the five oxidative phosphorylation complexes. n = 3 independent experiments. (B) Mitochondrial respiration of HEK293 cells over-expressing GFP or AURKA-GFP. n = 3 independent experiments. (C) Percentage of MCF7 cells over-expressing or silenced for AURKA and with activated MAP1LC3A-II and analysed by flow cytometry. n = 3 independent experiments. (D) Proteasomal activity in MCF7 cells transfected as indicated and analysed by flow cytometry. n = 3 independent experiments. RFU: relative fluorescence units. (E) MitoTimer red/green ratio in MCF7 cells transfected as indicated. n = 3 independent experiments. (F) Red fluorescence of the mitochondrial potentiometric probe JC-1 in MCF7 cells transfected as indicated and analysed by flow cytometry. The decrease in red JC-1 fluorescence provides a readout of ΔΨloss. n = 3 independent experiments. (G) TMRM relative fluorescence of MCF7 cells transfected as indicated and treated with DMSO (basal conditions) or carbonyl cyanide m-chlorophenyl hydrazone (CCCP). n = 3 independent experiments. (H) Mitochondrial respiration of HEK293 cells over-expressing a control or an AURKA-specific shRNA. n = 3 independent experiments. (I) Percentage of live, apoptotic and dead MCF7 cells analysed by flow cytometry and identified by the incorporation of Annexin V. n = 3 independent experiments. (L) Mitochondrial respiration of HEK293 cells treated with DMSO or MLN8237 at a concentration of 100 nM for 3 hr or of 250 nM for 10 min. n = 3 independent experiments. (M) Cartoon diagram of AURKA silencing or overproduction acting differentially on key mitochondrial functions. Green arrows: upregulation; red arrows: downregulation. UPS: ubiquitin-proteasome system; CIV: mitochondrial complex IV. Data represent means ±s.e.m. ***p<0.001 compared to each corresponding ‘Control shRNA’ condition, (A, C–F), the ‘GFP’ condition (B), each ‘basal’ condition (G), or to each corresponding ‘Control siRNA’ condition (H–I). aP <0.01 compared to the corresponding ‘Control siRNA’ condition for each treatment (G). All comparisons in (L) were not significant.
Figure 5—figure supplement 1
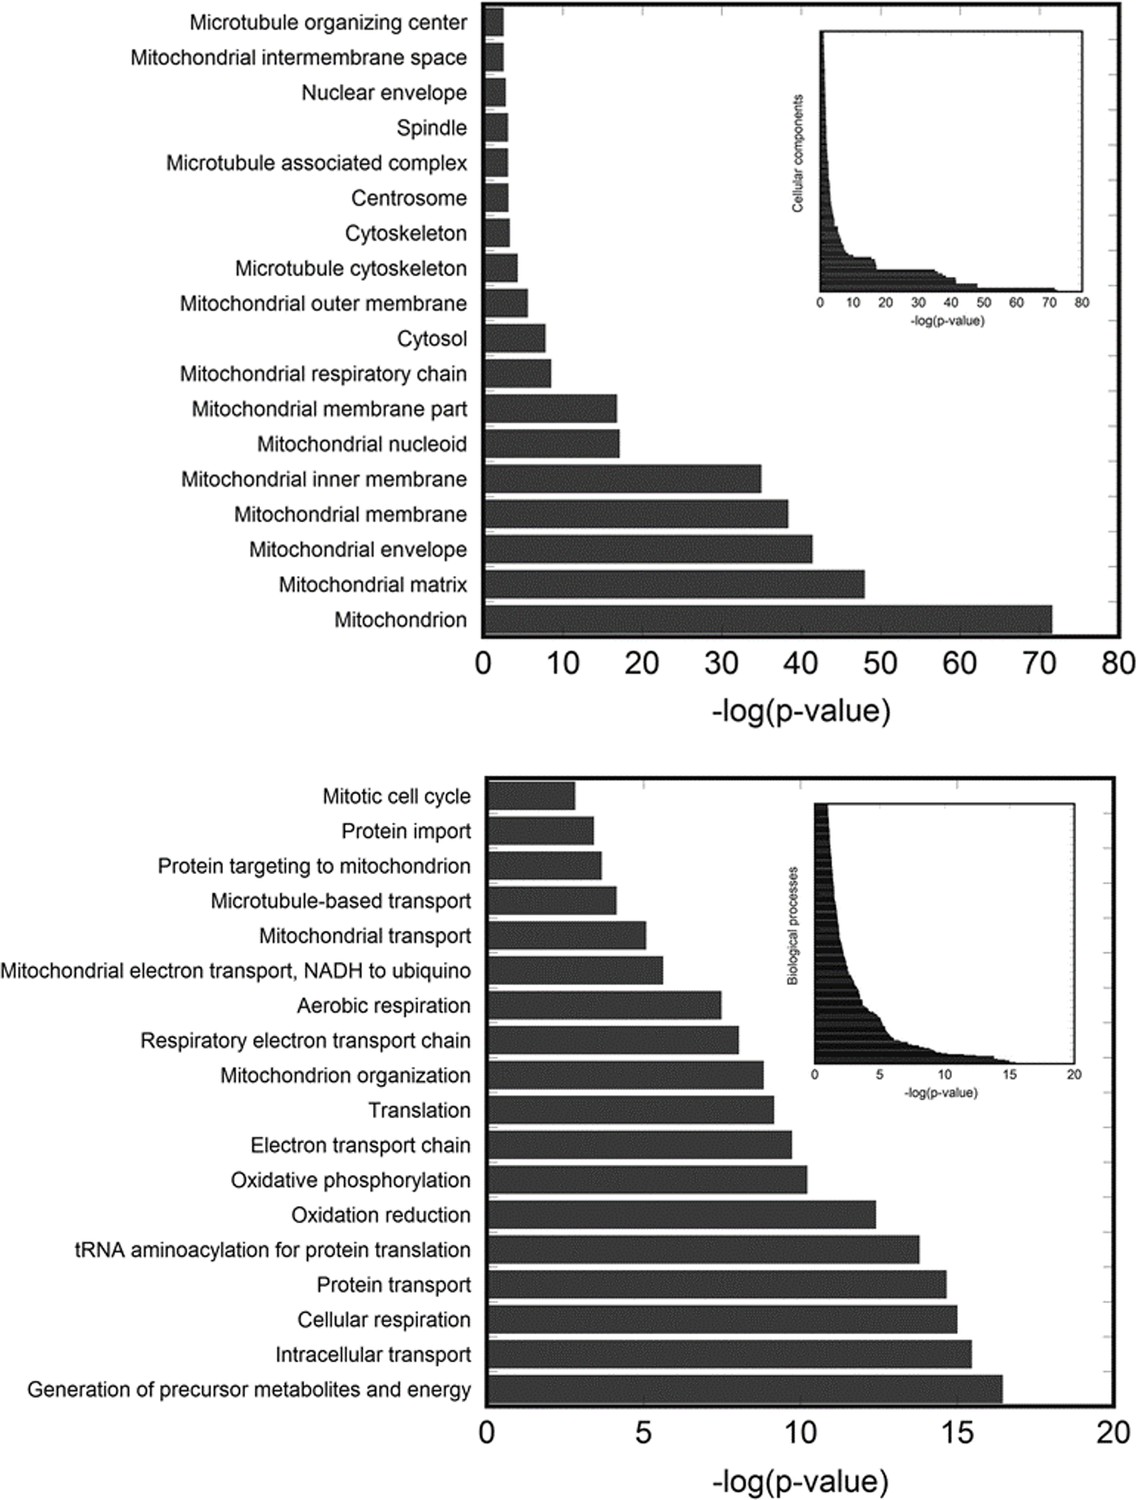
Mitochondria-associated proteins co-eluting with affinity-purified AURKA-GFP are over-represented.
Mitochondria-associated proteins co-eluting with affinity-purified AURKA-GFP are over-represented. The histograms summarize the enrichment analysis of Gene Ontology (GO) terms using annotations for the filtered AURKA protein interaction dataset using the CRAPome contaminant repository database (641 putative AURKA-interacting proteins). Selected predominant terms in Cellular components and Biological processes subontologies were plotted relative to their p values (top and bottom panels, respectively). The inset plots correspond to the global distribution of all GO terms for each categories (refer to the Materials and methods section for complete protein datasets, statistical analysis and Gene Ontology classifications).
Figure 6
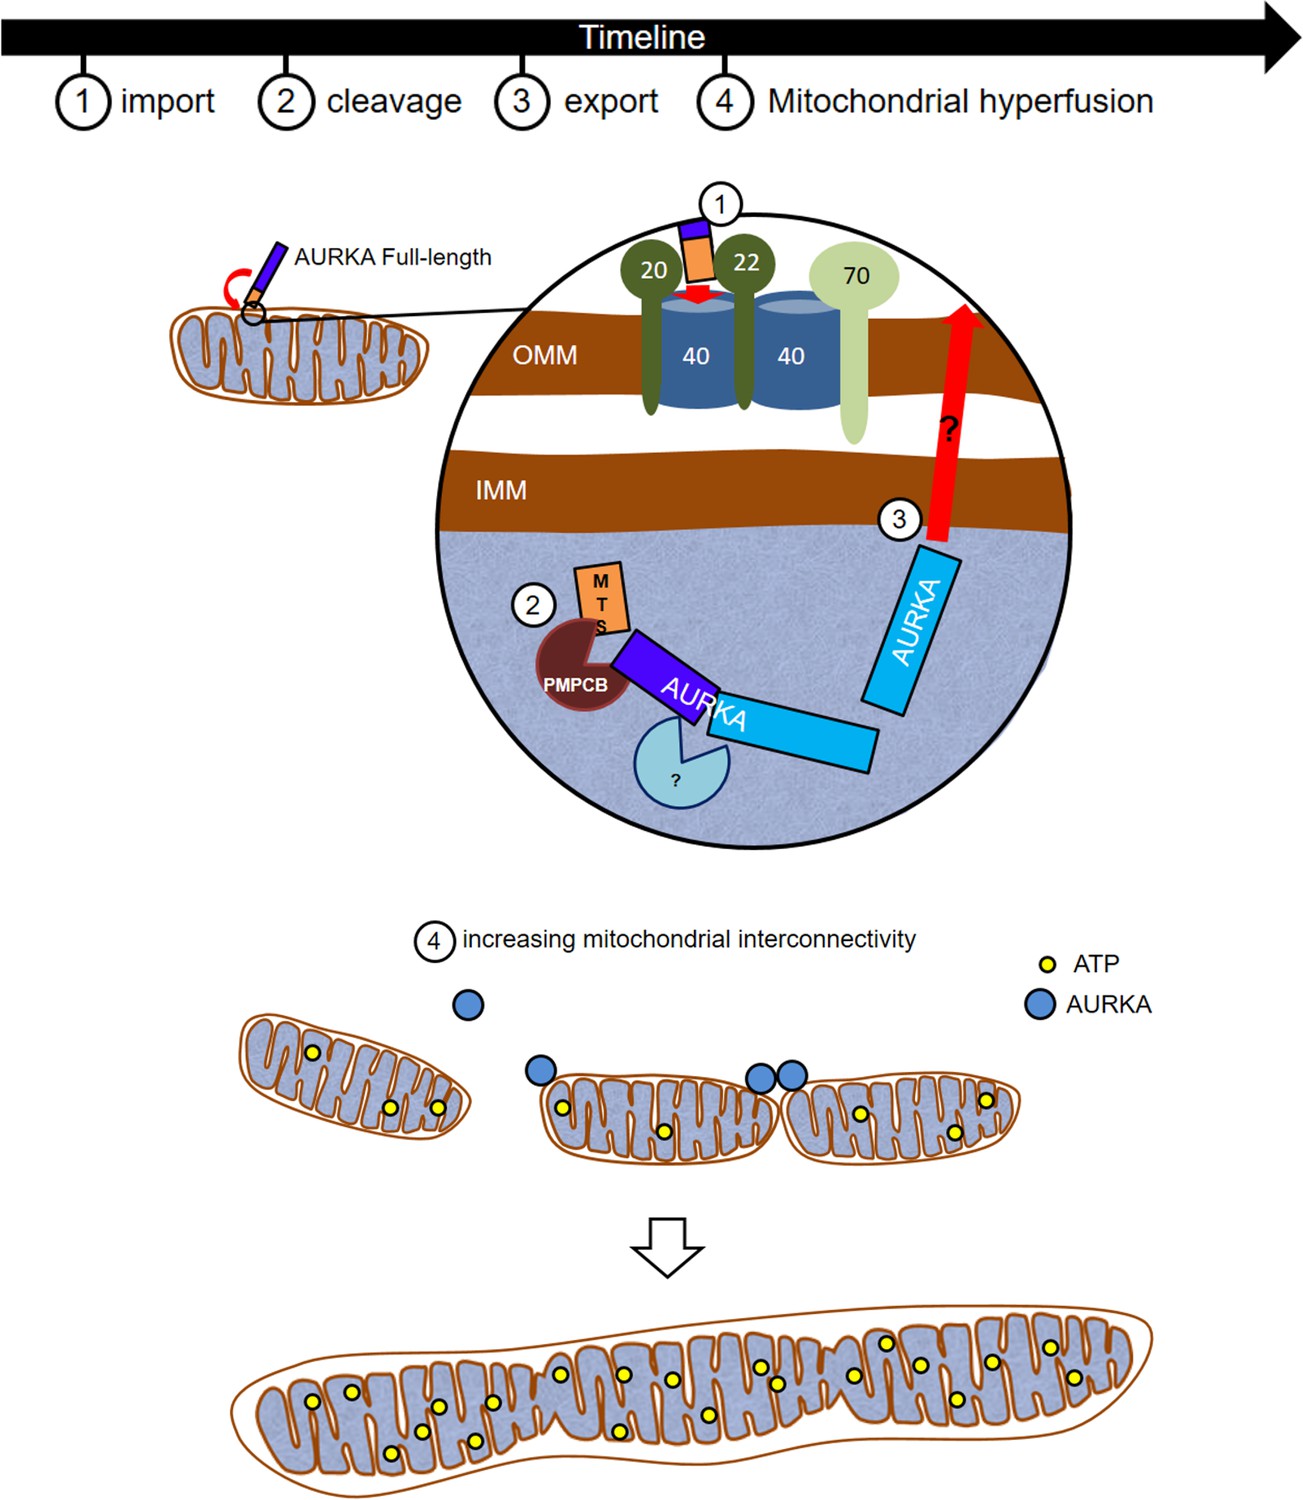
AURKA induces mitochondrial hyperfusion via its import/export cycle to enhance mitochondrial ATP production.
(1-3) Timeline and corresponding representation of the import of AURKA via TOMM, the first proteolytic cleavage of AURKA inside the mitochondrial matrix by the PMPCB protease and the second proteolytic cleavage by a still unknown protease. Subsequent mechanisms leading to the export of AURKA in the cytosol after mitochondrial cleavage remain to be elucidated. (4) Exported AURKA induces the fusion of remaining mitochondria in an interconnected network. AURKA-dependent mitochondrial fusion leads to increased ATP levels.
Author response image 1

Total lysates from HEK293 cells obtained by immediate lysis in Laemmli sample buffer.
Cells were blotted for endogenous AURKA, TUBA1A and PMPCB. AURKA46 and AURKA38 are indicated with a blue and red arrowhead, respectively.
Author response image 2

Fluorescence lifetime quantification of MCF7 cells transfected with AURKA-GFP and an empty vector (-) or DNM1L-mCherry, and silenced or not for RALA.
*** P<0.001; NS: not significant.
Tables
Key resources table
| Reagent type (species) or resource | Designation | Source or reference | Identifiers | Additional information |
|---|---|---|---|---|
| Genetic reagent (D. melanogaster) | WT (w1118) | NA | NA | |
| Genetic reagent (D. melanogaster) | Sca-Gal4 | PMID: 2125959 | NA | |
| Genetic reagent (D. melanogaster) | mitoDendra2 | Dr. Thomas Rival (University of Marseille) | NA | |
| Genetic reagent (D. melanogaster) | aurA ST | PMID: 23685146 | NA | |
| Genetic reagent (D. melanogaster) | aurA 3A | this paper | NA | aurA3A indel |
| Genetic reagent (D. melanogaster) | aurA 2G | this paper | NA | aurA2G indel |
| Genetic reagent (D. melanogaster) | aurA dsRNA | Vienna Drosophila RNAi Center | VDRC: 108446 | |
| Genetic reagent (D. melanogaster) | aurA exel | Bloomington Drosophila Stock Center | BDSC: 8376 | |
| Genetic reagent (D. melanogaster) | aurA exel | Bloomington Drosophila Stock Center | BDSC: 8377 | |
| Genetic reagent (D. melanogaster) | Drp1 | Bloomington Drosophila Stock Center | BDSC: 51647 | |
| Cell line (H. sapiens) | MCF7 | ATCC | HTB-22 | Maintained in DMEM supplemented with 10% FBS, 1% penicillin/streptomycin and 1% L-Glutamine |
| Cell line (H. sapiens) | HEK293 | ATCC | CRL-1573 | Maintained in DMEM supplemented with 10% FBS, 1% penicillin/streptomycin and 1% L-Glutamine |
| Cell line (H. sapiens) | Hs578T | ATCC | HTB-126 | Maintained in the Legembre Lab in DMEM supplemented with 10% FBS, 1% penicillin/streptomycin and 1% L- Glutamine |
| Cell line (H. sapiens) | MDA-MB-231 | ATCC | HTB-26 | Maintained in the Legembre Lab in DMEM supplemented with 10% FBS, 1% penicillin/streptomycin and 1% L- Glutamine |
| Cell line (H. sapiens) | MDA-MB-468 | ATCC | HTB-132 | Maintained in the Legembre Lab in DMEM supplemented with 10% FBS, 1% penicillin/streptomycin and 1% L- Glutamine |
| Cell line (H. sapiens) | T47D | ATCC | HTB-133 | Maintained in the Legembre Lab in DMEM supplemented with 10% FBS, 1% penicillin/streptomycin and 1% L- Glutamine |
| Antibody | AURKA | Merck Millipore | PC742 | 1:1000 |
| Antibody | AURKA | home made | clone 5C3 (ref. 48 of this paper) | 1:20 |
| Antibody | Drp1 | BD Pharmingen | 611112 | 1:2000 |
| Antibody | Drp1 pS616 (DA91) | Cell Signaling | 4494 | 1:1000 |
| Antibody | Drp1 pS637 | Cell Signaling | 4867 | 1:1000 |
| Antibody | Fis1 (TTC1) clone EPR8412 | abcam | ab156865 | 1:1000 |
| Antibody | GFP | Roche/Sigma Aldrich | 11814460001 | 1:1000 |
| Antibody | Histone H3 pS10 | Millipore | 06–570 | 1:10,000 |
| Antibody | His tag | Covalab | mab90001-P | 1:3000 in 3% BSA |
| Antibody | Mff | abcam | ab81127 | 1:500 |
| Antibody | MitoFusin 1 | abcam | ab57602 | 1:1000 |
| Antibody | MitoFusin 2 | abcam | ab56889 | 1:500 |
| Antibody | Opa1 | abcam | ab157457 | 1:1000 |
| Antibody | OXPHOS Rodent WB Antibody Cocktail | Mitosciences | ab110413 | 1:1000 |
| Antibody | PMPCB | Proteintech | 16064–1-AP | 1:1000 |
| Antibody | RalA S194 | Millipore | 07–2119 | 1:1000 |
| Antibody | Tom22 | Abcam | ab10436 | 1:500 |
| Antibody | Tom70 | Abcam | ab106193 | 1:5000 |
| Antibody | Tubulin alpha clone YL1/2 | Millipore | MAB1864 | 1:5000 |
| Antibody | VDAC1 | Abcam | ab15895 | 1:1000 |
| Chemical compound, drug | MLN8237/Alisertib | Selleck chemicals | S1133 | |
| Chemical compound, drug | TMRM | Thermo Fischer scientific | T668 | |
| Sequence-based reagent | Allstar Control siRNA | Qiagen | SI03650318 | |
| Sequence-based reagent | AURKA siRNA | Eurogentec | NA | sequence 5'-AUGCCCUG UCUUACUGUCA-3' |
| Sequence-based reagent | RALA siRNA | Qiagen | SI03650318 | |
| Sequence-based reagent | PMPCB siRNA | Dharmacon | L-004747- 00–0005 | |
| Recombinant DNA reagent | AURKA shRNA | Sigma Aldrich | SHCLNG-NM_003600 | |
| Recombinant DNA reagent | Control shRNA | Sigma Aldrich | SHC002 |
Additional files
-
Supplementary file 1
Identification of the semi-tryptic peptides of AURKA.
The cleavage sites identified by the analysis of AURKA N- and C-ragged semi-tryptic peptides of human AURKA are indicated. Cleavage sites shown in grey derive from peptides containing aromatic residues (Phe, Tyr, Trp) that spontaneously give rise to truncated semi-tryptic fragments during MS/MS analysis. The cleavage sites shown in red originate from semi-tryptic peptides, devoid of aromatic residues, which are potentially generated by the action of mitochondrial proteases.
- https://doi.org/10.7554/eLife.38111.016
-
Supplementary file 2
Identification of the AURKA interactome at interphase.
We report on different pages: the protein UNIPROT IDs, the common biological contaminants obtained after the CRAPome analysis, the proteins with a known mitochondrial localization found among the AURKA interactome; the Gene Ontology (GO) cellular components and biological processes for the AURKA-interacting proteins and the known AURKA interactors found in this analysis.
- https://doi.org/10.7554/eLife.38111.017
-
Supplementary file 3
Plasmid vectors used in this study.
This file includes the source of the plasmids, eventual cloning sites (when applicable) and primers used for site-directed mutagenesis.
- https://doi.org/10.7554/eLife.38111.018
-
Supplementary file 4
Drosophila strains used in this study.
This file includes the name, the genotype and the source/identifier of the Drosophila strains used.
- https://doi.org/10.7554/eLife.38111.019
-
Supplementary file 5
Drosophila crossings.
This file includes the genotype of the Drosophila crossings used in this study, together with the corresponding figure panels.
- https://doi.org/10.7554/eLife.38111.020
-
Supplementary file 6
Primary antibodies used for western blotting.
This file includes the primary antibodies used in this study together with the brand name, the catalogue number and the dilution used.
- https://doi.org/10.7554/eLife.38111.021
-
Supplementary file 7
Primary and secondary antibodies used for electron microscopy.
This file includes the primary and secondary antibodies used together with the brand name, the catalogue number and the dilution used.
- https://doi.org/10.7554/eLife.38111.022
-
Transparent reporting form
- https://doi.org/10.7554/eLife.38111.023
Download links
A two-part list of links to download the article, or parts of the article, in various formats.
Downloads (link to download the article as PDF)
Open citations (links to open the citations from this article in various online reference manager services)
Cite this article (links to download the citations from this article in formats compatible with various reference manager tools)
Aurora kinase A localises to mitochondria to control organelle dynamics and energy production
eLife 7:e38111.
https://doi.org/10.7554/eLife.38111


