WNT signaling memory is required for ACTIVIN to function as a morphogen in human gastruloids
- The Rockefeller University, United States
Figures
Figure 1
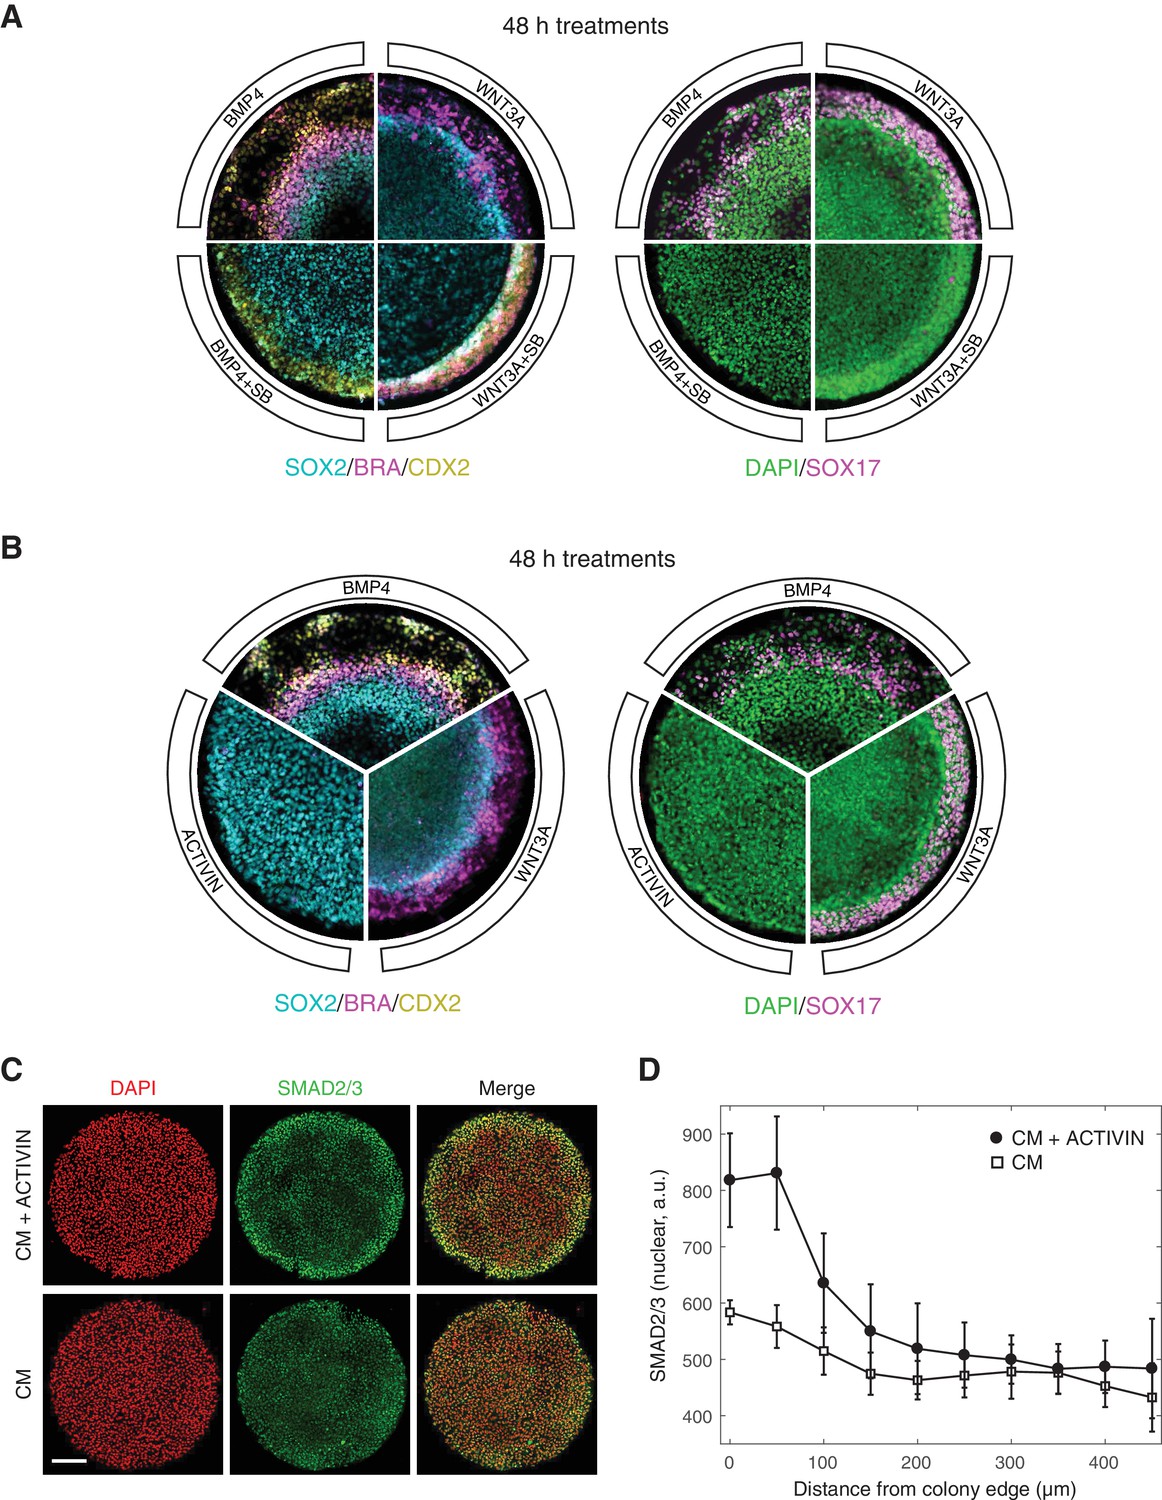
ACTIVIN modifies gastruloid differentiation but it cannot induce it.
(A) Micropatterned colonies in conditioned media treated for with BMP4 (50 ng/mL), BMP4 (50 ng/mL) +SB (10 µM), WNT3A (100 ng/mL), or WNT3A (100 ng/mL) +SB (10 µM) for 48 hr. The colonies were fixed and analyzed by immunofluorescence. Left: SOX2 (cyan), BRA (magenta), CDX2 (yellow). Right: DAPI (green), SOX17 (magenta). (B) Micropatterned colonies in conditioned media treated with BMP4 (50 ng/mL), WNT3A (100 ng/mL), or ACTIVIN (100 ng/mL) for 48 hr. The colonies were fixed and analyzed by immunofluorescence. Left: SOX2 (cyan), BRA (magenta), CDX2 (yellow). Right: DAPI (green), SOX17 (magenta). (C–D) Micropatterned colonies in conditioned media (CM) treated with ACTIVIN (100 ng/mL) for 1 hr or left untreated. The colonies were fixed and analyzed by immunofluorescence. (C) Images: DAPI (red), SMAD2/3 (green). Scale bar, 200 µm. (D) Quantification of the mean SMAD2/3 nuclear fluorescence as a function of radial position from the colony edge: CM + ACTIVIN (filled circles), CM (open squares). Error bars represent the standard deviation across n = 5 (CM) and n = 6 (CM + ACTIVIN) colonies from one experiment. All micropatterned culture experiments were performed on at least three separate occasions with similar results.
Figure 2 with 5 supplements
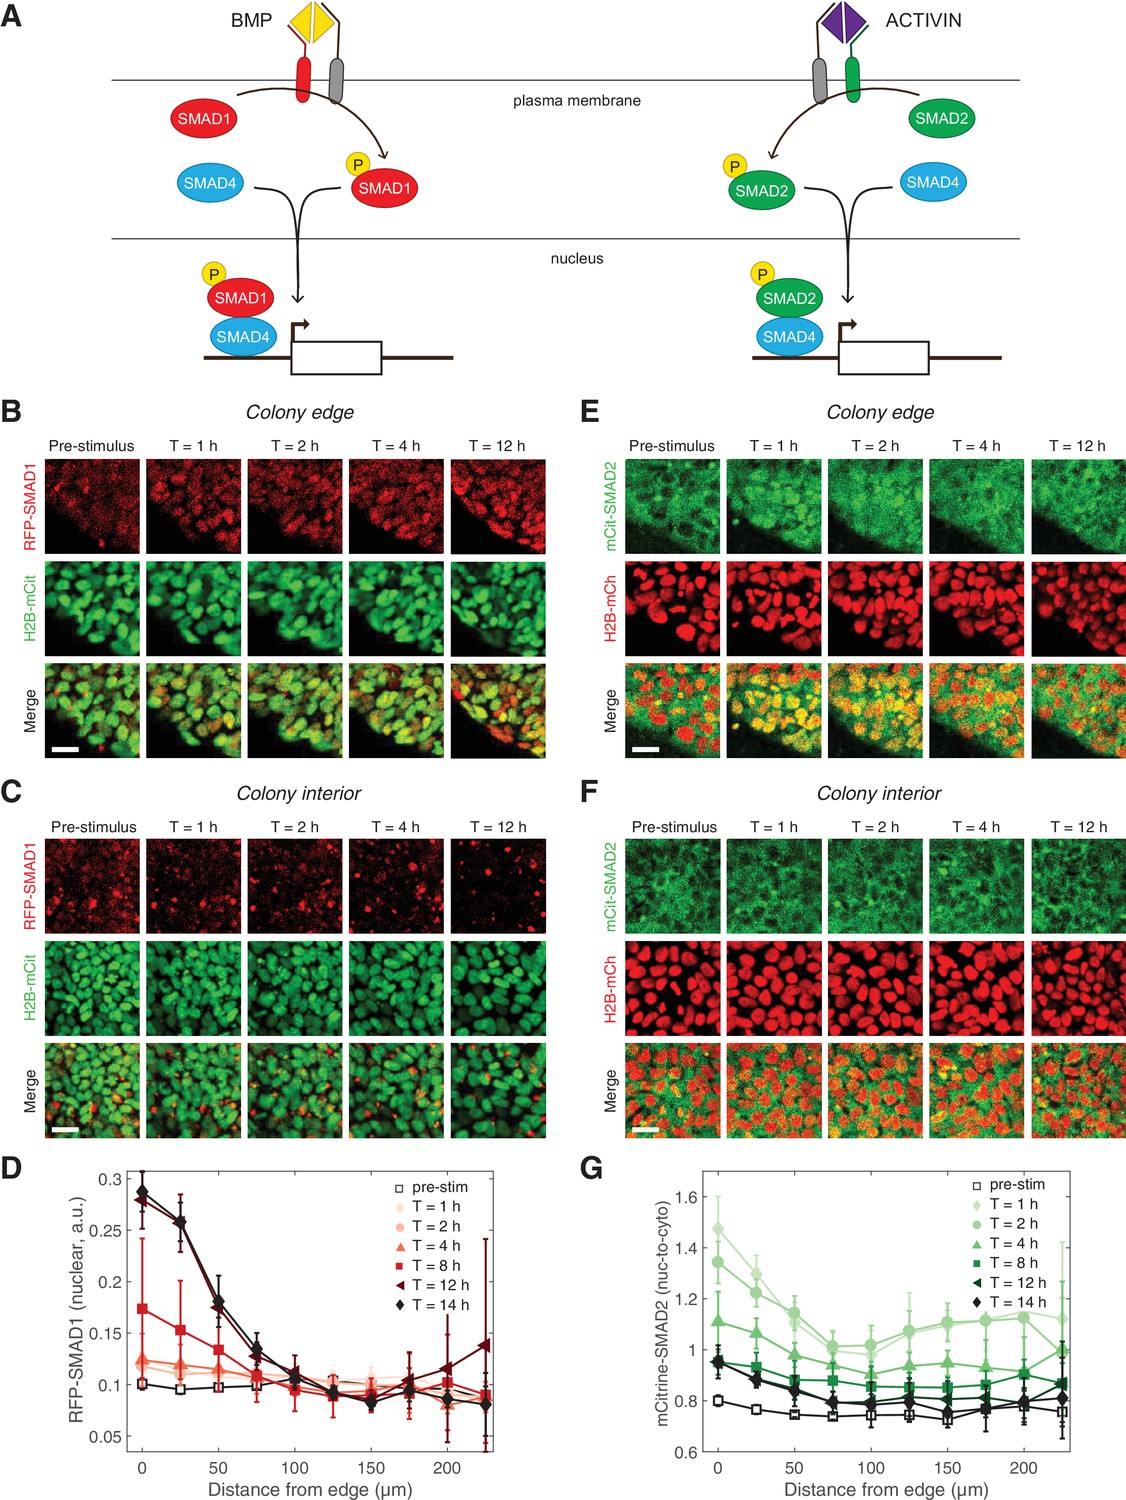
Two branches of the TGFβ pathway display different signaling dynamics.
(A) BMP and ACTIVIN signaling represent the two branches of the TGFβ pathway. BMP signals through R-SMAD1 and ACTIVIN signals through R-SMAD2. R-SMADs form a complex with co-SMAD4 and the complex regulates target gene expression. (B–C) RUES2-RFP-SMAD1 grown on micropatterned colonies in E7 and stimulated with BMP4 (50 ng/mL). The response of cells at the colony edge (B) and near the colony center (C) as a function of time following BMP4 presentation. The intensity range was adjusted to the same minimum and maximum values in all images in both (B) and (C). Scale bars, 25 µm. (D) Average RFP-SMAD1 nuclear signal as a function of radial position within the colony at different time points following BMP4 treatment. The single-cell nuclear RFP-SMAD1 intensity was quantified and normalized to the single-cell H2B-mCitrine signal. Error bars represent the standard deviation over n = 5 colonies from one experiment. (E–F) RUES2-mCit-SMAD2 grown on micropatterned colonies in E7 and stimulated with ACTIVIN (10 ng/mL). The response of cells at the colony edge (E) and near the colony center (F) as a function of time following ACTIVIN presentation. The intensity range was adjusted to the same minimum and maximum values in all images in both (E) and (F). Scale bars represent 25 µm. (G) Average mCitrine-SMAD2 nuclear-to-cytoplasmic signal as a function of radial position within the colony at different time points following ACTIVIN treatment. The single-cell nuclear mCitrine intensity was quantified and normalized to the single-cell cytoplasmic mCitrine signal. Error bars represent the standard deviation over n = 5 colonies from one experiment.
Figure 2—figure supplement 1
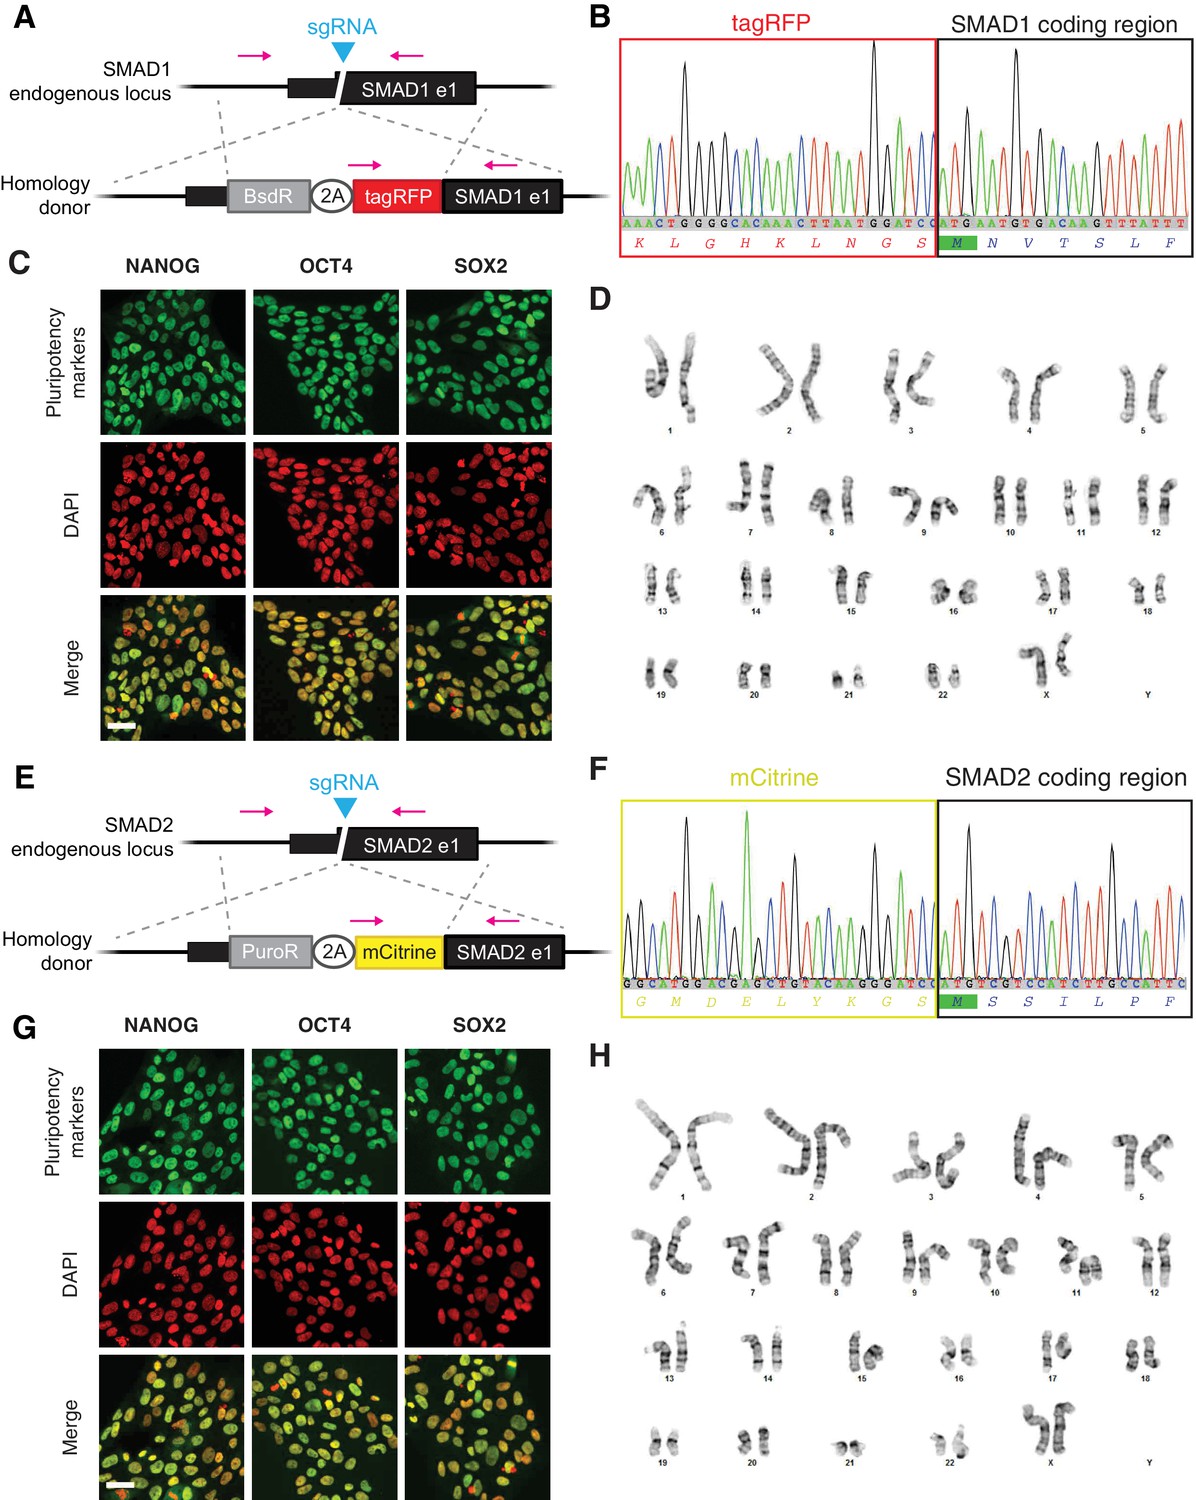
R-SMAD reporter line generation.
(A) Schematic of the modification of the endogenous SMAD1 locus via CRISPR/Cas9 genome engineering. A blasticidin resistance gene (BsdR) is separated from the tagRFP-SMAD1 fusion by a T2A self-cleaving peptide. The SMAD1 coding sequence (e1) and the upstream untranslated regions are not affected by the modification. (B) Sequence analysis using loci specific primers (magenta arrows in A) demonstrated that both of the SMAD1 alleles had been modified. The trace shows the modified allele sequence. (C) RUES2-RFP-SMAD1 cells maintain expression of pluripotency markers under standard growth conditions. Separate samples were prepared for each marker and immunofluorescence staining was carried out using Alexa Fluor 647-conjgated secondary antibodies to avoid signal from the reporter constructs: NANOG, OCT4, and SOX2 (green) and DAPI (red). Scale bar, 50 µM. (D) RUES2-RFP-SMAD1 has a normal XX karyotype. (E) Schematic of the modification of the endogenous SMAD2 locus via CRISPR/Cas9 genome engineering. A puromycin resistance gene (PuroR) is separated from the mCitrine-SMAD2 fusion by a T2A self-cleaving peptide. The SMAD2 coding sequence (e1) and the upstream untranslated regions are not affected by the modification. (F) Sequence analysis using loci specific primers (magenta arrows in E) demonstrated that only one of the SMAD2 alleles had been targeted. The trace shows the modified allele sequence. (G) RUES2-mCit-SMAD2 cells maintain expression of pluripotency markers under standard growth conditions. Separate samples were prepared for each marker and immunofluorescence staining was carried out using Alexa Fluor 647-conjgated secondary antibodies to avoid signal from the reporter constructs: NANOG, OCT4, and SOX2 (green) and DAPI (red). Scale bar, 50 µM. (H) RUES2-mCit-SMAD2 has a normal XX karyotype.
Figure 2—figure supplement 2
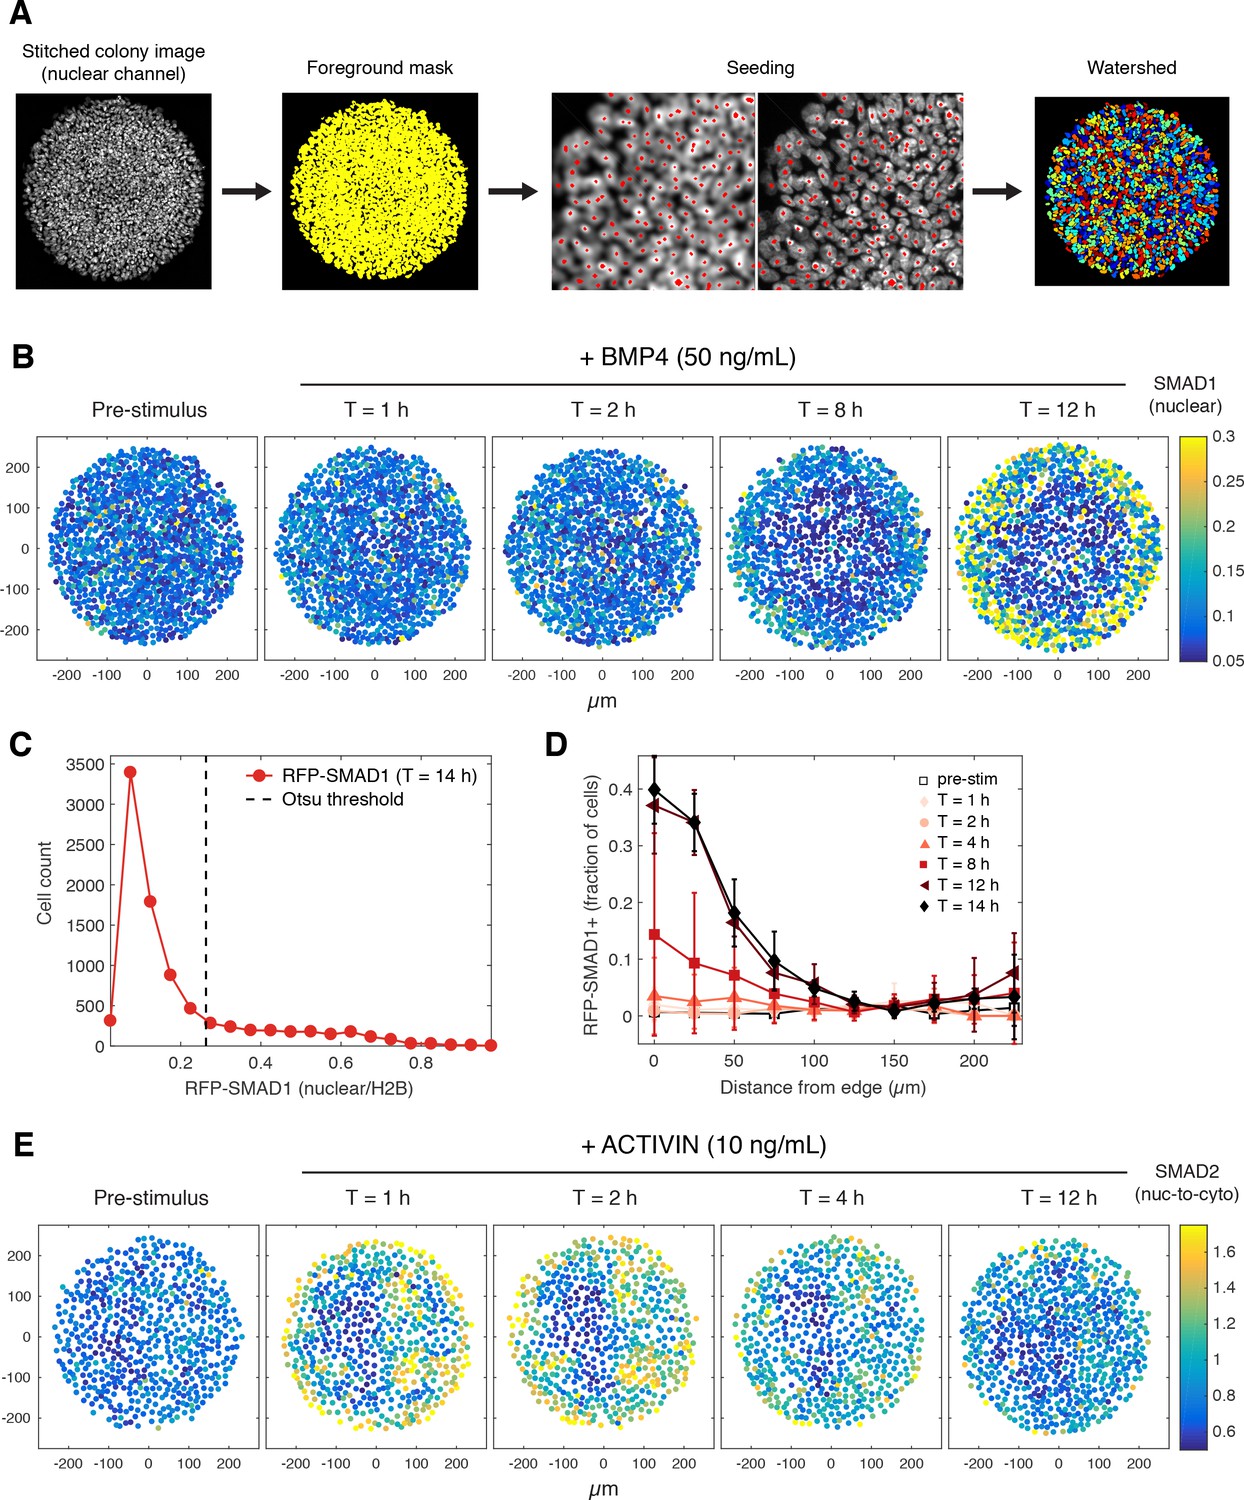
Quantification of R-SMAD dynamics at the single-cell level in micropatterned colonies.
(A) Schematic of the image analysis pipeline for micropatterned culture experiments. The stitched and background-corrected nuclear channel image was thresholded to generate a foreground mask. The original image was then filtered and local maxima, representing individual nuclei, were detected and used as seeds for watershed segmentation. (B) RUES2-RFP-SMAD1 grown on micropatterned colonies in E7 and stimulated with BMP4 (50 ng/mL). The RFP-SMAD1 nuclear signal (normalized to H2B) was quantified in individual cells within the micropatterned colony. (C–D) Binary analysis of the SMAD1 response data shown in Figure 2D. (C) The histogram of the RFP-SMAD1 response at T = 14 hr following stimulation with BMP4 was thresholded using Otsu’s method (dashed line). (D) The threshold was applied at each time point to determine the faction of SMAD1 +nuclei as a function of radial position within the colony. Error bars represent the standard deviation over n = 5 colonies from one experiment. (E) RUES2-mCit-SMAD2 grown on micropatterned colonies in E7 stimulated and with ACTIVIN (10 ng/mL). The mCitrine-SMAD2 nuclear-to-cytoplasmic ratio was quantified in individual cells within the micropatterned colony.
Figure 2—video 1
RUES2-RFP-SMAD1 micropatterned colony stimulated with BMP4.
BMP4 (50 ng/mL, added at T = 0 hr). Images were acquired every 10 min in two channels corresponding to H2B-mCitrine and RFP-SMAD1. Time stamp shows hours and minutes (hh:mm). Colony radius, 500 µm.
Figure 2—video 2
RUES2-RFP-SMAD1 micropatterned colony unstimulated.
Images were acquired every 10 min in two channels corresponding to H2B-mCitrine and RFP-SMAD1. Time stamp shows hours and minutes (hh:mm). Colony radius, 500 µm.
Figure 2—video 3
RUES2-mCit-SMAD2 micropatterned colony stimulated with ACTIVIN.
ACTIVIN (10 ng/mL, added at T = 0 hr). Images were acquired every 10 min in two channels corresponding to H2B-mCherry and mCitrine-SMAD2. Time stamp shows hours and minutes (hh:mm). Colony radius, 500 µm.
Figure 3 with 1 supplement
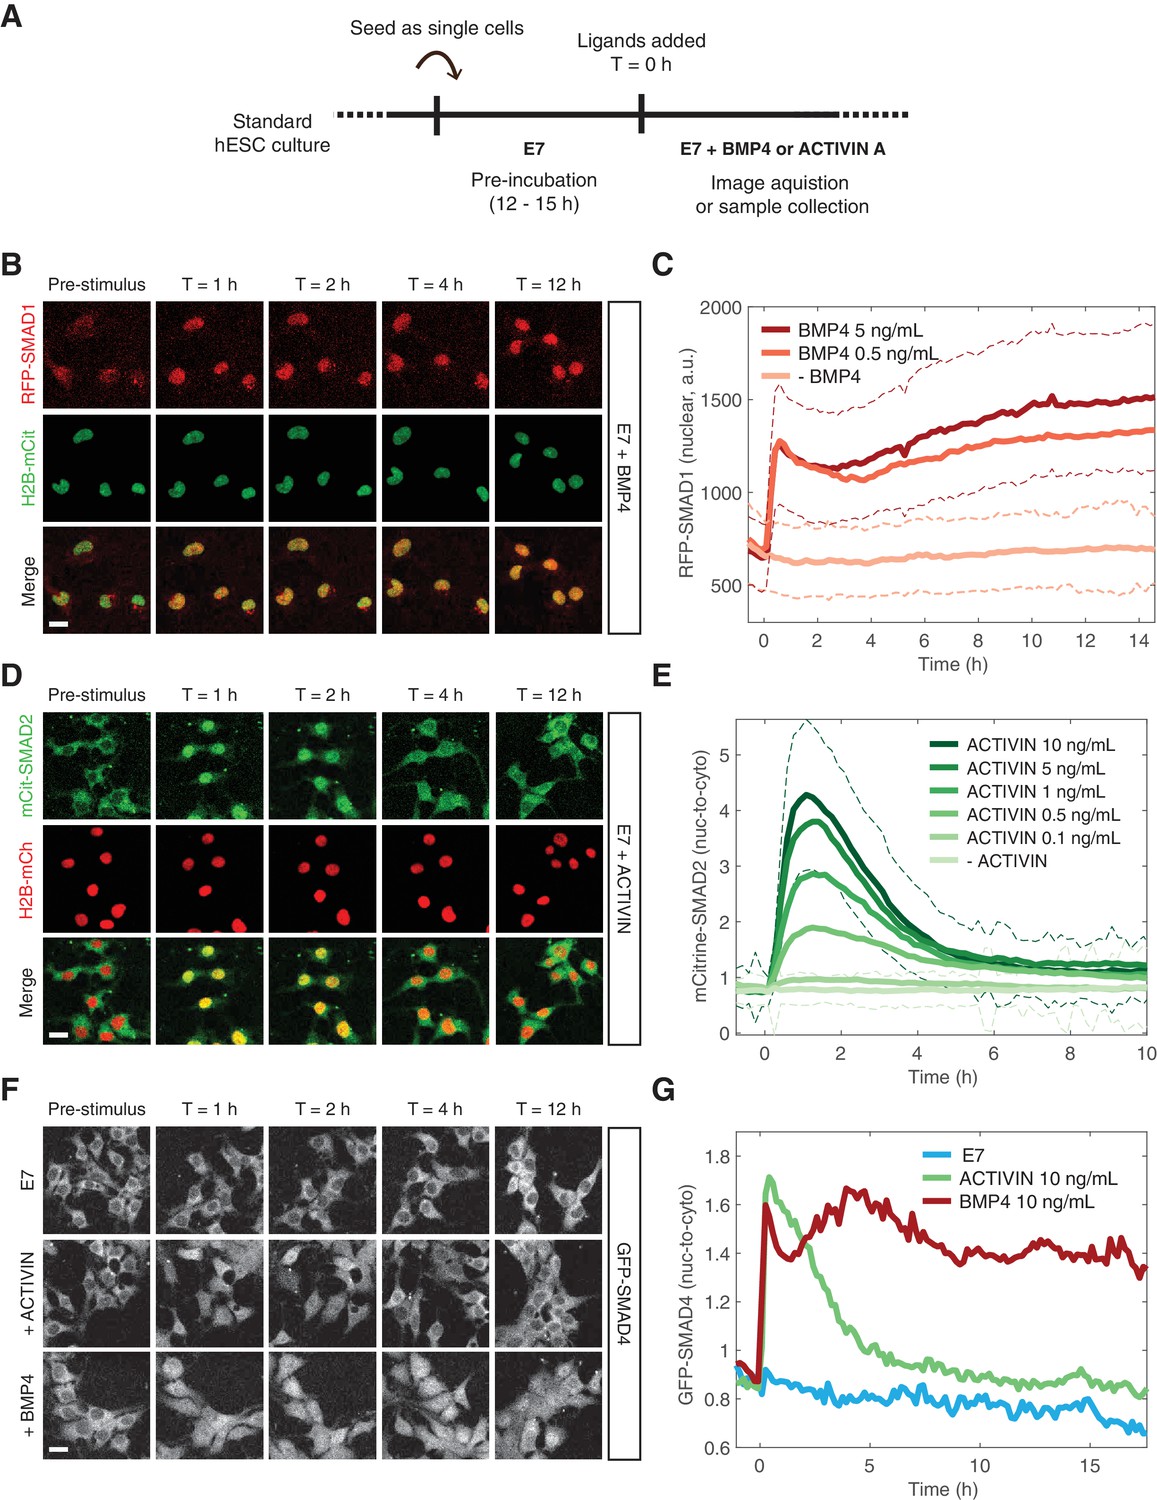
BMP and ACTIVIN elicit different single-cell SMAD response dynamics.
(A) Schematic outlining the single-cell experimental protocol. (B) RFP-SMAD1 response in single cells to BMP4 (5 ng/mL, added at T = 0 hr). (C) Quantification of the RFP-SMAD1 nuclear signal as a function of time and BMP4 concentration. Images were acquired every 10 min. Solid lines represent the average response at each time point (n > 200 cells per time point). Dashed lines represent the population standard deviation for – BMP4 (light red) and BMP4 (5 ng/mL, dark red) conditions. Similar results were obtained in two independent experiments. (D) mCitrine-SMAD2 response in single cells to ACTIVIN (10 ng/mL, added at T = 0 hr). (E) Quantification of the mCitrine-SMAD2 nuclear-to-cytoplasmic ratio as a function of time and ACTIVIN concentration. Images were acquired every 10 min. Solid lines represent the average response at each time point (n > 200 cells per time point). Dashed lines represent the population standard deviation for –ACTIVIN (lightest green) and ACTIVIN (10 ng/mL, darkest green) conditions. Data were collectively obtained from three independent experiments. (F) GFP-SMAD4 response in single cells to ACTIVIN (10 ng/mL) or BMP4 (10 ng/mL) or cells that were left untreated (E7). Ligands were added at T = 0 hr. (G) Quantification of the GFP-SMAD4 nuclear-to-cytoplasmic ratio as a function of time in E7 (blue), E7 +BMP4 (10 ng/mL, red), or E7 +ACTIVIN (10 ng/mL, green). Images were acquired every 10 min. Solid lines represent the average response at each time point (n > 200 cells per time point). Similar results were obtained in two independent experiments. Scale bars, 25 µm.
Figure 3—figure supplement 1
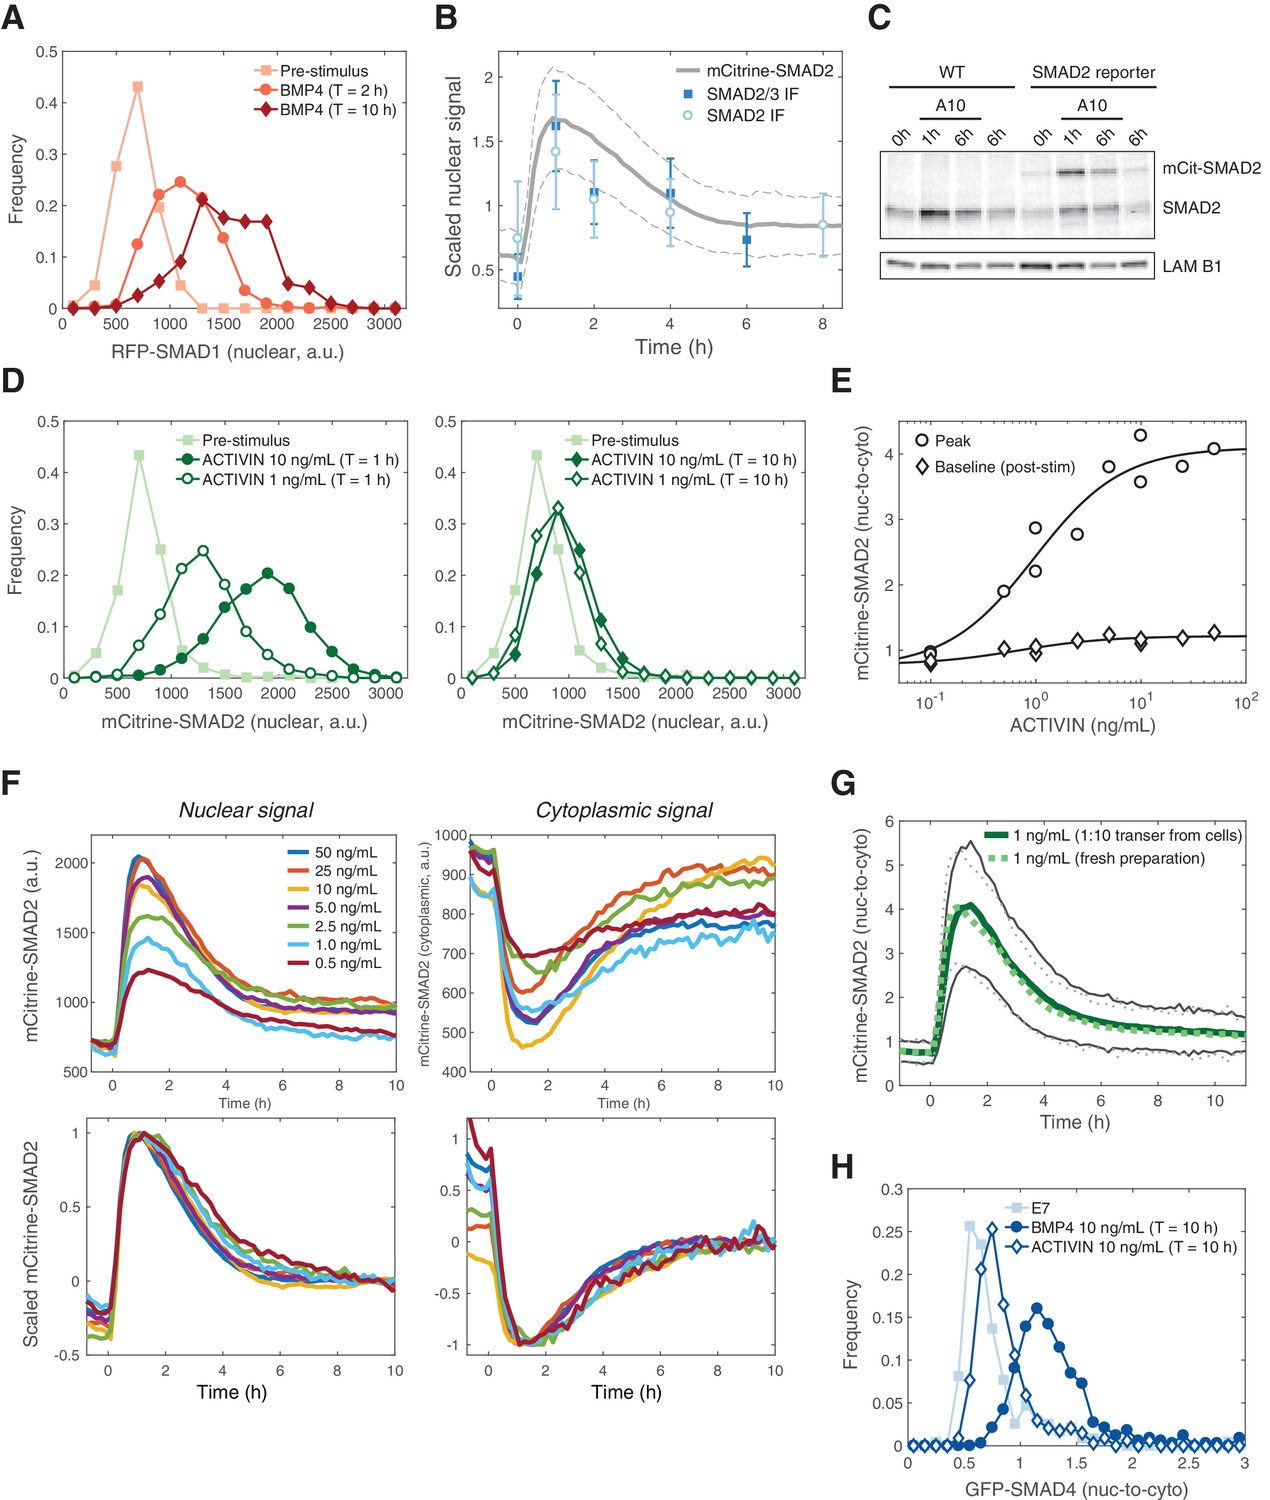
BMP and ACTIVIN elicit different single-cell SMAD response dynamics.
(A) Histograms of the single-cell RFP-SMAD1 nuclear signal at different time points following stimulation with BMP4 (5 ng/mL). (B) Comparison of the average mCitrine-SMAD2 nuclear response of the reporter line (solid gray line) and the response of the unmodified parental line by immunofluorescence using antibodies against SMAD2/3 (blue squares) or SMAD2 (open circles) in single cells treated with ACTIVIN (10 ng/mL). In order to compare the relative changes in fluorescence intensity the signals were scaled by their average value over all time points. The dashed gray lines and the error bars represent the standard deviation at each time point in mCit-SMAD2 (n > 200 cells per time point) and the immunofluorescence measurements (n > 3,000 cells per time point), respectively. Data were collected from three independent experiments. (C) Western blot analysis of SMAD2 in nuclear fractions collected from RUES2 or RUES2-mCit-SMAD2 cells following presentation of ACTIVIN (10 ng/mL). Samples were collected prior to ACTIVIN presentation (T = 0 hr), at two time points following ACTIVIN treatment (T = 1 and 6 hr), and from an untreated sample incubated in E7 (T = 6 hr). (D) Histograms of the single-cell mCitrine-SMAD2 nuclear signal following stimulation with ACTIVIN (10 ng/mL) or ACTIVIN (1 ng/mL) at T = 1 hr (left) and T = 10 hr (right). (E) Peak SMAD2 nuclear-to-cytoplasmic ratio (circles) and post-stimulation baseline ratio (diamonds) as a function of ACTIVIN concentration. The baseline ratio was calculated as the average ratio for T > 8 hr. Solid lines show a Hill fit of the form, where L is the ligand concentration, n is the Hill coefficient, K is the inflection point, and a and b are constants. For the fit to peak response: n = 1.05, K = 0.97, a = 3.37, and b = 0.73. For the fit to the post-stimulation baseline response: n = 1.02, K = 0.68, a = 0.44, and b = 0.78. (F) The average mCitrine-SMAD2 nuclear signal (top left) and cytoplasmic signal (top right) as a function of time and ACTIVIN concentration. The scaled signals (bottom left and right) were normalized by subtracting the tail SMAD2 fluorescence signal (average response at T > 8 hr) and dividing by the peak signal, which is the maximum in the case of the nuclear signal and the minimum in the case of the cytoplasmic signal. Scaling collapses the curves indicating that the time scale of the transient response is similar at each concentration. (G) mCitrine-SMAD2 response to ACTIVIN (1 ng/mL, solid green line) diluted 1:10 from cells incubated for 12 hr with ACTIVIN (10 ng/mL) or freshly prepared ACTIVIN (1 ng/mL, dashed green line). Images were acquired every 10 min. Solid black lines represent the standard deviation for the 1:10 transfer response and dotted grays lines represent the standard deviation for the response to the fresh preparation (n > 200 cells per time point). Similar results were obtained in two independent experiments. (H) Histograms of the single-cell GFP-SMAD4 nuclear-to-cytoplasmic ratio in E7, E7 +BMP4 (10 ng/mL), and E7 +ACTIVIN (10 ng/mL) at T = 10 hr after ligand addition.
Figure 4 with 2 supplements

ACTIVIN/SMAD2 signaling results in stable and transient transcriptional responses.
(A) Hierarchical clustering of RNA-seq time course data for genes showing a fold-change >2 in response to ACTIVIN (10 ng/mL) relative to the pre-stimulus level (T = 0 hr). The gene z-score at each time point was calculated by subtracting the average and dividing by the standard deviation of the normalized read counts across all time points. (B–C) RT-PCR analysis of (B) pluripotency- and (C) mesendoderm-associated genes following presentation of ACTIVIN (10 ng/mL) in the parental RUES2 line (black bars) and the RUES2-SMAD3-/- lines (gray and white bars). An additional sample was collected that was left untreated for the 12 hr time course (untr). Expression in each sample was normalized to GAPDH and then to the pre-stimulus level (T = 0 hr). Data represents the mean ±S.D. for n = 3 technical replicates. Similar results were obtained in three independent experiments using the parental RUES2 line.
-
Figure 4—source data 1
Hierarchical clustering group one genes (z-score).
- https://doi.org/10.7554/eLife.38279.015
-
Figure 4—source data 2
Hierarchical clustering group two genes (z-score).
- https://doi.org/10.7554/eLife.38279.016
-
Figure 4—source data 3
Hierarchical clustering group three genes (z-score).
- https://doi.org/10.7554/eLife.38279.017
-
Figure 4—source data 4
Motif enrichment analysis for gene groups 1–3.
- https://doi.org/10.7554/eLife.38279.018
-
Figure 4—source data 5
Gene enrichment analysis for gene groups 1–3.
- https://doi.org/10.7554/eLife.38279.019
-
Figure 4—source data 6
Overlapping genes obtained from gene enrichment analysis.
- https://doi.org/10.7554/eLife.38279.020
Figure 4—figure supplement 1

Motif and gene enrichment analysis for ACTIVIN-responsive gene groups.
(A) Motif enrichment analysis of the gene groups obtained from hierarchical clustering shown in Figure 4A. The solid lines represent all motifs analyzed and ordered by the p-value of their enrichment corrected for multiple tests. Symbols indicate select motifs that are associated with primitive streak and mesendodermal differentiation: corrected p-value<10−1 (filled symbols) and corrected p-value>10−1 (empty symbols). (B) Comparison of the genes in each of the groups identified in Figure 4A to genes specifically enriched in isolated endoderm, mesoderm, and ectoderm/epiblast tissue from E7.5 mouse embryos. The size of the circles indicates the –log10(p-value) of the enrichment and the color scale indicates the z-score of the log2(observed/expected) ratio across each group.
Figure 4—figure supplement 2
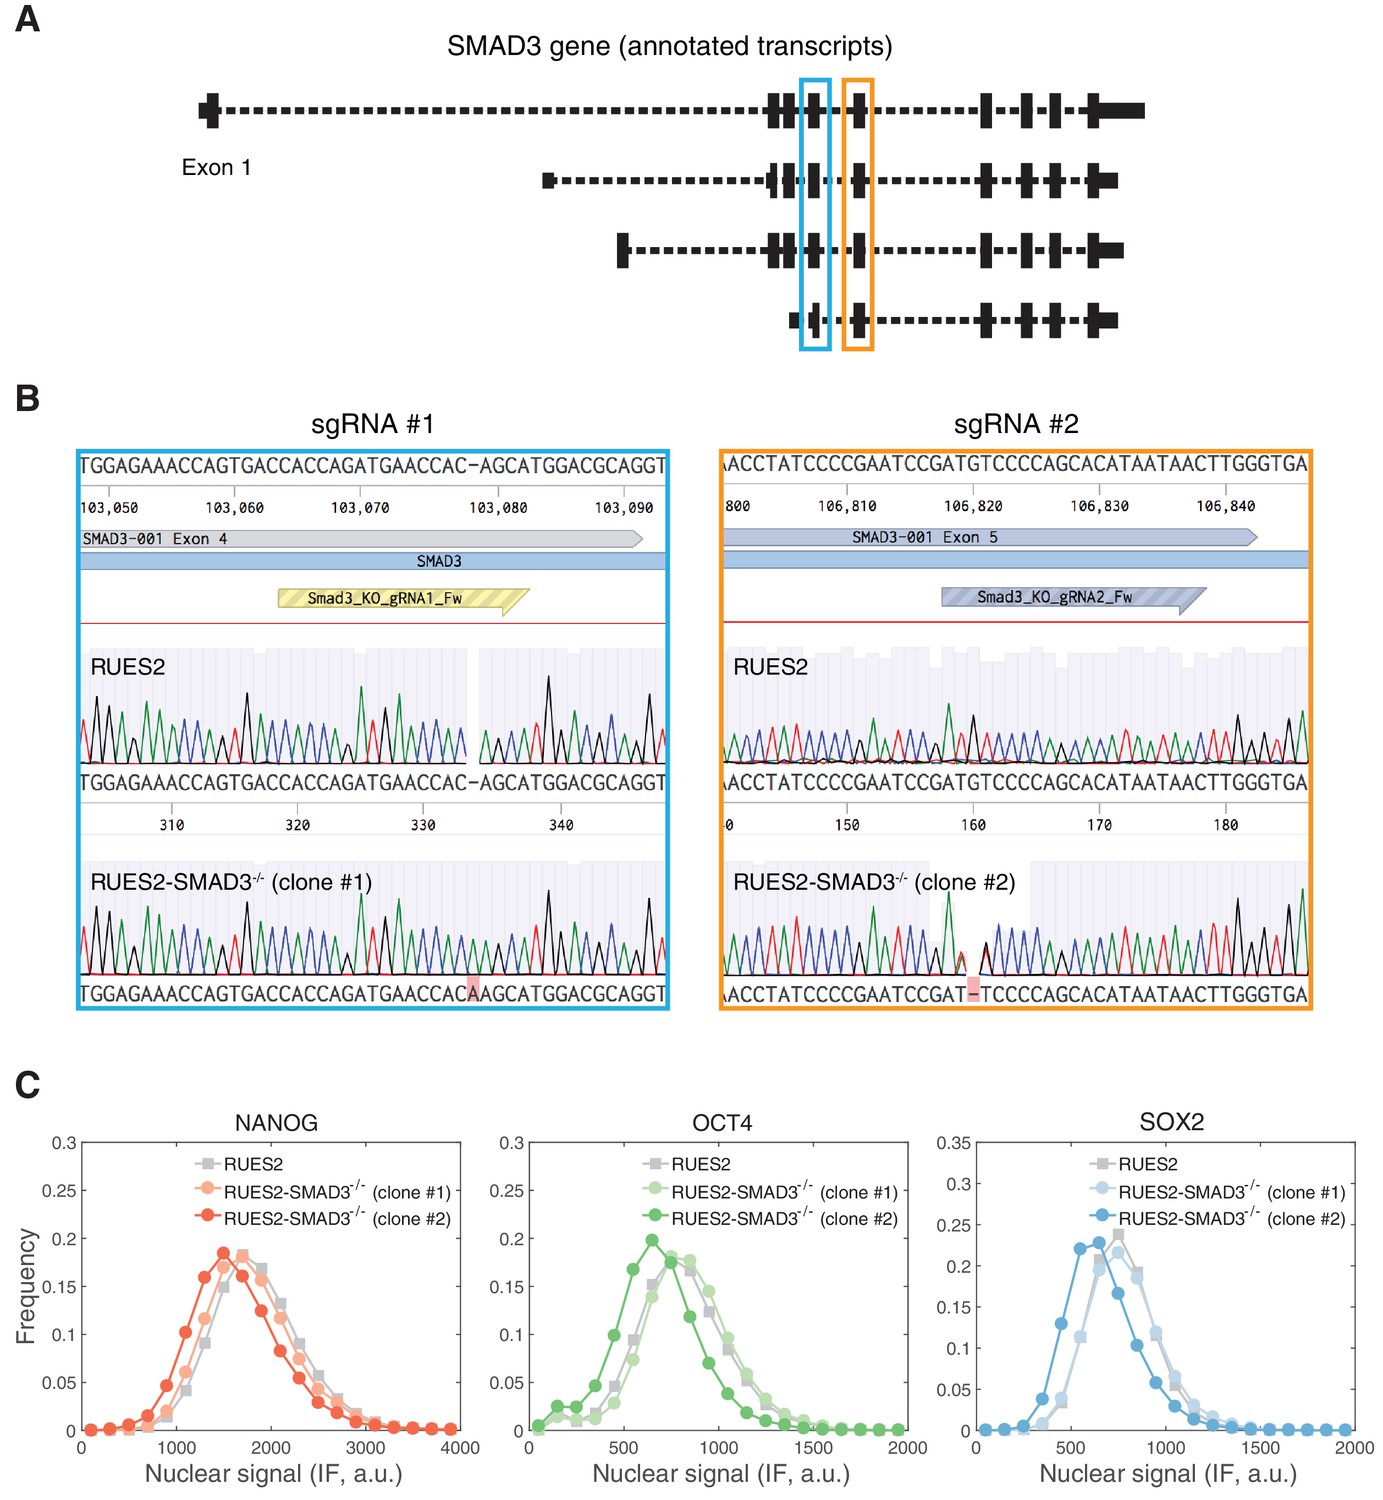
RUES2-SMAD3-/- line generation.
(A) CRISPR/Cas9-mediated SMAD3 knockout strategy. Two different sgRNAs were designed to target coding exons (black bars) shared by all SMAD3 isoforms (UCSC human genome browser, http://genome.ucsc.edu/). sgRNA #1 targets exon 4 (blue box) and sgRNA #2 targets exon 5 (orange box). (B) Sequencing chromatograms of the parental RUES2 line and RUES2-SMAD3-/- clones generated by sgRNA #1 and sgRNA #2. Clone #1 is predicted to have a homozygous +1 insertion, which results in a premature STOP codon in exon 5, and clone #2 is predicted to have a homozygous −1 deletion, which results in a premature STOP codon in exon 6. Sequences were aligned using Benchling (https://benchling.com). (C) RUES2-SMAD3-/- cells maintain expression of pluripotency markers under standard growth conditions. Cells were fixed and analyzed by immunofluorescence (IF) for NANOG, OCT4, and SOX2 expression. Histograms show the nuclear signal quantified in single cells (n > 10,000 cells per line).
Figure 5 with 1 supplement
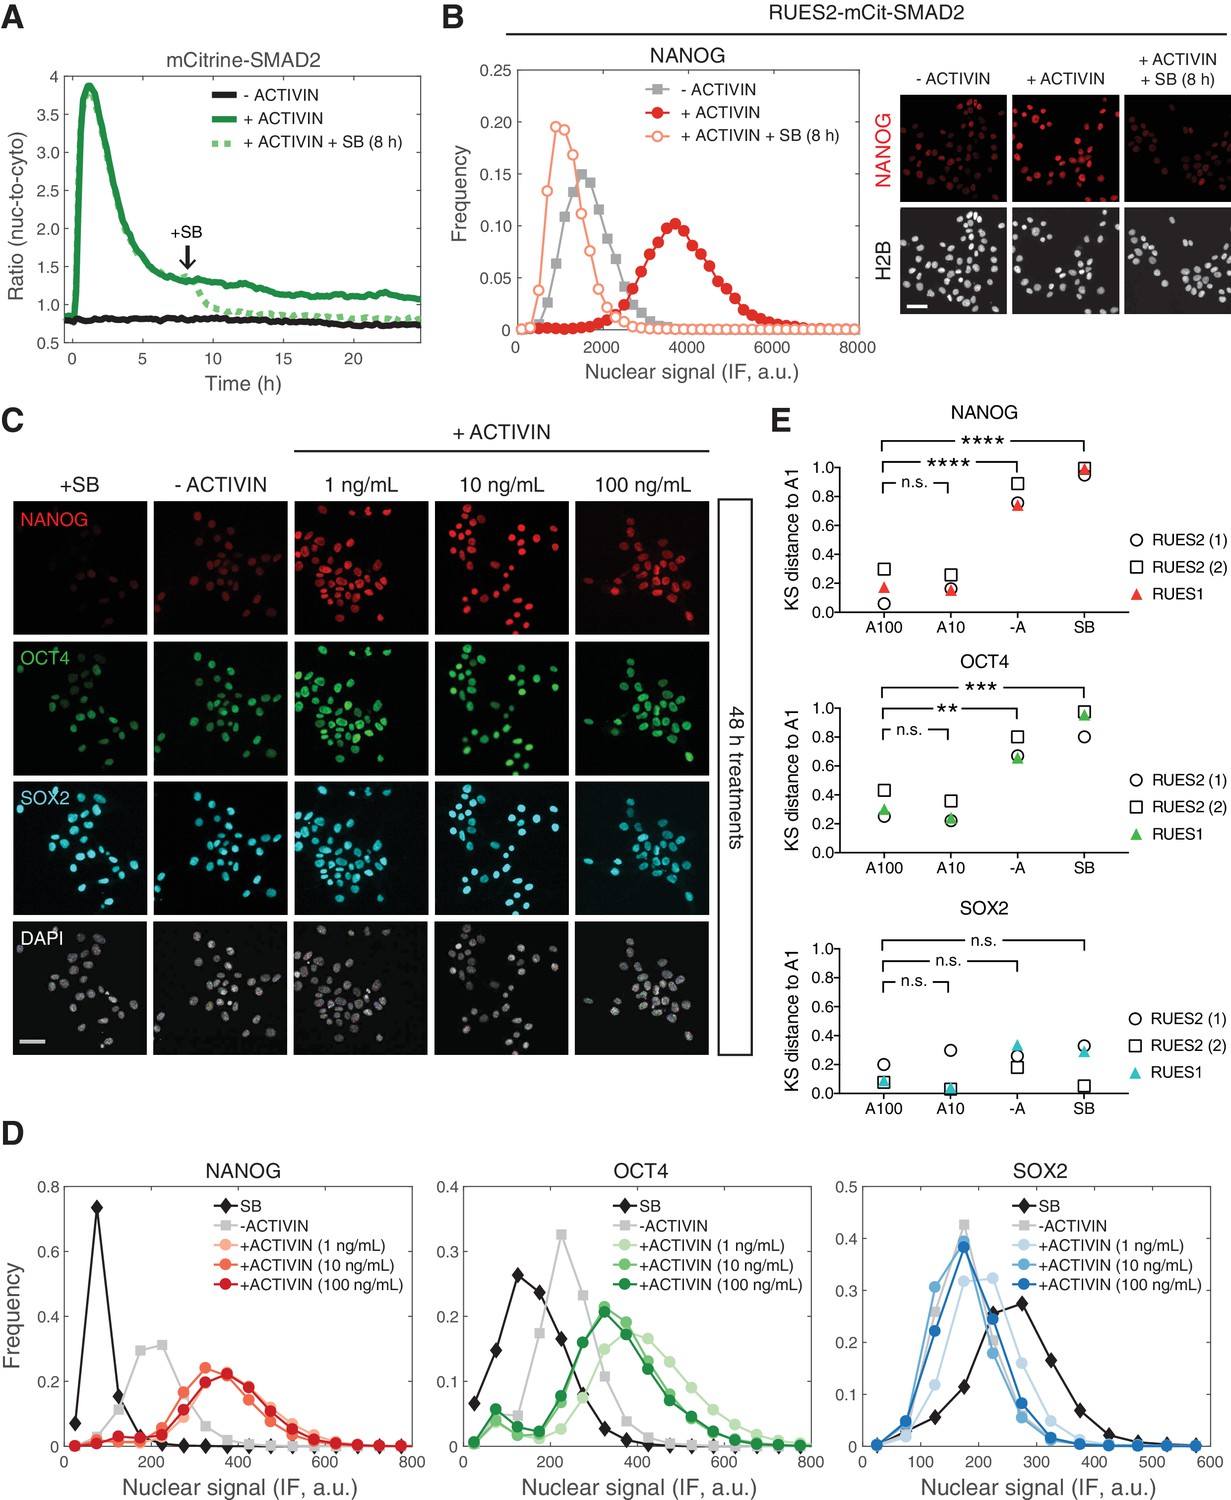
Long-term, elevated SMAD2 baseline maintains pluripotency.
(A) Quantification of the mCitrine-SMAD2 nuclear-to-cytoplasmic ratio following treatment with ACTIVIN (10 ng/mL added at T = 0 hr, solid green line). Following the transient SMAD2 response, SB (10 µM) was added to one of the samples (dotted green line, added at T = 8 hr). A third sample was left untreated in E7 (–ACTIVIN) for the duration of the experiment (solid black line). Images were acquired every 10 min. Lines represent the average response at each time point (n > 200 cells per time point). Similar results were obtained in two independent experiments. (B) The samples in A were fixed 24 hr after ACTIVIN addition and analyzed for NANOG expression by immunofluorescence (IF). Histograms show the nuclear IF signal quantified in single cells (n > 5,000 cells per condition). Scale bar, 50 µM. (C–D) RUES2 cells were cultured in E7 with different levels of Activin (0, 1, 10, 100 ng/mL) or SB (10 µM) for 2 days. Cells were fixed and analyzed by immunofluorescence (IF). (C) Images: NANOG (red), OCT4 (green), SOX2 (cyan), DAPI (gray). Scale bar, 50 µM. (D) Histograms showing the nuclear IF signal quantified in single cells (n > 5,000 cells per condition). Similar results to those shown in C and D were obtained in two independent experiments in RUES2 and in an additional hESC line, RUES1 (see Figure 5—figure supplement 1B–C). (E) Kolmogorov-Smirnov (KS) distance of the cumulative probability distribution (CDF) of each marker to the reference CDF (1 ng/mL ACTIVIN condition) for independent experiments in RUES2 and in RUES1. n.s., not significant, **p<0.01, ***p<0.001, ****p<0.0001, ANOVA.
Figure 5—figure supplement 1
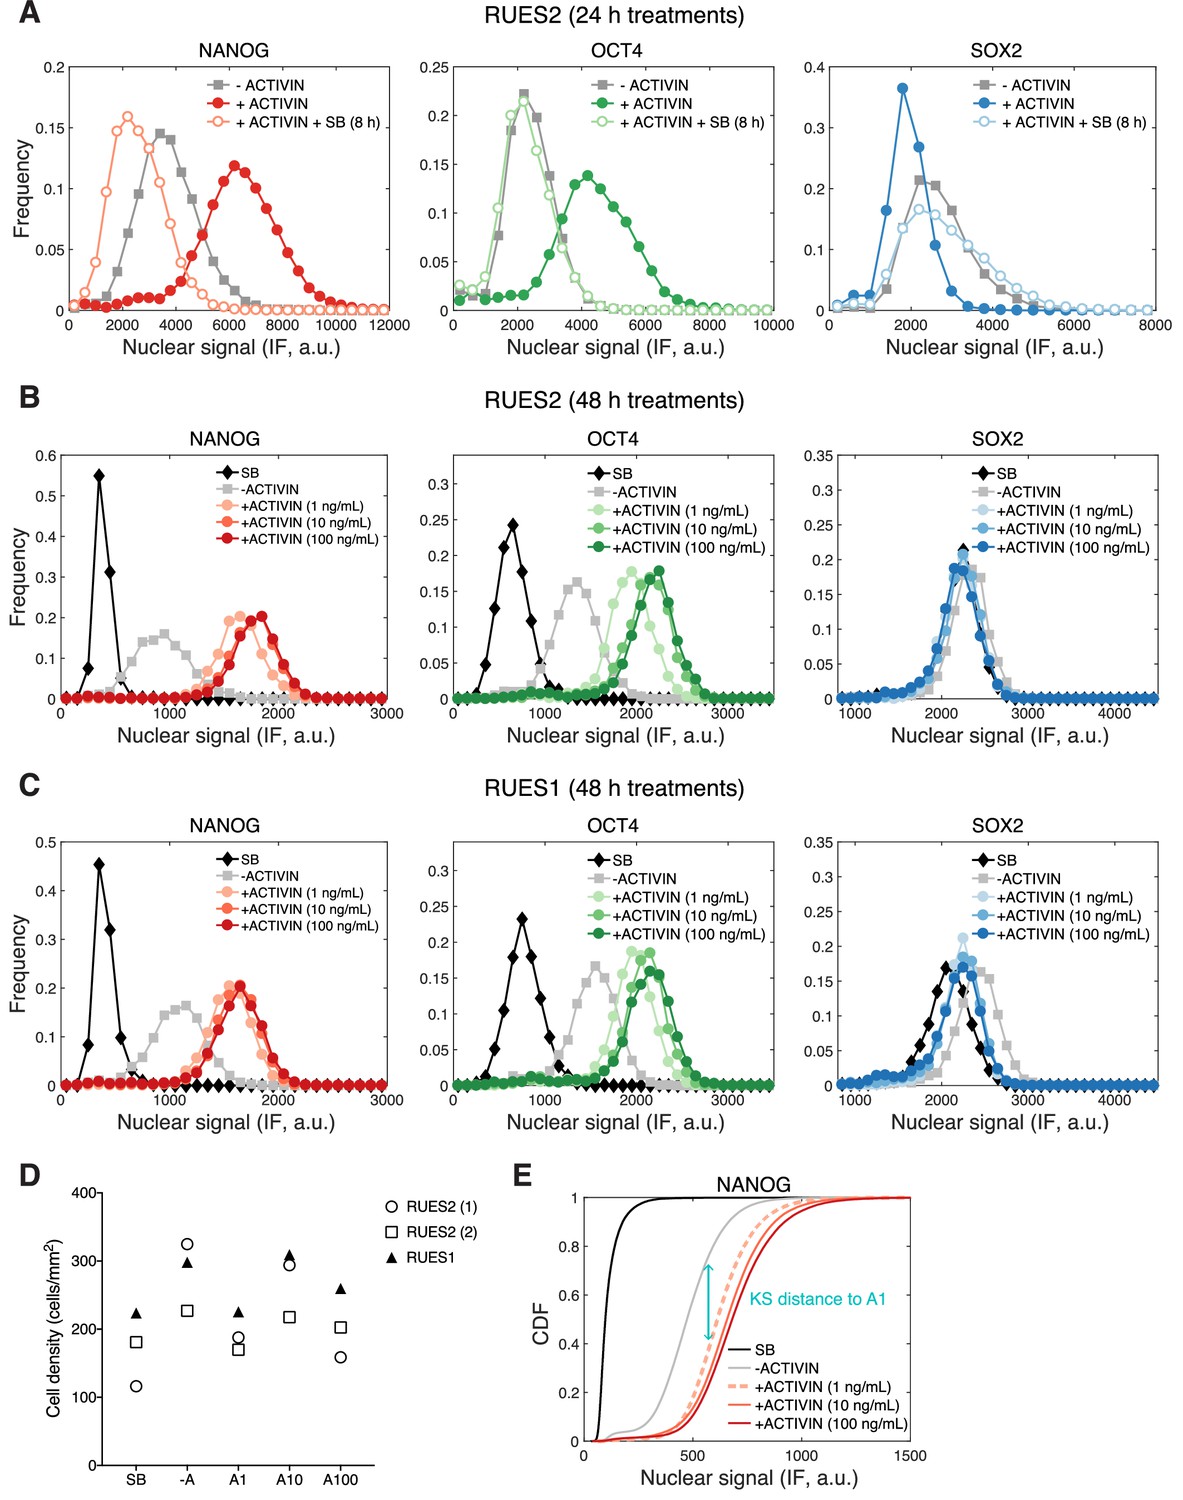
Long-term, elevated SMAD2 baseline maintains pluripotency.
(A) Analysis of the parental RUES2 line in the same experimental conditions shown in Figure 5A. RUES2 cells were cultured in E7 and treated with ACTIVIN (10 ng/mL). 8 hr after ACTIVIN addition, SB (10 µM) was added to one of the samples. A third sample was left untreated in E7 (–ACTIVIN) for the duration of the experiment. The samples were fixed at 24 hr following ACTIVIN and analyzed by immunofluorescence (IF). Histograms show the nuclear IF signal quantified in single cells (n > 5,000 cells per condition). (B–C) Independent repeats of the experiment shown in Figure 5C–D carried out in (B) RUES2 and (C) RUES1. Cells were cultured in E7 with different levels of ACTIVIN (0, 1, 10, 100 ng/mL) or SB (10 µM) for 2 days. Cells were fixed and analyzed by immunofluorescence (IF). Histograms show the nuclear IF signal quantified in single cells (n > 5,000 cells per condition). (D) Quantification of the final cell density in the experiments shown in Figure 5E. There is no significant difference between the densities under SB treatment or different ACTIVIN levels (ANOVA). (E) Schematic showing the Kolmogorov-Smirnov (KS) distance between the cumulative probability distribution (CDF) of NANOG levels measured under the –ACTIVIN condition and the 1 ng/mL ACTIVIN reference condition (A1). The CDFs are calculated from the fluorescence intensity histograms, such as those shown in B and C, and the KS distance metric is compared across biological replicates.
Figure 6 with 1 supplement
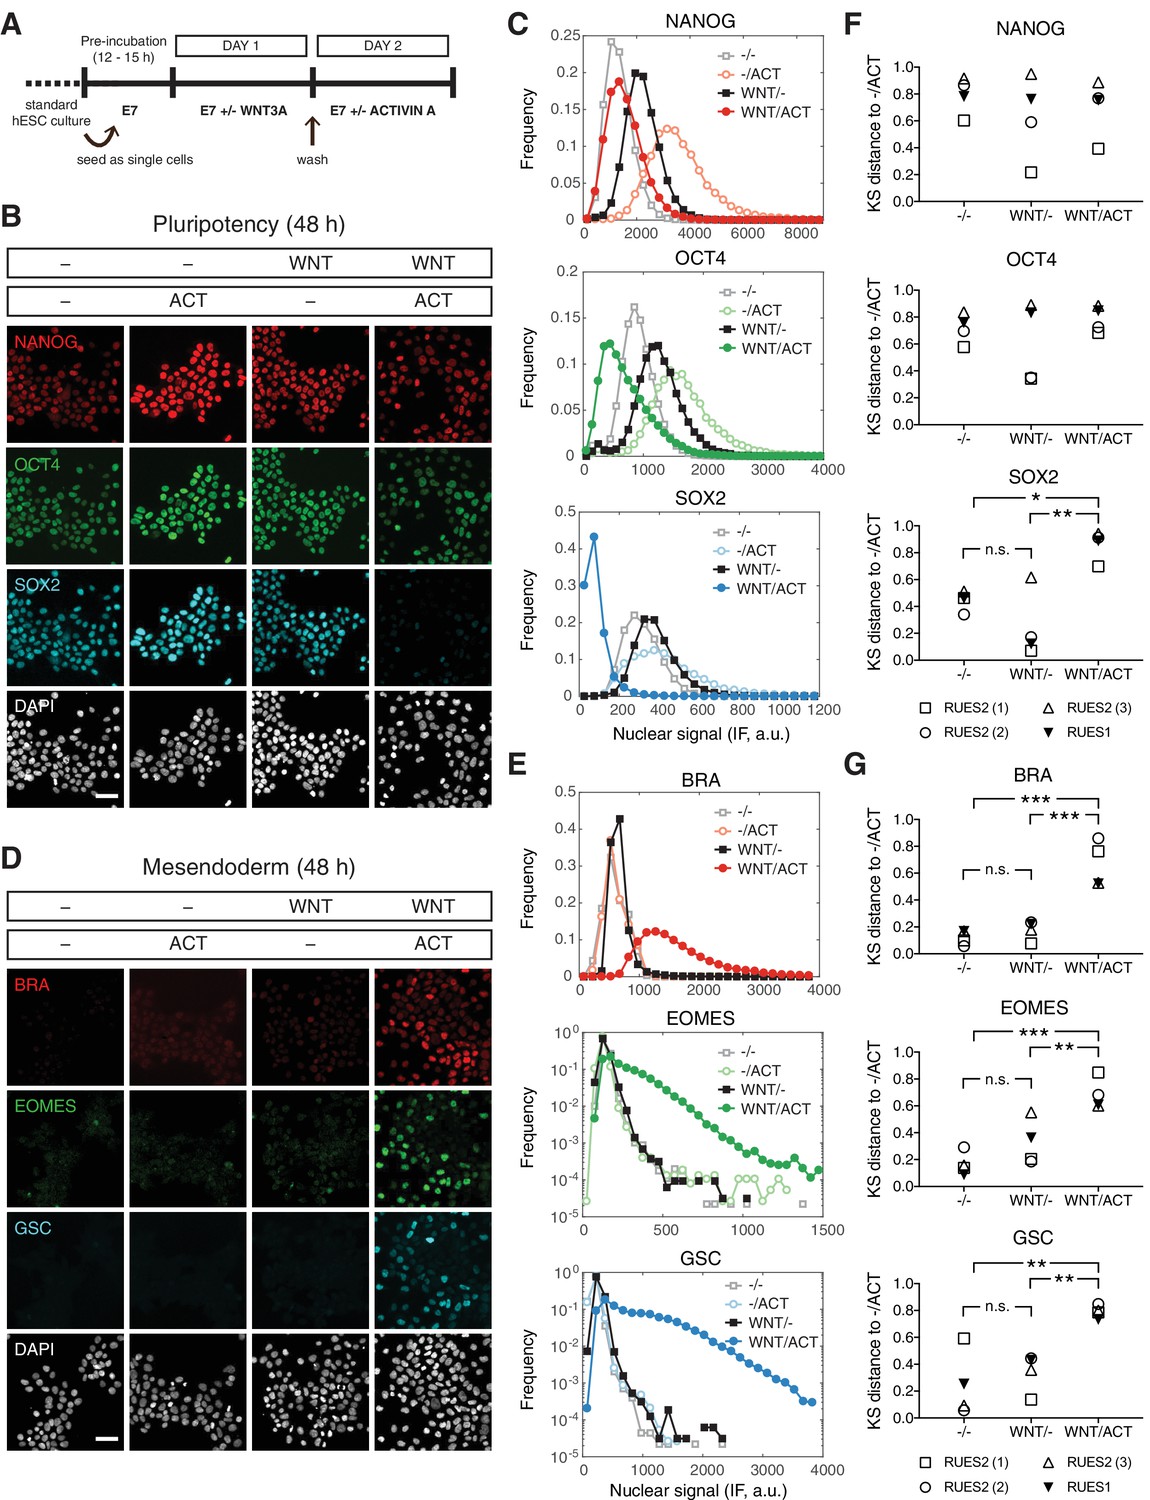
WNT priming unveils ACTIVIN-dependent mesendoderm differentiation.
(A) Schematic outlining the 2 day experimental protocol. (B–C) Cells were cultured for one day with or without WNT3A (100 ng/mL, top bar). On the second day they were washed to remove WNT and treated with or without ACTIVIN (10 ng/mL, bottom bar). After the second day cells were fixed and analyzed by immunofluorescence (IF). (B) Images: NANOG (red), OCT4 (green), SOX2 (cyan), DAPI (gray). Scale bar, 50 µM. (C) Histograms showing the nuclear IF signal quantified in single cells (n > 5,000 cells per condition). (D–E) Cells were cultured for one day with or without WNT3A (100 ng/mL, top bar). On the second day they were washed to remove WNT and treated with or without ACTIVIN (10 ng/mL, bottom bar). After the second day cells were fixed and analyzed by immunofluorescence (IF). (D) Images: BRA (red), EOMES (green), GSC (cyan), DAPI (gray). Scale bar, 50 µM. (E) Histograms showing the nuclear IF signal quantified in single cells (n > 5,000 cells per condition). (F–G) Kolmogorov-Smirnov (KS) distance of the cumulative probability distribution (CDF) of each marker to the reference CDF (-/ACT) for independent experiments in RUES2 and in RUES1 for the (F) pluripotency and (G) mesendoderm marker sets. n.s. (or comparison not shown), not significant, *p<0.05, **p<0.01, ***p<0.001, ANOVA.
Figure 6—figure supplement 1
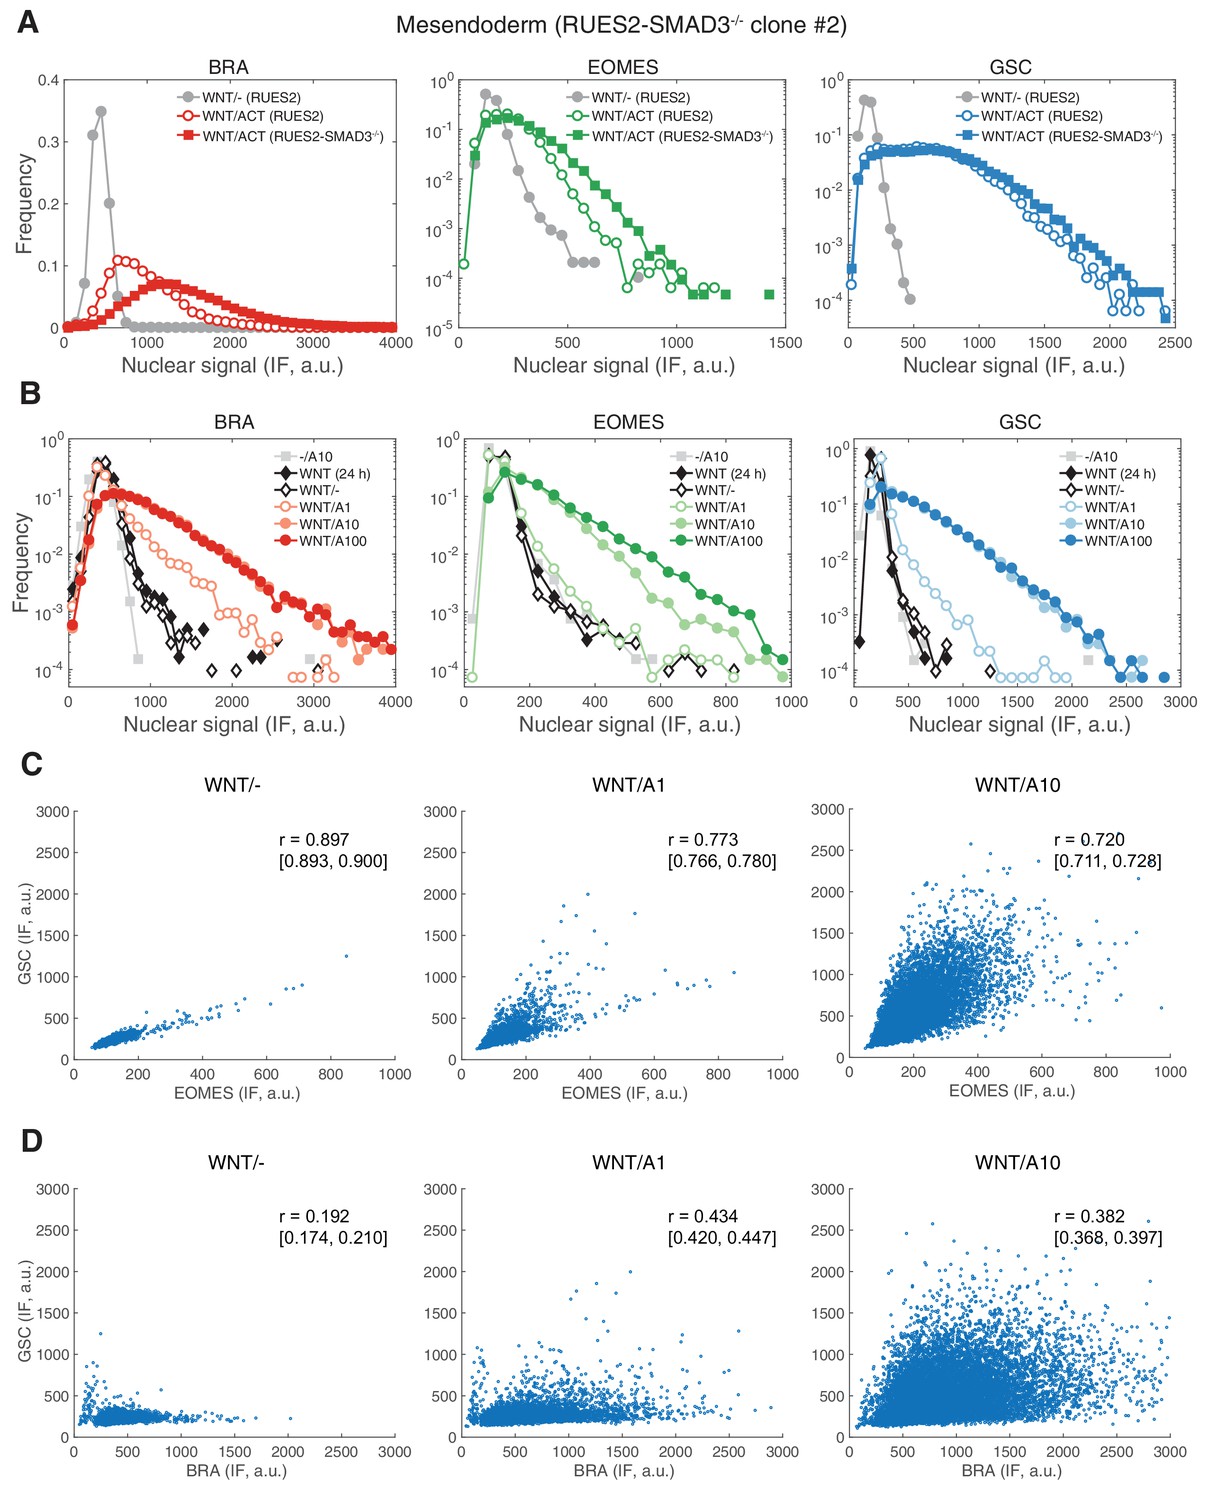
ACTIVIN dose-dependent mesendoderm differentiation.
(A) RUES2 and RUES2-SMAD3-/- cells were cultured for one day with WNT priming. On the second day they were washed to remove WNT and treated with or without ACTIVIN (10 ng/mL) for an additional day. Cells were fixed and analyzed by immunofluorescence (IF) for BRA, EOMES, and GSC expression. Histograms show the nuclear IF signal quantified in single cells (n > 5,000 cells per condition). (B) Histograms showing the immunofluorescence data from samples treated with different doses of ACTIVIN (1, 10, 100 ng/mL) for 12 hr following WNT priming. The data for WNT (24 hr) shows that all markers were poorly expressed prior to ACTIVIN addition and that their distributions are identical to cells in pluripotency conditions (-/ACT10, 36 hr) or cells that were left untreated with ACTIVIN for the additional 12 hr (WNT/-). Quantification for n > 5,000 cells per condition. (C) Scatter plot of the single-cell EOMES and GSC nuclear signal from the data shown in B. EOMES and GSC expression increases in WNT/ACT10 condition and expression is positively correlated. (D) Scatter plot of the single-cell BRA and GSC nuclear signal from the data shown in B. Expression is not well correlated. Similar numbers of cells were analyzed in all conditions in C and D, but the data points cluster on top of one another in the WNT/- and WNT/ACT1 conditions. r, Pearson correlation coefficient with the 95% confidence interval shown in brackets.
Figure 7 with 1 supplement

WNT priming stabilizes mesendoderm gene transcription without changing SMAD2 and SMAD4 response dynamics.
(A) Cells were cultured for one day with WNT3A (100 ng/mL). On the second day they were washed to remove WNT and treated with ACTIVIN (10 ng/mL). In order to block WNT signaling through β-catenin cells were treated with endo-IWR-1 (1 µM), which was added with WNT on day one and again with ACTIVIN on day 2. In order to block WNT secretion, cells were similarly treated with IWP-2 (1 µM). After the second day cells were fixed and analyzed by immunofluorescence (IF). Histograms show the nuclear IF signal quantified in single cells (n > 5,000 cells per condition). Cells cultured without WNT, corresponding to the pluripotency condition (-/ACT, open circles), represent background signal levels. (B) Quantification of the final cell density in the experiment shown in A and in additional replicates. There is no significant difference between the densities under different conditions (ANOVA). (C) mCitrine-SMAD2 (left) and GFP-SMAD4 (right) response in single cells to ACTIVIN (10 ng/mL) with or without WNT priming (black solid and dashed lines, respectively). ACTIVIN was added at T = 0 hr, which corresponds to 24 hr of WNT stimulation. WNT was removed by washing prior to the addition of ACTIVIN. Images were acquired every 10 min. The black solid and dashed lines represent the average response at each time point and the gray dashed lines represent the population standard deviation of the SMAD2 response without WNT priming (n > 200 cells per time point). Similar results were obtained in two independent experiments. (D) Transcriptional response of mesendoderm genes to ACTIVIN with or without WNT priming. An additional sample was collected that was treated with WNT and left untreated with ACTIVIN (-ACT). Expression in each sample was normalized to GAPDH and then to the level prior to ACTIVIN addition (T = 0 hr). Data represents the mean ±S.D. for n = 3 technical replicates. n.d., not detected. Similar results were obtained in two independent experiments. (E) Model for WNT priming as a requirement for ACTIVIN to function as a morphogen. Following implantation ACTIVIN functions in a dose-independent manner to maintain pluripotency of the epiblast. At the onset of gastrulation, WNT signaling primes cells respond to graded ACTIVIN/SMAD2 signaling, which leads to the anterior-posterior patterning of cells emerging from the primitive streak (PS).
Figure 7—figure supplement 1
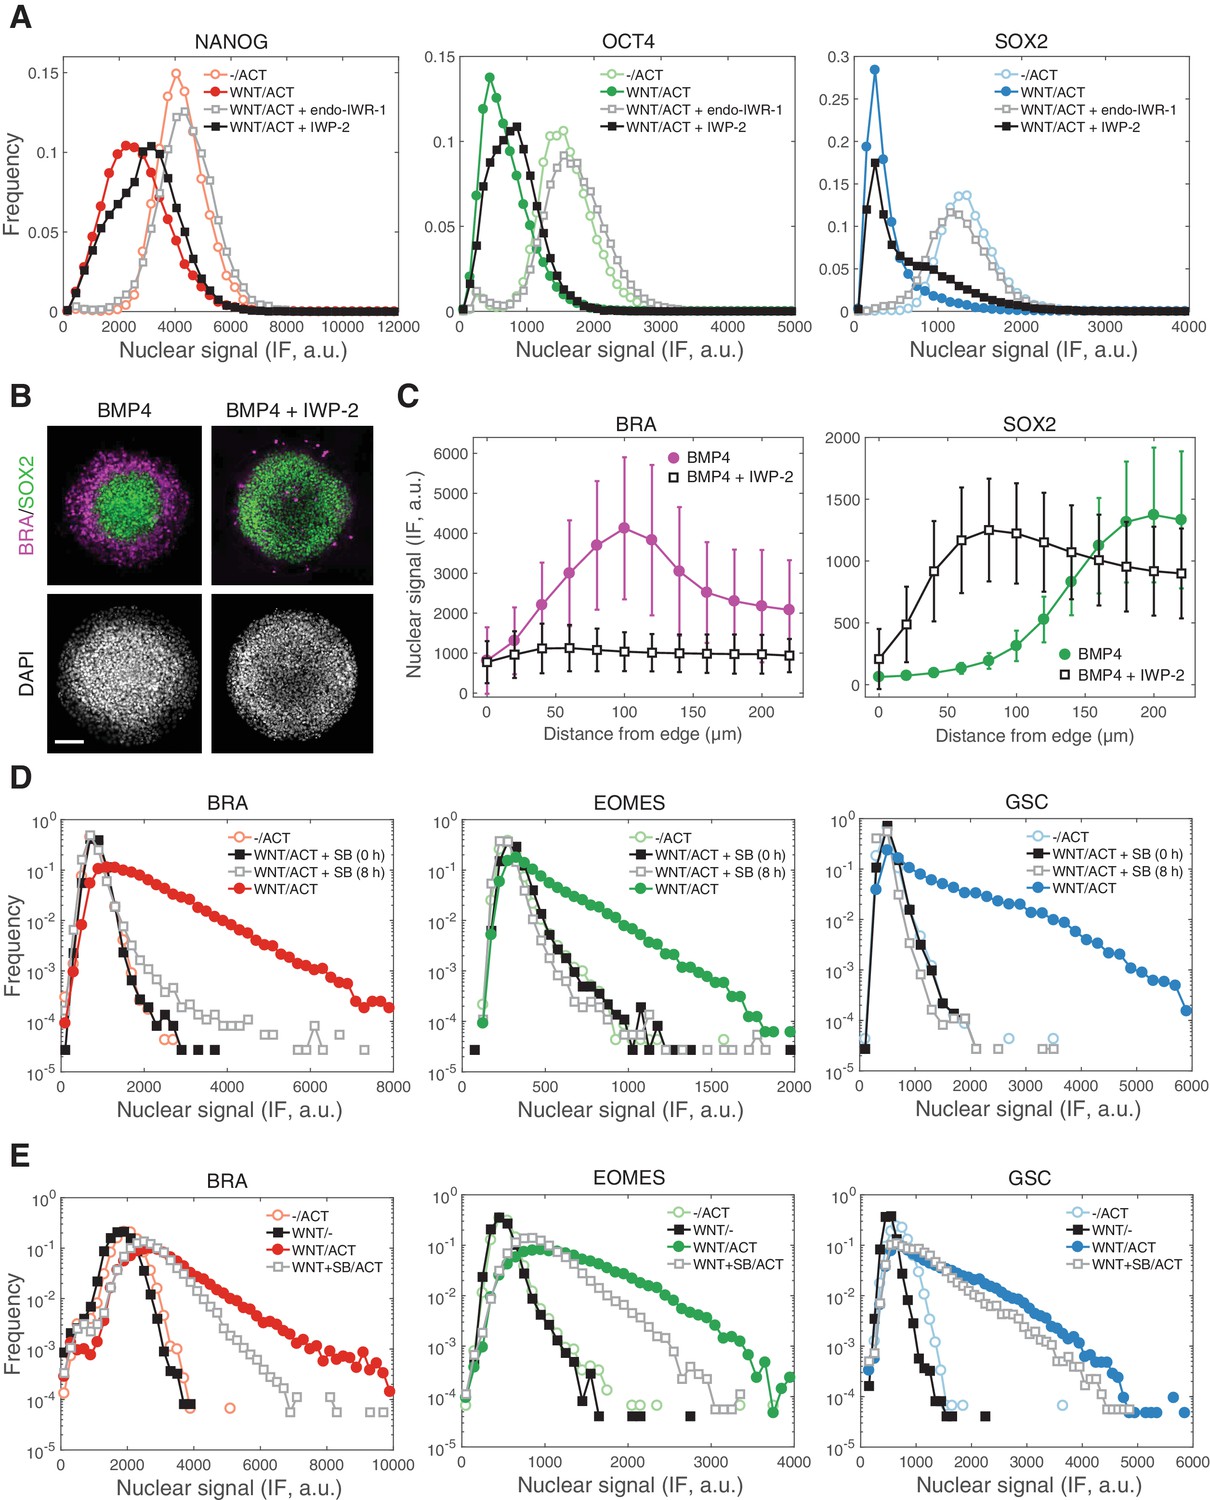
On-going SMAD2 signaling is required for mesendoderm differentiation but is dispensable for WNT priming.
(A) Pluripotency maker analysis for the same experiment shown in Figure 7A. Cells were cultured for one day with WNT3A (100 ng/mL). On the second day they were washed to remove WNT and treated with ACTIVIN (10 ng/mL). In order to block WNT signaling through β-catenin cells were treated with endo-IWR-1 (1 µM), which was added with WNT on day one and again with ACTIVIN on day 2. In order to block WNT secretion, cells were similarly treated with IWP-2 (1 µM). After the second day cells were fixed and analyzed by immunofluorescence. Histograms show the nuclear IF signal quantified in single cells (n > 5,000 cells per condition). Cells cultured without WNT (-/ACT, open circles) represent pluripotency levels. (B–C) Micropatterned colonies in conditioned media treated with BMP4 (50 ng/mL) or BMP4 (50 ng/mL)+IWP-2 (1 µM) for 42 hr. The colonies were fixed and analyzed by immunofluorescence. (B) Images: BRA (magenta), SOX2 (green), DAPI (gray). Scale bar, 100 µM. (C) Quantification of the mean nuclear fluorescence as a function of radial position from the colony edge. Error bars represent the standard deviation across n = 17 (BMP4, filled circles) and n = 12 (BMP4 +IWP-2, open squares) colonies from one experiment. (D) Cells were cultured for one day with WNT3A (100 ng/mL). On the second day they were washed to remove WNT and treated with ACTIVIN or ACTIVIN followed by SB (10 µM) addition at the indicated times. Cells were fixed at 24 hr after ACTIVIN treatment and analyzed for BRA, EOMES, and GSC expression by immunofluorescence (IF). Histograms show the nuclear IF signal quantified in single cells (n > 5,000 cells per condition). Cells cultured without WNT (-/ACT, open circles) represent background signal levels. Marker expression is eliminated when SB is added at T = 0 (black squares) or T = 8 hr (open gray squares) after ACTIVIN addition. (E) Cells were cultured for one day with WNT3A (100 ng/mL) either on its own or in combination with SB (10 µM) in order to block ACTIVIN signaling during WNT priming. On the second day cells were washed to remove WNT and treated with ACTIVIN (10 ng/mL). Cells were fixed at 24 hr after ACTIVIN treatment and analyzed for BRA, EOMES, and GSC expression by immunofluorescence (IF). Histograms show the nuclear IF signal quantified in single cells (n > 5,000 cells per condition). Cells cultured without WNT (-/ACT, open circles) represent background signal levels. Addition of SB during WNT priming (open gray squares) only moderately reduces marker expression relative to the standard treatment (WNT/ACT, filled circles).
Tables
Key resources table
| Reagent type (species) or resource | Designation | Source or reference | Identifiers | Additional information |
|---|---|---|---|---|
| Cell line (Homo sapiens, XX) | RUES2 | US National Institutes of Health, human ESC registry | human ESC registry no. 0013; RRID:CVCL_VM29 | Human embryonic stem cell line |
| Cell line (Homo sapiens, XX) | RUES2-RFP-SMAD1 | this paper | CRISPR/Cas9-modified human embryonic stem cell line | |
| Cell line (Homo sapiens, XX) | RUES2-mCit-SMAD2 | this paper | CRISPR/Cas9-modified human embryonic stem cell line | |
| Cell line (Homo sapiens, XX) | RUES2-GFP-SMAD4 | PMID: 28760810 | CRISPR/Cas9-modified human embryonic stem cell line | |
| Cell line (Homo sapiens, XX) | RUES2-SMAD3-/- clone #1 | this paper | CRISPR/Cas9-modified human embryonic stem cell line | |
| Cell line (Homo sapiens, XX) | RUES2-SMAD3-/- clone #2 | this paper | CRISPR/Cas9-modified human embryonic stem cell line | |
| Cell line (Homo sapiens, XY) | RUES1 | US National Institutes of Health, human ESC registry | human ESC registry no. 0012; RRID:CVCL_B809 | Human embryonic stem cell line |
| Antibody | anti-Brachyury (goat polyAb) | R and D Systems | Cat. #: AF2085; RRID:AB_2200235 | IF (1:300) |
| Antibody | anti-Brachyury (rabbit mAb) | R and D Systems | Cat. #: MAB20851 | IF (1:200) |
| Antibody | anti-Cdx2 (mouse mAb) | Abcam | Cat. #: ab15258; RRID:AB_2077042 | IF (1:50) |
| Antibody | anti-Eomes (mouse mAb) | R and D Systems | Cat. #: MAB6166; RRID:AB_10919889 | IF (1:200) |
| Antibody | anti-Lamin B1 (rabbit polyAb) | Proteintech | Cat. #: 12987–1-AP; RRID:AB_2136290 | WB (1:2000) |
| Antibody | anti-Goosecoid (goat polyAb) | R and D Systems | Cat. #: AF4086; RRID:AB_2114650 | IF (1:100) |
| Antibody | anti-Nanog (goat polyAb) | R and D Systems | Cat. #: AF1997; RRID:AB_355097 | IF (1:200) |
| Antibody | anti-Oct3/4 (mouse mAb) | BD Biosciences | Cat. #: 611203; RRID:AB_398737 | IF (1:400) |
| Antibody | anti-Smad2 (rabbit mAb) | Cell Signaling | Cat. #: 3122; RRID:AB_10697649 | IF (1:200), WB (1:1000) |
| Antibody | anti-Smad2/3 (mouse mAb) | BD Biosciences | Cat. #: 610842; RRID:AB_398161 | IF (1:100) |
| Antibody | anti-Sox17 (goat polyAb) | R and D Systems | Cat. #: AF1924; RRID:AB_355060 | IF (1:200) |
| Antibody | anti-Sox2 (rabbit mAb) | Cell Signaling | Cat. #: 3579; RRID:AB_2195767 | IF (1:200) |
| Peptide, recombinant protein | recombinant human/mouse/ rat Activin A | R and D Systems | Cat. #: 338-AC/CF | |
| Peptide, recombinant protein | recombinant human BMP-4 | R and D Systems | Cat. #: 314 BP | |
| Peptide, recombinant protein | recombinant mouse Wnt-3a | R and D Systems | Cat. #: 1324-WN | |
| Peptide, recombinant protein | recombinant human Laminin-521 | BioLamina | ||
| Chemical compound, drug | endo-IWR-1 | Tocris | Cat. #: 3532 | |
| Chemical compound, drug | IWP-2 | Stemgent | Cat. #: 04–0034 | |
| Chemical compound, drug | SB431542 | Stemgent | Cat. #: 04–0010 | |
| Chemical compound, drug | Y-27632 | Abcam | Cat. #: Ab120129 | |
| Software, algorithm | MATLAB | MathWorks | RRID:SCR_001622 | |
| Software, algorithm | StemCellTracker | https://github.com/ChristophKirst/StemCellTracker | Image segmentation and signal analysis | |
| Software, algorithm | R | https://www.r-project.org/ | ||
| Software, algorithm | DESeq2 Bioconductor package | PMID: 25516281 | Differential gene expression analysis | |
| Software, algorithm | PWMEnrich Bioconductor package | https://bioconductor.org/packages/release/bioc/html/PWMEnrich.html | Motif enrichment analysis | |
| Software, algorithm | GOseq Bioconductor package | PMID: 20132535 | Statistical analysis of over/under represented categories | |
| Software, algorithm | AME | PMID: 25953851 | Motif enrichment analysis | |
| Software, algorithm | Tide | PMID: 25300484 | Sequence trace decomposition | |
| Software, algorithm | Cluster 3.0 | PMID: 14871861 | Clustering | |
| Software, algorithm | Java TreeView | PMID: 15180930 | Data visualization |
Table 1
RT-PCR primer sequences and source.
https://doi.org/10.7554/eLife.38279.027| Gene symbol | Forward primer | Reverse primer | Source |
|---|---|---|---|
| NANOG | TCCAACATCCTGAACCTCAGC | ACCATTGCTATTCTTCGGCCA | Primer-BLAST |
| OCT4 | AAACCCACACTGCAGCAGAT | TGTGCATAGTCGCTGCTTGA | Primer-BLAST |
| SOX2 | TACAGCATGATGCAGGACCA | CCGTTCATGTAGGTCTGCGA | Primer-BLAST |
| NODAL | AGACATCATCCGCAGCCTAC | CAAAAGCAAACGTCCAGTTCT | Primer-BLAST |
| GAPDH | AATCCCATCACCATCTTCCA | TGGACTCCACGACGTACTCA | Primer-BLAST |
| SMAD7 | CCAGGCTCCAGAAGAAGTTG | CCAACTGCAGACTGTCCAGA | qPrimerDepot |
| LEFTY1 | CTCCATGCCGAACACCAG | GGAAAGAGGTTCAGCCAGAG | qPrimerDepot |
| LEFTY2 | TCAATGTACATCTCCTGGCG | CTGGACCTCAGGGACTATGG | qPrimerDepot |
| BRA | CGTTGCTCACAGACCACAG | ATGACAATTGGTCCAGCCTT | qPrimerDepot |
| GSC | GAGGAGAAAGTGGAGGTCTGGTT | CTCTGATGAGGACCGCTTCTG | Mendjan et al. |
| EOMES | CACATTGTAGTGGGCAGTGG | CGCCACCAAACTGAGATGAT | Mendjan et al. |
Additional files
-
Transparent reporting form
- https://doi.org/10.7554/eLife.38279.028
Download links
A two-part list of links to download the article, or parts of the article, in various formats.
Downloads (link to download the article as PDF)
Open citations (links to open the citations from this article in various online reference manager services)
Cite this article (links to download the citations from this article in formats compatible with various reference manager tools)
WNT signaling memory is required for ACTIVIN to function as a morphogen in human gastruloids
eLife 7:e38279.
https://doi.org/10.7554/eLife.38279


