Functional instability allows access to DNA in longer transcription Activator-Like effector (TALE) arrays
- Johns Hopkins University, United States
- University of Illinois Urbana-Champaign, United States
- University of Illinois at Urbana Champaign, United States
- Howard Hughes Medical Institute, United States
Figures
Figure 1
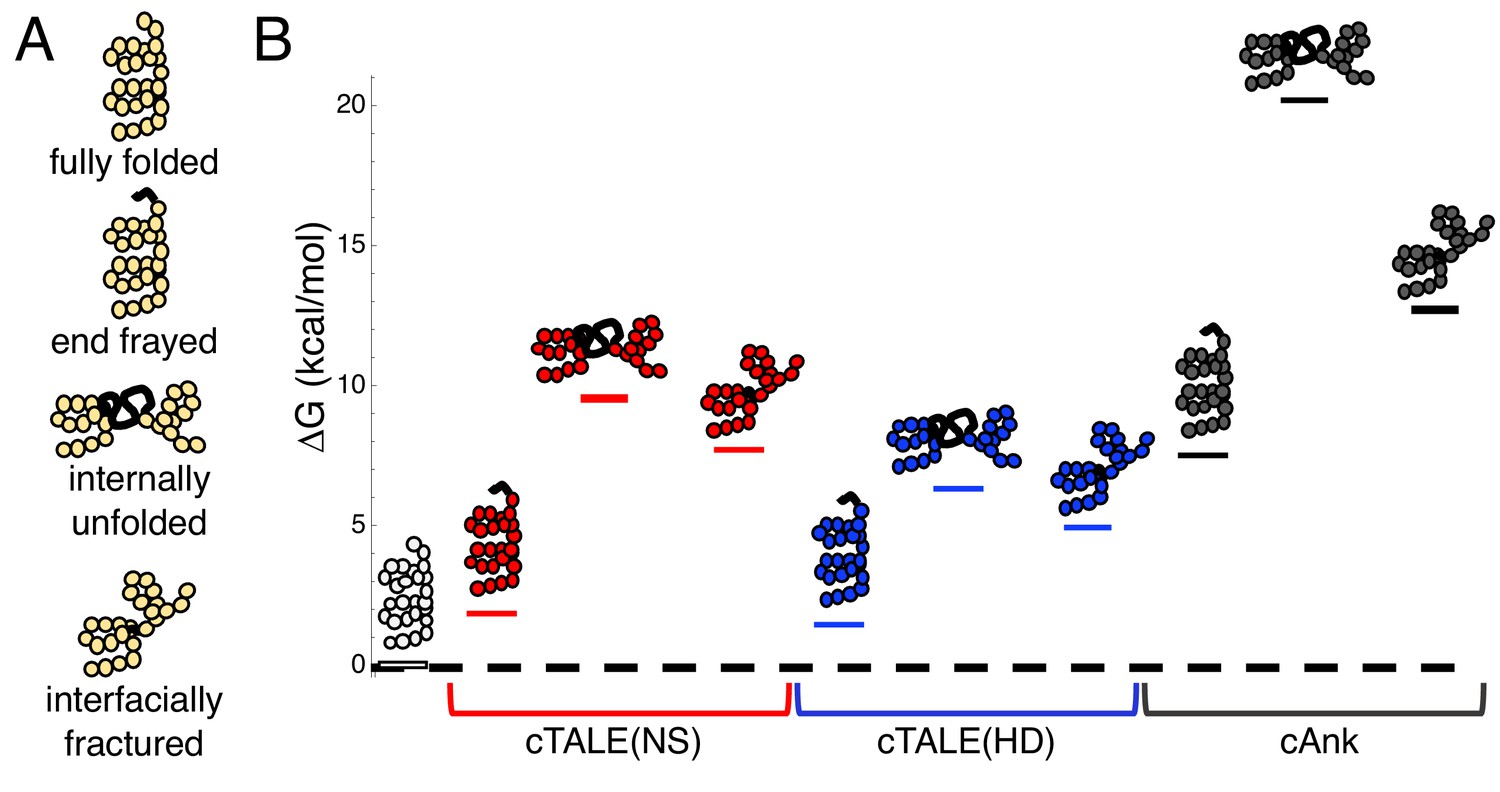
cTALEs populate partly folded states.
(A) Cartoon of different partly folded TALE conformational states. End-frayed states have one (or more) terminal repeats unfolded. Internally unfolded states have a central repeat unfolded. Interfacially fractured states have a disrupted interface between adjacent repeats. (B) Free energies of partly folded states, calculated from previously published measurements and analysis (Geiger-Schuller and Barrick, 2016), relative to the fully folded state, for consensus TALE repeats with the NS repeat-variable diresidue sequence (cTALE(NS), red), consensus TALE repeats with the HD repeat-variable diresidue sequence (cTALE(HD), blue), and consensus ankyrin repeats (cAnk, black).
Figure 2 with 1 supplement
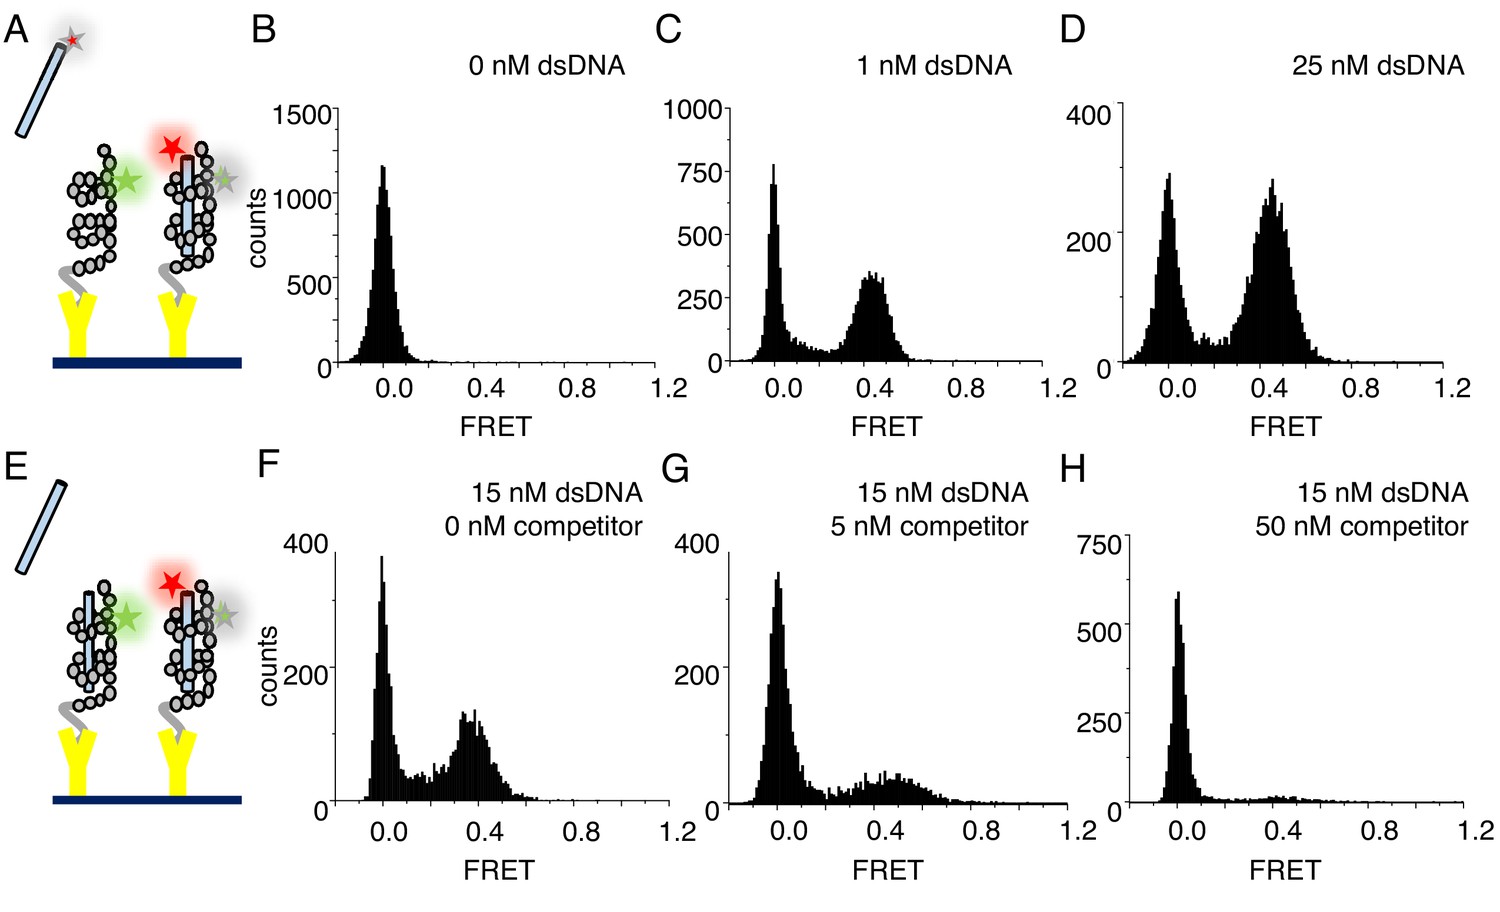
cTALEs bind dsDNA reversibly.
(A) Schematic of single-molecule FRET assay, with donor-labelled cTALE attached to a surface, and acceptor-labelled DNA free in solution. (B–D) Single molecule FRET histograms show the appearance of a peak at a FRET efficiency of 0.45 with increasing labelled DNA, consistent with a DNA-bound cTALE. (E) Schematic of single-molecule FRET competition assay, with donor-labelled cTALE attached to a surface, and acceptor-labelled DNA as well as competitor unlabeled DNA free in solution. (F–H) Single molecule FRET histograms show the disappearance of the peak at 0.45 FRET efficiency with increasing unlabeled competitor DNA. Conditions: 20 mM Tris pH 8.0, 200 mM KCl.
Figure 2—figure supplement 1
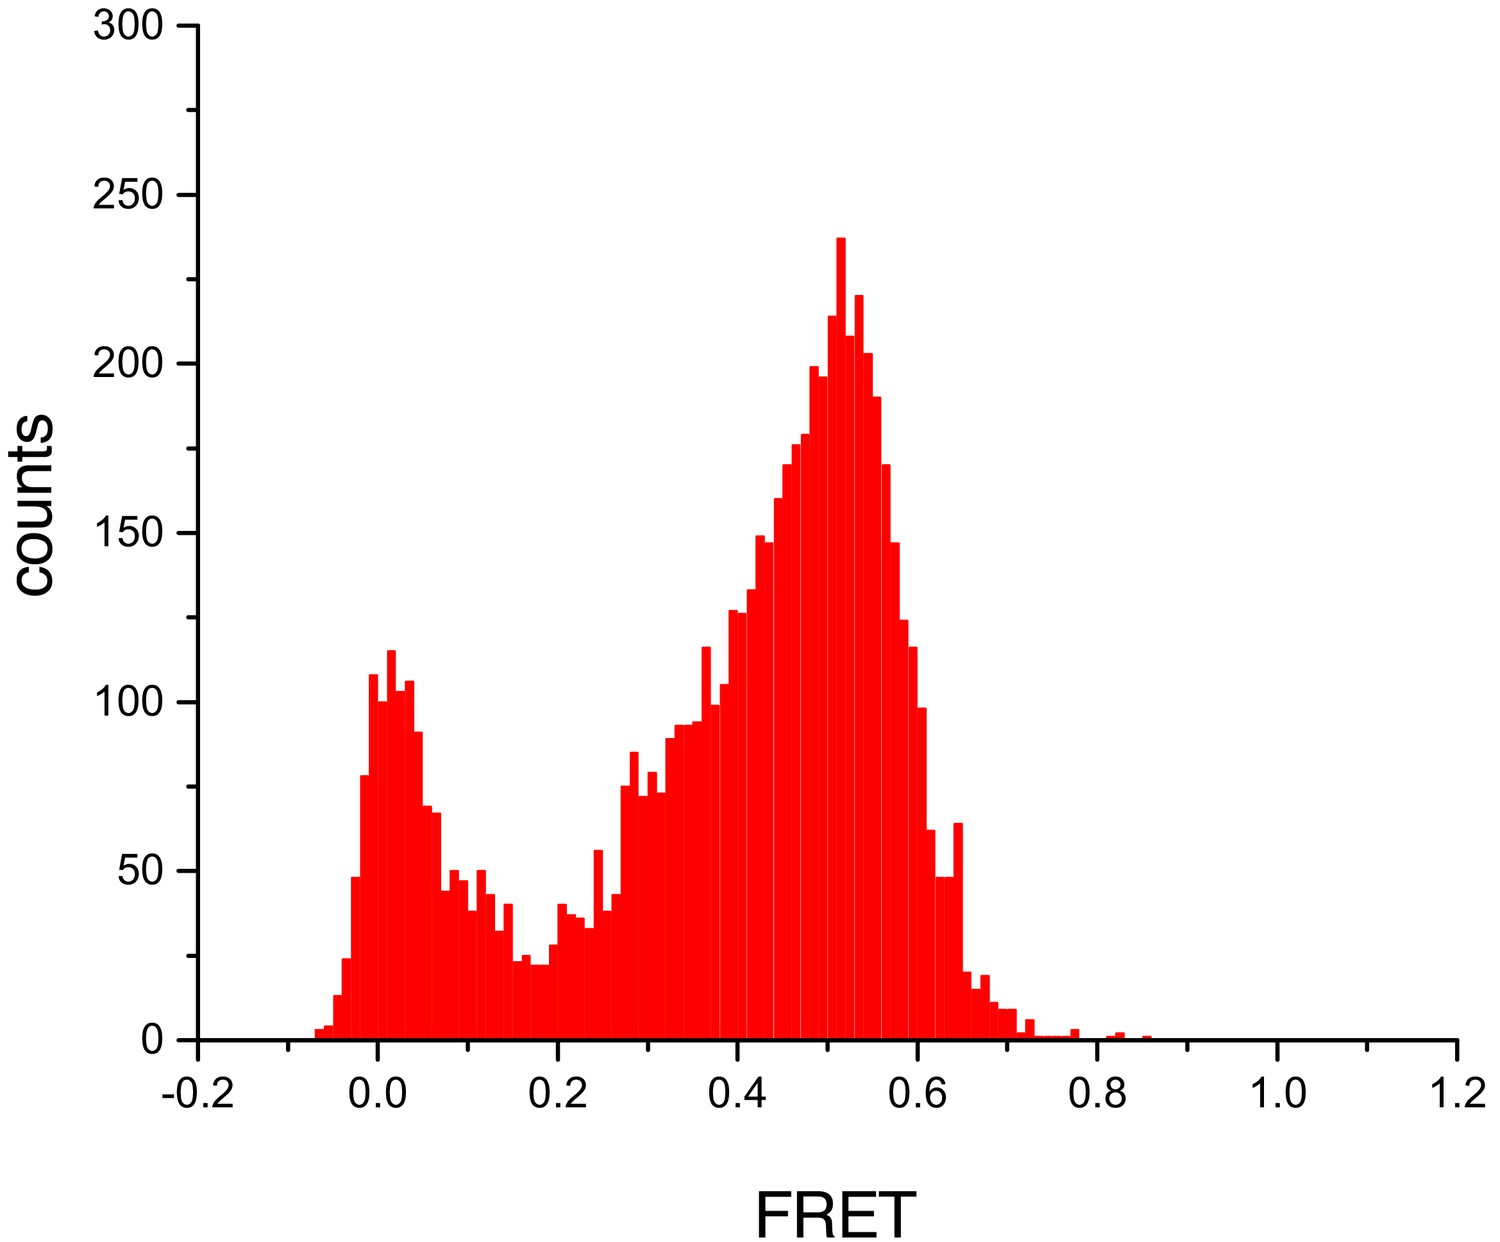
Untethered cTALEs bind dsDNA.
FRET histograms from experiments where acceptor-labelled DNA are attached to a surface, and donor-labelled cTALEs are free in solution show a peak at a FRET efficiency of 0.5. This is consistent with the FRET efficiency of 0.45 obtained when cTALEs are tethered to the surface and DNA are free in solution. Conditions: 20 mM Tris pH 8.0, 200 mM KCl.
Figure 3 with 2 supplements
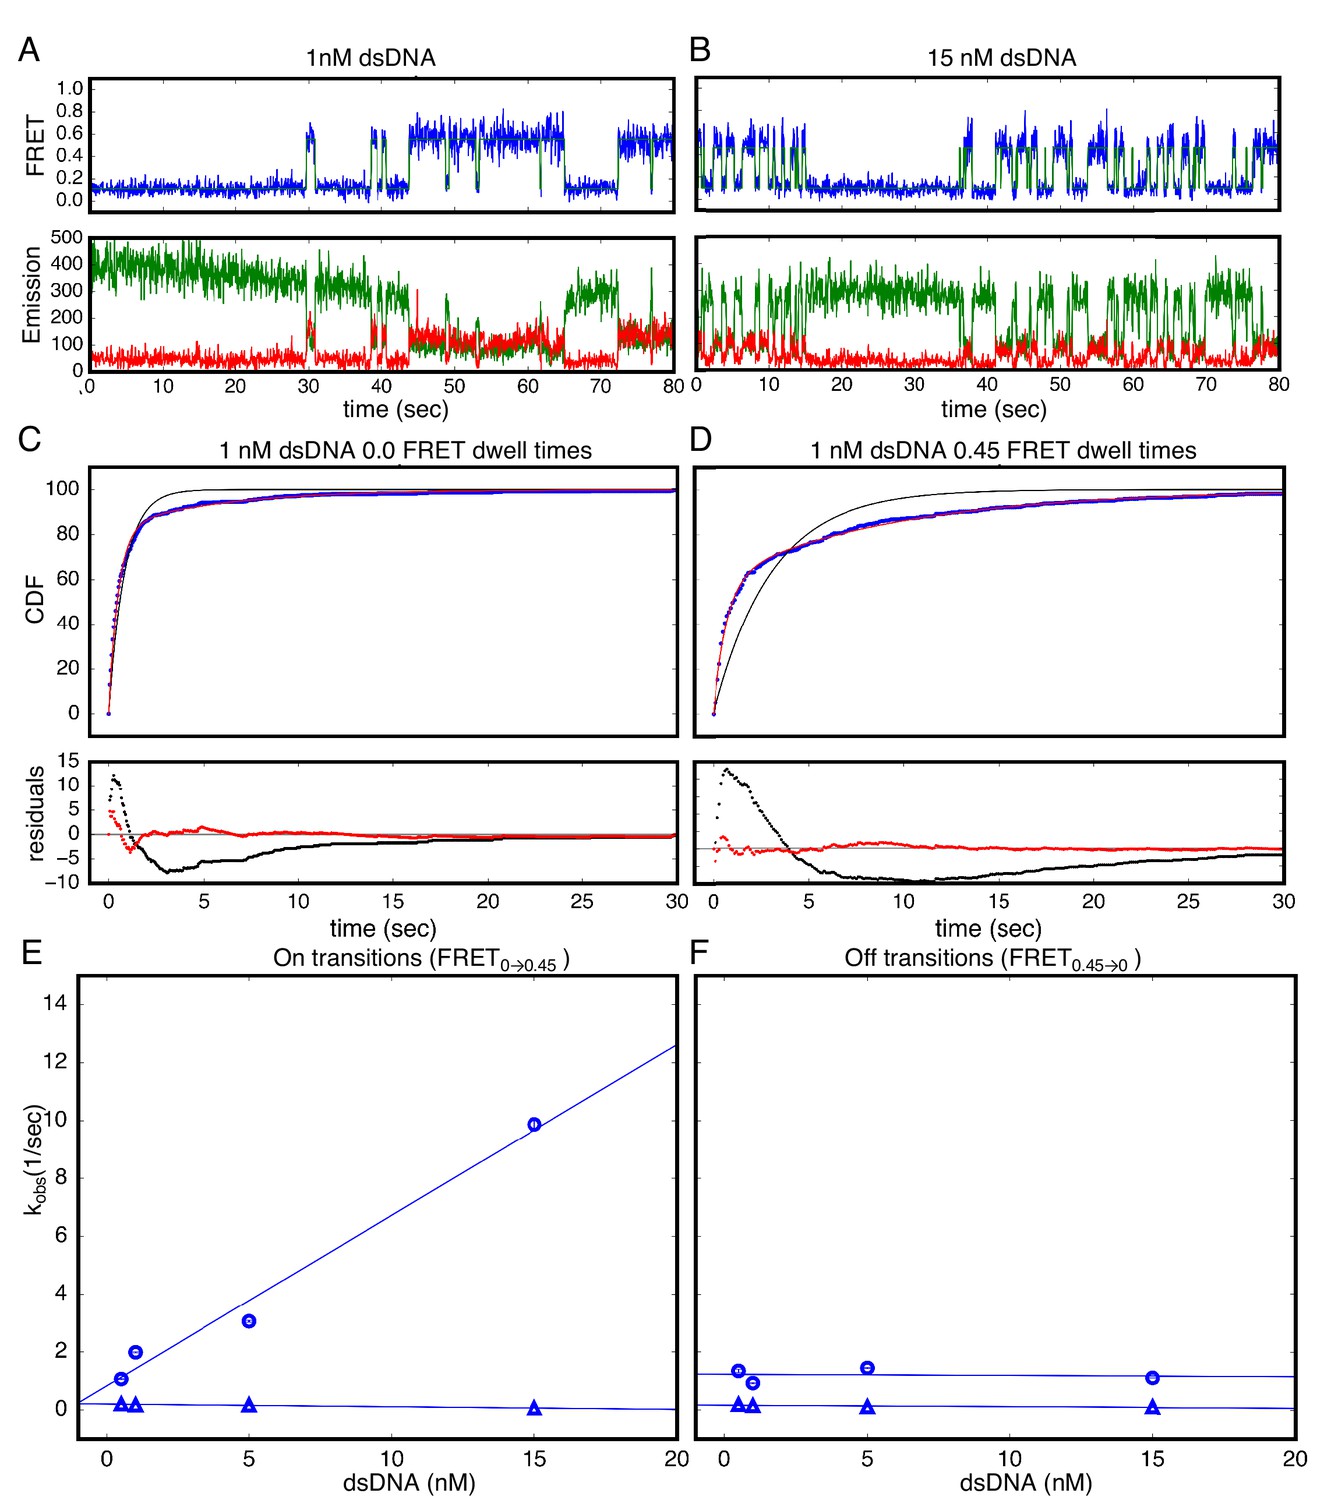
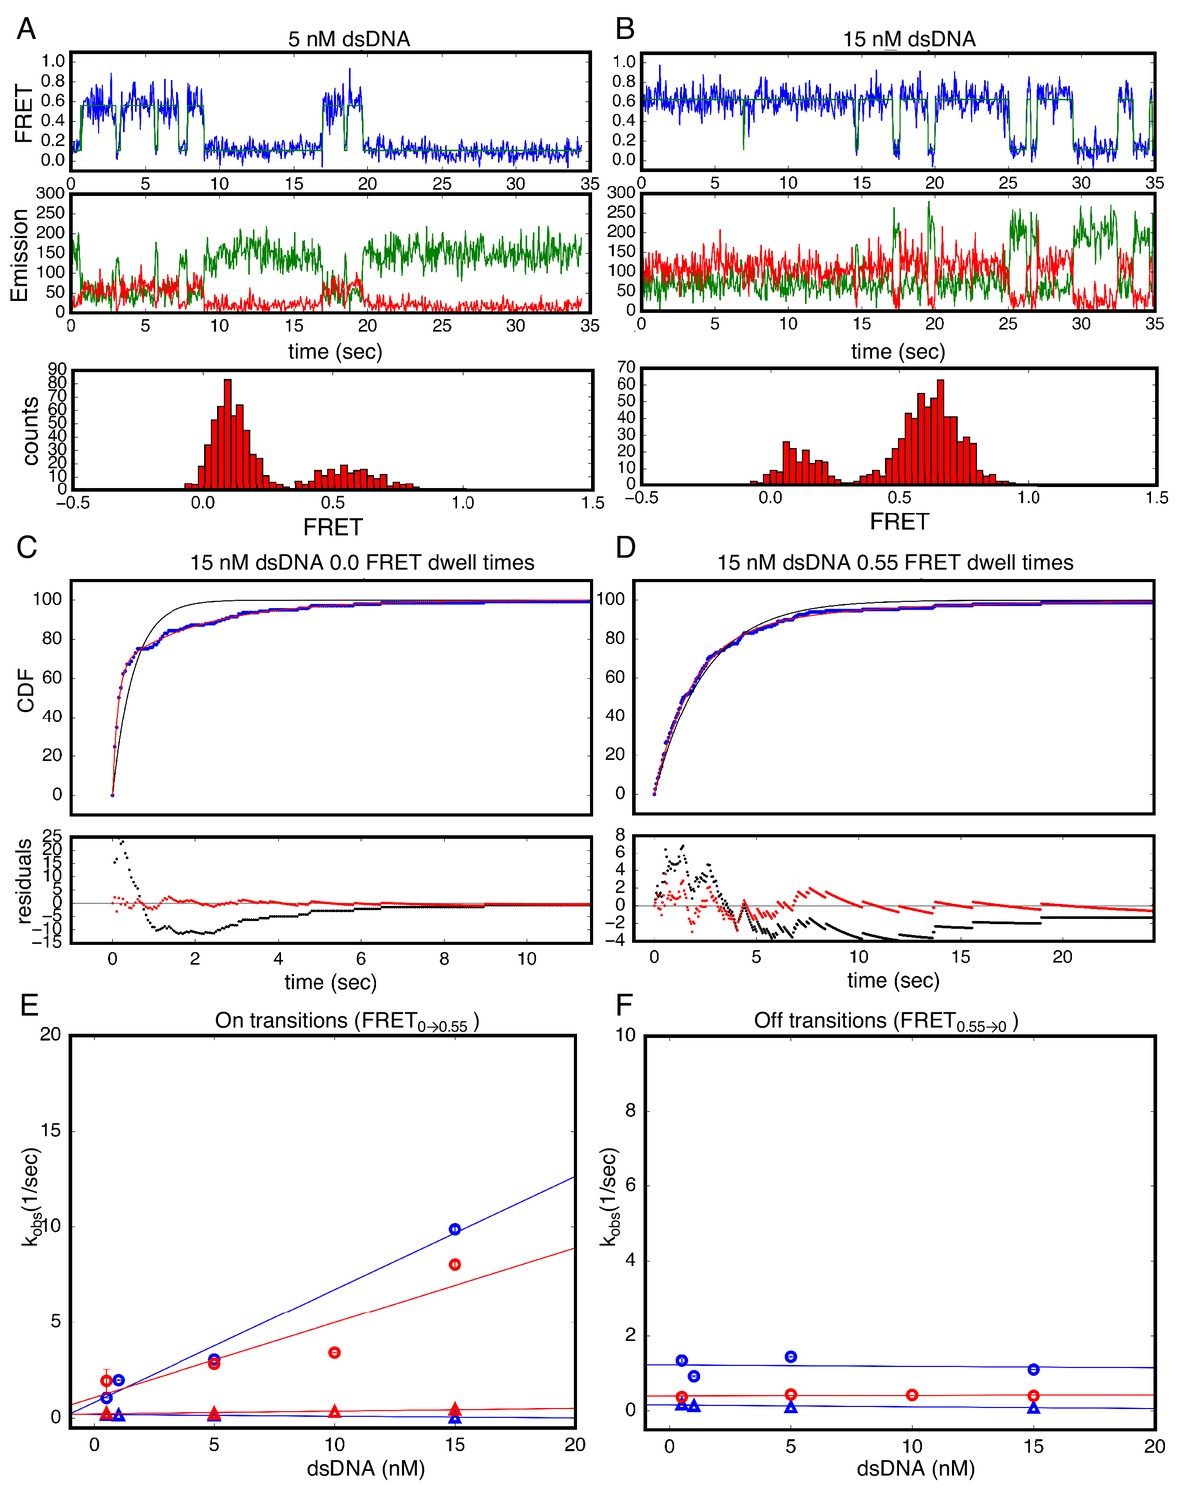
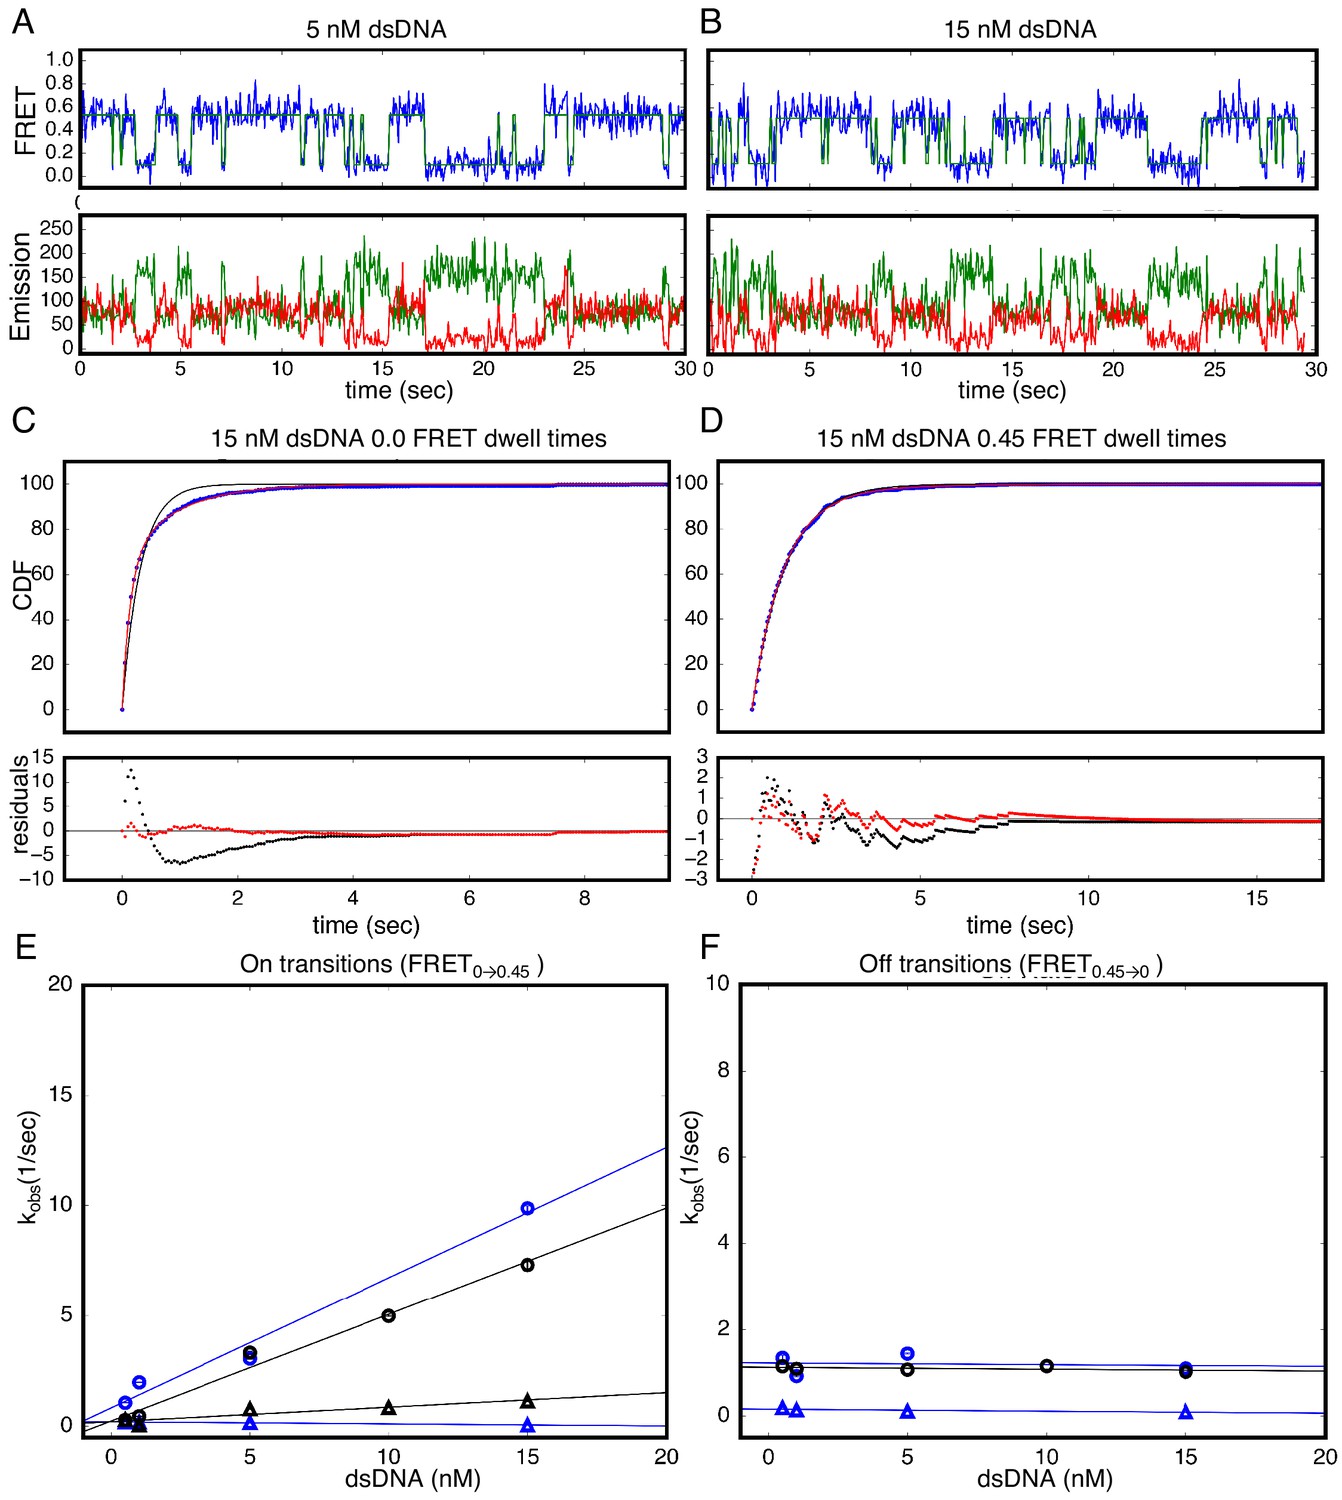
Single Molecule kinetics show multiple phases in binding and unbinding kinetics for NcTALE8 binding to dA15/T15 duplex DNA.
(A–B) Long time trajectories showing transitions between low- and high-FRET states (efficiencies of 0 and 0.45). The top panel shows calculated FRET efficiency in blue and two-state Hidden Markov Model fit in green (McKinney et al., 2006). The bottom panels show Cy3 and Cy5 fluorescence emission in green and red respectively. At low DNA concentration (A), the low FRET state predominates. As DNA concentration is increased (B), more time is spent in the high FRET state, because the dwell times in the low FRET state are shorter. At low DNA concentrations, there appears to be long- and short-lived high-FRET states. Likewise, at near-saturating DNA concentrations, there appear to be long and short-lived low FRET states. (C, D) Cumulative distributions of low- and high-FRET dwell times (blue circles). Fits to single-exponentials (black) show large nonrandom residuals (lower panels), consistent with the heterogeneity noted in (A) and (B). Double-exponentials (red) give smaller, more uniform residuals. (E) Apparent association rate constants as a function of DNA concentration. The apparent rate constant for the fast phase depends on DNA concentration (blue circles), indicating a bimolecular step binding event. The apparent rate constant for the slow phase does not depend on DNA-concentration (blue triangles), suggesting an isomerization event. (F) Apparent dissociation rate constants as a function of DNA concentration (phase one shown in blue circles, and phase two shown in blue triangles). Neither phase shows a DNA concentration dependence, indicating a dissociation and/or isomerization events. 68% confidence intervals are estimated using the conf_interval function of lmfit by performing F-tests (Newville et al., 2014). Conditions: 20 mM Tris pH 8.0, 200 mM KCl.
-
Figure 3—source data 1
List of values used to construct long time trajectories displayed in Figure 3A.
Long time trajectories showing transitions between low- and high-FRET states (efficiencies of 0 and 0.45) for 1 nM dsDNA depicted in Figure 3A.
- https://doi.org/10.7554/eLife.38298.009
-
Figure 3—source data 2
List of values used to construct long time trajectories displayed in Figure 3B.
Long time trajectories showing transitions between low- and high-FRET states (efficiencies of 0 and 0.45) for 15 nM dsDNA depicted in Figure 3B.
- https://doi.org/10.7554/eLife.38298.010
-
Figure 3—source data 3
List of values used to construct CDFs displaed in Figure 3C.
Cumulative distributions of low-FRET dwell times depicted in Figure 3C.
- https://doi.org/10.7554/eLife.38298.011
-
Figure 3—source data 4
List of values used to construct CDFs displayed in Figure 3D.
Cumulative distributions of high-FRET dwell times depicted in Figure 3D.
- https://doi.org/10.7554/eLife.38298.012
Figure 3—figure supplement 1
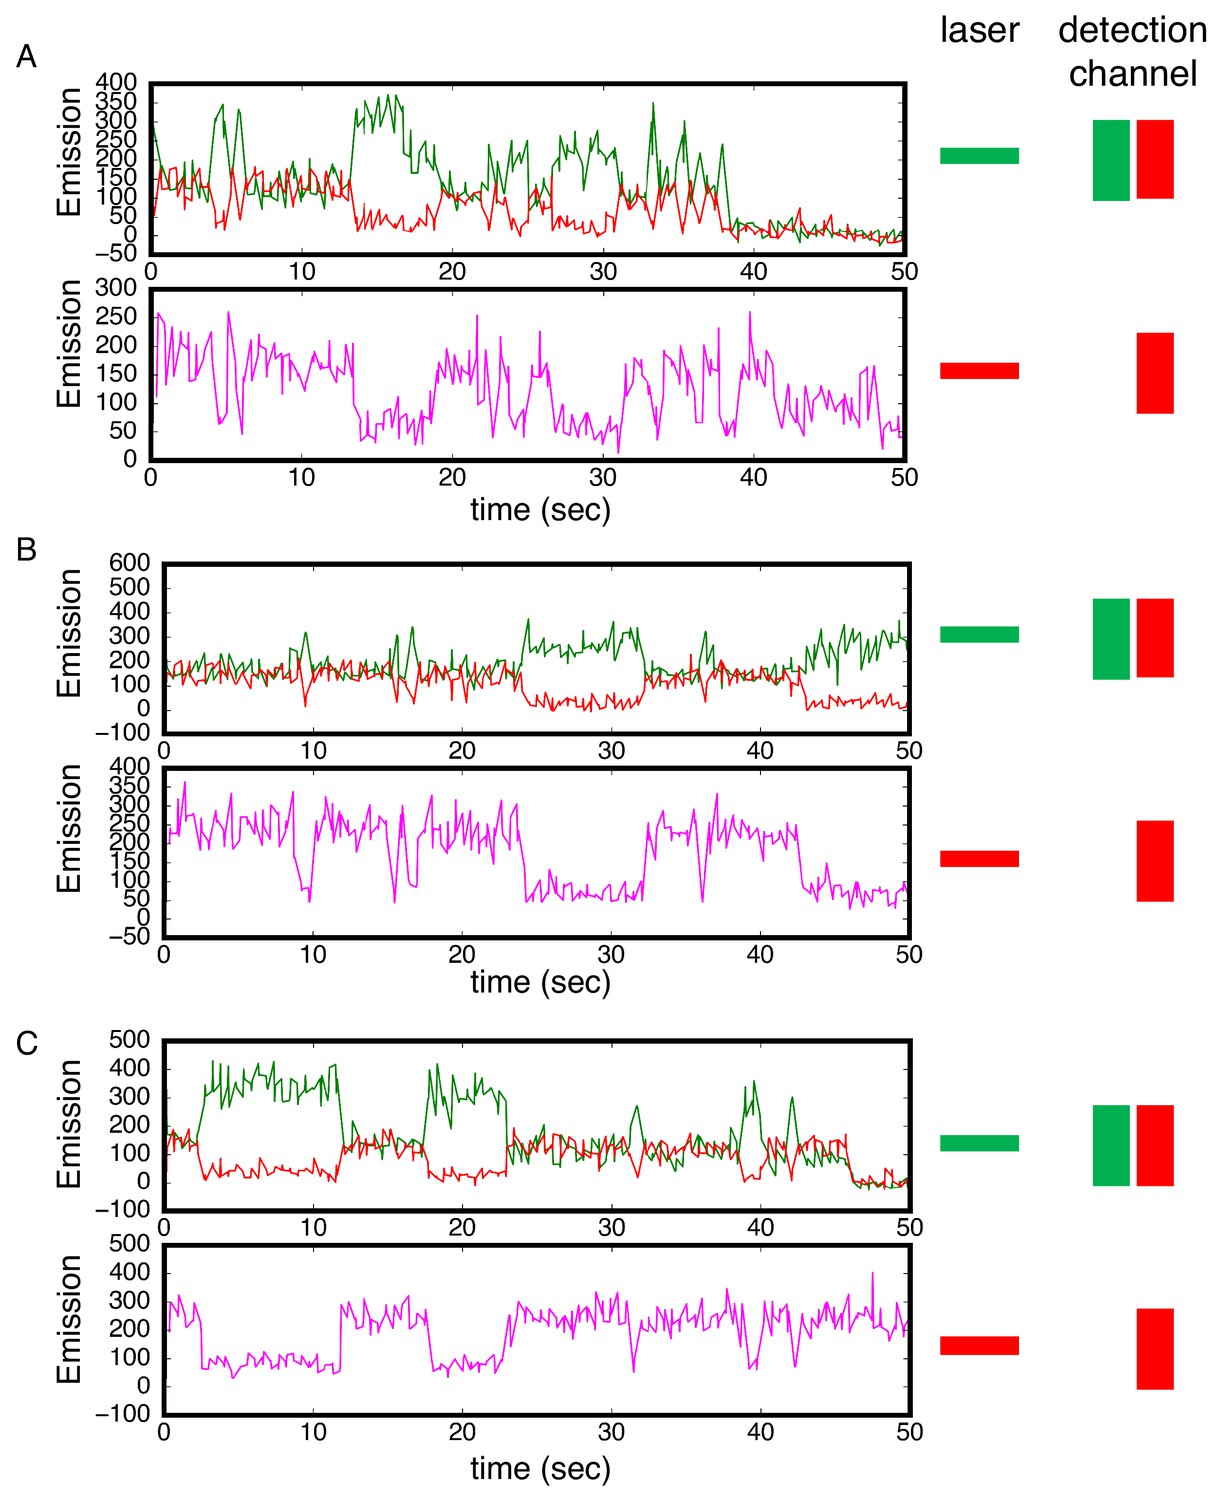
Alternating laser experiments show agreement between cTALE8 FRET and colocalization kinetics.
(A–C) Three representative time trajectories. In these trajectories, excitation alternated between red and green with 250 msec at each color. Top panels show detection of red and green light resulting from green laser excitation. High red (and low green) fluorescence result from FRET. Lower panels show detection of red light resulting from red laser excitation. There is strong correlation between periods of high FRET in the upper panels (high red fluorescence, low green fluorescence) and periods of high red fluorescence (from DNA binding) in the lower panel. Conditions: 200 mM KCl, 20 mM Tris pH 8.0.
Figure 3—figure supplement 2
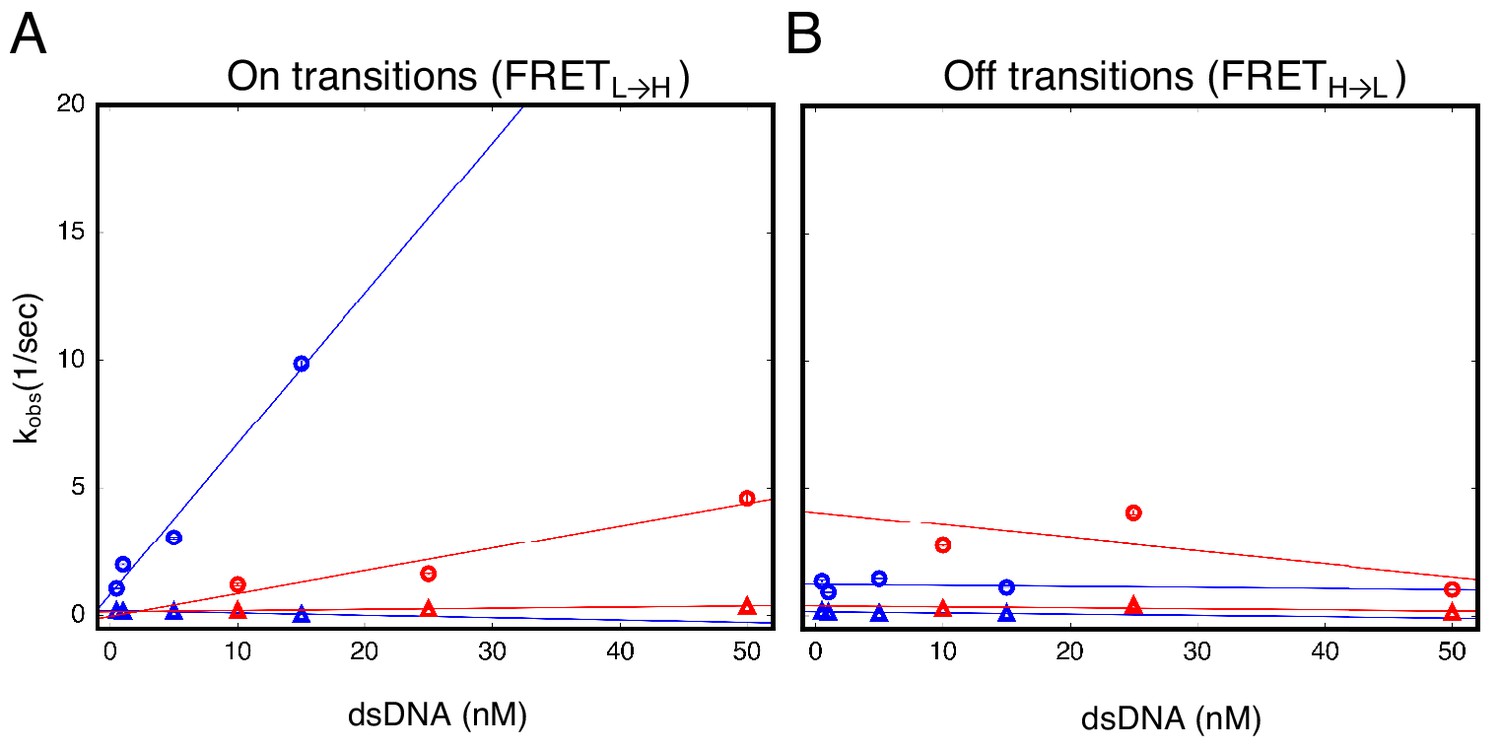
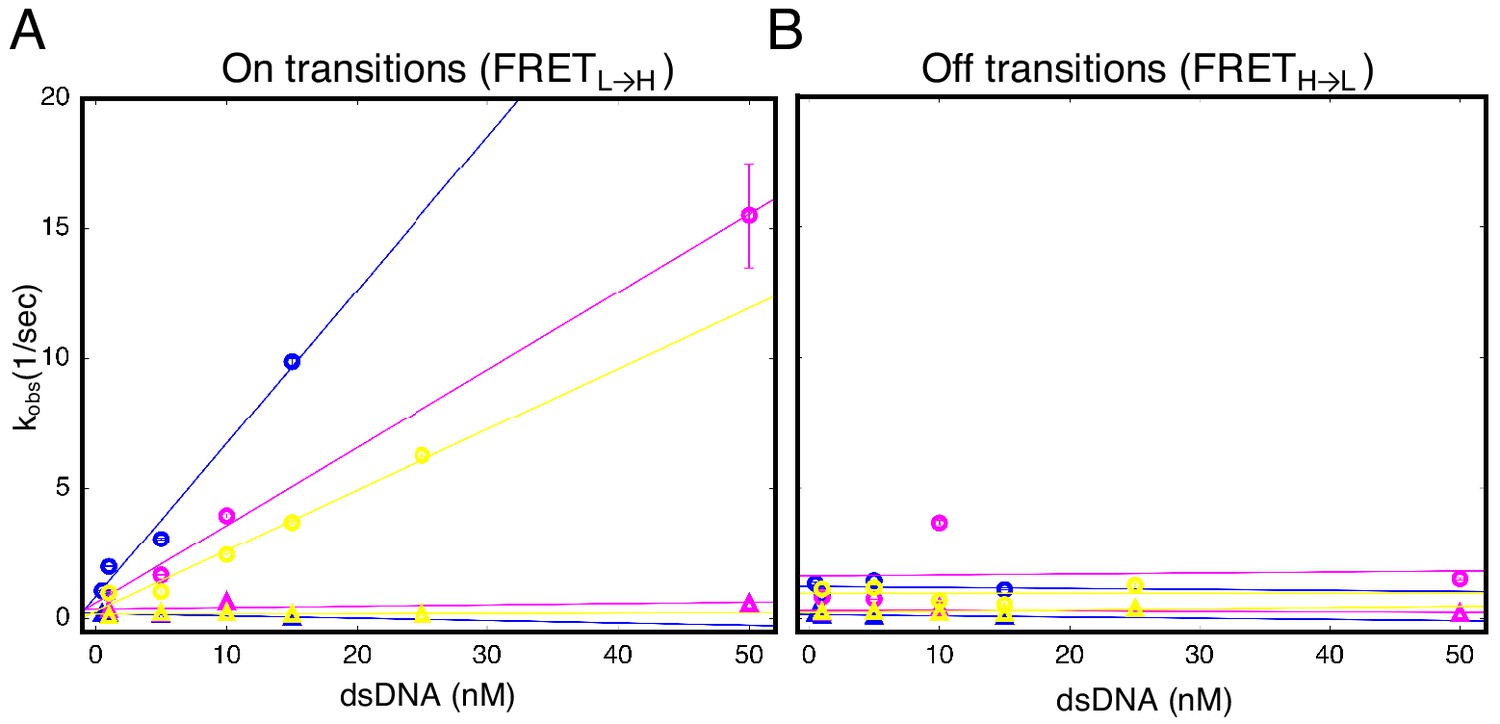
cTALEs do not slide onto ends of short dsDNA.
Apparent association and dissociation rate constants as a function of DNA concentration for an eight repeat cTALE array (NcTALE8) binding to uncapped (blue) and capped (red) DNA, measured by single molecule FRET dwell time analysis. (A) Rate constants for conversion from the low to the high FRET state (FRETL→H). Rate constants for the faster phase increase with DNA concentration (circles), indicating a bimolecular event. The DNA concentration-dependence is stronger (larger slope, k = 0.59 ± 0.08 nM−1 sec−1) with uncapped DNA than with capped DNA (k = 0.09 ± 0.05 nM−1 sec−1), which is likely a result of the faster diffusion of small, uncapped DNA (10 kDa) compared to large, capped DNA (320 kDa). Rate constants for the slower phase are not DNA-concentration dependent (triangles). (B) Rate constants for conversion from the high to the low FRET state (FRETH→L). Neither phase shows a DNA concentration dependence, indicating unimolecular steps. Conditions: 200 mM KCl, 20 mM Tris pH 8.0.
Figure 4
Single Molecule kinetics using T-anchored DNA shows a single unbinding phase.
(A–B) Long time trajectories showing transitions between low- and high-FRET states (efficiencies of 0 and 0.55). The top and middle panels are as in Figure 3A and B. The bottom panels show FRET histograms generated using calculated FRET values at each time point in traces A and B. (C) Cumulative distributions of low-FRET dwell times (blue circles). A Fit to single-exponential (black) shows large nonrandom residuals (lower panel). (D) Cumulative distributions of high-FRET dwell times (blue circles). A fit to single-exponential (black) shows random residuals (lower panel), implying decreased heterogeneity in the T-anchored bound-state. (E) Apparent association rate constants as a function of DNA concentration for the T-anchored TA14/A14T dsDNA (red) and the original A15/T15 dsDNA (blue). The apparent rate constants for the fast phase depend on DNA concentration (circles), indicating a bimolecular step binding event. The apparent rate constants for the slow phase do not depend on DNA-concentration (triangles), suggesting an isomerization event. (F) Apparent dissociation rate constants as a function of DNA concentration (T-anchored dSDNA, red circles; original A15/T15 dsDNA, blue circles and triangles). 67.4% confidence intervals are estimated using the conf_interval function of lmfit by performing F-tests (Newville et al., 2014). Conditions: 20 mM Tris pH 8.0, 200 mM KCl.
Figure 5 with 3 supplements
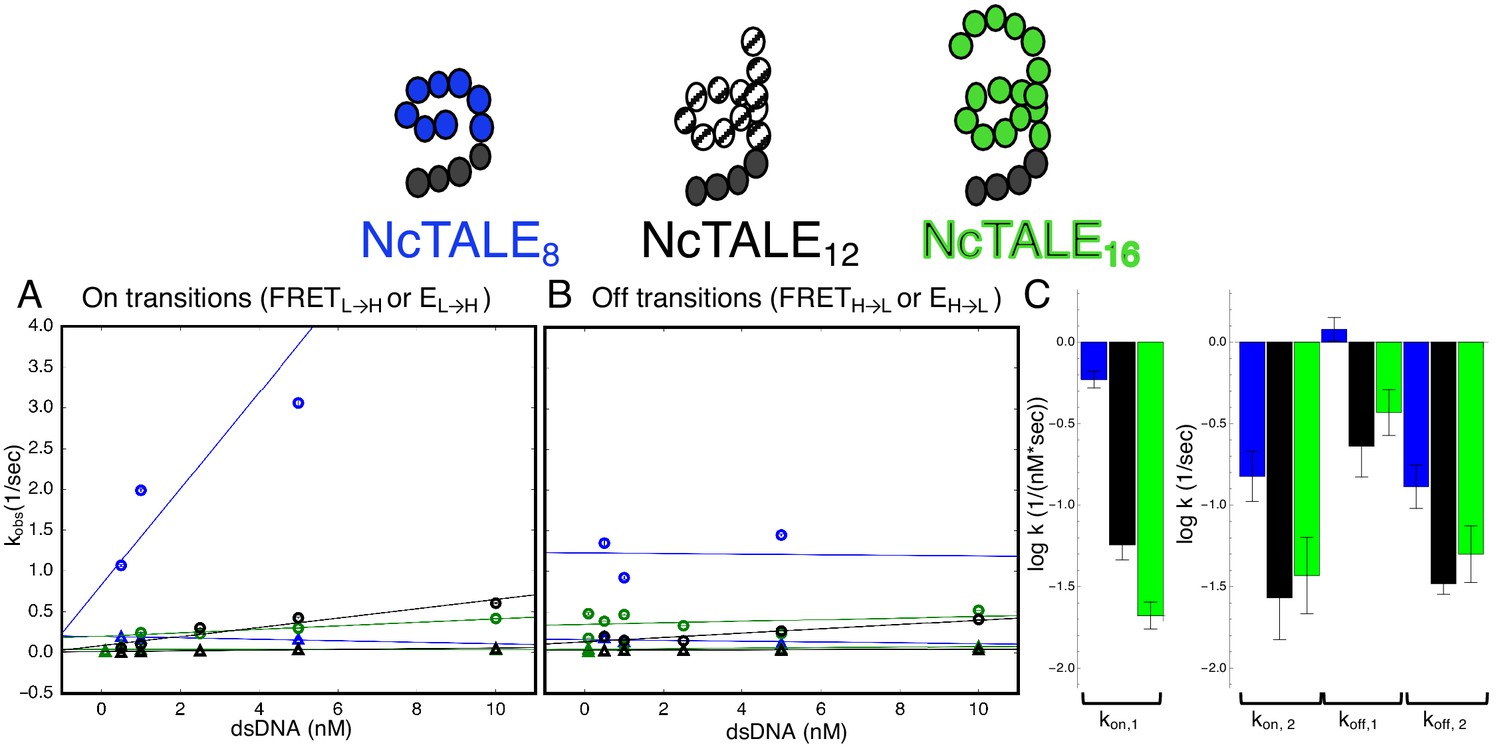
A 16-repeat TALE protein binds and unbinds DNA more slowly than an eight repeat protein.
(A) Apparent association rate constants as a function of DNA concentration for an eight repeat cTALE (blue) binding to dA15/T15 duplex DNA, and for a 12 repeat cTALE (black) and a 16 repeat cTALE (green) binding to dA23/T23 duplex DNA. eight repeat TALE kinetics are measured by FRET (FRETL→H) while 12 and 16 repeat TALE kinetics are measured by colocalization (EL→H). The apparent rate constants for the fast phase of binding are DNA concentration dependent (blue, black, and green circles), indicating a bimolecular binding event. The DNA concentration-dependence is greatest (larger slope) for the eight repeat cTALE. The apparent rate constants for the slow phase do not depend on DNA-concentration (blue, black, and green triangles), suggesting an isomerization event. (B) Apparent dissociation rate constants as a function of DNA concentration (phase one shown in circles, and phase two shown in triangles). Neither phase shows a DNA concentration dependence, indicating a dissociation and/or isomerization events. Rate constants for all phases are slower for the 12-repeat construct (black) and 16-repeat construct (green) than for the 8-repeat construct (blue), particularly for the bimolecular binding step. (C) Log10 of rate constants for 8 (blue), 12 (black), and 16(green) repeat cTALEs. Units of the bimolecular binding rate constant are nM−1s−1, other unimolecular rate constants have units s−1. 67.4% confidence intervals are estimated using the conf_interval function of lmfit by performing F-tests (Newville et al., 2014). Conditions: 20 mM Tris pH 8.0, 200 mM KCl.
Figure 5—figure supplement 1
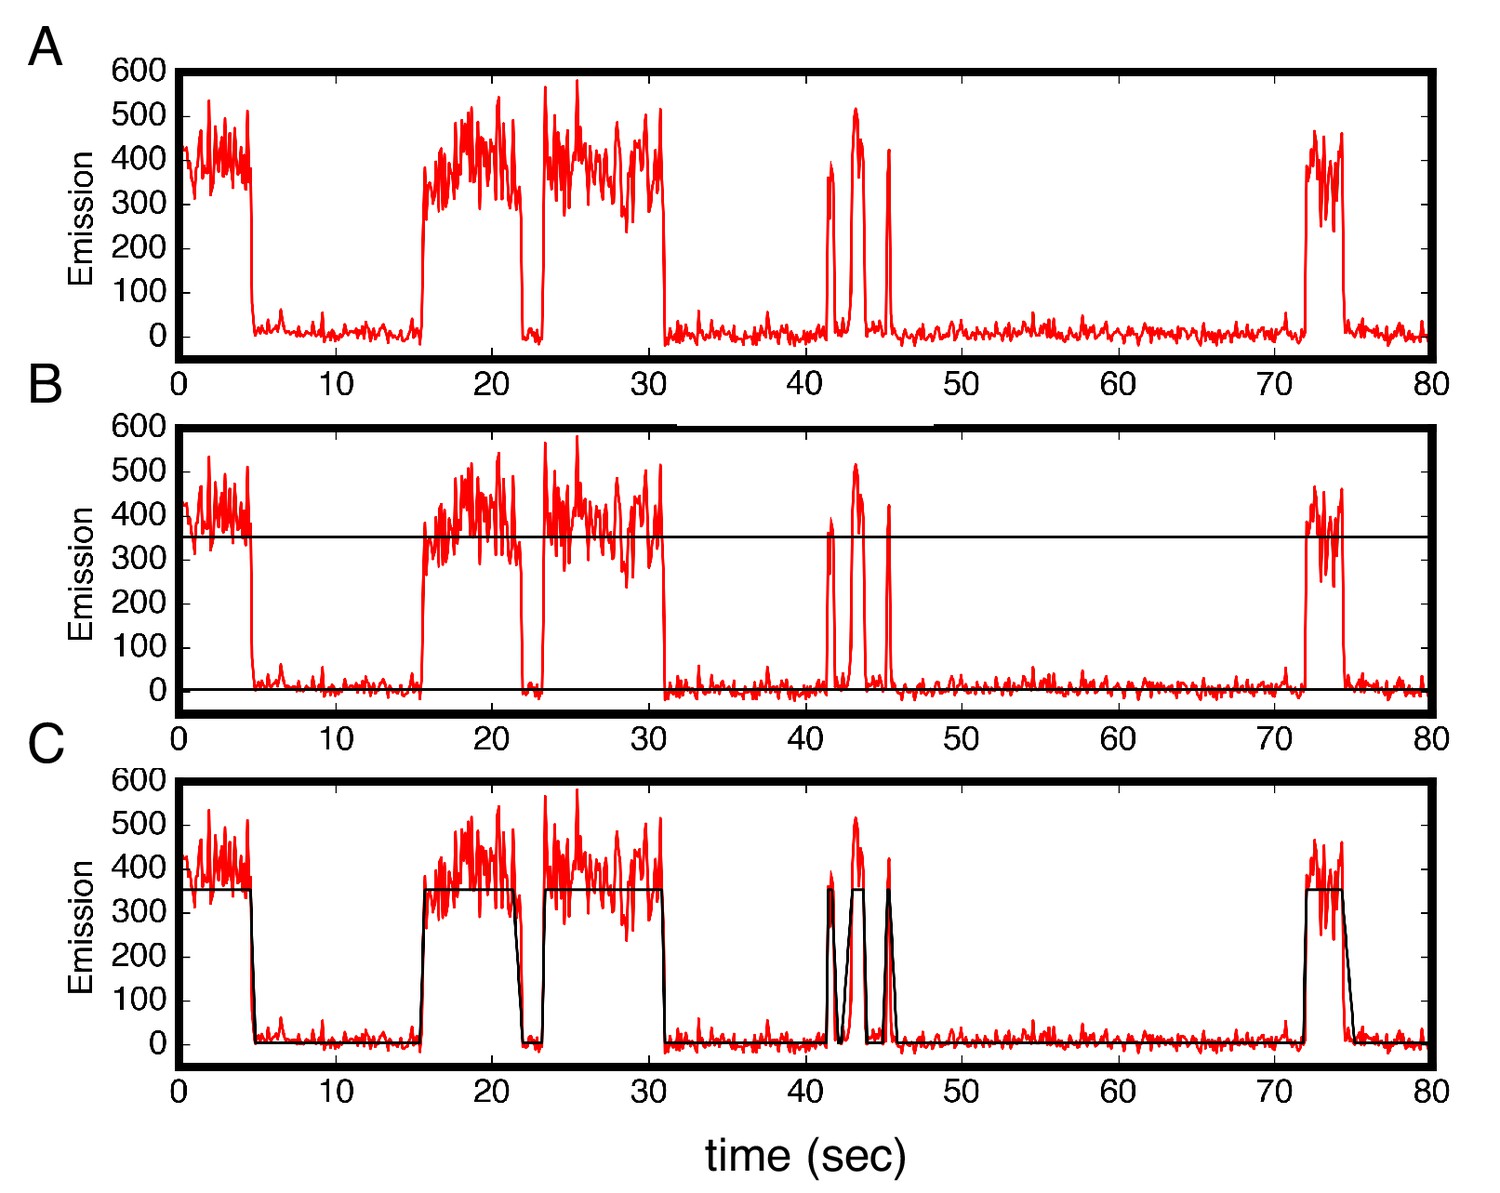
Colocalization trajectories show TALE-DNA binding and unbinding events.
(A–C) One representative time trajectory and colocalization analysis for a sixteen repeat TALE, NcTALE16, incubated with 1 nM Cy5-A15/T15. In the colocalization protocol, both the green and red lasers were used in the first ten frames (not shown) to identify single molecule locations. For all subsequent frames, Cy5-labeled DNA was continuously excited with the red laser. Red light emission images (from Cy5) were collected with time steps of 100 msec. (A) Trajectories were generated from sites of red/green colocalization in the first ten frames, and were corrected for background Cy5 emission (red trajectories above). For each trajectory, we set two thresholds for low and high Cy5 emission (B). A molecule is designated to be in the high emission (DNA-bound) state above the high threshold, and in the low emission state below the low threshold. (C) From this state-assignment procedure, dwell-times were determined in the high (bound) and low (unbound) states. Conditions: 200 mM KCl, 20 mM Tris pH 8.0.
Figure 5—figure supplement 2
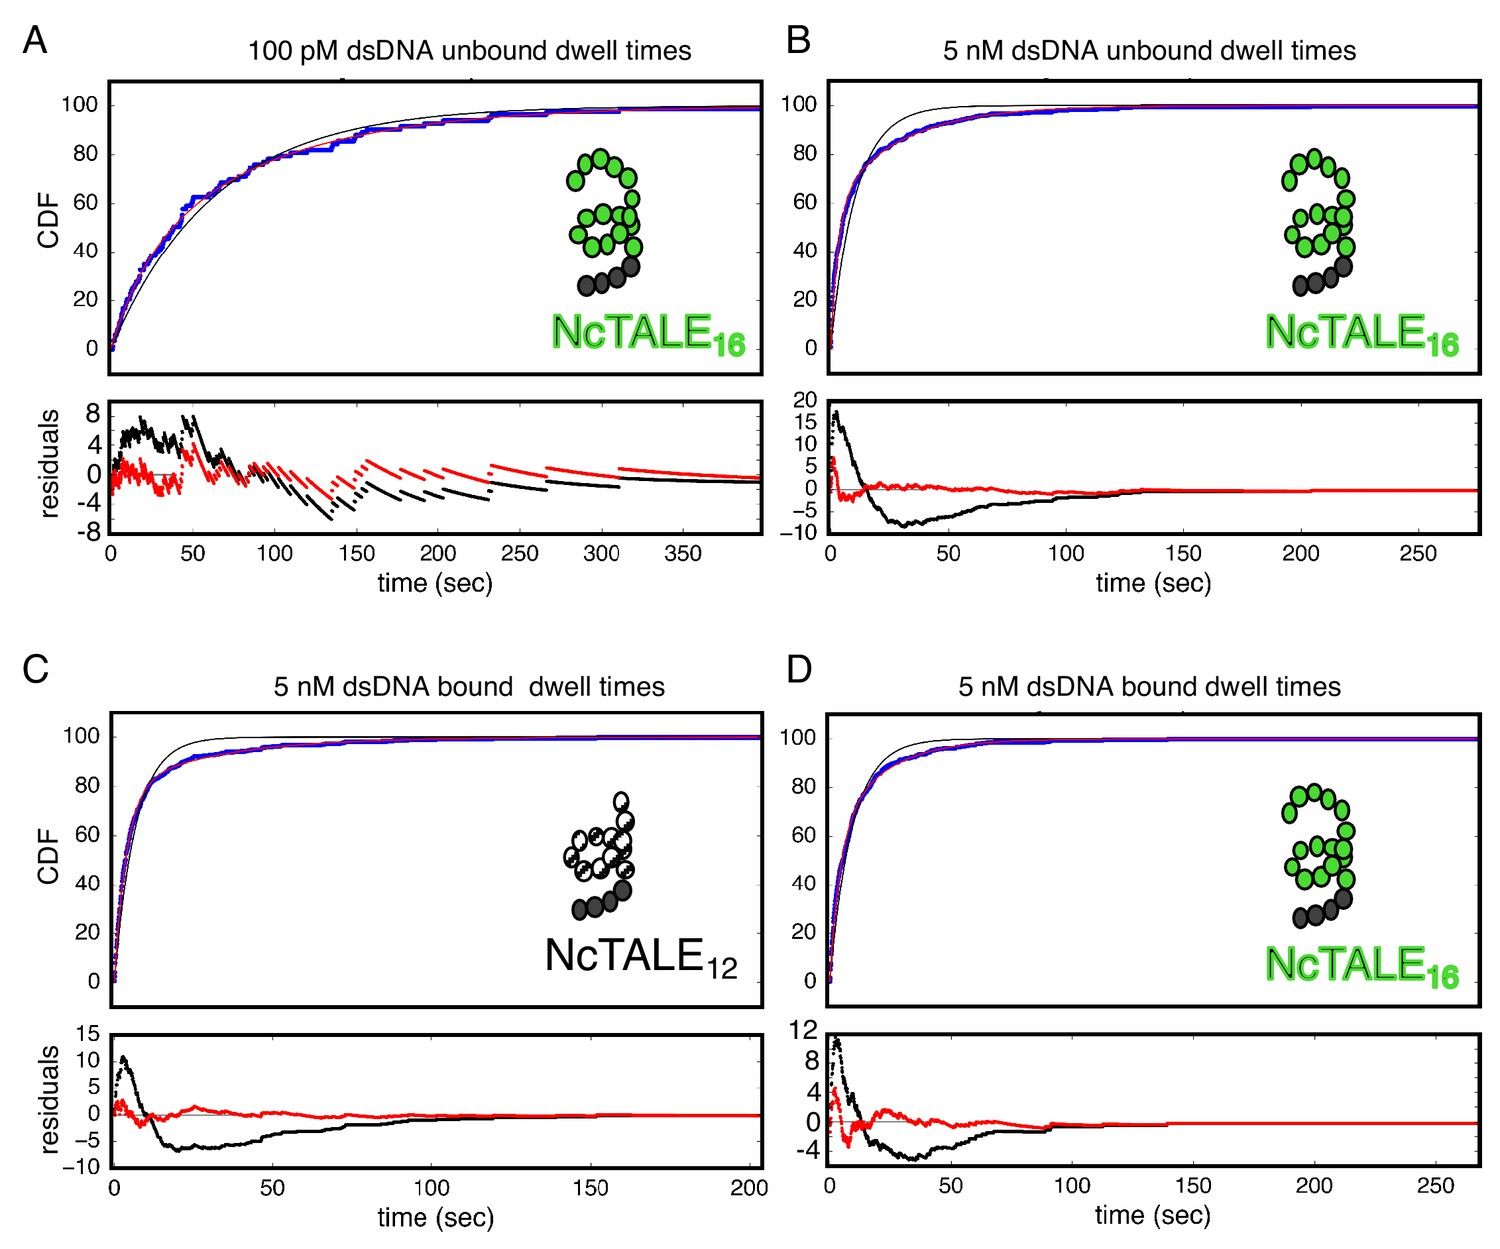
Bound and unbound lifetimes of 16- and 12-repeat TALE proteins are consistent with multiphasic binding and unbinding.
(A, B) Cumulative distributions of low-FRET dwell times (blue circles) for a 16-repeat construct at low and high DNA concentration. Fits to single-exponentials (black) show large nonrandom residuals (lower panels) which are most pronounced at high DNA concentrations, consistent with the binding heterogeneity observed in eight repeat cTALEs (Figure 3). Double-exponentials (red) give smaller, more uniform residuals. (C, D) Cumulative distributions of high-FRET dwell times (blue circles) for 16- and 12-repeat constructs at high DNA concentration. Fits to single-exponentials (black) show large nonrandom residuals (lower panels), consistent with the dissociation heterogeneity observed in eight repeat cTALEs. Double-exponentials (red) give smaller, more uniform residuals.
Figure 5—figure supplement 3
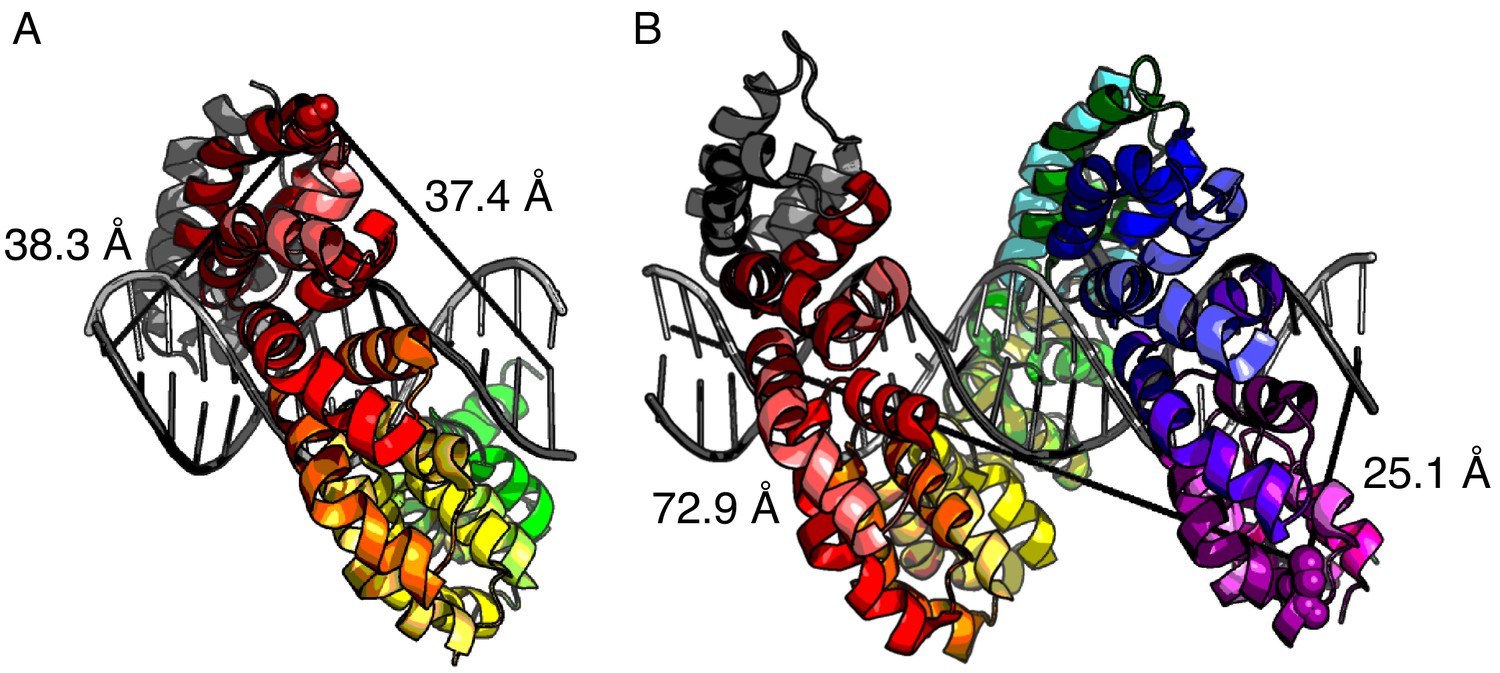
Distance estimates between labeling sites for NcTALE8 and NcTALE16 and the 5’ ends of bound DNA.
The crystal structure of PthXo1 (PDB: 3UGM) (Mak et al., 2012) in complex with DNA (colored by repeat) as a model of donor-acceptor fluorophore distances. (A) The distance from C30 in the first repeat (the site of labelling in NcTALE8) to the 5’ base of the sense strand (light grey) is 38.3 Å; the distance to the 5’ base of the antisense strand (dark grey) is 37.4 Å. (B) The distance from C30 in the fourteenth repeat (the site of labelling in NcTALE16) to the 5’ base of the sense strand (light grey) is 72.9 Å; the distance to the 5’ base of the antisense strand (dark grey) is 25.1 Å. Note that although there is likely to be some variation in these distances since the DNAs used here are longer (15 and 23 bases) than the TALE arrays (8 and 16 repeats, each with a four-repeat N-capping domain), the differences in donor-acceptor distances for the 16 repeat construct (B) are likely to be robust to registry shifts of a few bases.
Figure 6
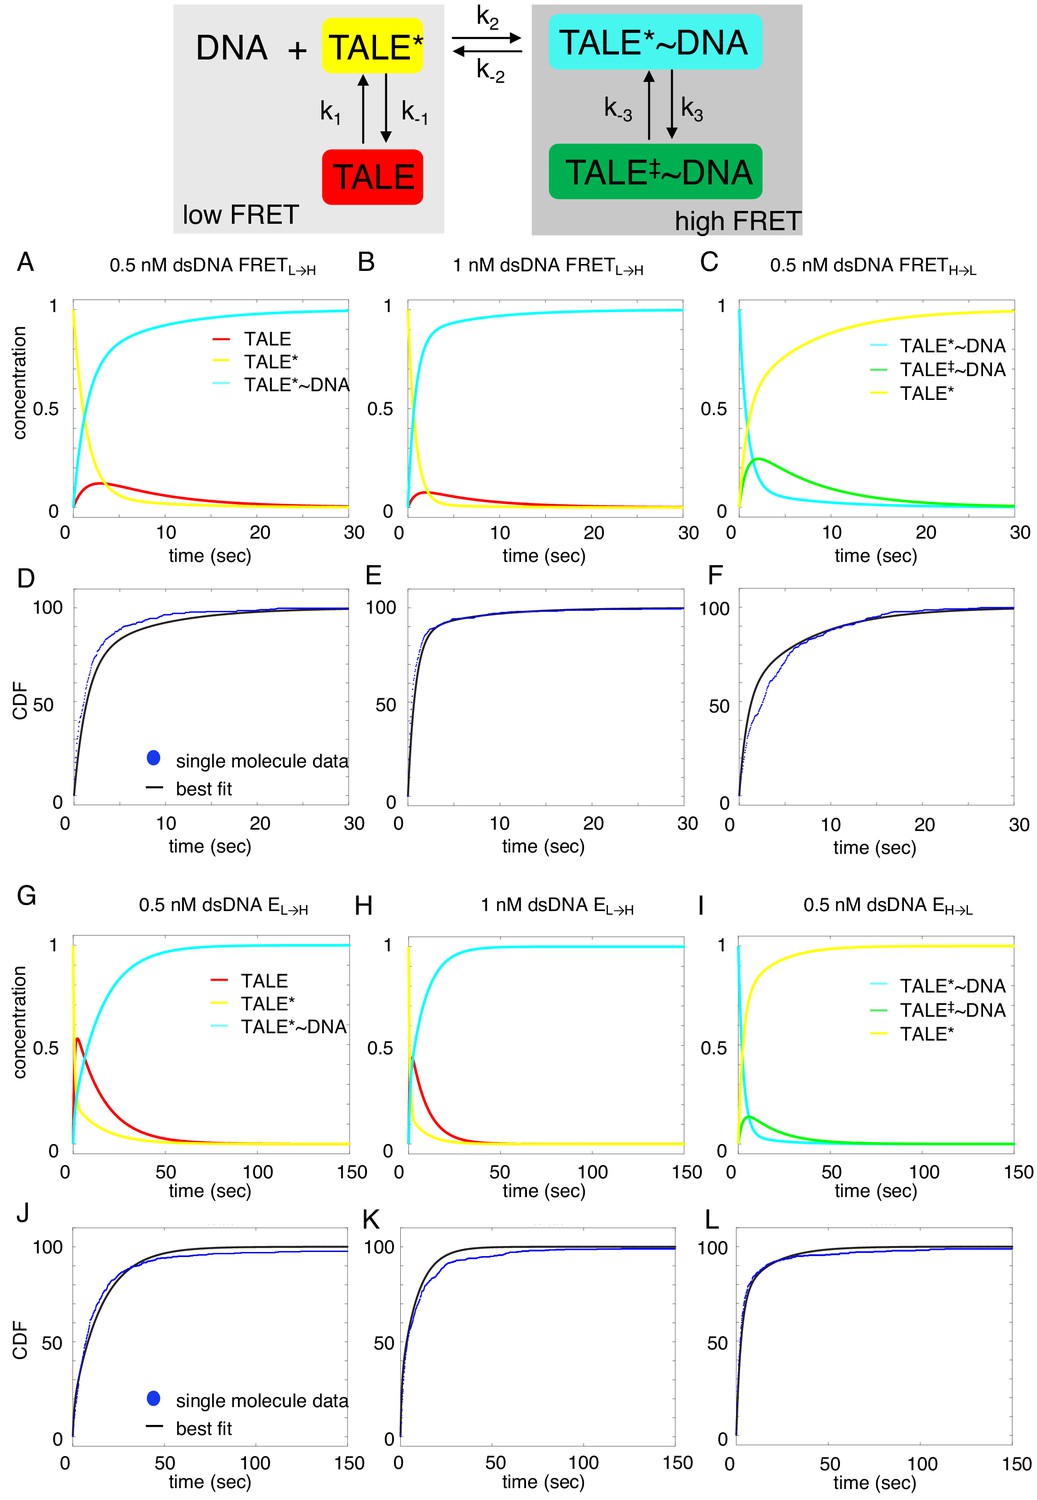
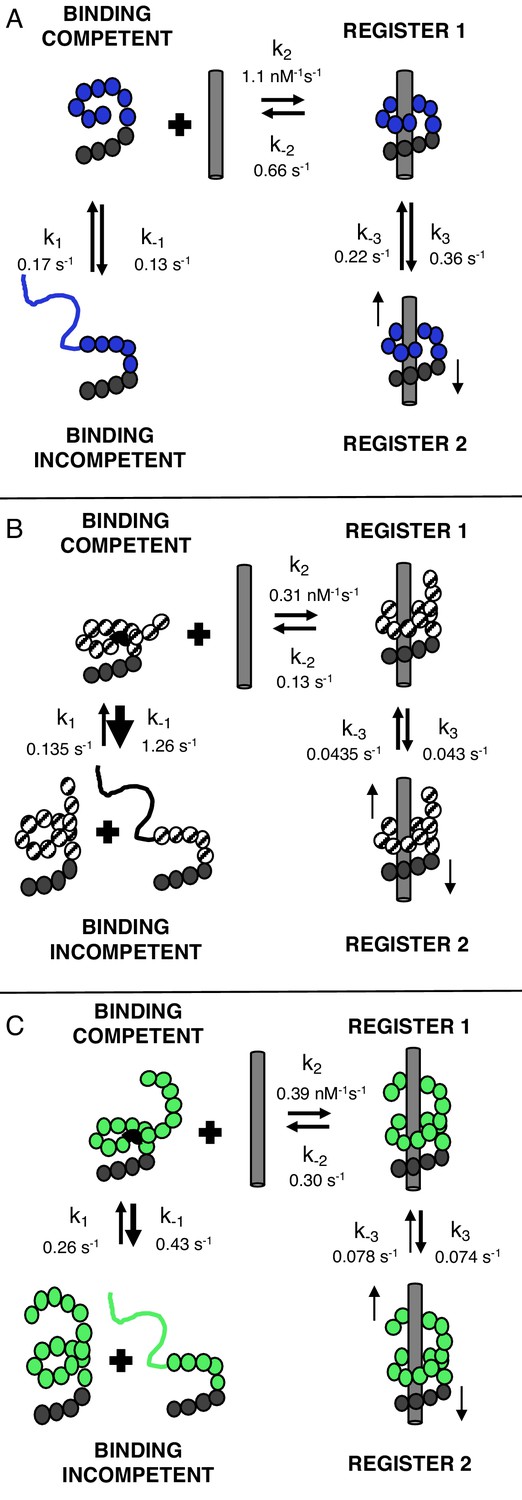
Deterministic simulations provide evidence for conformational heterogeneity in the unbound state.
The model most consistent with data is shown at the top. Unbound TALEs can exist in DNA-binding competent (TALE*) or DNA-binding incompetent (TALE) states. DNA-bound TALEs can exist in short-lived (TALE*~DNA) or long-lived (TALE‡~DNA) DNA-bound states. Cumulative distributions of dwell-times (shown as blue points) from eight repeat single-molecule time trajectories (A–F) and 16 repeat single-molecule time trajectories (G–L) were analyzed with the model (best-fit shown in black). (A–C and G–I) Populations of states as a function of time, generated by numerical integration in Matlab. (D–F and J–L) Best-fit microscopic rate constants and 68% confidence intervals are listed in Table 1.
Figure 7 with 4 supplements
TALEs with multiple superhelical turns must break to bind DNA.
Single-molecule FRET studies and deterministic modeling support a model where TALEs exist in four states: binding incompetent, binding competent, and bound states in (at least) two distinct registers. In this model, for TALEs that form less than one full superhelical turn (eight repeats, (A), partly folded states are off-pathway and slow down binding. For longer TALEs that form one (12, B) or more (16, C) complete superhelical turns, partial unfolding is required for binding. DNA-bound TALEs populate multiple registers with distinct dissociation kinetics. Dynamics of long (12 and 16-repeat; B–C) TALEs bound to DNA are significantly slower than for the shorter (8-repeat; A) TALEs.
Figure 7—figure supplement 1
Urea and destabilizing mutations decrease apparent binding rate of cTALE8.
(A) Apparent association rate constants as a function of DNA concentration for an eight repeat cTALE in 0 M urea (blue), 1 M urea (pink), and with destabilizing point mutations (yellow; mutations substitute leucine at position one in the fourth repeat with a glycine). The DNA concentration dependence is strongest (steepest slope) in the absence of urea and destabilizing point substitutions (circles). Rates in the slower phase (triangles) appear unaffected by urea or mutational destabilization. (B) Apparent dissociation rate constants as a function of DNA concentration (phase one shown in circles, and phase two shown in triangles). Rates in the both phases appear unaffected by urea and mutational destabilization. Conditions: 200 mM KCl, 20 mM Tris pH 8.0.
Figure 7—figure supplement 2
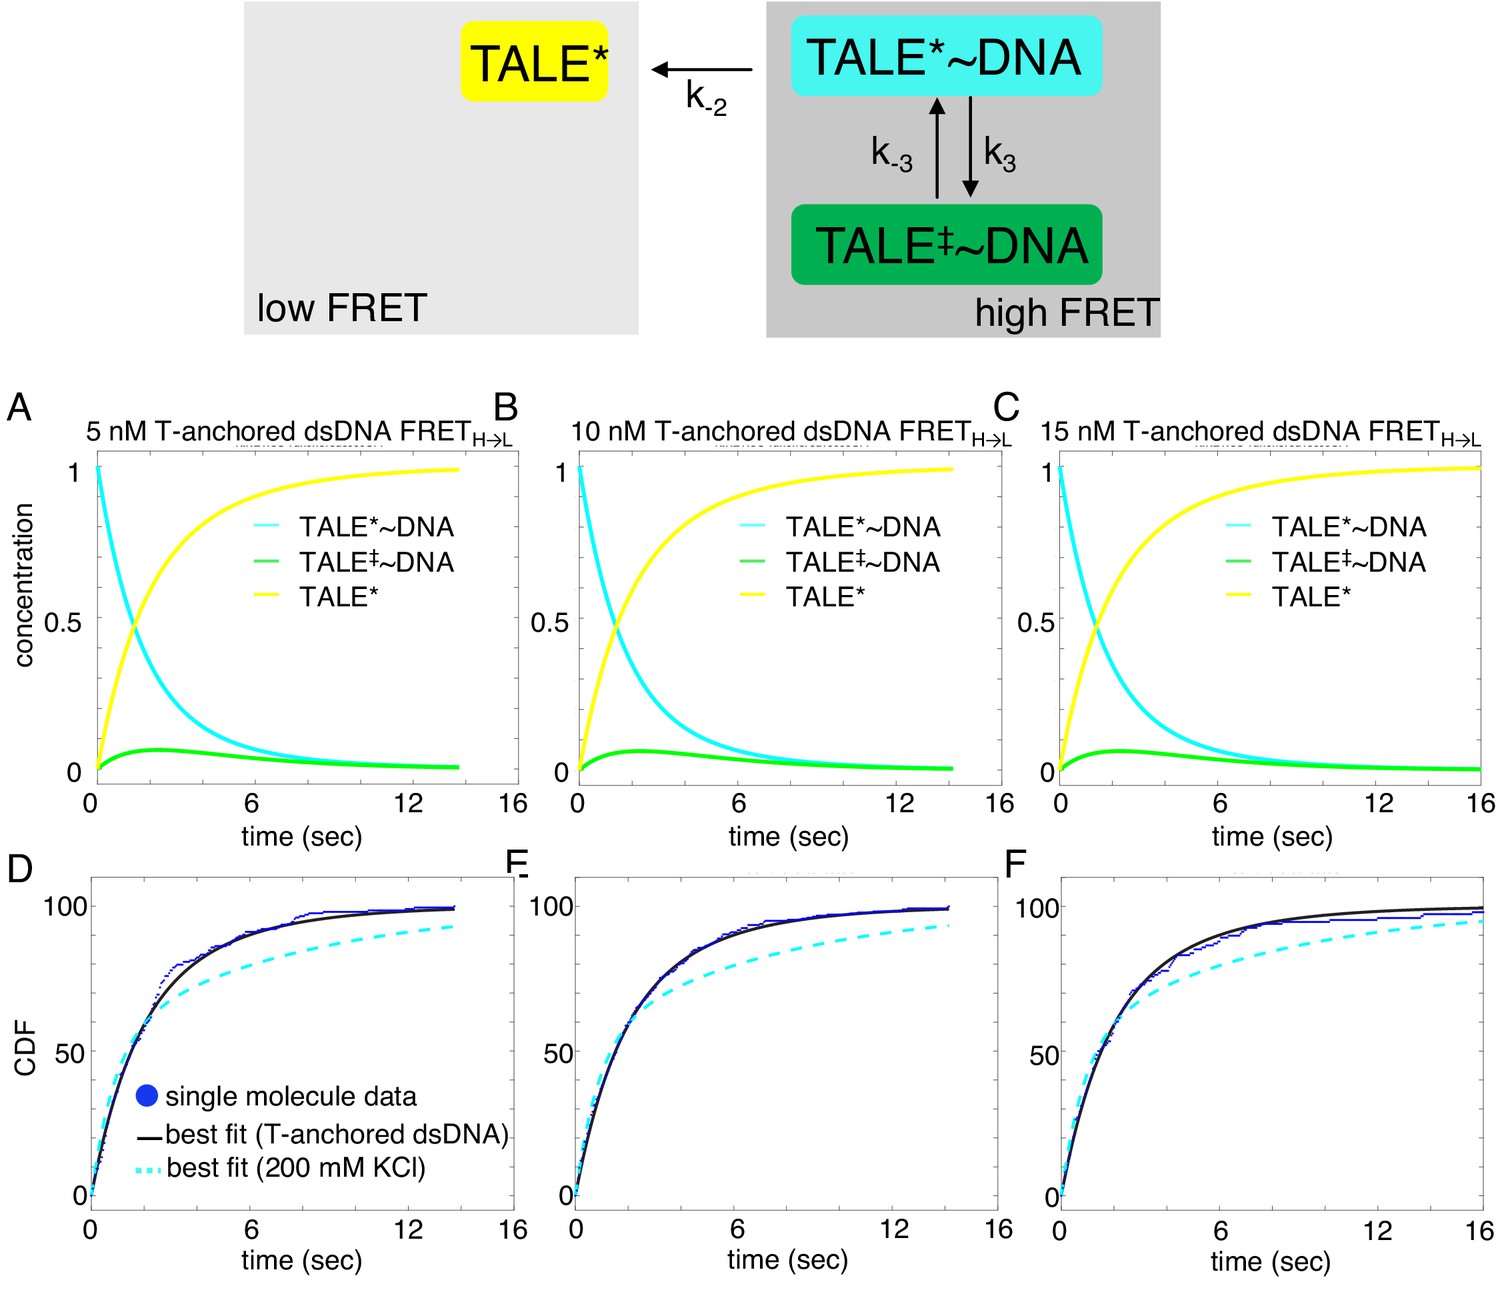
Deterministic simulations provide evidence for the impact of T-anchored oligo on unbinding kinetics of cTALE8.
DNA-bound TALEs can exist in short-lived (TALE*~DNA) or long-lived (TALE‡~DNA) DNA-bound states. Cumulative distributions of dwell-times (shown as blue points) from eight repeat single-molecule time trajectories (D–F) were analyzed with the model (best-fit shown in black), and best fit double-exponentials from the original A15/T15 DNA are shown in dashed cyan. (A–C) Populations of states as a function of time, generated by numerical integration in Matlab. Mean microscopic rate constants and 68% confidence intervals determined with 2000 bootstrap iterations are listed in Table 2. This slightly more complex model better describes the data than a single exponential (reduced chi-squared 0.031 versus 0.058 respectively).
Figure 7—figure supplement 3
Single molecule kinetics in the presence of magnesium cation show a single unbinding phase.
(A–B) Long time trajectories showing transitions between low- and high-FRET states (efficiencies of 0 and 0.45). The top panel shows calculated FRET efficiency in blue and two-state Hidden Markov Model fit in green (McKinney et al., 2006). The bottom panels show Cy3 and Cy5 fluorescence emission in green and red respectively. (C) Cumulative distributions of low-FRET dwell times (blue circles). Fits to single-exponentials (black) show large nonrandom residuals (lower panels), consistent with the heterogeneity noted in (A) and (B). (D) Cumulative distributions of high-FRET dwell times (blue circles). Fits to single-exponentials (black) show random residuals (lower panels). (E) Apparent association rate constants as a function of DNA concentration for the 40 mM MgCl2 shown in black and the original 200 mM KCl shown in blue. (F) Apparent dissociation rate constants as a function of DNA concentration (40 mM MgCl2 shown in black circles; original 200 mM KCl phase one shown in blue circles, and phase two shown in blue triangles). 68% confidence intervals are estimated using the conf_interval function of lmfit by performing F-tests (Newville et al., 2014). Conditions: 20 mM Tris pH 8.0, 40 mM MgCl2 and 20 mM Tris pH 8.0, 200 mM KCl as described above.
Figure 7—figure supplement 4
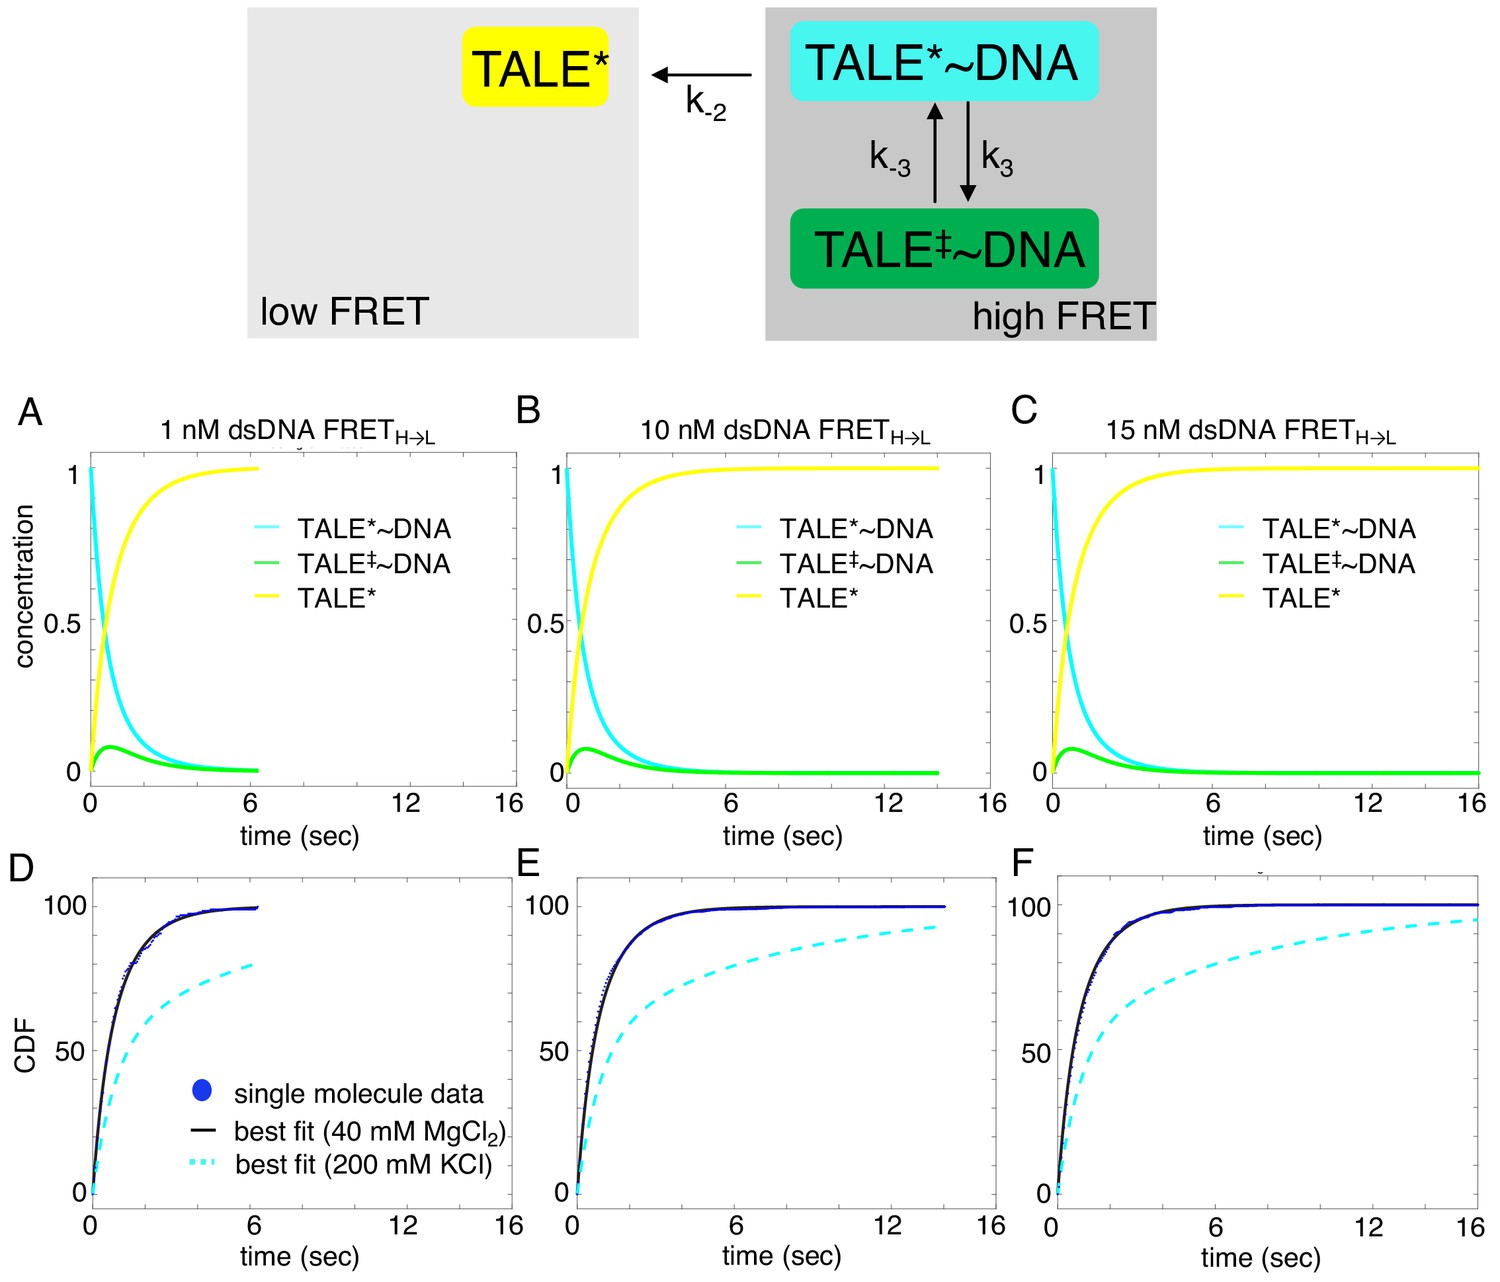
Deterministic simulations provide evidence for the impact of divalent cations on unbinding kinetics of cTALE8.
DNA-bound TALEs can exist in short-lived (TALE*~DNA) or long-lived (TALE‡~DNA) DNA-bound states. Cumulative distributions of dwell-times (shown as blue points) from eight repeat single-molecule time trajectories (A–F) were analyzed with the model in the top panel (best-fit shown in black). (A–C) Populations of states as a function of time, generated by numerical integration in Matlab. (D–F) Cumulative distributions are shown in blue circles, best fit lines are shown in black, and best fit lines with the original solution conditions (200 mM KCl) are dotted in cyan. Mean microscopic rate constants and 68% confidence intervals determined with 2000 bootstrap iterations are listed in Table 2. The more complex model (top panel) fits better than a single exponential (reduced chi-squared 0.021 versus 0.06 respectively).
Tables
Table 1
Kinetic parameters obtained from deterministic simulation fits of NcTALEs binding to homopolymeric A/T duplex DNA.
https://doi.org/10.7554/eLife.38298.019| k1 (sec−1) | k-1 (sec−1) | Keq, DNA-free | k2(sec−1nM−1) | k-2 (sec−1) | k3 (sec−1) | k-3 (sec−1) | Keq, DNA-bound (nM−1) | |
|---|---|---|---|---|---|---|---|---|
| NcTALE8a | 0.17 [0.16, 0.18] | 0.13 [0.12, 0.14] | 1.32 [1.26, 1.39] | 1.1 [1.08, 1.12] | 0.66 [0.65, 0.67] | 0.36 [0.35, 0.37] | 0.222 [0.218, 0.227] | 1.62 [1.58, 1.66] |
| NcTALE12 b | 0.135 [0.133, 0.137] | 1.26 [1.09, 1.34] | 0.11 [0.10, 0.12] | 0.31 [0.28, 0.33] | 0.130 [0.129, 0.131] | 0.043 [0.042, 0.044] | 0.0435 [0.0428, 0.0442] | 0.99 [0.97, 1.00] |
| NcTALE16 a | 0.26 [0.25, 0.27] | 0.43 [0.39, 0.47] | 0.61 [0.57, 0.64] | 0.39 [0.38, 0.41] | 0.299 [0.298, 0.300] | 0.074 [0.073, 0.076] | 0.078 [0.076, 0.079] | 0.96 [0.95, 0.97] |
-
Parameters for NcTALE8 are for binding to dA15/T15 duplex DNA; those for NcTALE12 and NcTALE16 are for binding to dA23/T23 duplex DNA. 68% confidence intervals shown in brackets are from 2000a and 8000b iterations of bootstrap analysis.
Table 2
NcTALE8 kinetic unbinding parameters obtained from deterministic fits.
https://doi.org/10.7554/eLife.38298.025| DNA | Salt | k-2 (sec−1) | k3 (sec−1) | k-3 (sec−1) | Keq, DNA-bound (nM−1) | |
|---|---|---|---|---|---|---|
| 1 | Cy5-A15/T15 dsDNA | 200 mM KCl | 0.66 [0.65, 0.67] | 0.36 [0.35, 0.37] | 0.222 [0.218, 0.227] | 1.62 [1.58, 1.66] |
| 2 | Cy5-TA14/T14A dsDNA | 200 mM KCl | 0.48 [0.475, 0.483] | 0.06 [0.054, 0.068] | 0.31 [0.28, 0.33] | 0.199 [0.192, 0.205] |
| 3 | Cy5-A15/T15 dsDNA | 40 mM MgCl2 | 1.28 [1.27, 1.30] | 0.32 [0.28, 0.35] | 1.40 [1.30, 1.51] | 0.224 [0.211, 0.237] |
-
Mean and 68% confidence intervals shown in brackets are from 2000 iterations of bootstrap analysis.
Additional files
-
Transparent reporting form
- https://doi.org/10.7554/eLife.38298.026
Download links
A two-part list of links to download the article, or parts of the article, in various formats.
Downloads (link to download the article as PDF)
Open citations (links to open the citations from this article in various online reference manager services)
Cite this article (links to download the citations from this article in formats compatible with various reference manager tools)
Functional instability allows access to DNA in longer transcription Activator-Like effector (TALE) arrays
eLife 8:e38298.
https://doi.org/10.7554/eLife.38298


