Tracing a protein’s folding pathway over evolutionary time using ancestral sequence reconstruction and hydrogen exchange
- University of California, Berkeley, United States
- Chan Zuckerberg Biohub, United States
Figures
Figure 1
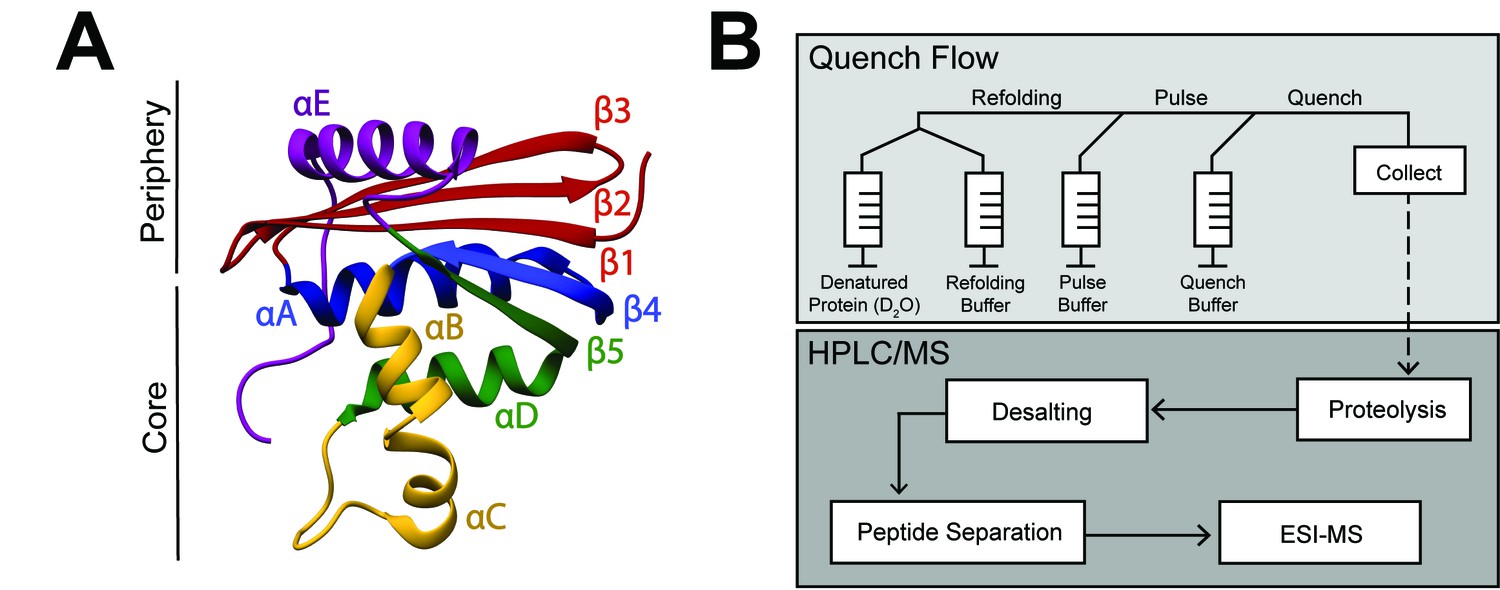
RNase H structure and schematic of pulsed-labeling HX-MS experiment
(A) Crystal structure of E. coli RNase H* (ecRNH*) (PDB: 2RN2) (Katayanagi et al., 1992). Secondary structural elements: Red: Strand 1, Strand 2, Strand 3; Blue: Helix A, Strand 4; Yellow: Helix B, Helix C; Green: Helix D, Strand 5; Purple: Helix E. The core region of the protein (Icore) involving Helix A, Strand 4, Helix B, Helix C, Helix D, Strand 5 and the periphery region of the protein involving Strand 1, Strand 2, Strand 3, Helix E are denoted. (B) Pulsed-labeling setup and workflow. Unfolded, fully deuterated protein in high [urea] is rapidly mixed with low [urea] refolding buffer to initiate refolding. After some refolding time, hydrogen exchange of unprotected amides is initiated by mixing with high-pH pulse buffer. The hydrogen exchange reaction is quenched by mixing with a low-pH quench buffer. The sample is injected onto an LC-MS for in-line proteolysis, desalting, and peptide separation by reverse-phase chromatography followed by MS analysis.
Figure 2 with 2 supplements

Determination of the folding pathway of T. thermophilus RNase H* by HX-MS.
(A) Protection of representative peptides from ttRNH* at various refolding times. Peptides are colored according to their corresponding structural element. The solid arrow indicates the refolding time point analyzed in panel B. The dotted arrow indicates the refolding time point analyzed in panel C. (B) Protection of peptides mapping to the core region (Icore) or the periphery region of ttRNH* at 21 msec after refolding. Bars represent the mean and standard deviation of each data set. *p<0.0001 (Welch’s unpaired T-test) (C) Protection of peptides of ttRNH* mapping to distinct secondary structural elements at one msec after refolding. Bars represent the mean and standard deviation of each data set. *p=0.0027 (Welch’s unpaired T-test). Data for B and C represent aggregate data from three separate experiments. (D) Residue-resolved folding pathway of ttRNH* at representative refolding time points. Data points in black indicate residues that are site-resolved. Data points in grey indicate residues in regions with less peptide coverage and are thus not site-resolved with the neighboring residues. Residues where site-resolved protection could not be determined due to insufficient peptide coverage is denoted with a ‘x’.
-
Figure 2—source data 1
HX-MS data for ttRNH* and Chevron Plot data of RNase H variants.
- https://doi.org/10.7554/eLife.38369.006
Figure 2—figure supplement 1
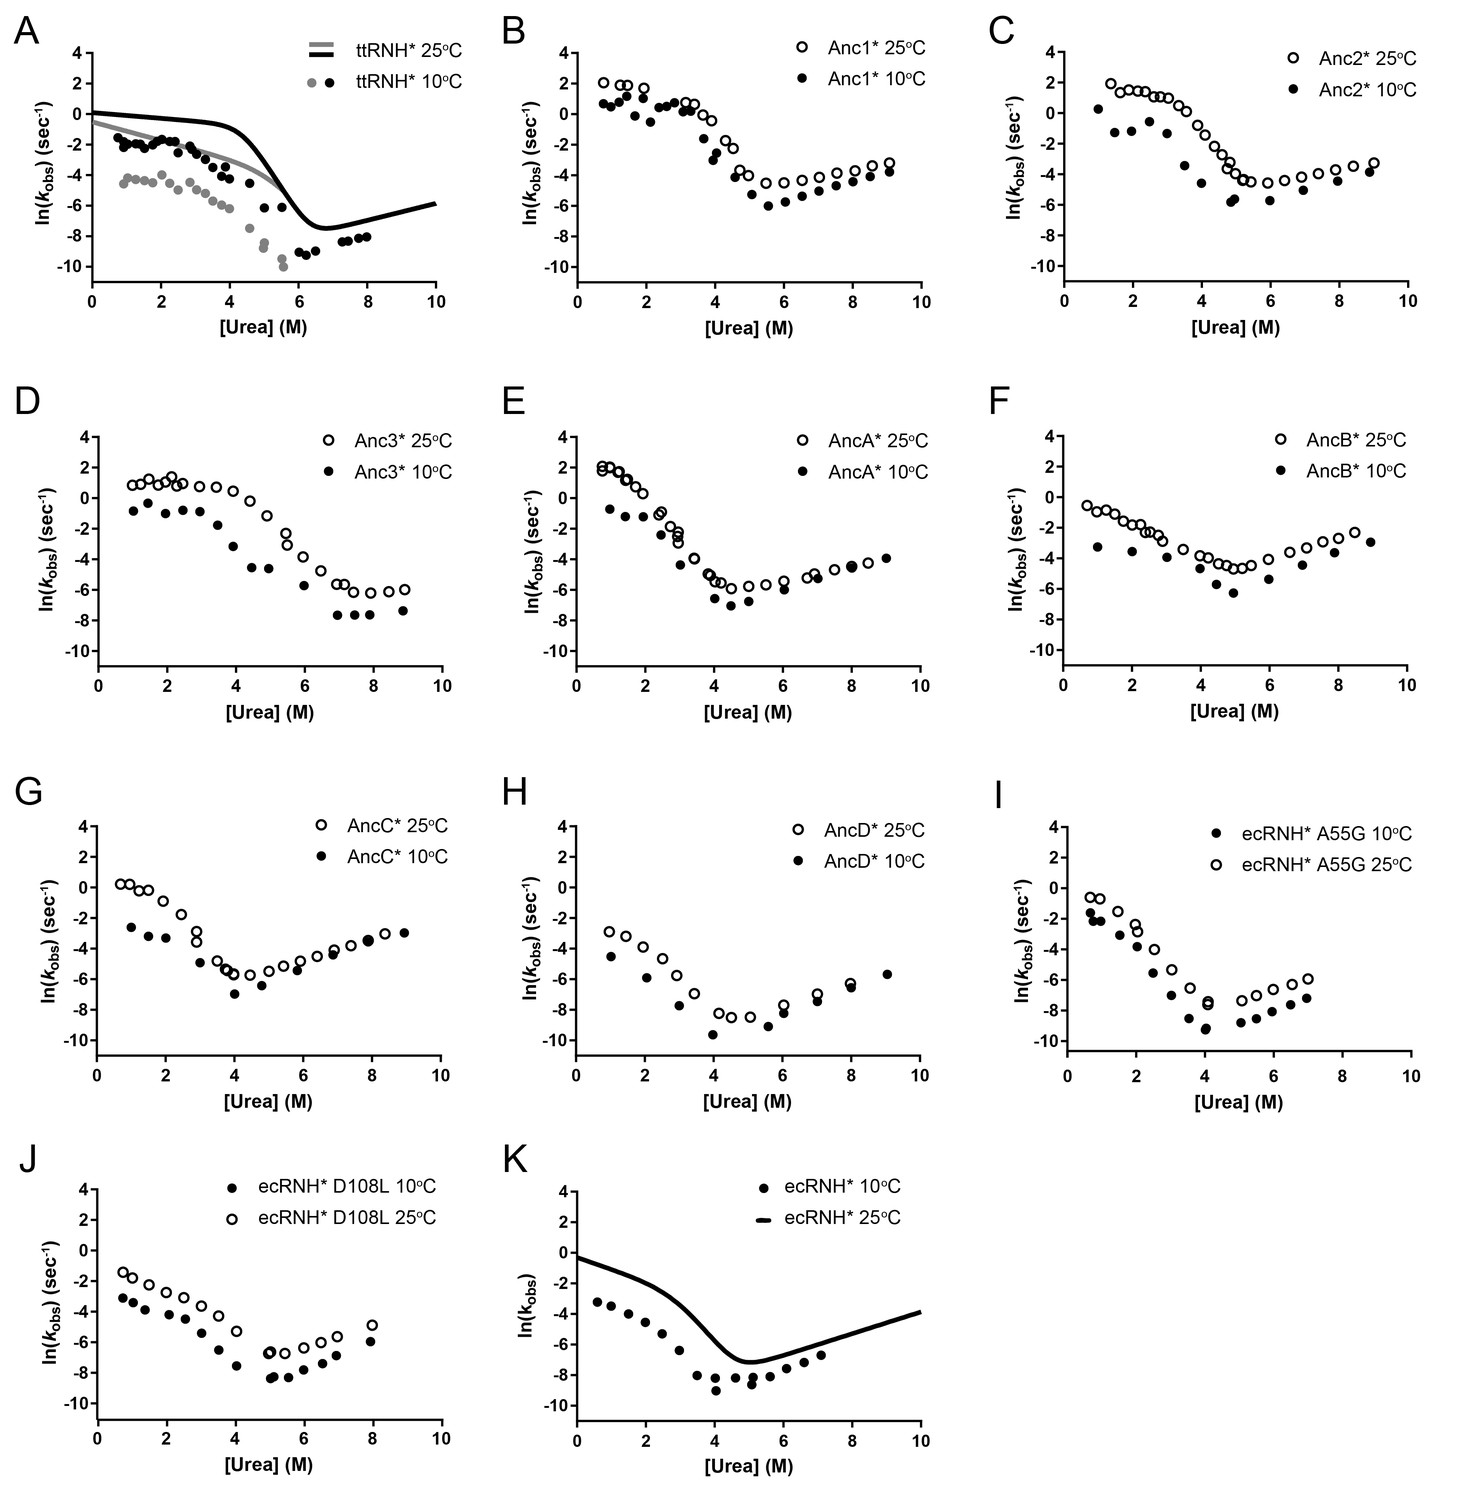
Chevron plot of RNase H variants studied at 10°C and 25°C.
Chevron plots (ln(kobs) vs [urea]), determined from refolding and unfolding experiments in various [urea] at 10°C and 25°C for A) ttRNH*, (B) Anc1*, (C) Anc2*, (D) Anc3*, (E) AncA*, (F) AncB*, (G) AncC*, (H) AncD*, (I) ecRNH* A55G, (J) ecRNH* D108L, (K) wild-type ecRNH*. For (A) Both the fast (black dots) and slow (grey dots) rates of folding for ttRNH* are shown at 10°C, and chevron fits for the two rates at 25°C are shown as lines and adapted from previous work (Hollien and Marqusee, 2002). Data at 25°C for (B–H) were adapted from a previously published study (Lim and Marqusee, 2017). Data for (K) was adapted from previous work (Hu et al., 2013; Raschke et al., 1999).
Figure 2—figure supplement 2
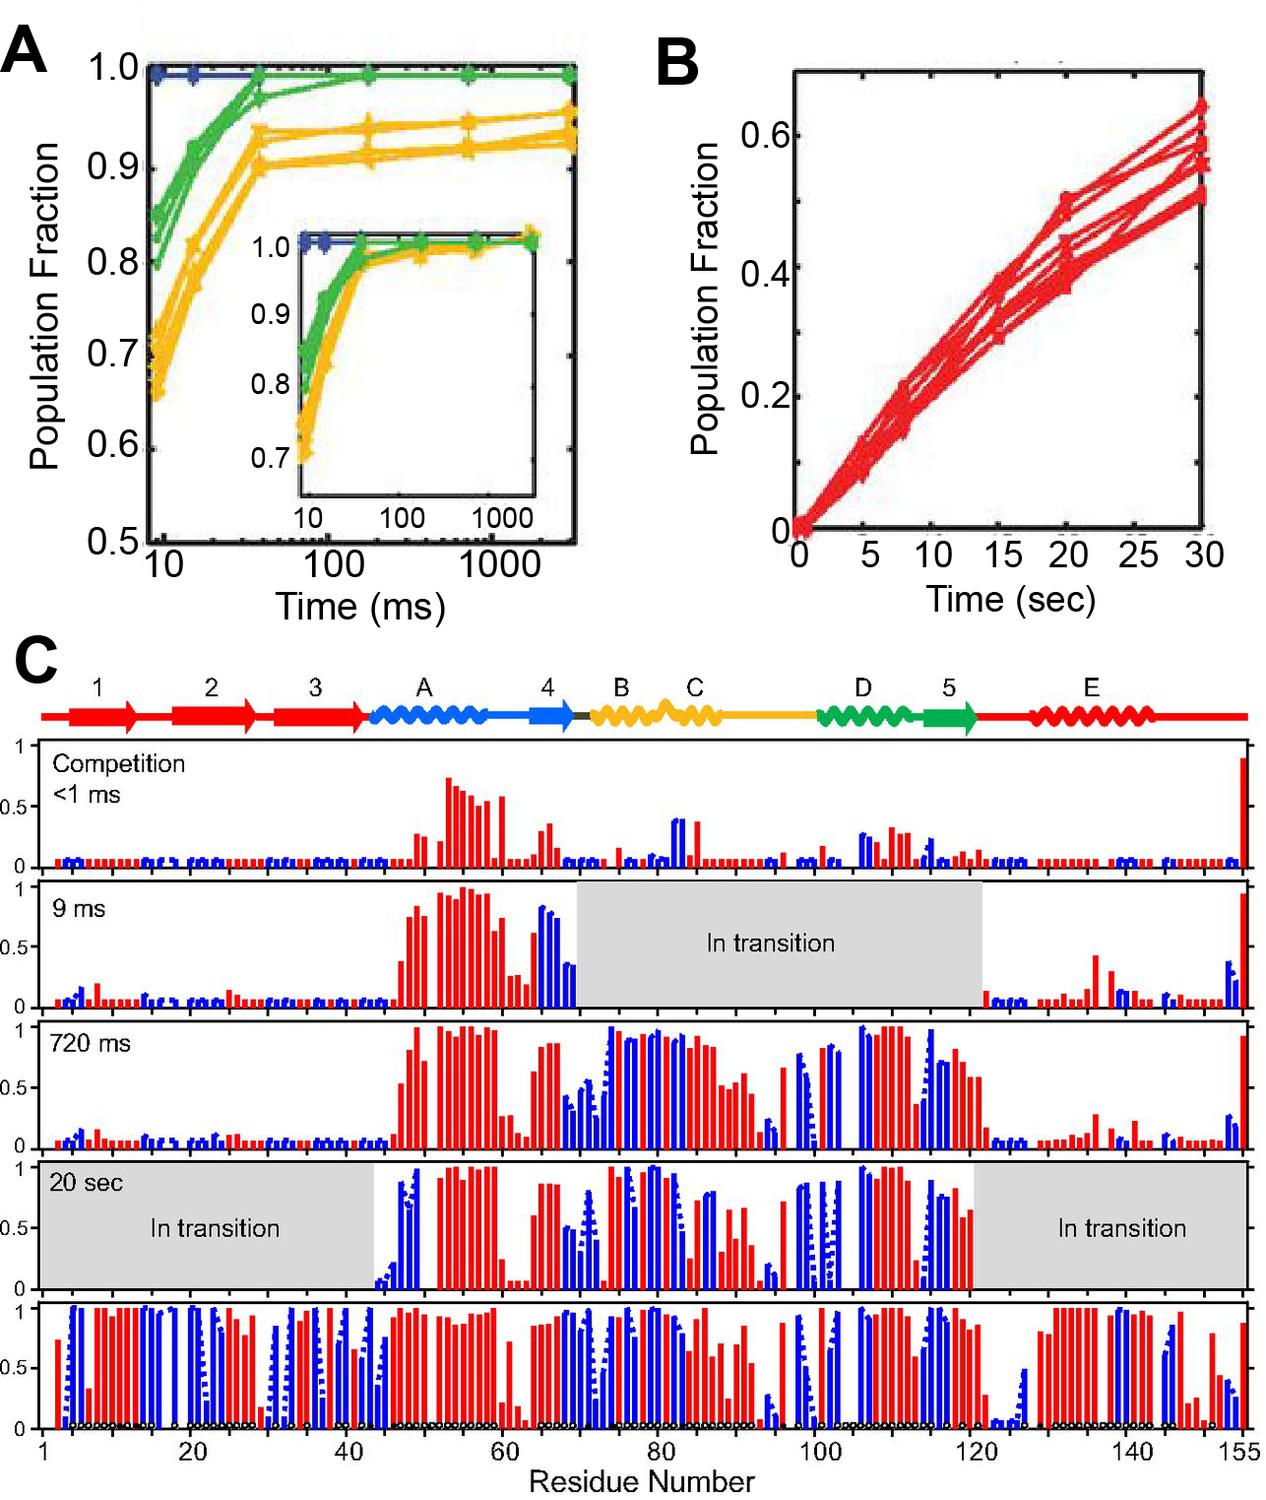
Determination of the folding pathway of ecRNH* by HX-MS.
Pulsed-labeling hydrogen exchange mass spectrometry results of the folding pathway of ecRNH*, adapted from Figure 3E, Figure 3F, Figure 4 of Hu W. et al. 2013, Proceedings of the National Academy of Sciences U.S.A. 110(19) doi:10.1073/pnas.1305887110, published under the CreativeCommons Attribution Attribution-NonCommercial-NoDerivs 2.0 Generic License (CC BY-NC-ND 4.0; https://creativecommons.org/licenses/by-nc-nd/4.0/). (Hu et al., 2013) (A and B) Fraction of peptide protected from exchange as a function of time. Selected peptides are shown from the Helix A/Strand 4 (blue), Helix D/Strand 5 (green), Helix B/Helix C (yellow), and Strand 1-3/Helix E (red) regions. (A) Folding of the Icore region of the protein. The inset shows the longer folding timepoints. (B) Folding of the periphery of the protein. (C) Residue-resolved folding pathway of ecRNH* at representative refolding time points. Data points in red indicate residues that are site-resolved. Data points in blue indicate residues in regions with less peptide coverage and are thus not site-resolved with the neighboring residues. The protection pattern of the native protein is shown at the bottom. Circles along the bottom of the native state indicate backbone amide hydrogen bonding to other regions of backbone (open circles) and side chains (closed circles). Regions in grey are protein segments that are in transition between unfolded and folded states. (See Hu et al. (2013) for further discussion.)
Figure 3 with 6 supplements
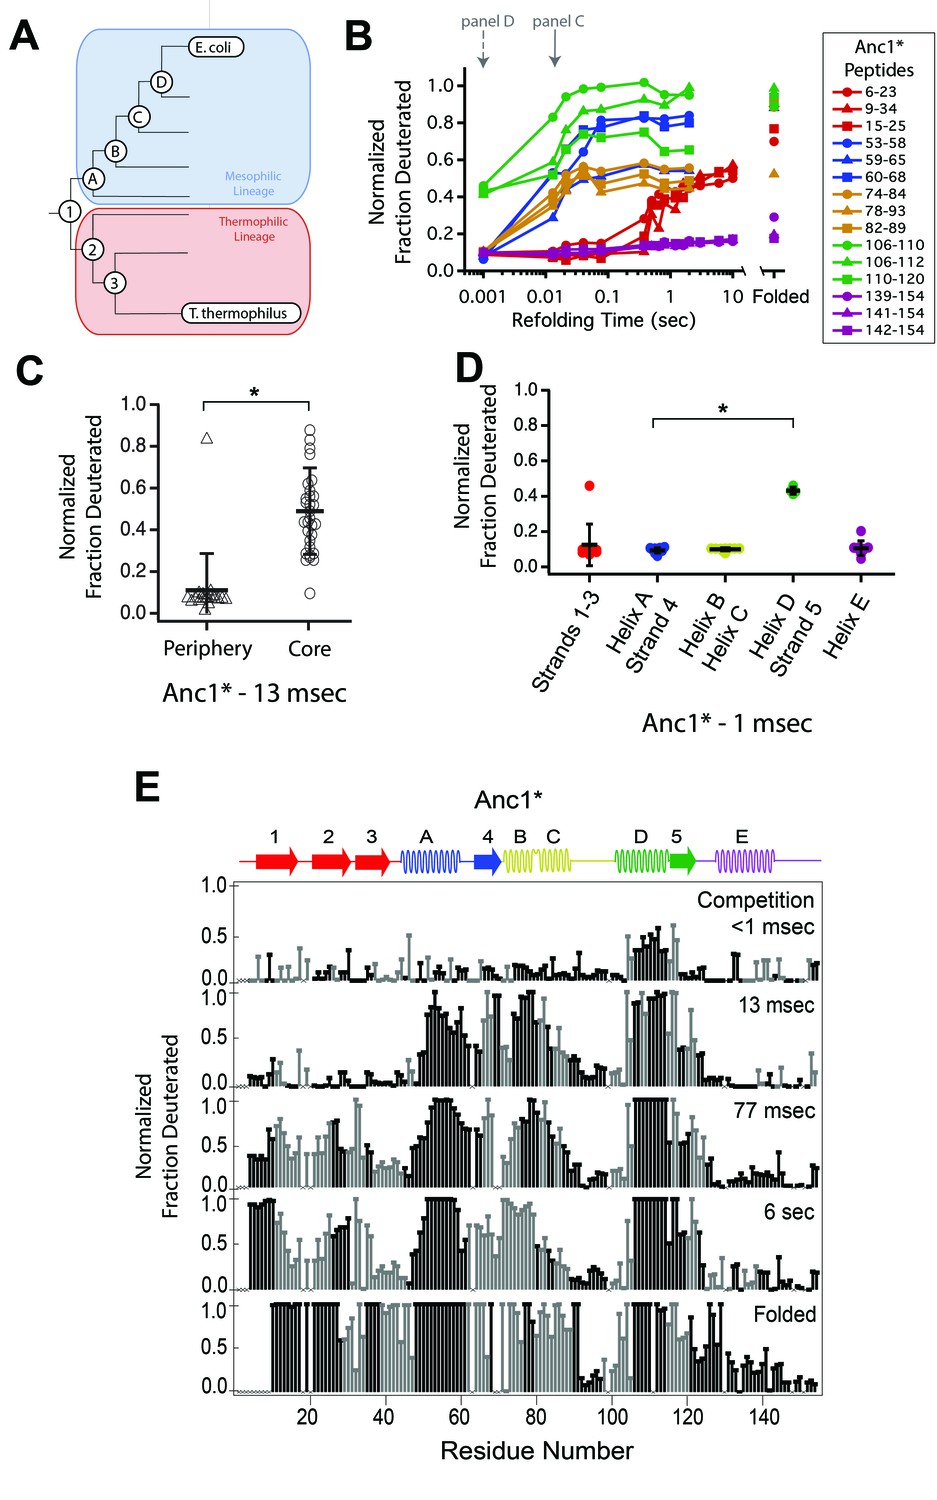
Determination of the folding pathway of ancestral RNases H by HX-MS.
(A) Representation of the phylogenetic tree of the RNase H family illustrating the ancestral proteins along the two lineages leading to E. coli RNase H and T. thermophilus RNase H. Adapted from Figure 2A of Hart KM et al. 2014, PLoS Biology. 12(11) doi:10.1371/journal.pbio.1001994, published under the CreativeCommons Attribution 4.0 International Public License (CC BY 4.0; https://creativecommons.org/licenses/by/4.0/). (Hart et al., 2014) Anc1* is the last common ancestor of ecRNH* and ttRNH*. Anc2* and Anc3* are ancestors along the thermophilic lineage to ttRNH*. AncA*, AncB*, AncC*, and AncD* are ancestors along the mesophilic lineage to ecRNH*. (B) Protection of representative peptides from Anc1* at various refolding times. Peptides are colored according to their corresponding structural element. The solid arrow indicates the refolding time point analyzed in panel C. The dotted arrow indicates the refolding time point analyzed in panel D. (C) Protection of peptides mapping to the core region (Icore) or the periphery region of Anc1* at 13 msec after refolding. Bars represent the mean and standard deviation of each data set. *p = 0.0011 (Welch’s unpaired T-test) (D) Protection of peptides mapping to distinct secondary structural elements of Anc1* at 1 milliseconds after refolding. Bars represent the mean and standard deviation of each data set. *p < 0.0001 (Welch’s unpaired T-test). Data for C & D represent aggregate data from three separate experiments. (E) Residue-resolved folding pathway of Anc1* at representative refolding time points. Data points in black indicate residues that are site-resolved. Data points in grey indicate residues in regions with less peptide coverage and are thus not site-resolved with the neighboring residues. Residues where site-resolved protection could not be determined due to insufficient peptide coverage is denoted with a “x”.
-
Figure 3—source data 1
HX-MS data for ancestral RNases H.
- https://doi.org/10.7554/eLife.38369.014
Figure 3—figure supplement 1
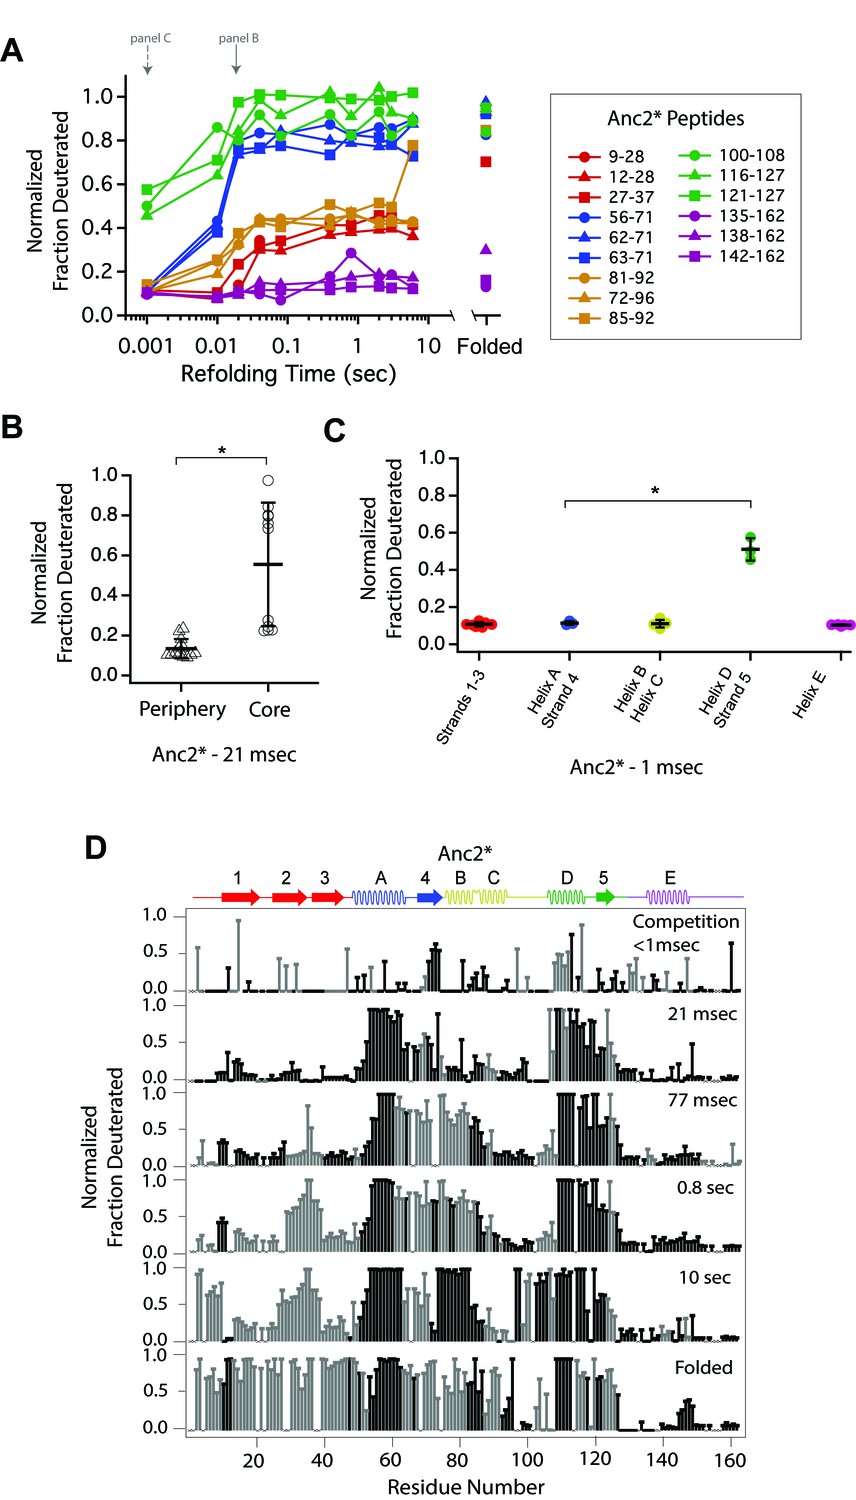
Determination of the folding pathway of Anc2* by HX-MS.
(A) Protection of representative peptides from Anc2* at various refolding times. Peptides are colored according to their corresponding structural element. The solid arrow indicates the refolding time point analyzed in panel B. The dotted arrow indicates the refolding time point analyzed in panel C. (B) Protection of peptides mapping to the core region (Icore) or the periphery region of Anc2* at 21 msec after refolding. Bars represent the mean and standard deviation of each data set. *p=0.0011 (Welch’s unpaired T-test) (C) Protection of peptides of Anc2* mapping to distinct secondary structural elements at one msec after refolding. Bars represent the mean and standard deviation of each data set. *p=0.0064 (Welch’s unpaired T-test). Data for B and C represent aggregate data from three separate experiments. (D) Residue-resolved folding pathway of Anc2* at representative refolding time points. Data points in black indicate residues that are site-resolved. Data points in grey indicate residues in regions with less peptide coverage and are thus not site-resolved with the neighboring residues. Residues where site-resolved protection could not be determined due to insufficient peptide coverage is denoted with a ‘x’.
Figure 3—figure supplement 2
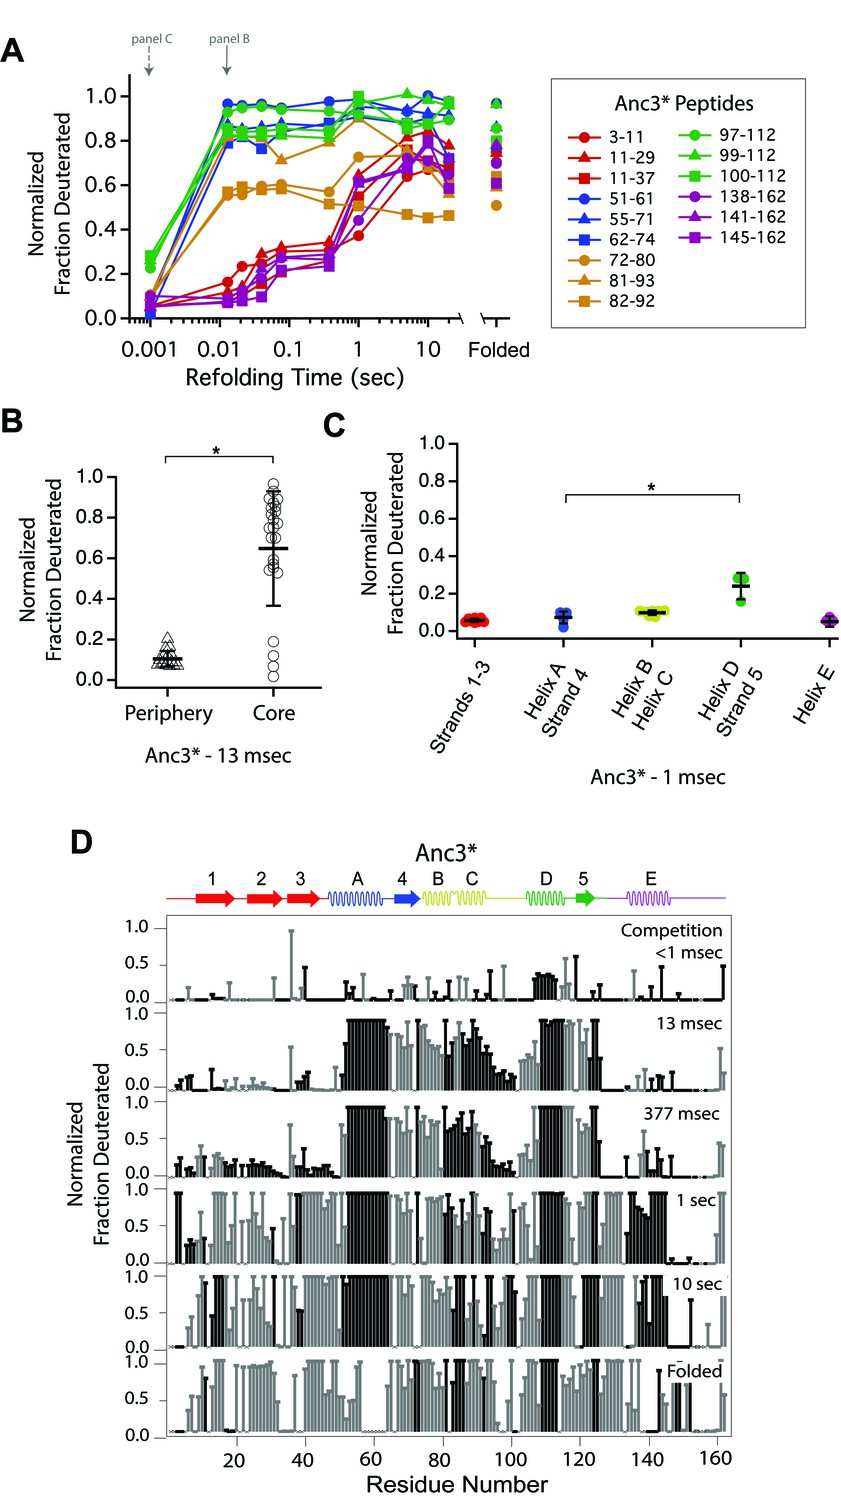
Determination of the folding pathway of Anc3* by HX-MS.
(A) Protection of representative peptides from Anc3* at various refolding times. Peptides are colored according to their corresponding structural element. The solid arrow indicates the refolding time point analyzed in panel B. The dotted arrow indicates the refolding time point analyzed in panel C. (B) Protection of peptides mapping to the core region (Icore) or the periphery region of Anc3* at 13 msec after refolding. Bars represent the mean and standard deviation of each data set. *p<0.0001 (Welch’s unpaired T-test) (C) Protection of peptides of Anc3* mapping to distinct secondary structural elements at one msec after refolding. Bars represent the mean and standard deviation of each data set. *p=0.0419 (Welch’s unpaired T-test). Data for B and C represent aggregate data from three separate experiments. (D) Residue-resolved folding pathway of Anc3* at representative refolding time points. Data points in black indicate residues that are site-resolved. Data points in grey indicate residues in regions with less peptide coverage and are thus not site-resolved with the neighboring residues. Residues where site-resolved protection could not be determined due to insufficient peptide coverage is denoted with a ‘x’.
Figure 3—figure supplement 3
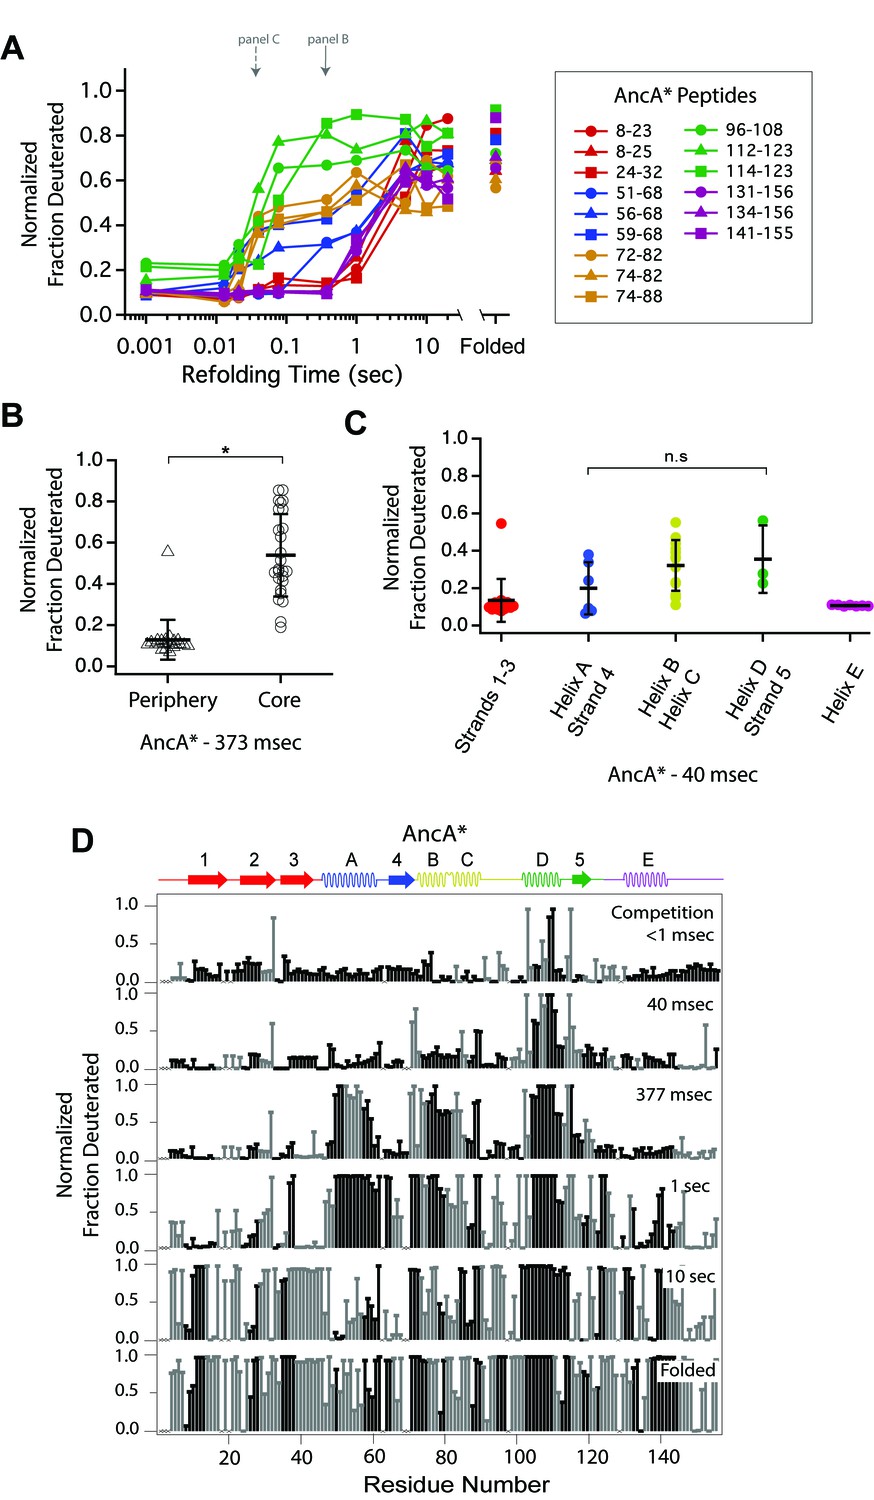
Determination of the folding pathway of AncA* by HX-MS.
(A) Protection of representative peptides from AncA* at various refolding times. Peptides are colored according to their corresponding structural element. The solid arrow indicates the refolding time point analyzed in panel B. The dotted arrow indicates the refolding time point analyzed in panel C. (B) Protection of peptides mapping to the core region (Icore) or the periphery region of AncA* at 373 msec after refolding. Bars represent the mean and standard deviation of each data set. *p<0.0001 (Welch’s unpaired T-test) (C) Protection of peptides of AncA* mapping to distinct secondary structural elements at 40 msec after refolding. Bars represent the mean and standard deviation of each data set. p=0.275 (n.s. = not significant, Welch’s unpaired T-test). Data for B and C represent aggregate data from three separate experiments. (D) Residue-resolved folding pathway of AncA* at representative refolding time points. Data points in black indicate residues that are site-resolved. Data points in grey indicate residues in regions with less peptide coverage and are thus not site-resolved with the neighboring residues. Residues where site-resolved protection could not be determined due to insufficient peptide coverage is denoted with a ‘x’.
Figure 3—figure supplement 4
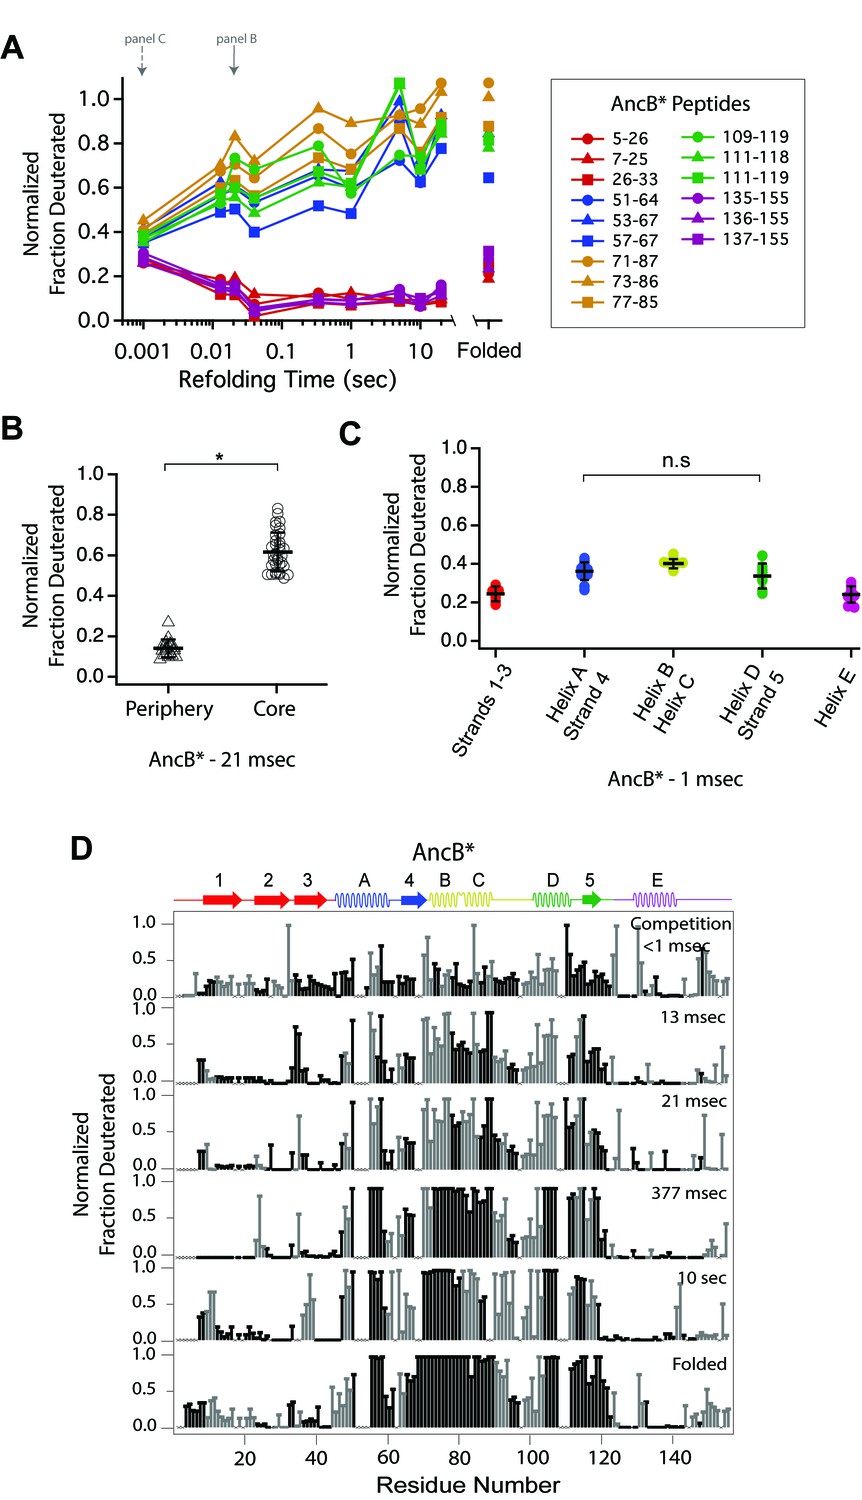
Determination of the folding pathway of AncB* by HX-MS.
(A) Protection of representative peptides from AncB* at various refolding times. Peptides are colored according to their corresponding structural element. The solid arrow indicates the refolding time point analyzed in panel B. The dotted arrow indicates the refolding time point analyzed in panel C. (B) Protection of peptides mapping to the core region (Icore) or the periphery region of AncB* at 21 msec after refolding. Bars represent the mean and standard deviation of each data set. *p<0.0001 (Welch’s unpaired T-test) (C) Protection of peptides of AncB* mapping to distinct secondary structural elements at one msec after refolding. Bars represent the mean and standard deviation of each data set. p=0.353 (n.s. = not significant, Welch’s unpaired T-test). Data for B and C represent aggregate data from three separate experiments. (D) Residue-resolved folding pathway of AncB* at representative refolding time points. Data points in black indicate residues that are site-resolved. Data points in grey indicate residues in regions with less peptide coverage and are thus not site-resolved with the neighboring residues. Residues where site-resolved protection could not be determined due to insufficient peptide coverage is denoted with a ‘x’.
Figure 3—figure supplement 5

Determination of the folding pathway of AncC* by HX-MS.
(A) Protection of representative peptides from AncC* at various refolding times. Peptides are colored according to their corresponding structural element. The solid arrow indicates the refolding time point analyzed in panel B. The dotted arrow indicates the refolding time point analyzed in panel C. (B) Protection of peptides mapping to the core region (Icore) or the periphery region of AncC* at 77 msec after refolding. Bars represent the mean and standard deviation of each data set. *p<0.0001 (Welch’s unpaired T-test) (C) Protection of peptides of AncC* mapping to distinct secondary structural elements at 13 msec after refolding. Bars represent the mean and standard deviation of each data set. *p<0.0001 (Welch’s unpaired T-test). Data for B and C represent aggregate data from three separate experiments. (D) Residue-resolved folding pathway of AncC* at representative refolding time points. Data points in black indicate residues that are site-resolved. Data points in grey indicate residues in regions with less peptide coverage and are thus not site-resolved with the neighboring residues. Residues where site-resolved protection could not be determined due to insufficient peptide coverage is denoted with a ‘x’.
Figure 3—figure supplement 6
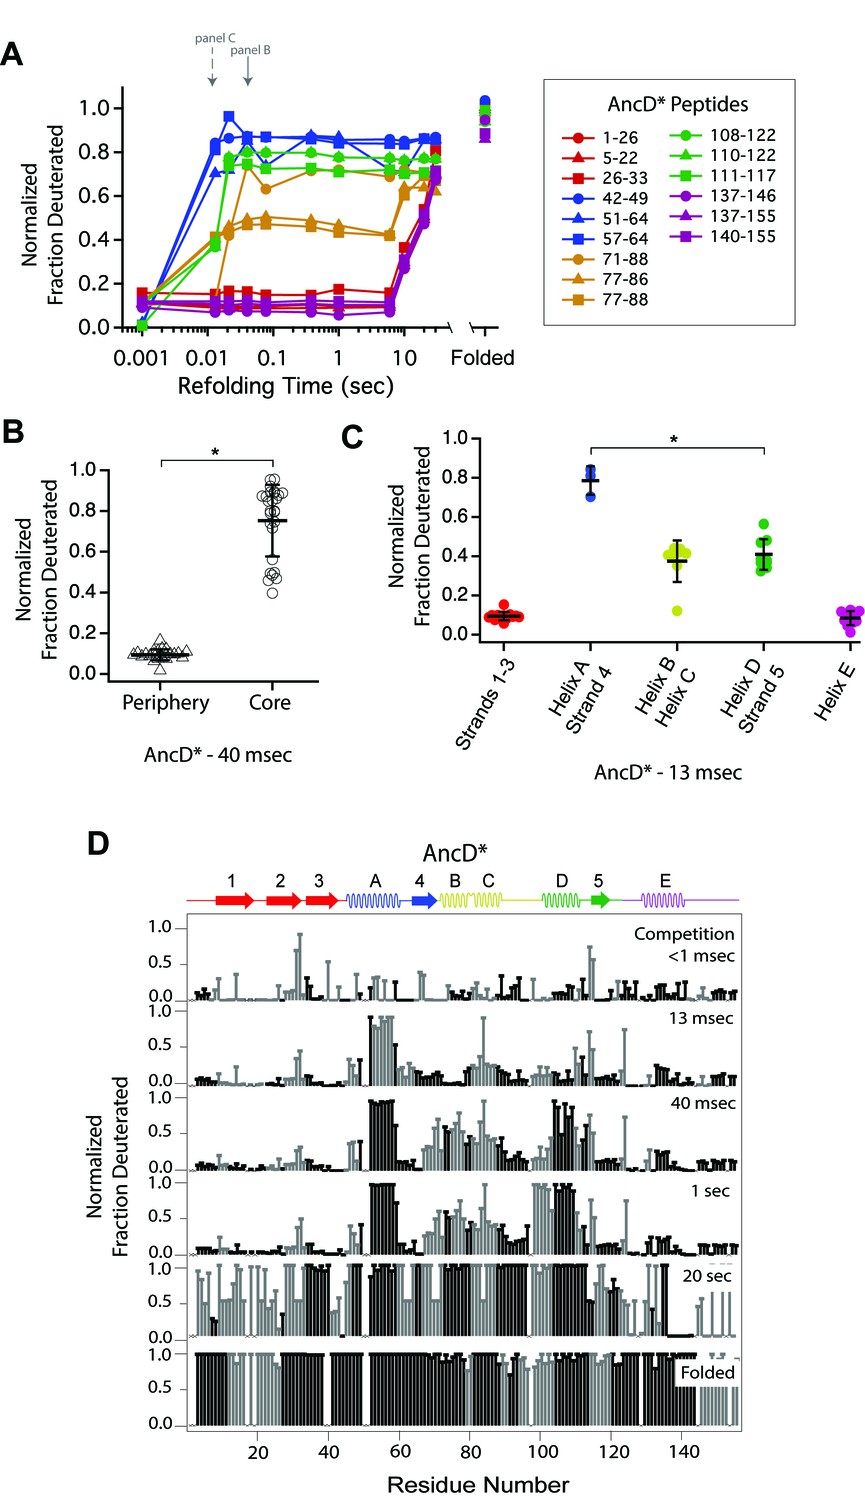
Determination of the folding pathway of AncD* by HX-MS.
(A) Protection of representative peptides from AncD* at various refolding times. Peptides are colored according to their corresponding structural element. The solid arrow indicates the refolding time point analyzed in panel B. The dotted arrow indicates the refolding time point analyzed in panel C. (B) Protection of peptides mapping to the core region (Icore) or the periphery region of AncD* at 40 msec after refolding. Bars represent the mean and standard deviation of each data set. *p<0.0001 (Welch’s unpaired T-test) (C) Protection of peptides of AncD* mapping to distinct secondary structural elements at 13 msec after refolding. Bars represent the mean and standard deviation of each data set. *p=0.021 (Welch’s unpaired T-test). Data for B and C represent aggregate data from three separate experiments. (D) Residue-resolved folding pathway of AncD* at representative refolding time points. Data points in black indicate residues that are site-resolved. Data points in grey indicate residues in regions with less peptide coverage and are thus not site-resolved with the neighboring residues. Residues where site-resolved protection could not be determined due to insufficient peptide coverage is denoted with a ‘x’.
Figure 4
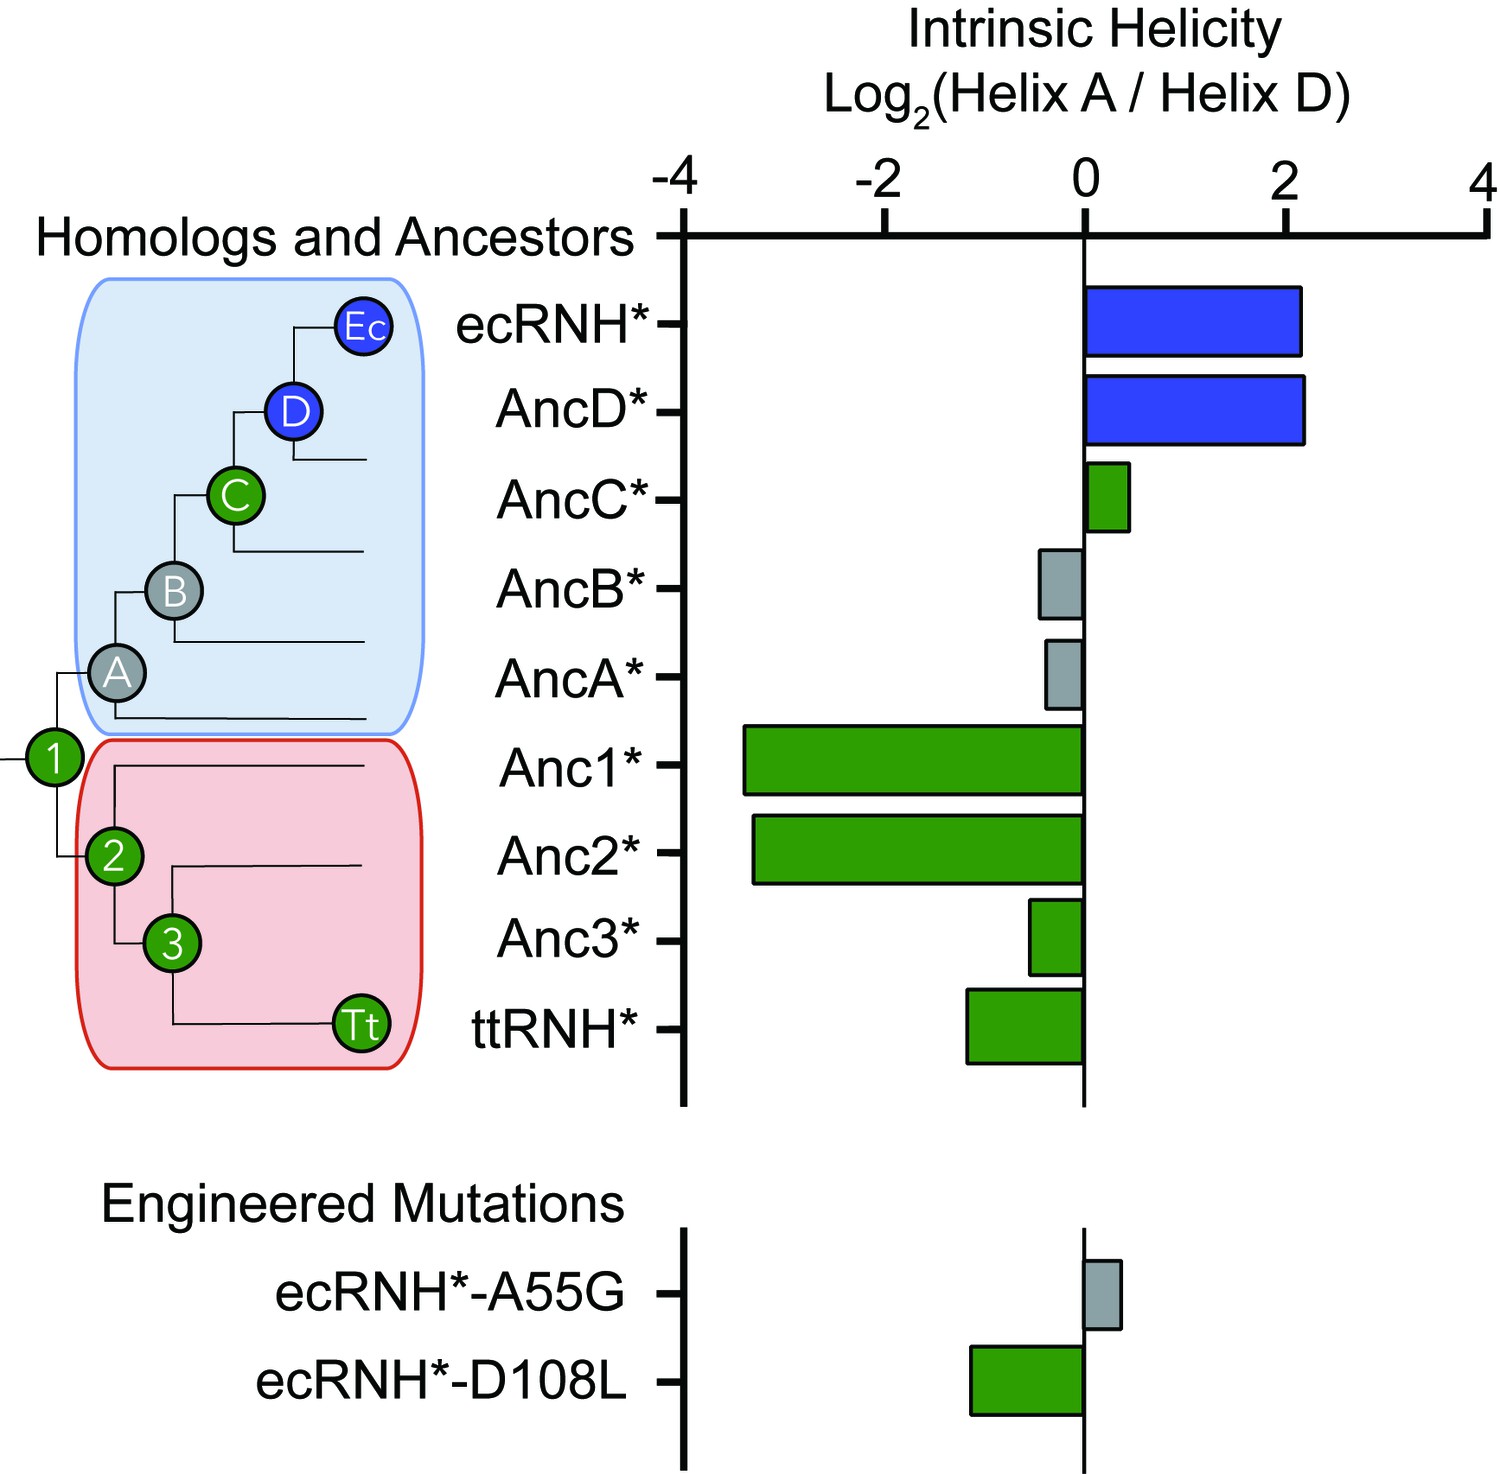
Intrinsic helicity as a predictor for the early folding mechanism of RNases H.
Log-ratio of intrinsic helicity of Helix A and Helix D for each RNase H variant studied. Intrinsic helix predictions were calculated using AGADIR. (Muñoz and Serrano, 1994) The order of helix protection for each variant of RNase H is depicted in color. Green bars represent proteins where Helix D is the first structural element to gain protection during refolding. Blue bars represent proteins where Helix A is the first structural element to gain protection during refolding. Grey bars represent proteins where the helix protection order could not be unambiguously determined. The order of helix protection for each ancestor and homolog is also colored on the phylogenetic tree, revealing a trend in the RNase H folding trajectory along the evolutionary lineages. The phylogenetic tree shown in this figure is adapted from Figure 2A of Hart KM et al. 2014, PLoS Biology. 12(11) doi:10.1371/journal.pbio.1001994, published under the CreativeCommons Attribution 4.0 International Public License (CC BY 4.0; https://creativecommons.org/licenses/by/4.0/) (Hart et al., 2014).
Figure 5 with 1 supplement
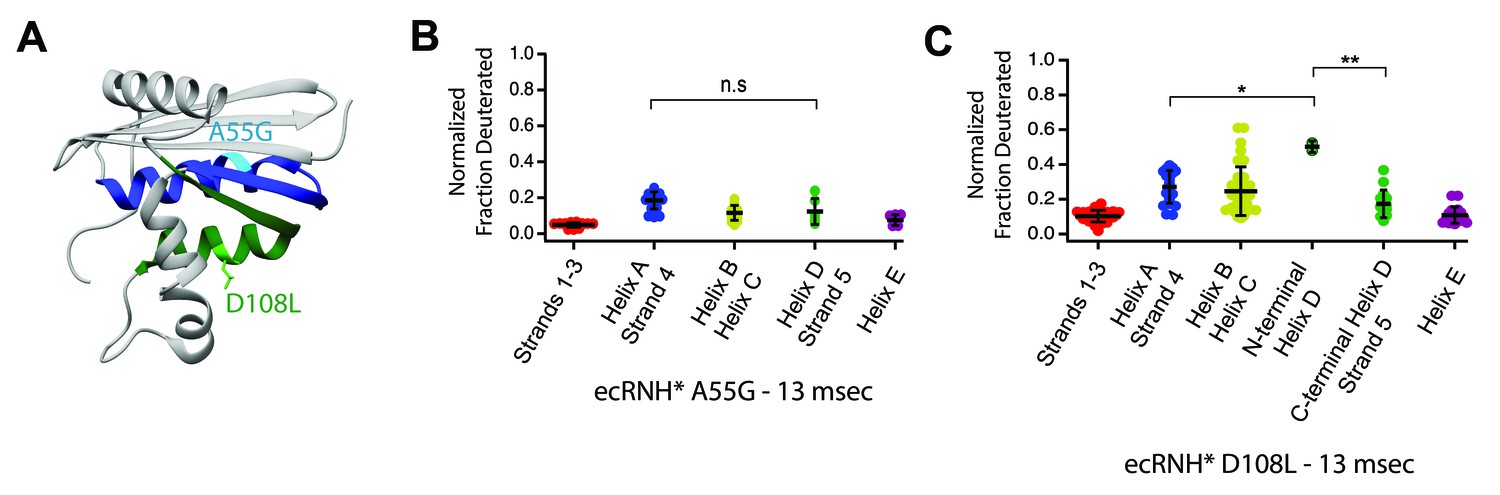
Engineered mutations to alter the folding pathway of ecRNH*.
(A) Crystal structure of E. coli RNase H (PDB: 2RN2) with mutations designed to alter intrinsic helicity (Katayanagi et al., 1992). A55G, located in Helix A (blue), is colored in cyan. D108L, located in Helix D (green), is colored in light green. (B) Protection of peptides mapping to distinct secondary structural elements of ecRNH* A55G at 13 msec after refolding. Bars represent the mean and standard deviation of each data set. p=0.0917 (n.s. = not significant, Welch’s unpaired T-test). (C) Protection of peptides mapping to distinct secondary structural elements of ecRNH* D108L at 13 msec after refolding. Bars represent the mean and standard deviation of each data set. *p=0.0044, **p=0.0016 (Welch’s unpaired T-test). Data for B and C represent aggregate data from three separate experiments.
-
Figure 5—source data 1
HX-MS data for ecRNH* A55G and ecRNH* D108L.
- https://doi.org/10.7554/eLife.38369.018
Figure 5—figure supplement 1
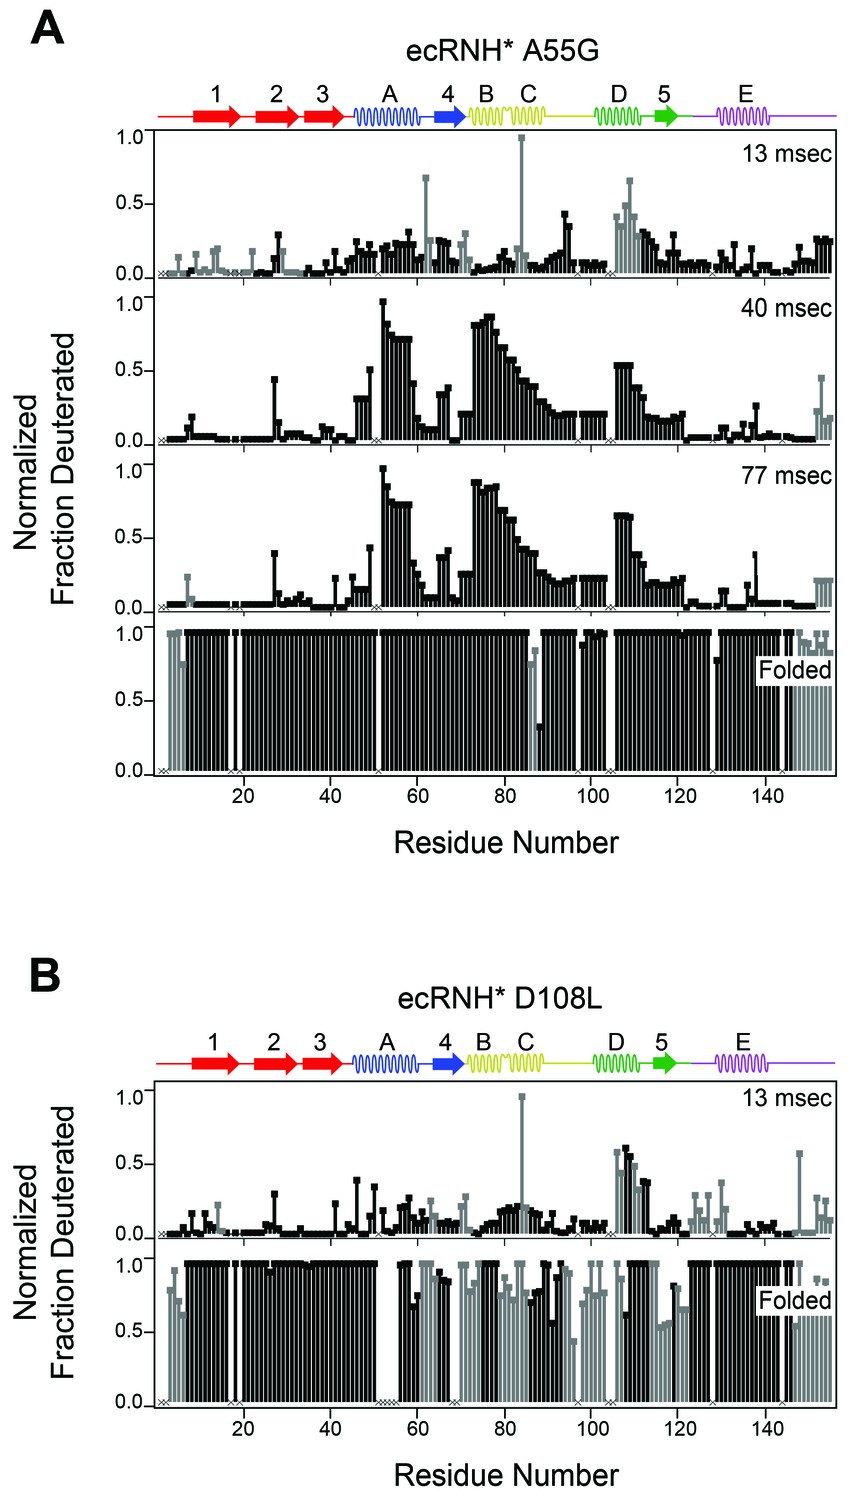
Determination of the folding pathway of ecRNH* by HX-MS.
Residue-resolved folding pathway of (A) ecRNH* A55G and (B) ecRNH* D108L at representative refolding time points. Data points in black indicate residues that are site-resolved. Data points in grey indicate residues in regions with less peptide coverage and are thus not site-resolved with the neighboring residues. Residues where site-resolved protection could not be determined due to insufficient peptide coverage is denoted with a ‘x’.
Tables
Key resources table
| Reagent type (species) or resource | Designation | Source or reference | Identifiers | Additional information |
|---|---|---|---|---|
| Strain, strain background (Escherichia coli) | BL21 (DE3) Star | QB3 Macrolab | ||
| Recombinant DNA reagent | ttRNH* (plasmid) | 10.1021/bi982684h | n/a | |
| Recombinant DNA reagent | Anc1* (plasmid) | 10.1371/journal.pbio.1001994 | n/a | |
| Recombinant DNA reagent | Anc2* (plasmid) | 10.1371/journal.pbio.1001994 | n/a | |
| Recombinant DNA reagent | Anc3* (plasmid) | 10.1371/journal.pbio.1001994 | n/a | |
| Recombinant DNA reagent | AncA* (plasmid) | 10.1371/journal.pbio.1001994 | n/a | |
| Recombinant DNA reagent | AncB* (plasmid) | 10.1371/journal.pbio.1001994 | n/a | |
| Recombinant DNA reagent | AncC* (plasmid) | 10.1371/journal.pbio.1001994 | n/a | |
| Recombinant DNA reagent | AncD* (plasmid) | 10.1371/journal.pbio.1001994 | n/a | |
| Recombinant DNA reagent | ecRNH* (plasmid) | 10.1002/pro.5560030906 | n/a | |
| Recombinant DNA reagent | ecRNH* A55G (plasmid) | this paper | n/a | A55G point mutant of ecRNH* |
| Recombinant DNA reagent | ecRNH* D108L (plasmid) | this paper | n/a | D108L point mutant of ecRNH* |
| Commercial assay or kit | QuikChange Site-Directed Mutagenesis Kit | Agilent | 200519 | |
| Commercial assay or kit | Amicon Ultra Protein Concentrator | Millipore | UFC900324 | |
| Chemical compound, drug | Glycine | JT Baker | 4059–06 | |
| Chemical compound, drug | Urea | IBI Scientific | IB72064 | |
| Chemical compound, drug | Sodium Acetate | VWR Life Sciences | 0530–1 KG | |
| Chemical compound, drug | Deuterium Oxide | Sigma Aldrich | 151882–100G | |
| Chemical compound, drug | Trifluoroacetic Acid | Sigma Aldrich | 302031–100 ML | |
| Chemical compound, drug | Acetonitrile | Thermo Fisher | 85188 | |
| Software, algorithm | ExMS | 10.1007/s13361-011-0236-3 | n/a | |
| Software, algorithm | HDSite | 10.1073/pnas.1315532110 | n/a | |
| Software, algorithm | HDExaminer | Sierra Analytics | n/a | |
| Software, algorithm | Illustrator | Adobe | n/a | |
| Software, algorithm | GraphPad Prism | GraphPad Software, Inc. | n/a | |
| Other | POROS 20 R2 Beads | Thermo Fisher | 1112810 | |
| Other | Microbore column | Upchurch Scientific | C-128 | |
| Other | Reverse-phase analytical column | Thermo Fisher | 72205–050565 | |
| Other | POROS 20 AL Beads | Thermo Fisher | 1602810 | |
| Peptide, recombinant protein | Pepsin (porcine) | Sigma Aldrich | P6887 | |
| Peptide, recombinant protein | Fungal Protease Type-XIII | Sigma Aldrich | P2143 | |
| Peptide, recombinant protein | Pfu polymerase | Agilent | 600353 |
Additional files
-
Supplementary file 1
Table 1: Comparison of intrinsic helicity and AABUF across RNase H variants Values for the helicity and average area buried upon folding (AABUF) are presented for Helix A and Helix D in each of the RNase H variants studied. Values represent the average value acorss the entire helix and are calculated based on previous work (Muñoz and Serrano, 1994; Rose et al., 1985; Nishimura et al., 2005). Table 2: Predicted aggregation-prone segments in the RNase H sequence Aggregation-prone sequences found in the RNase H variants studied were predicted using several methods based on primary sequence (Goldschmidt et al., 2010; Gasior and Kotulska, 2014; Zhou et al., 2008). Sequences are listed with their location within the protein, which proteins contained the sequence, and the method used to identify them.
- https://doi.org/10.7554/eLife.38369.019
-
Transparent reporting form
- https://doi.org/10.7554/eLife.38369.020
Download links
A two-part list of links to download the article, or parts of the article, in various formats.
Downloads (link to download the article as PDF)
Open citations (links to open the citations from this article in various online reference manager services)
Cite this article (links to download the citations from this article in formats compatible with various reference manager tools)
Tracing a protein’s folding pathway over evolutionary time using ancestral sequence reconstruction and hydrogen exchange
eLife 7:e38369.
https://doi.org/10.7554/eLife.38369


