Simulation of spontaneous G protein activation reveals a new intermediate driving GDP unbinding
- Washington University School of Medicine, United States
Figures
Figure 1
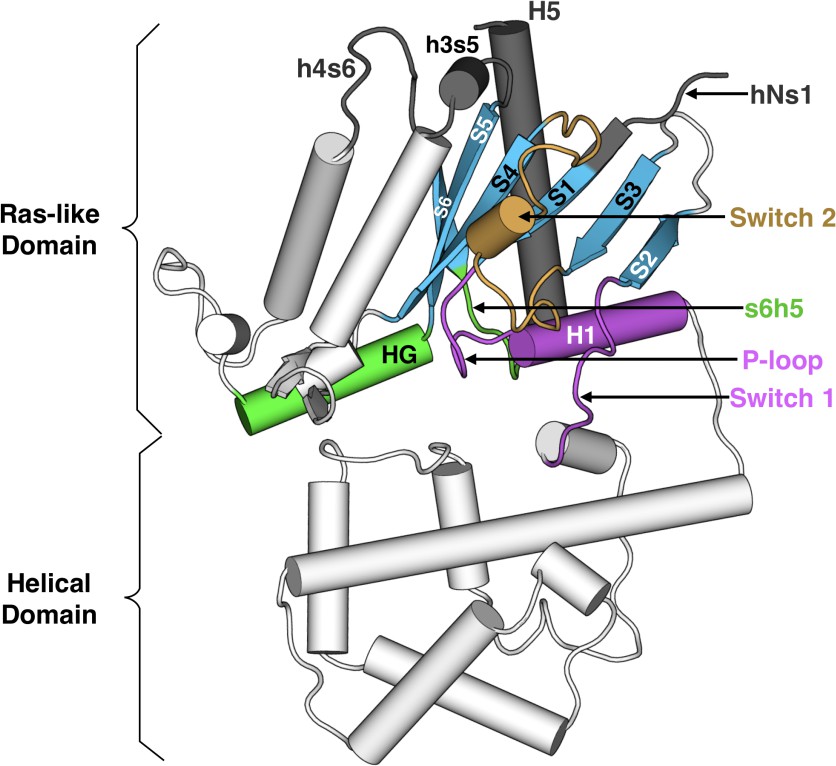
Structure of Gαq with key secondary structure elements labeled according to the Common Gα Numbering (CGN) system.
The coloring scheme highlights the GPCR binding interface (gray), GDP phosphate-binding regions (pink), GDP nucleotide-binding regions (green), β-sheets (blue), and switch 2 (orange).
Figure 2 with 5 supplements
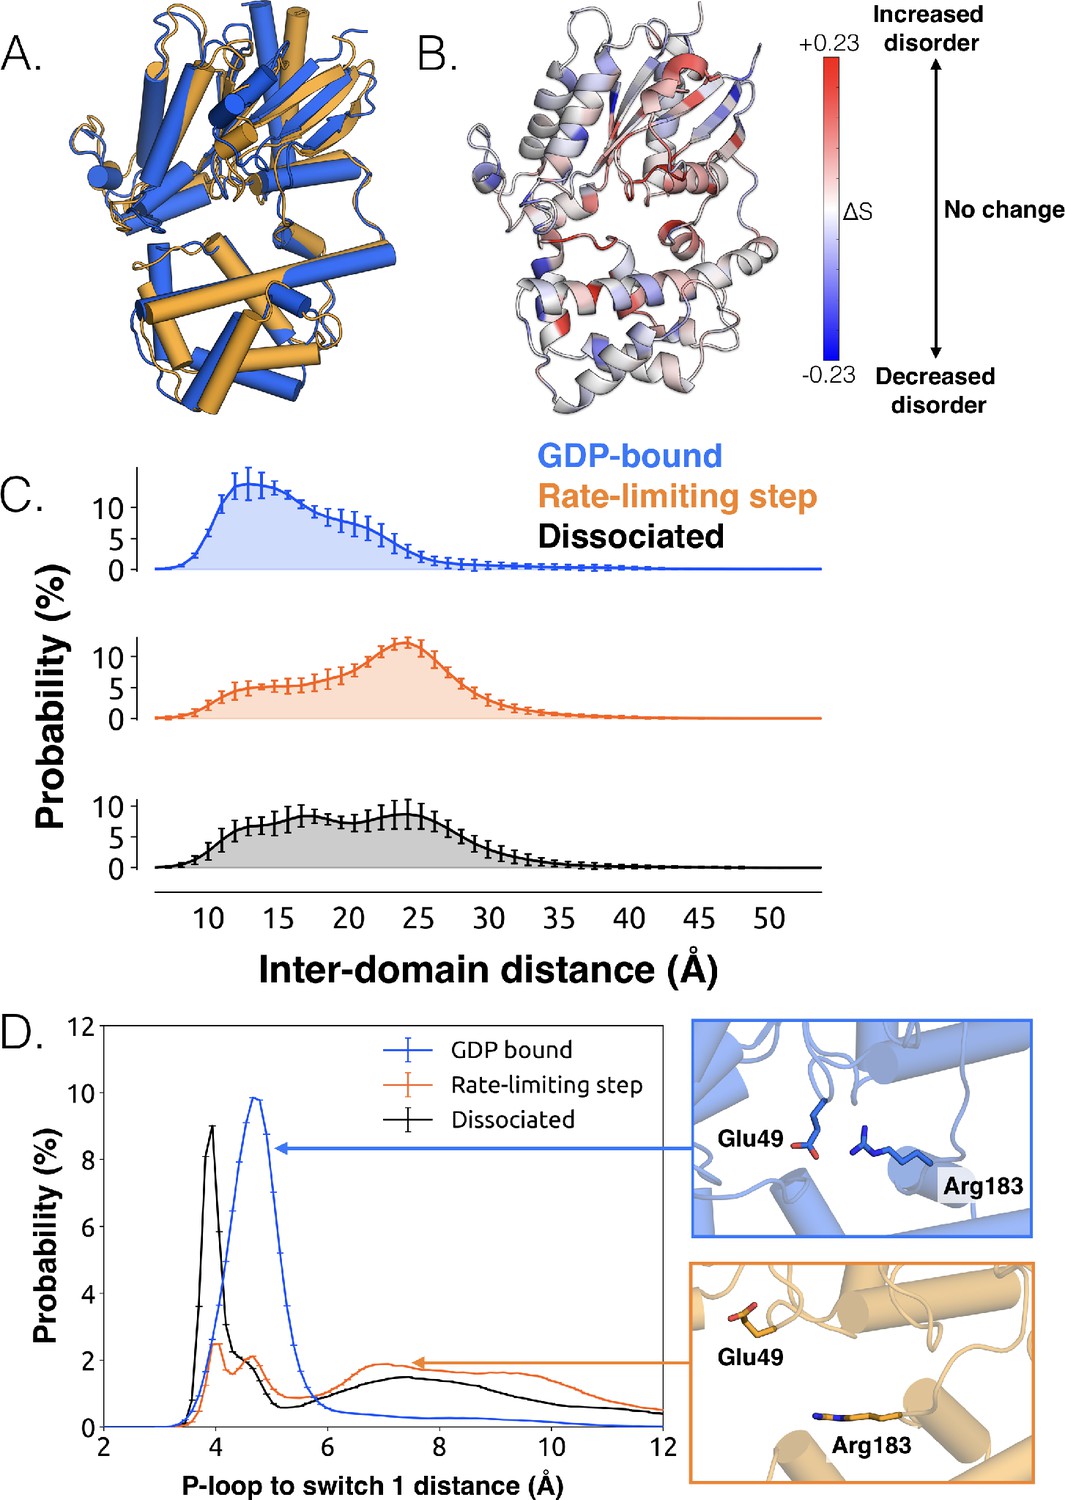
Structural and dynamical changes during the rate limiting step for GDP release.
(A) Overlay of representative structures before (blue) and after (orange) the rate limiting step. (B) Change in conformational disorder (Shannon entropy) across the rate-limiting step, according to the color scale on the right. (C) Histograms of inter-domain distances before (top, blue) and after (middle, orange) the rate limiting step, along with the inter-domain distance distribution after GDP is released (bottom, black). Inter-domain distance is measured using residues analogous to those used in DEER experiments (Dror et al., 2015), Leu97H.HA.29 in the helical domain and Glu250G.H3.4 on H3. (D) Distribution of distances between Glu49G.s1h1.4 and Arg183G.hfs2.2 (left) before (blue) and after (orange) the rate-limiting step, as well as after GDP release (black). Representative structures of the interacting residues are also shown (right).
Figure 2—figure supplement 1
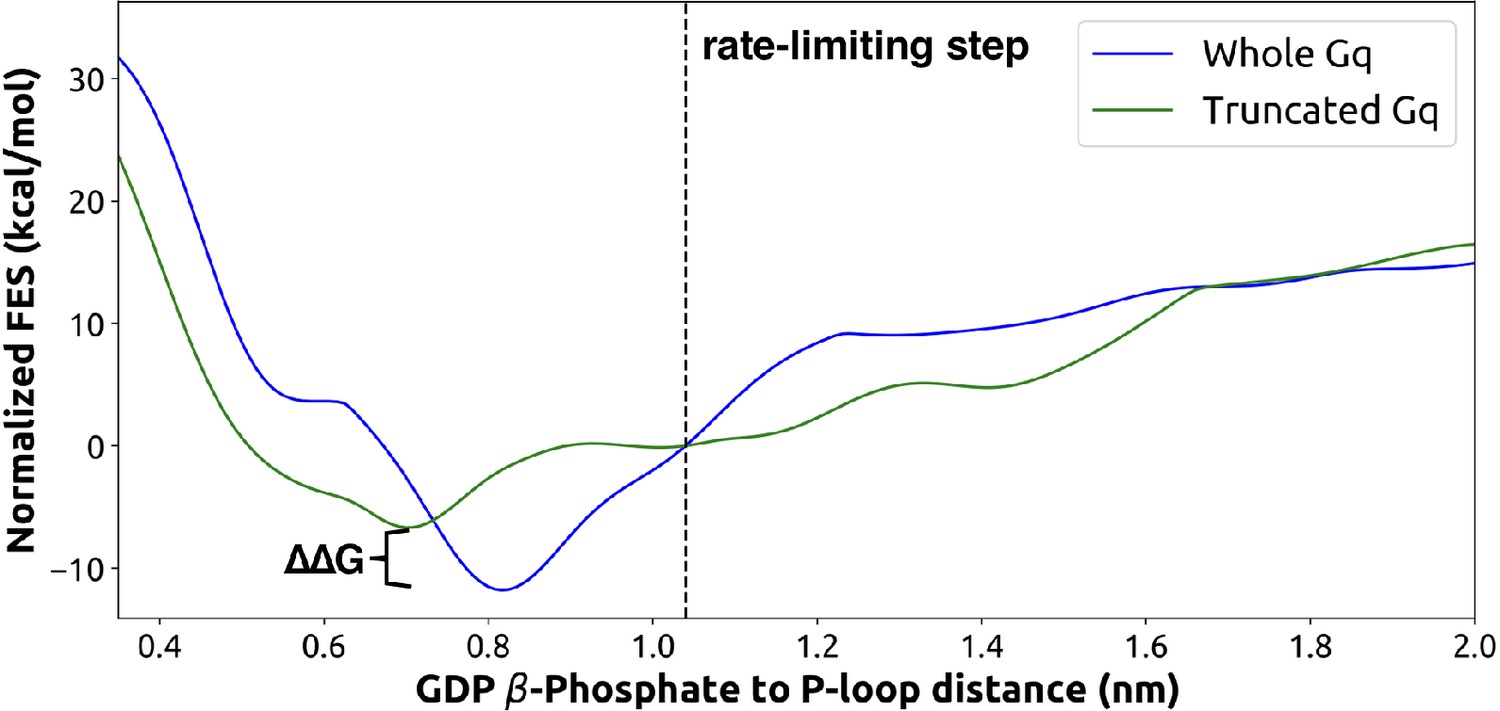
Free-energy surface from metadynamics simulations of GDP release for the full Gαq (blue) and truncated form (green, without the last five C-terminal residues).
Both sets of simulations were run for the same amount of time with identical collective variables. The rate-limiting step as identified from the highest flux pathway is marked with a dashed line. The free-energy difference between the GDP-bound states of the two systems is marked with a bracket.
Figure 2—figure supplement 2
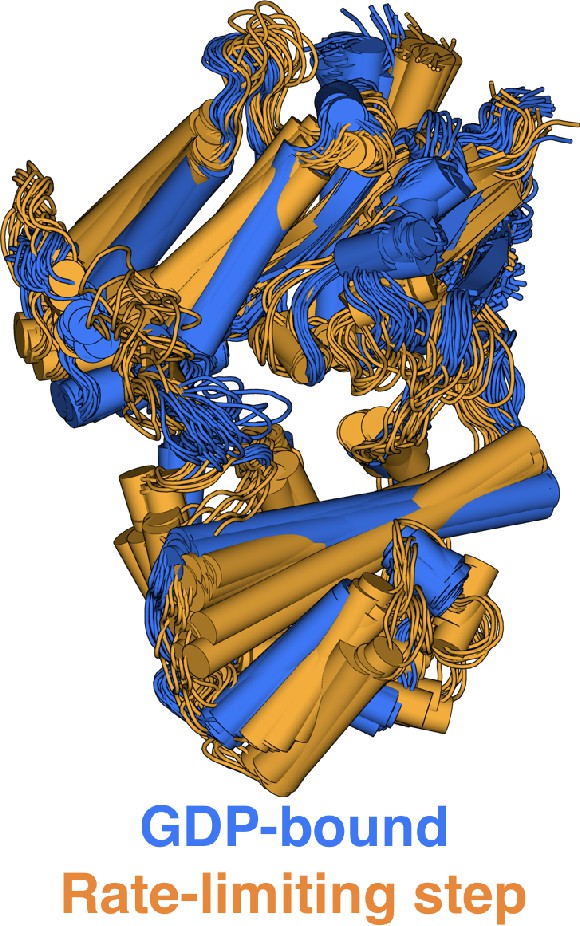
Overlay of representative structures of Gαq when bound to GDP (blue) or across the rate-limiting step (orange).
https://doi.org/10.7554/eLife.38465.006
Figure 2—figure supplement 3
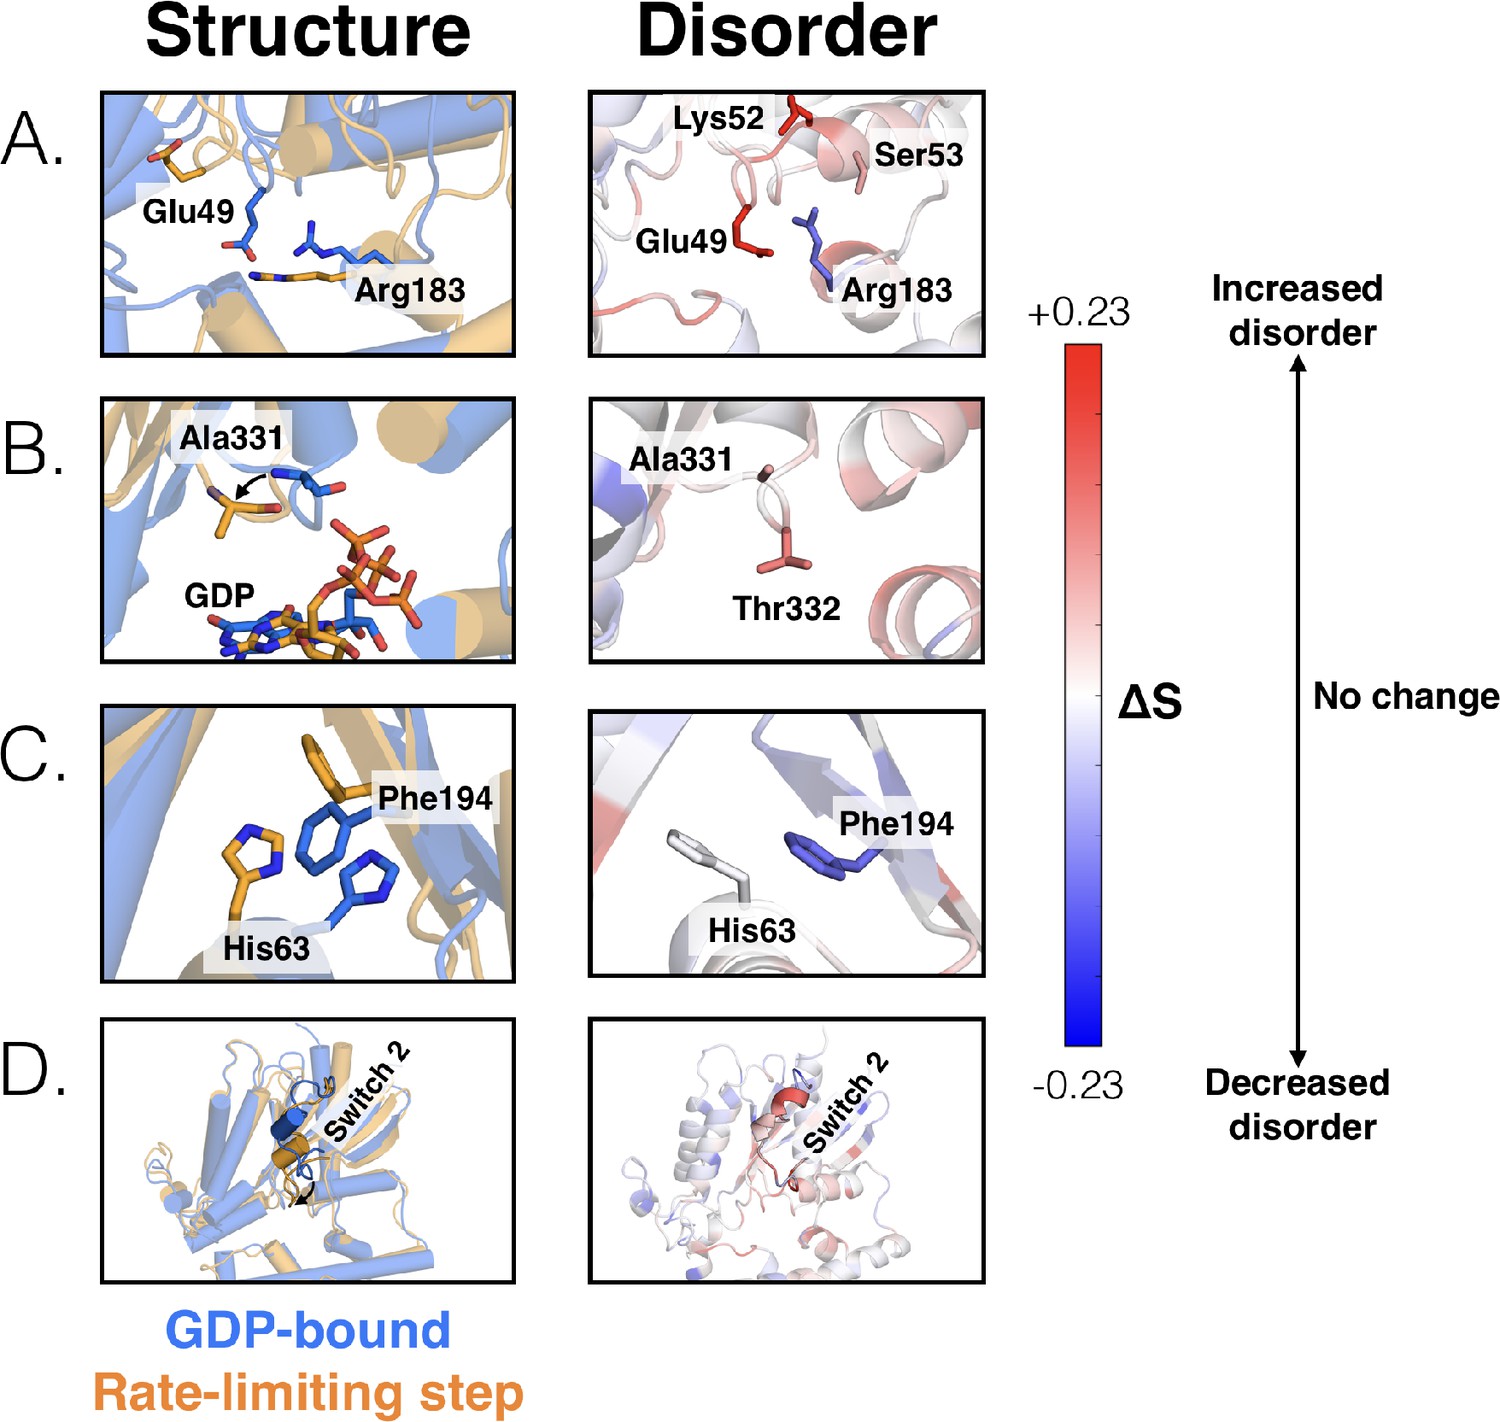
Changes in the structure (left) and disorder (right) of specific regions across the rate-limiting step.
(A) Residues that contact the phosphates of GDP, including the salt bridge between Glu49G.s1h1.4 and Arg183G.hfs2.2, (B) the s6h5 loop, (C) the π –π stacking interaction between Phe194G.S2.6 and His63 G.H1.12, and (D) switch 2.
Figure 2—figure supplement 4
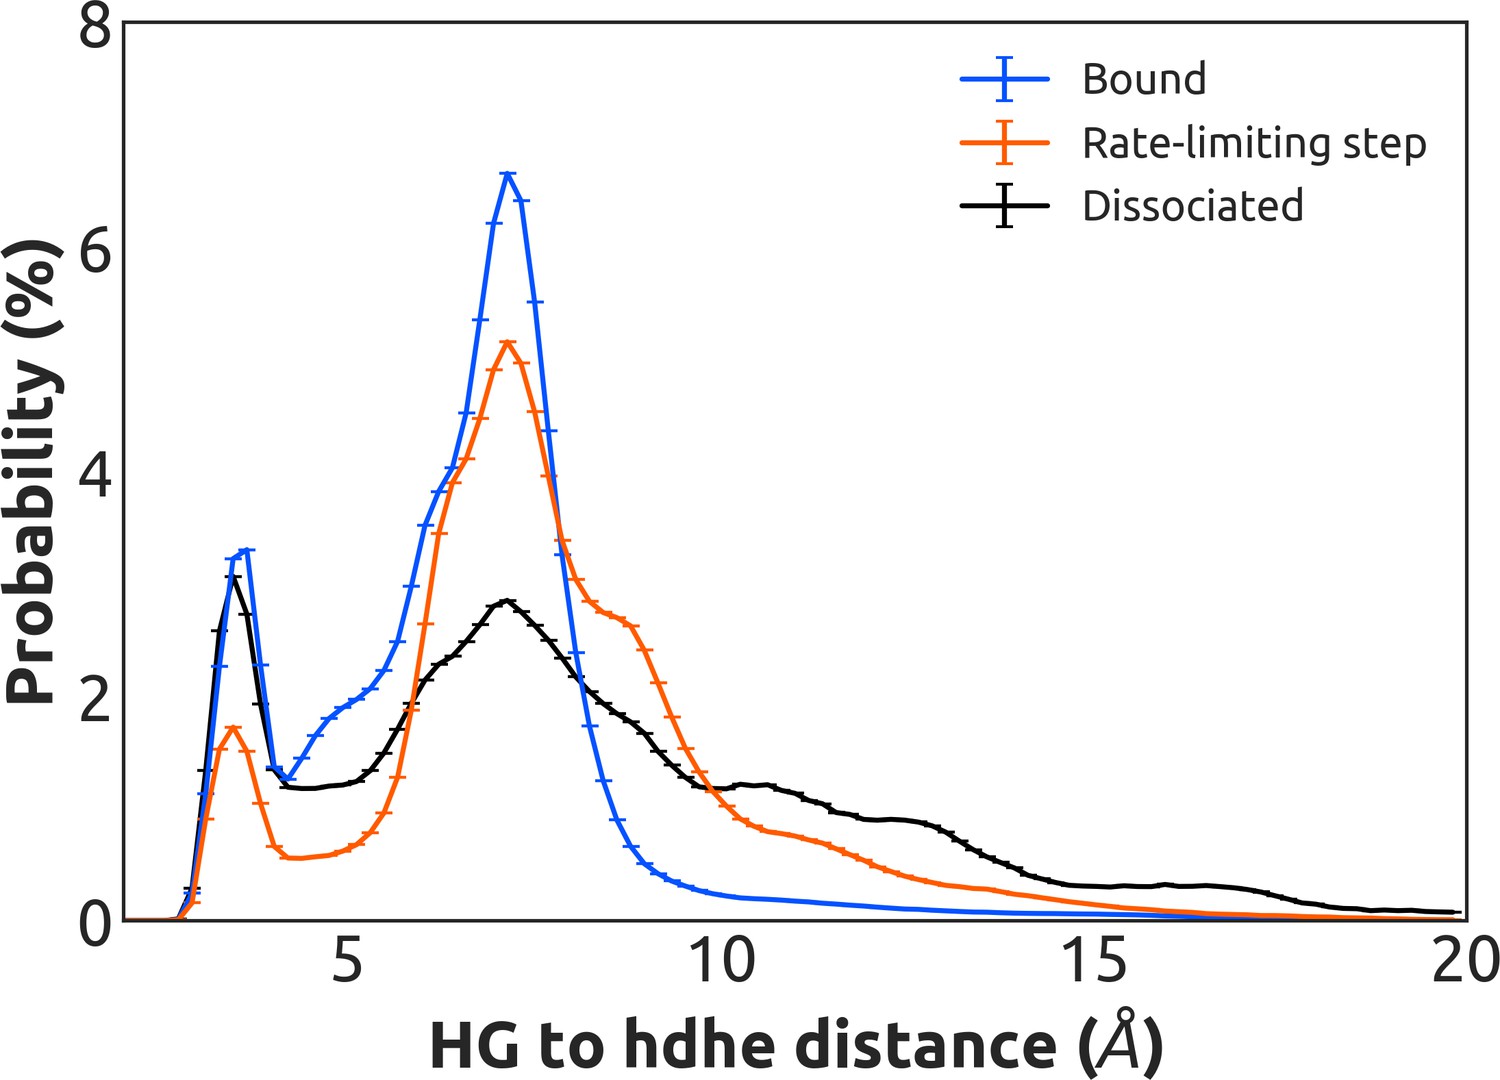
Distribution of distances between the side-chains of K275G.s5hg.1 and D155H.hdhe.5 for the GDP-bound state (blue), across the rate-limiting step (orange), and upon GDP dissociation (black).
https://doi.org/10.7554/eLife.38465.008
Figure 2—figure supplement 5

Implied timescales for the Markov state model.
(A) Top 10 implied timescales for the 5040 states of Gα. (B) Top 10 implied timescales for the final 221965 states.
Figure 3 with 2 supplements
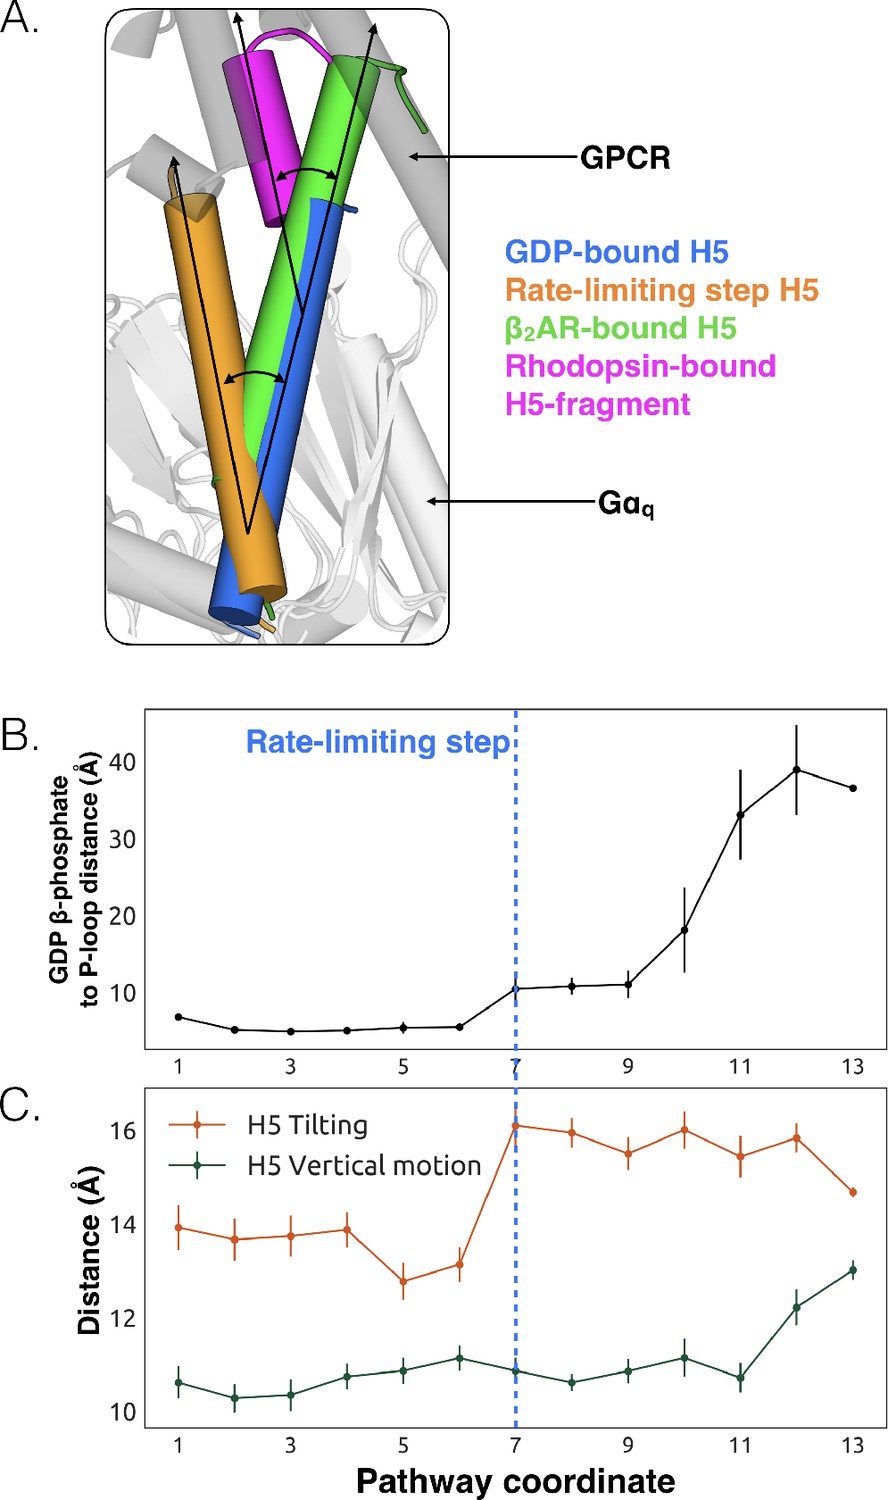
Tilting of H5 is correlated with GDP release but translation of H5 is not.
(A) Displacements of H5 relative to the GDP-bound crystal structure (blue). The three other orientations of H5 come from the rate-limiting step in our model (orange), the co-crystal structure of Gαs and β2AR (green, PDB ID 3SN6) (Hilger et al., 2018), and the co-crystal structure of a C-terminal fragment of Gαt and rhodopsin (magenta, PDB ID 3PQR) (Van Raamsdonk et al., 2010). The black arrows highlight the change in orientation of the long axis of each helix. A representative GPCR (gray) and Gα (white) structure are shown for reference. (B) GDP release distance across the highest flux pathway, defined as the distance from the GDP β-phosphate to the center of mass between residues Lys52G.H1.1, Ser53G.H1.2, and Thr54G.H1.3 on H1. The state marking the rate-limiting step is highlighted by the blue dashed line. (C) H5 motion across the highest flux pathway. The distances measured here representing H5 motion are taken from the same states as in B. H5 tilting (orange) is measured by the distance between Leu349G.H5.16 and Tyr325G.S6.2. Likewise, H5 vertical motion (green) is measured by the distance between Thr334G.H5.1 and Phe341G.H5.8. The rate-limiting step is marked with the blue dashed line, extended down from B.
-
Figure 3—source data 1
Table of measurements comparing tilting and translation of H5 across PDB structures and MD simulation.
- https://doi.org/10.7554/eLife.38465.013
Figure 3—figure supplement 1
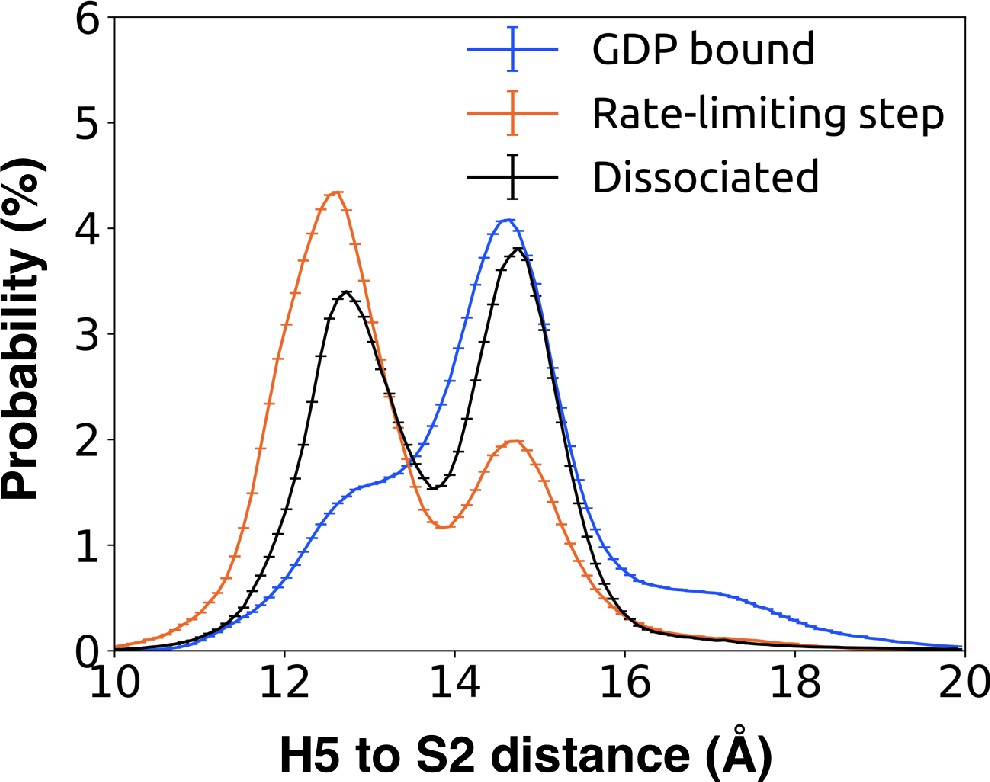
Probability distribution of the distance between Leu349G.H5.16 on H5 and Phe194G.S2.6 on S2 to monitor the tilting motion of H5 upon GDP release when bound to GDP (blue), across the rate-limiting step (orange), and upon GDP dissociation (black).
In the GDP bound state (blue), such a distance is peaked at 15 Å. Across the rate-limiting step (orange), tilting motion of H5 upon GDP release occurs with a peak in distance at 12.5 Å.
Figure 3—figure supplement 2
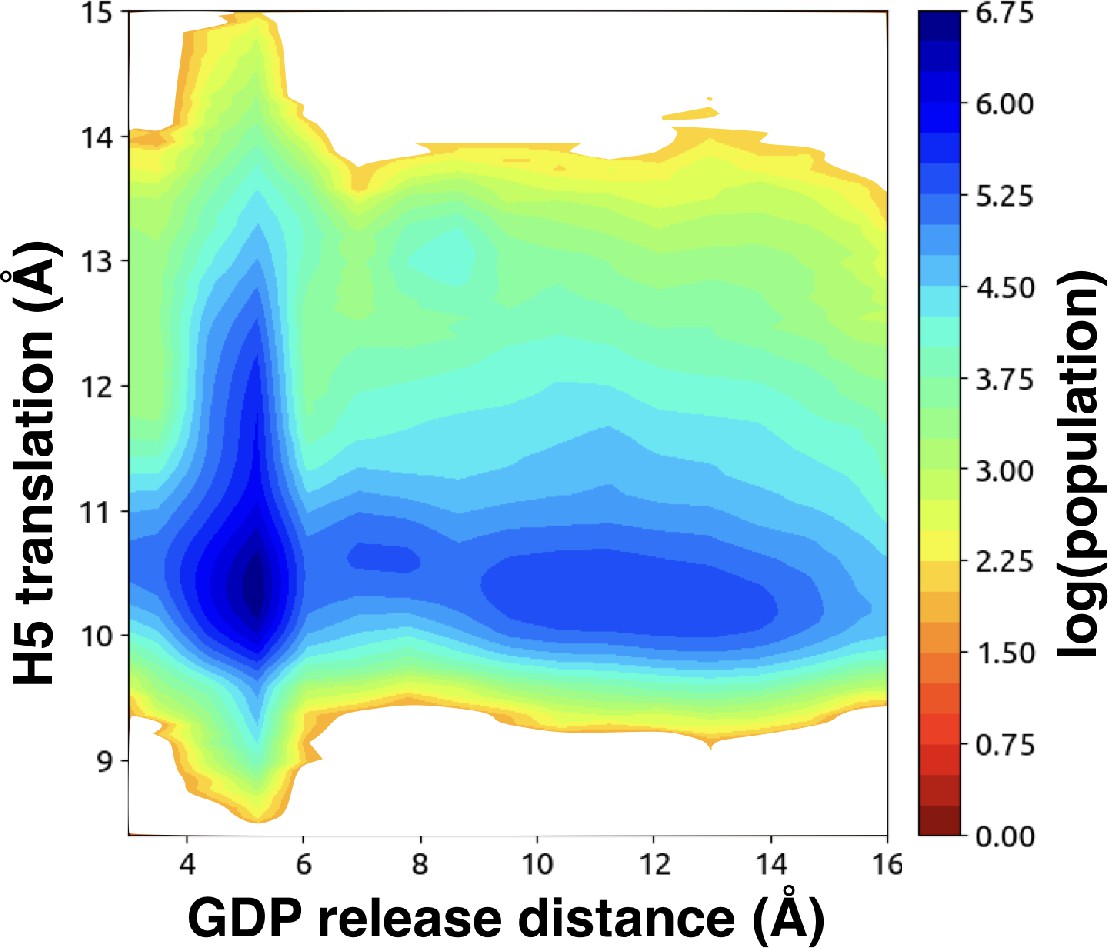
H5 vertical motion is sampled across GDP release simulations.
At each point, the combined population (represented by the color scale) of that state is shown using both GDP-bound and intermediate stages of the GDP release pathway. H5 vertical motion was measured by computing the distance between Thr334G.H5.1 on the s6h5 loop and Phe341G.H5.8 on H5. GDP release distance was measured as the distance from GDP β-phosphate to the center of mass between residues Lys52G.H1.1, Ser53G.H1.2, and Thr54G.H1.3 on H1.
Figure 4

Allosteric network connecting H5 motion to the nucleotide binding-site via s6h5.
CARDS data showing communication per residue to a target site (dashed box) is plotted (left) and mapped onto the structure of Gαq (right) for (A) H5, (B) s6h5, (C) HG, (D) H1, and (E) the P-loop. Arrows indicate regions of importance with significant communication to the target site.
Figure 5
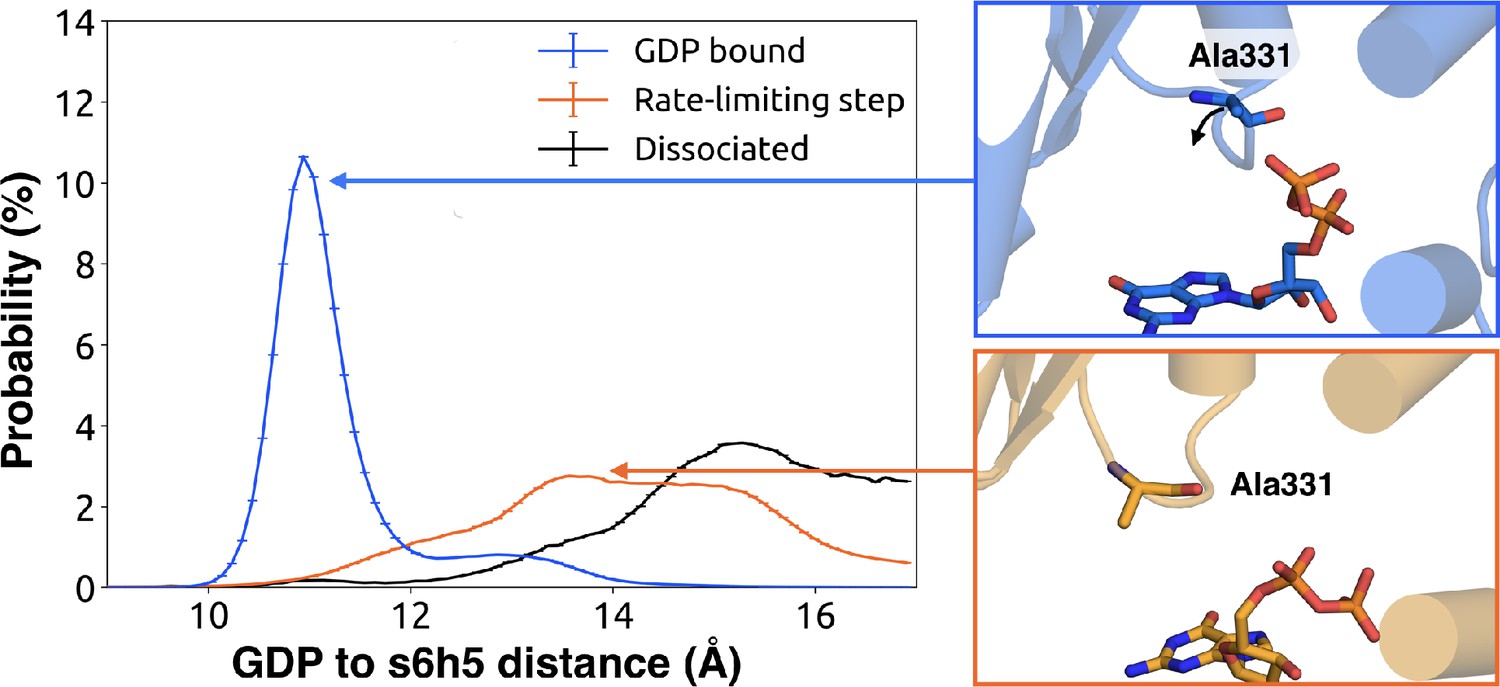
Change in the s6h5 loop conformation across the rate-limiting step.
Distribution of distances (left) from GDP’s β-phosphate to Ala331G.s6h5.3 on the s6h5 loop before (blue) and after (orange) the rate-limiting step, as well as after GDP release (black). Representative structures of the s6h5 loop (right) are shown for before (top right, blue) and after (bottom right, orange) the rate limiting step.
Figure 6
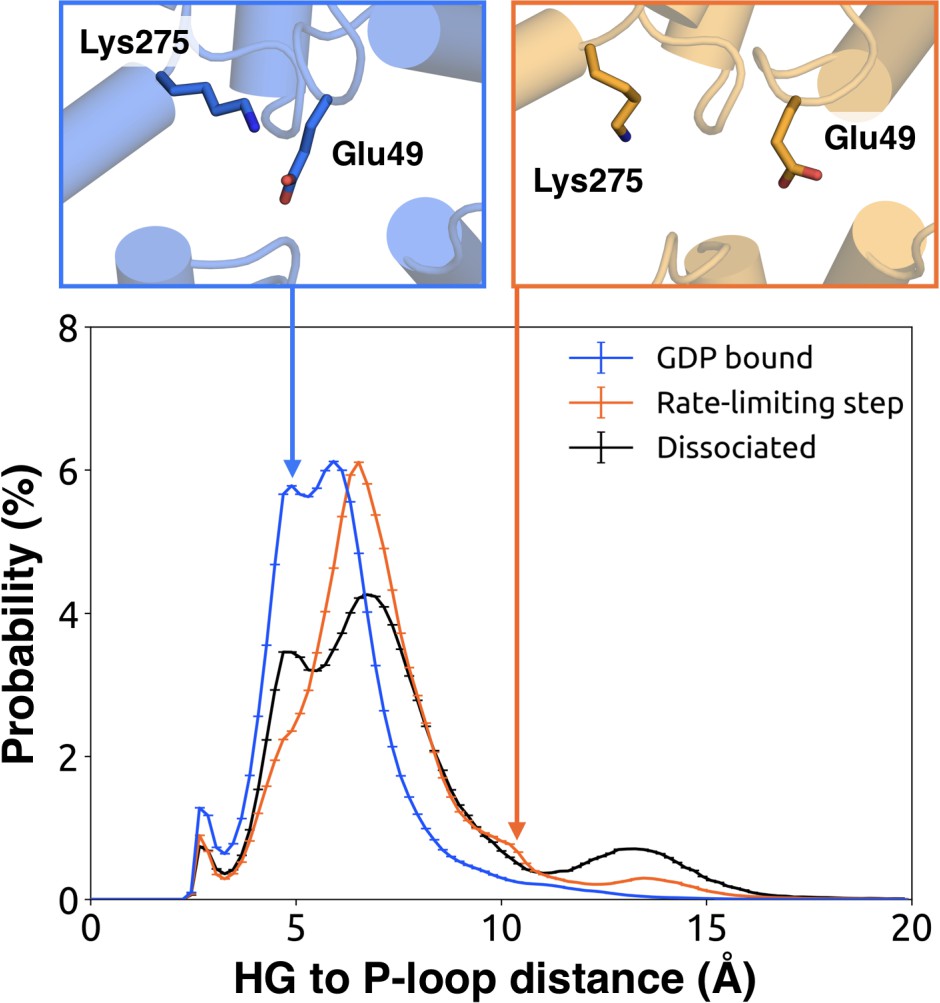
Probability distributions of the distance between the side-chains of Lys275G.s5hg.1 and Glu49G.s1h1.4.
Distributions were computed for the bound (blue), rate-limiting step (orange), and dissociated (black) states. Representative structures (above) for the bound (left, blue) and rate-limiting step (right, orange) are included with residues as sticks.
Figure 7 with 1 supplement
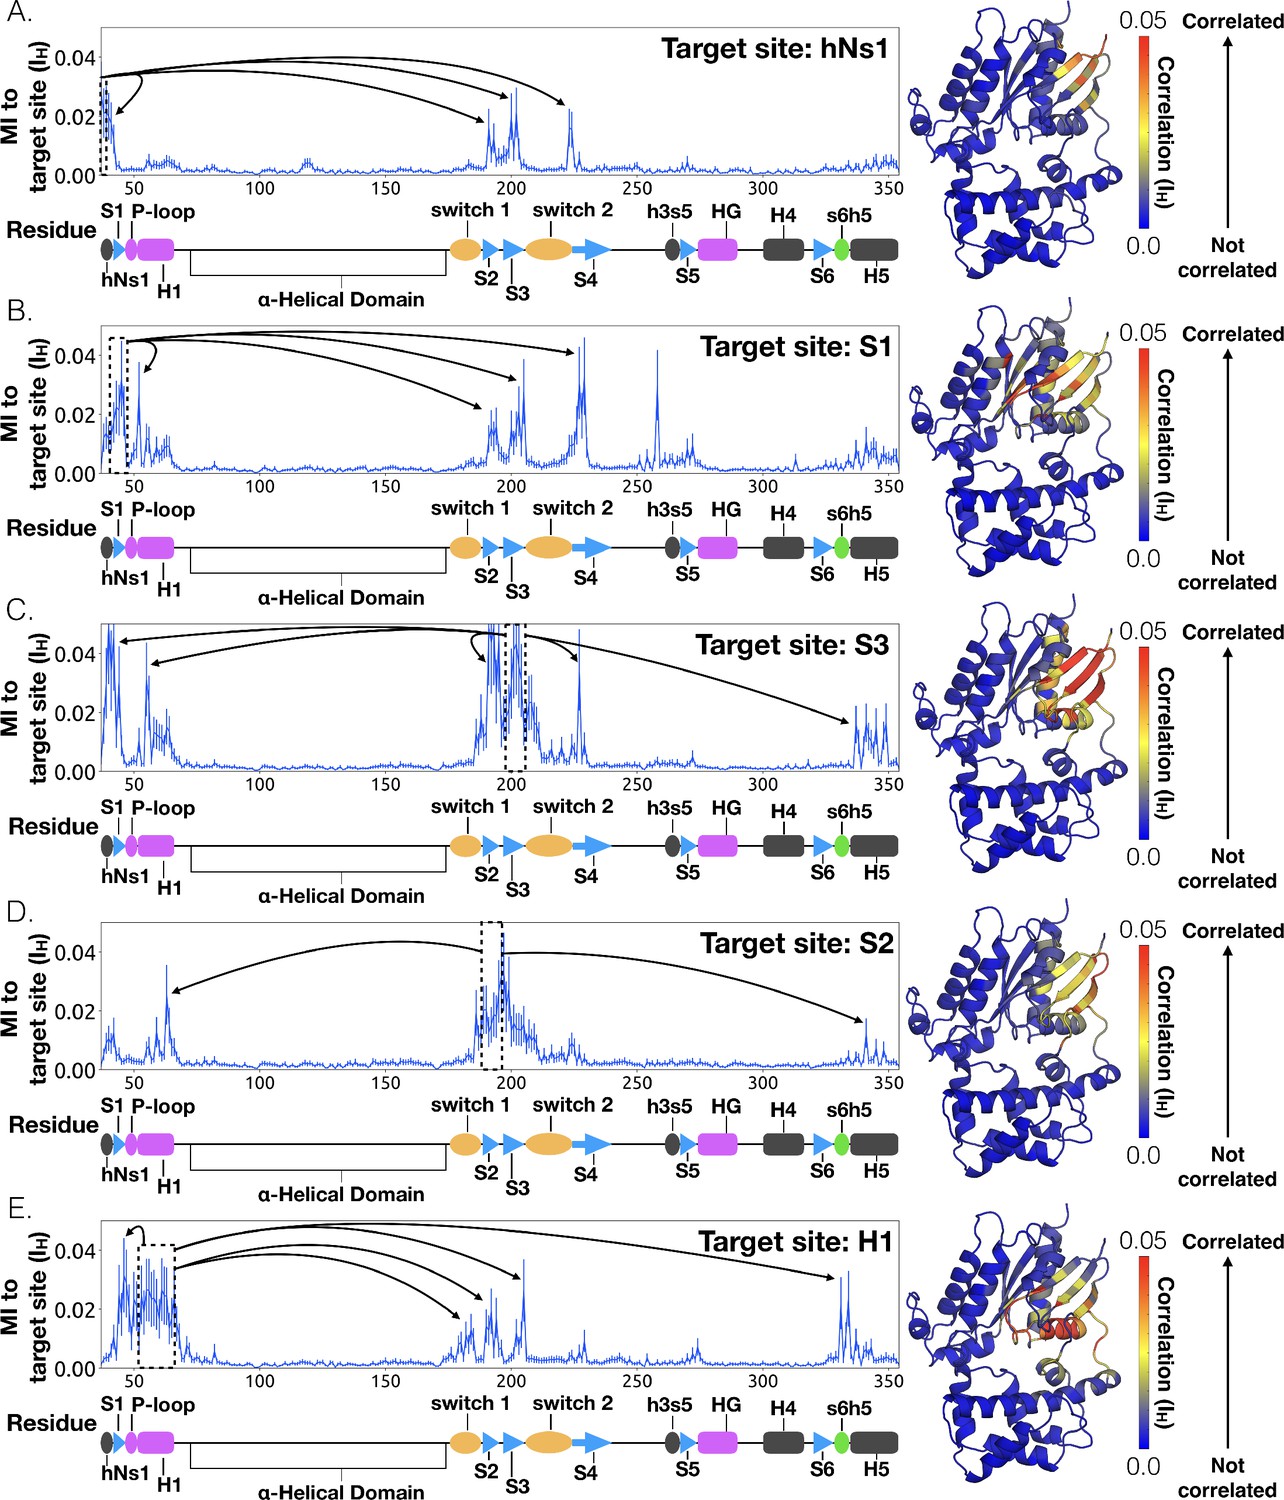
Allosteric network connecting hNs1 motion to the nucleotide-binding site via the β-sheets.
CARDS data showing communication per residue to a target site (dashed box) is plotted (left) and mapped onto the structure of Gαq (right) for (A) hNs1, (B) S1, (C) S3, (D) S2, and (E) H1. Arrows indicate regions of importance with significant communication to the target site.
Figure 7—figure supplement 1
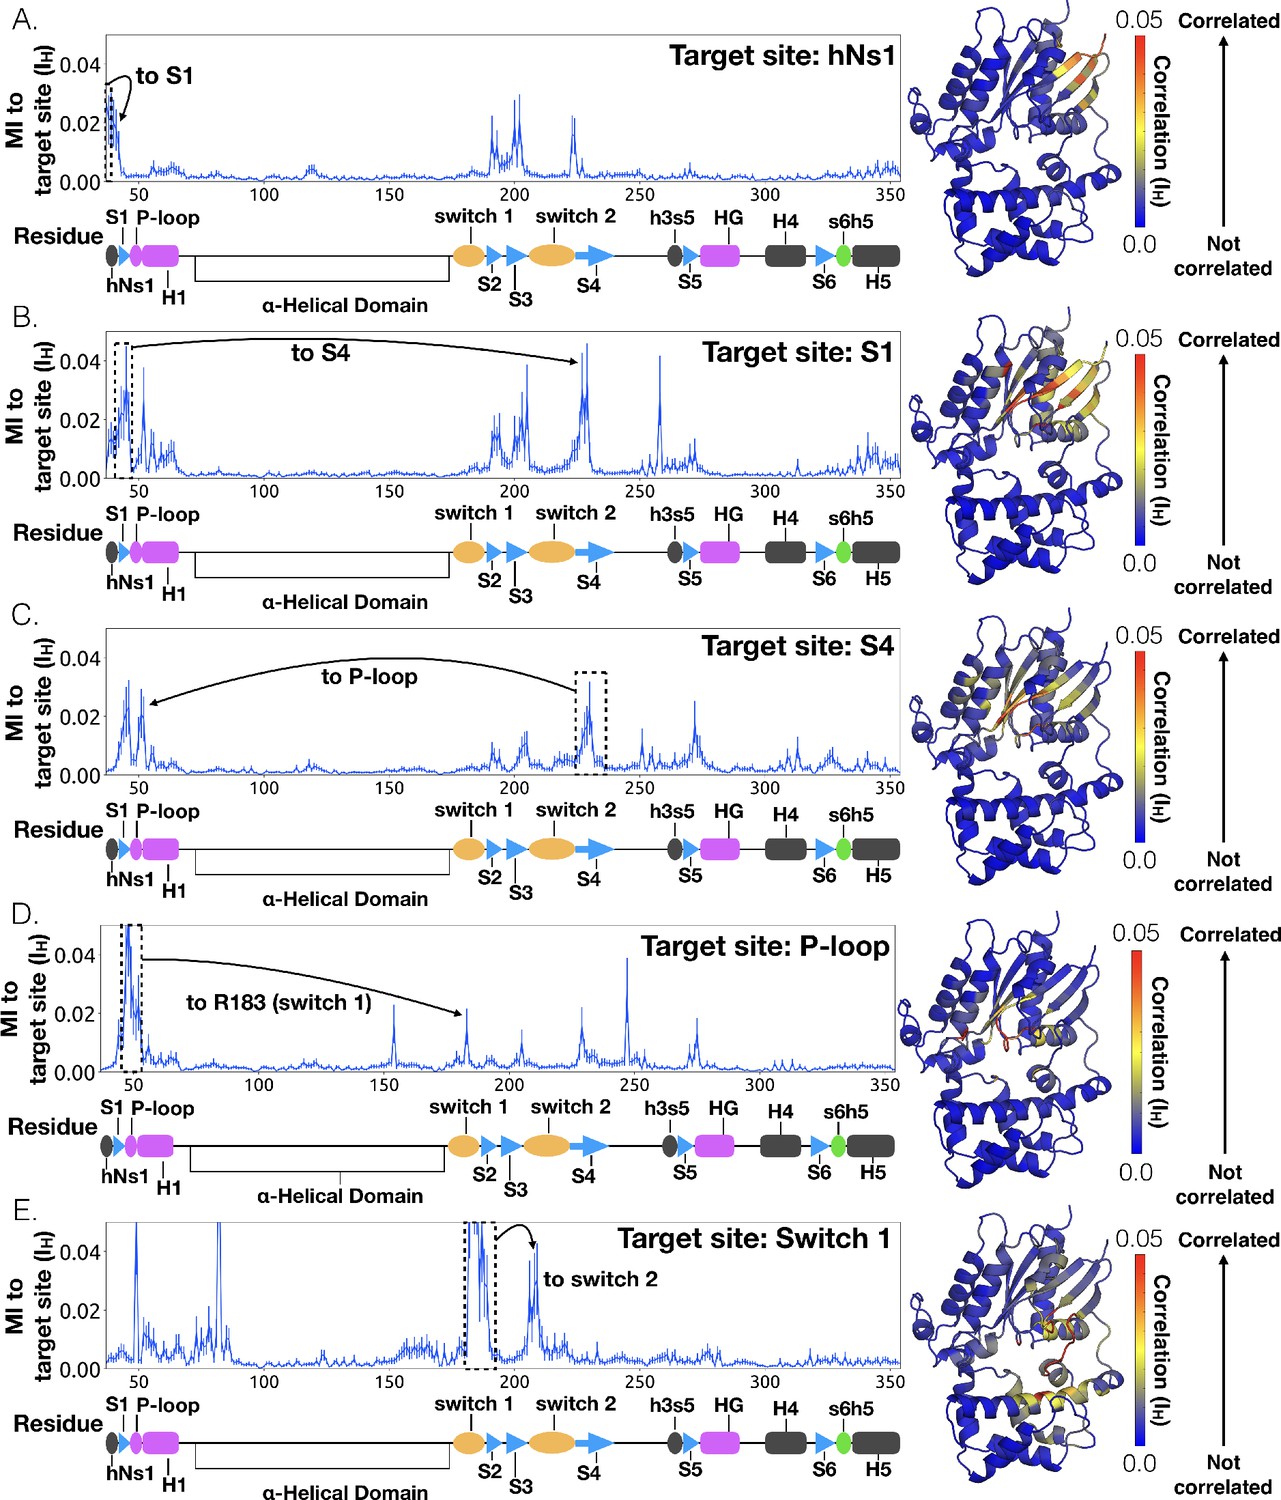
Allosteric network connecting hNs1 contacts to the P-loop and switch 1 via S4.
CARDS data showing communication per residue to a target site (dashed box) is plotted (left) and mapped onto the structure of Gαq (right) for (A) hNs1, (B) S1 (C) S4 (D) the P-loop and (E) Switch 1. Arrows indicate important regions with significant communication to the target site.
Figure 8 with 1 supplement
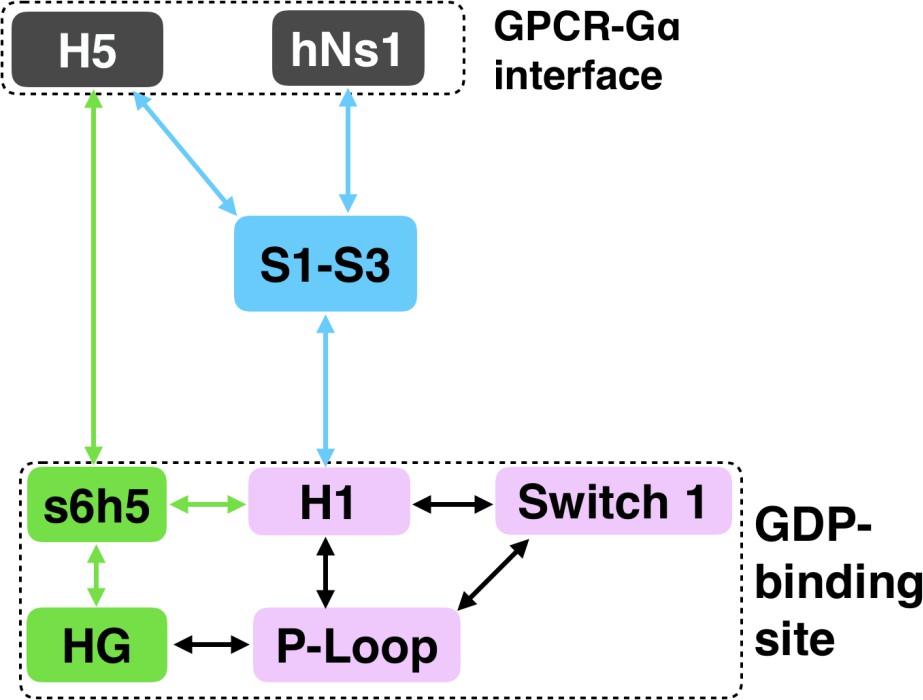
Allosteric network connecting the GPCR- and nucleotide-binding interfaces.
The coloring scheme corresponds to that used in Figure 1, highlighting the GPCR binding interface (gray), GDP phosphate-binding regions (pink), GDP nucleotide-binding regions (green), and the β-sheets (blue).
Figure 8—figure supplement 1
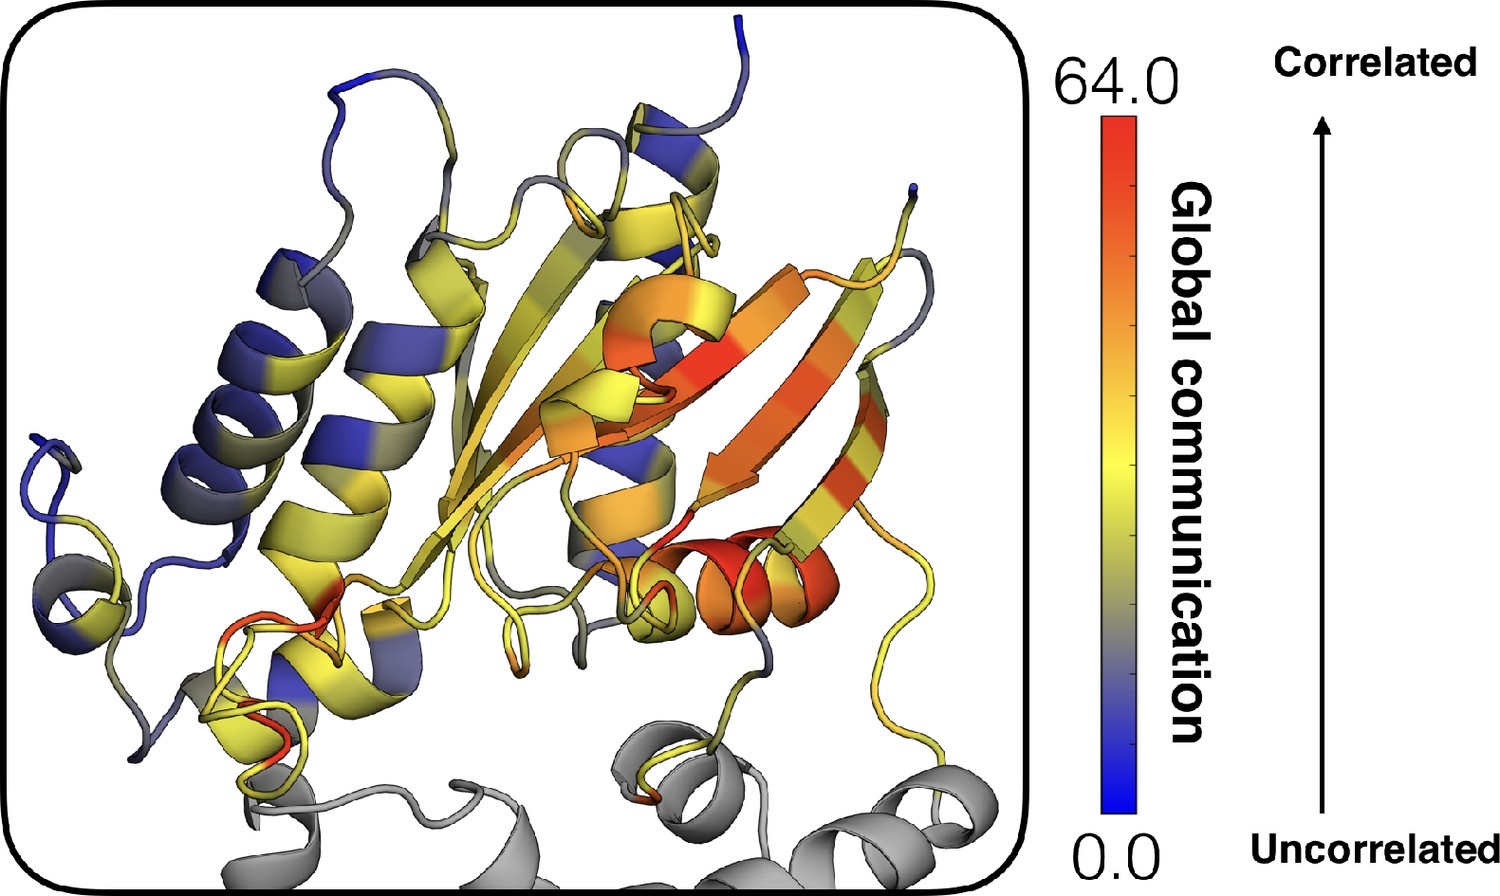
Global communication of each residue in the Ras-like domain mapped onto the structure of Gαq, colored based on the scale (right).
The helical domain (gray) is shown for orientation.
Figure 9 with 1 supplement
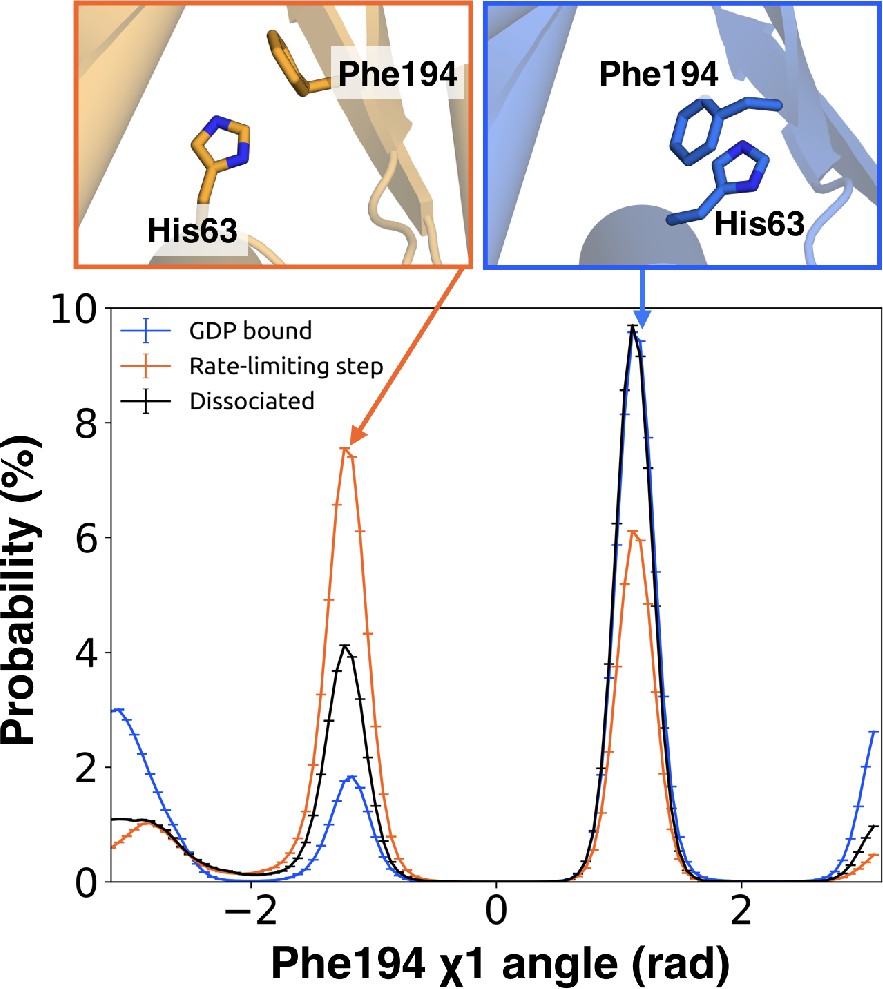
π–stacking between S2 and H1 is disrupted during the rate-limiting step.
Distribution of the χ1 angle (bottom) of Phe194G.S2.6 on S2 before (blue) and after (orange) the rate-limiting step, as well as after GDP release (black). Representative structures of Phe194G.S2.6 and His63G.H1.12 (top) corresponding to before and after the rate-limiting step are also shown.
Figure 9—figure supplement 1
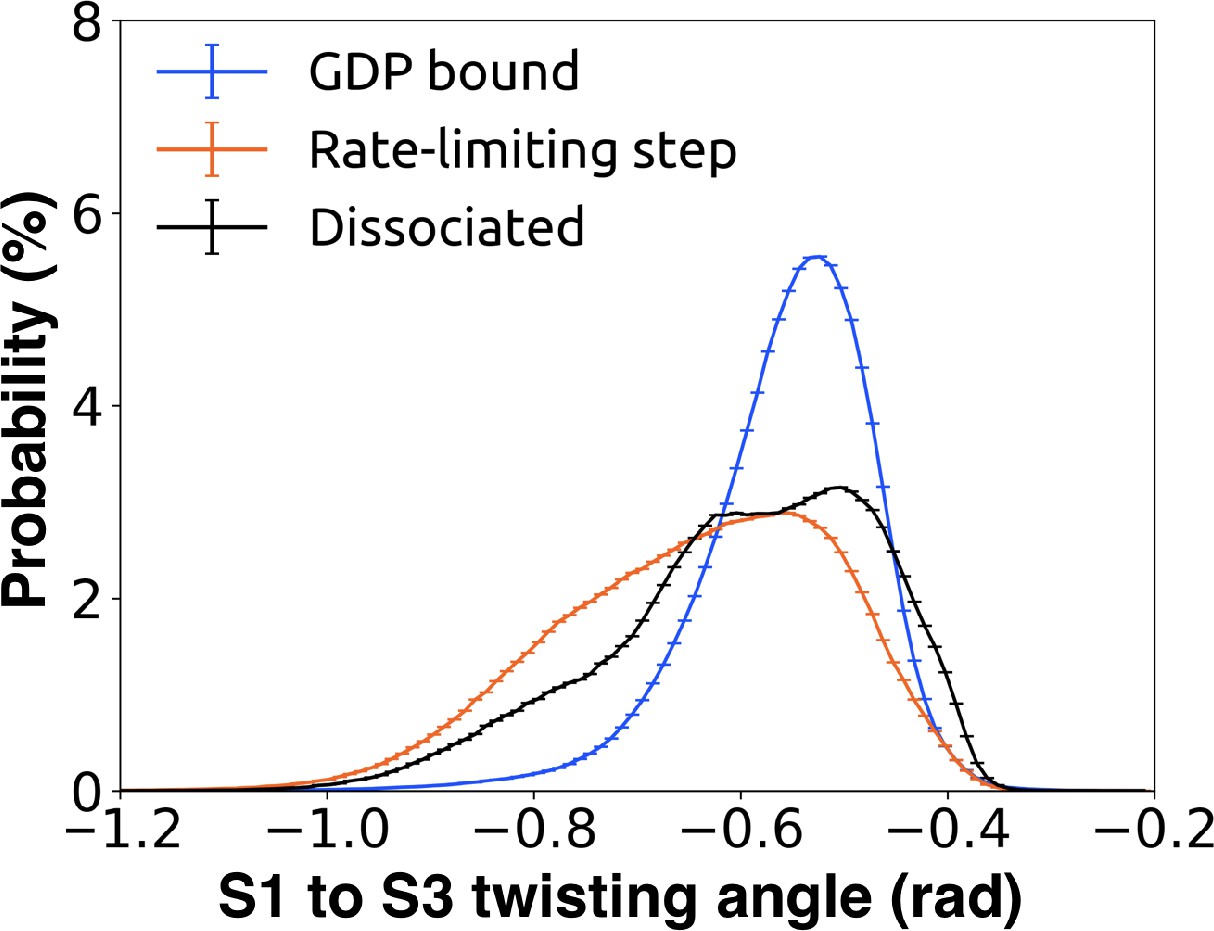
Probability distributions of the twist angle between S1 and S3.
The dihedral angle is computed by taking the dihedral angle between the CA atoms of Leu45G.S1.7, Leu40G.S1.2, Val199G.S3.1, and Asp205G.S3.7, so that the angle measured represents S1/S3 twisting at the GPCR facing side. Twist was computed for GDP bound(blue), intermediate(orange), and GDP dissociated states(black).
Figure 10
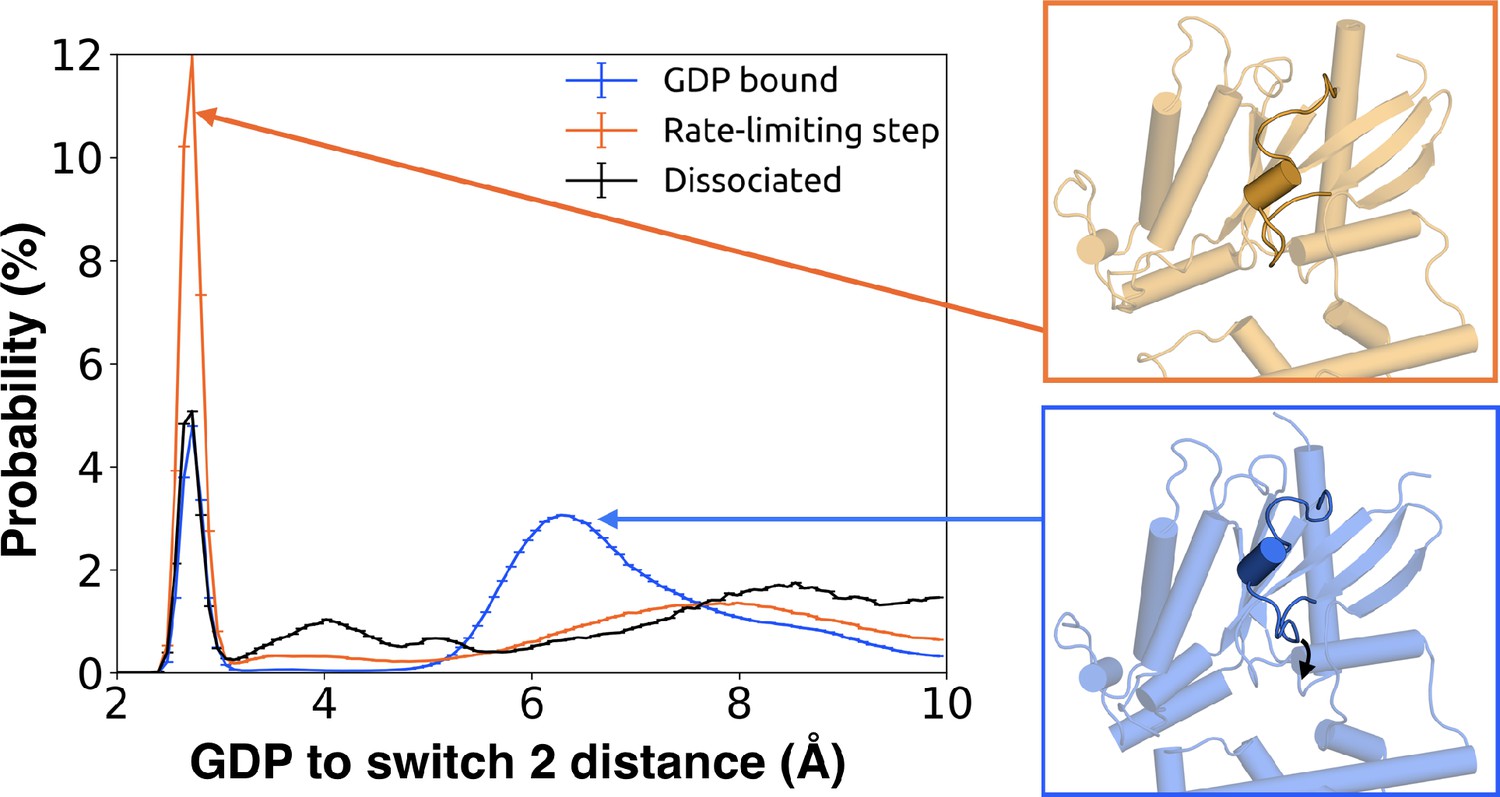
Switch 2 moves towards GDP across the rate-limiting step.
Distance distribution (left) of Gly207G.s3h2.1 to GDP before (blue) and after (orange) the rate-limiting step, as well as after GDP release (black). Representative structures of Switch 2 motion are shown (right).
Tables
Table 1
Details of metadynamics simulations.
https://doi.org/10.7554/eLife.38465.024| Starting conformation | Width of CV1 (Å) | Width of CV2 (Å) | Number of conformations selected |
|---|---|---|---|
| 1 | 0.1 | 0.1 | 171 |
| 1 | 0.08 | 0.03 | 132 |
| 1 | 0.03 | 0.01 | 504 |
| 2 | 0.1 | 0.1 | 145 |
| 2 | 0.08 | 0.03 | 141 |
| 2 | 0.03 | 0.01 | 320 |
| 3 | 0.1 | 0.1 | 198 |
| 3 | 0.08 | 0.03 | 186 |
| 3 | 0.03 | 0.01 | 288 |
Additional files
-
Source data 1
Zipped archive containing the Markov state model, including a transition probability matrix, a transition counts matrix, and state populations.
- https://doi.org/10.7554/eLife.38465.025
-
Source data 2
Compressed archive containing CARDS calculations of communication from each residue to a target site.
- https://doi.org/10.7554/eLife.38465.026
-
Source data 3
Numerical data used to generate histograms in this work, stored in a comma-separated-value (CSV) format and compressed into a zipped archive.
Each file contains 3 columns representing 1) the order parameter measured, 2) probabilities and 3) errors as measured by bootstrapping. Files are separated into sub-folders representing the GDP-bound state, after the rate-limiting step, and upon GDP dissociation. The data in these folders were used to generate Figure 2, 3, 5, 6, 9 and 10.
- https://doi.org/10.7554/eLife.38465.027
-
Transparent reporting form
- https://doi.org/10.7554/eLife.38465.028
Download links
A two-part list of links to download the article, or parts of the article, in various formats.
Downloads (link to download the article as PDF)
Open citations (links to open the citations from this article in various online reference manager services)
Cite this article (links to download the citations from this article in formats compatible with various reference manager tools)
Simulation of spontaneous G protein activation reveals a new intermediate driving GDP unbinding
eLife 7:e38465.
https://doi.org/10.7554/eLife.38465


