A repressor-decay timer for robust temporal patterning in embryonic Drosophila neuroblast lineages
- Weizmann institute of science, Israel
- Howard Hughes Medical Institute, University of Oregon, United States
Figures
Figure 1
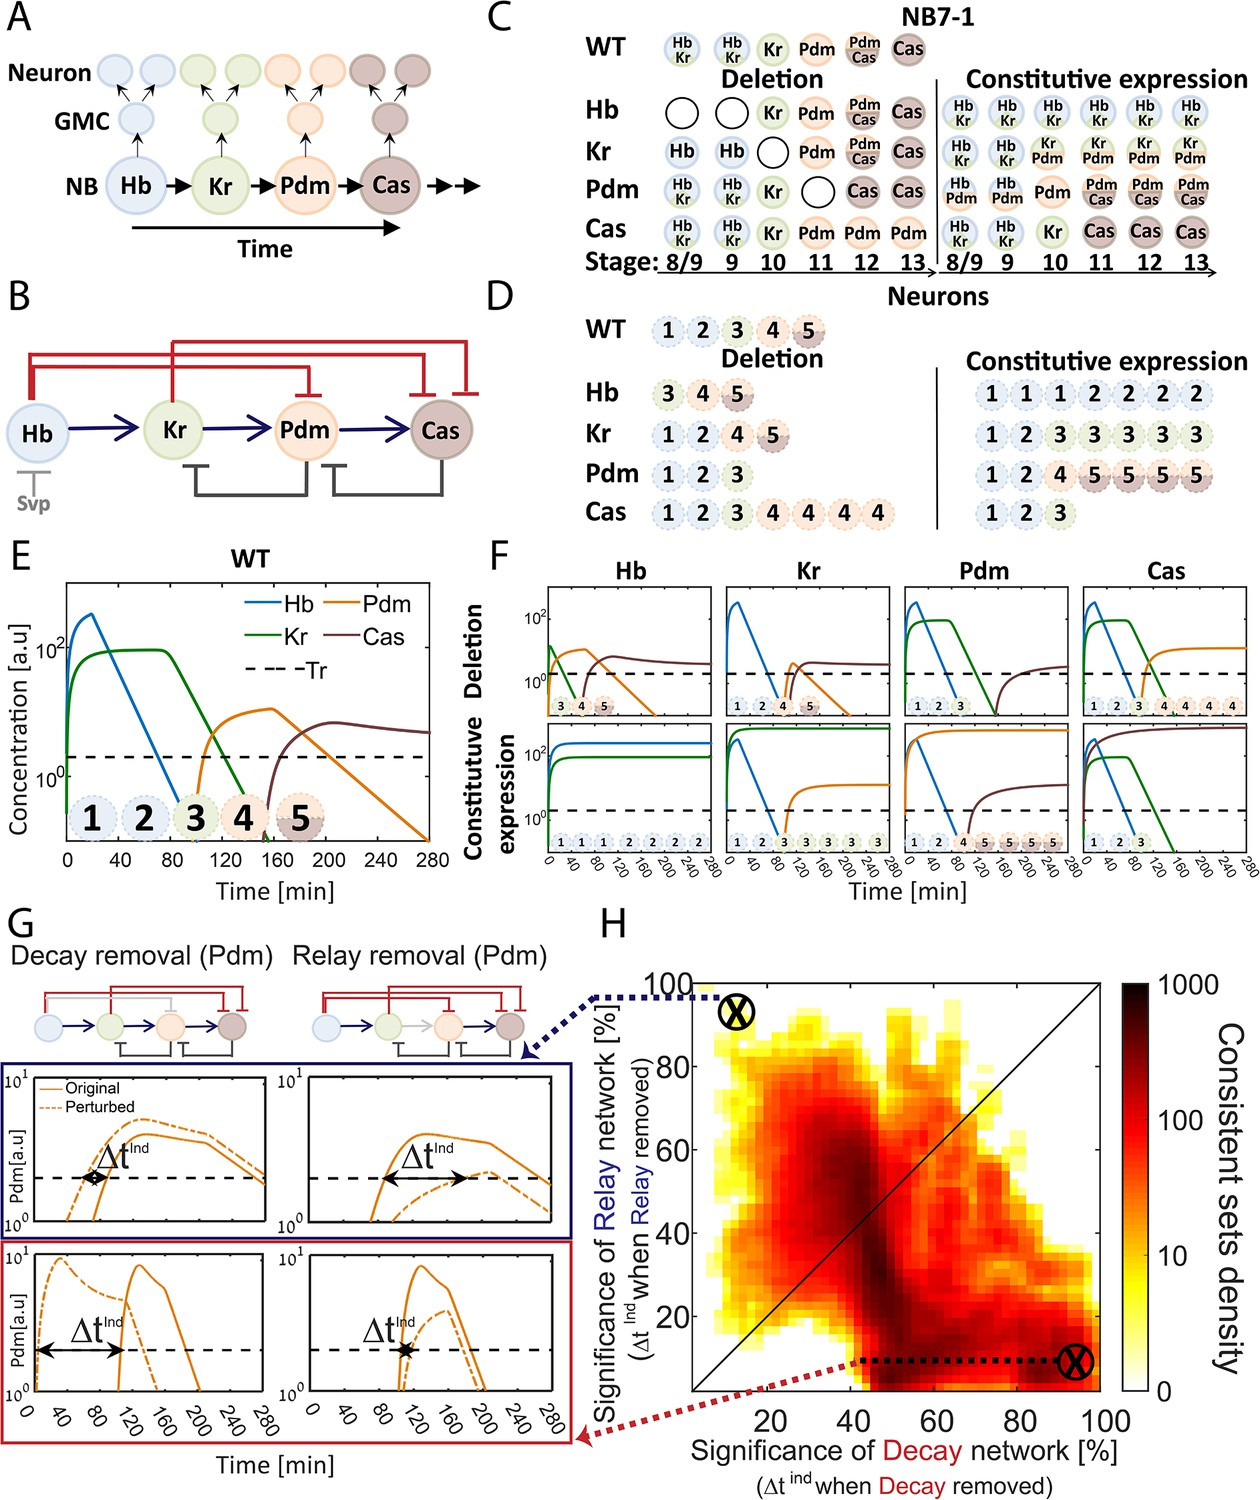
The TTF regulatory circuit combines activator-relay and repressor-decay timers.
(A) The embryonic neuroblast TTF timer: In the Drosophila embryo, NBs express four TFs in a temporal sequence, as shown. We term this sequence the TTF timer. NBs divide asymmetrically to generate GMCs, whose further divisions produce post-mitotic neurons. The identity of both the GMCs and the post-mitotic neurons depends on the TTF expressed at the time of NB division, as shown in panel C, top left. (B) The TTF regulatory circuit: experimentally defined cross-regulation between TTFs include interactions that propagate the cascade through activator relay (blue) or repressors decay (red), and backward interactions (black). (C) Summary of TTF expression in NB7-1 of wild type, mutant, and misexpression genotypes. TTFs are color-coded as in (A). Developmental stages indicated at the bottom and genotypes on the left. Data from (Grosskortenhaus et al., 2006; Isshiki et al., 2001; Tran et al., 2010). (D) Summary of neuronal identity in the NB7-1 lineage of wild type, mutant, and misexpression genotypes. Data from (Grosskortenhaus et al., 2006; Isshiki et al., 2001). (E) TTF timer model reproduces all reported phenotypes: a model was formulated that includes all regulatory interactions shown in Figure 1B. Shown are the simulated dynamics of TTFs expression for a set of experimentally consistent parameters. Progeny identity was defined by the TTFs whose expression exceeded a constant threshold (dashed line) at the time of division (see Supplementary file 2 for mapping of expressed TTFs to neuronal fates). (F) Mutant (top) and constitutive expression (bottom) models using the same parameter set as in 1E (see Materials and methods for details). (G–H) Consistent circuits are distributed through the Decay-Relay timer space: over 106 circuits differing by parameters choice were considered. A subset of ~105 circuits reproduced all experimentally defined phenotypes and are referred to as consistent circuits, or consistent parameter sets. Each consistent circuit was positioned on the Decay-Relay plot (H) based on the changes in Pdm and Cas induction (ind) times following removal of the respective activator-relay or repressor-decay interactions (grey bars, top of G). The density of consistent circuits in the Decay-Relay plot is color-coded. Note the larger density of consistent circuits in the regime of decay-timers. See Materials and methods for details.
Figure 2 with 2 supplements
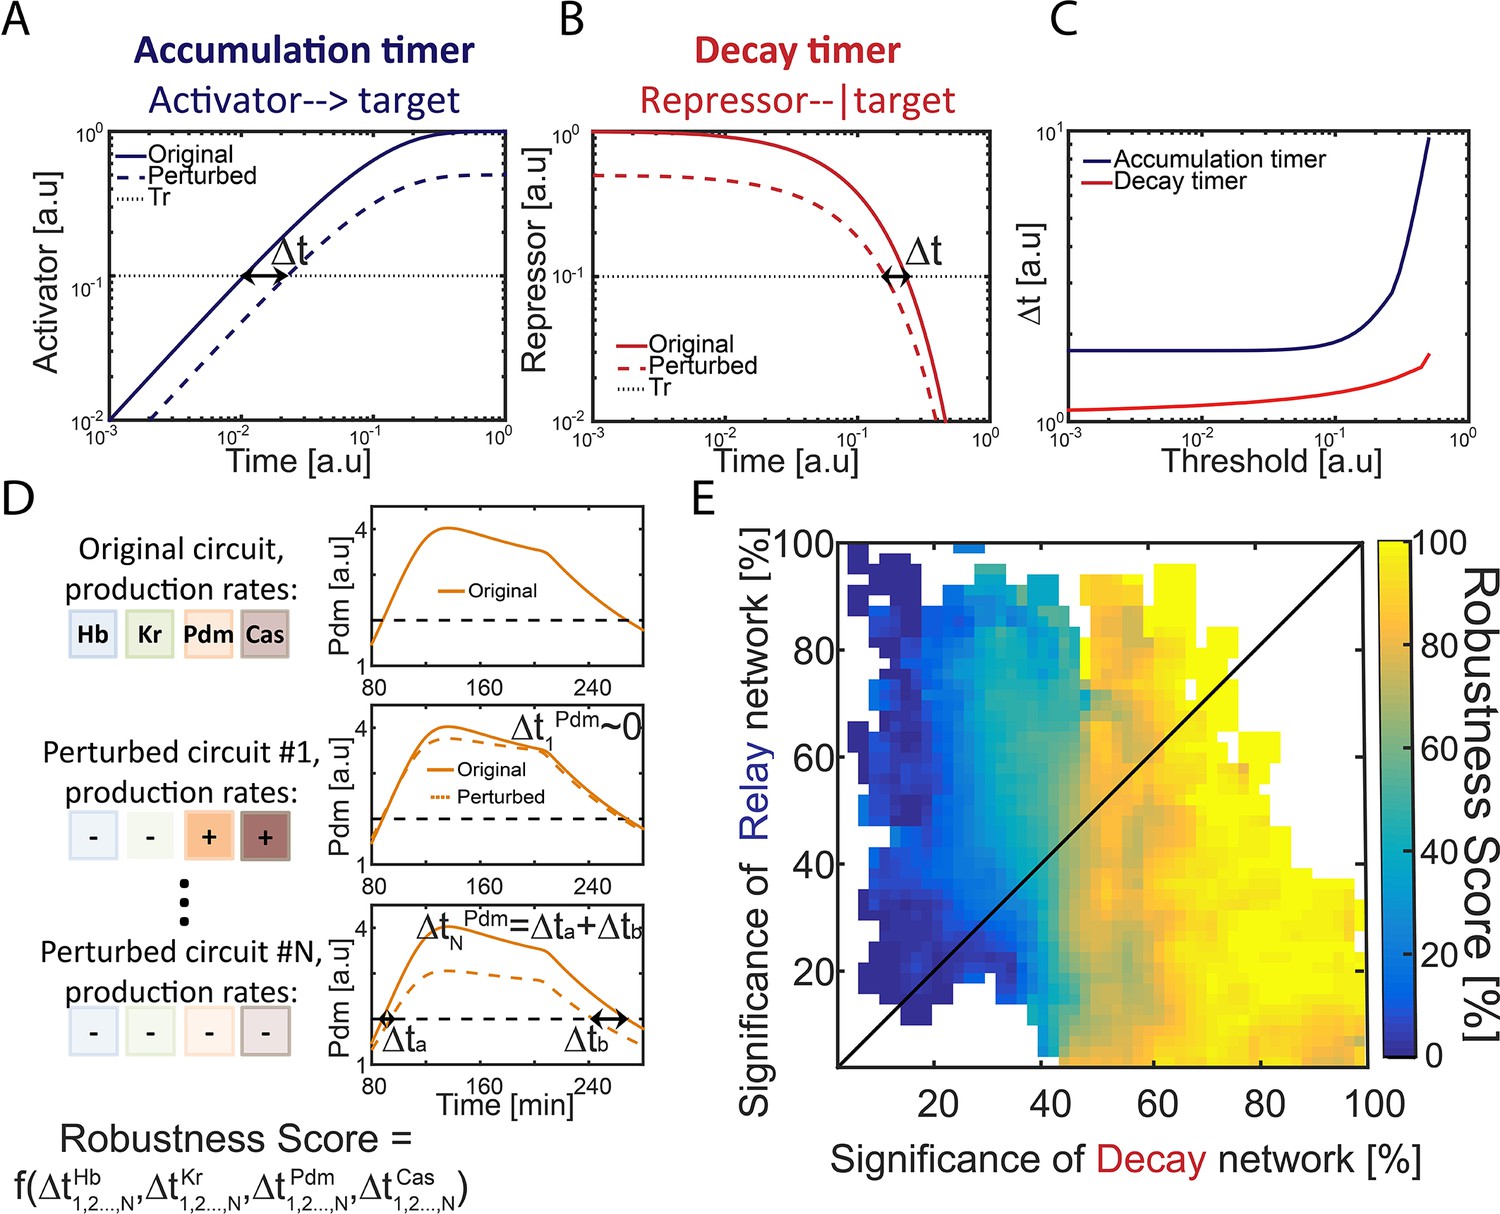
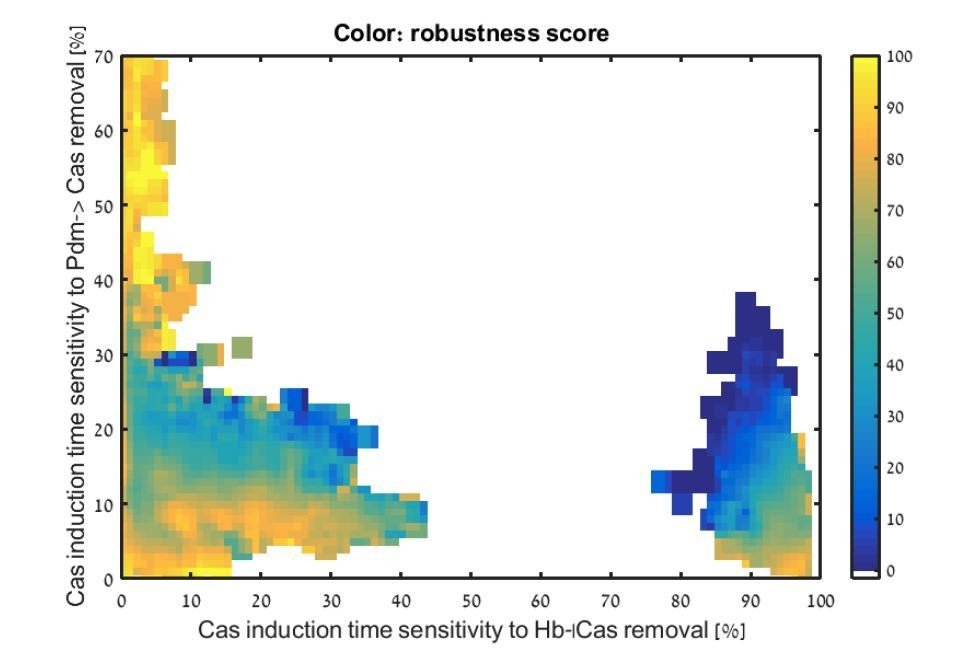
Repressor-decay timer is more robust than an activator-relay timer.
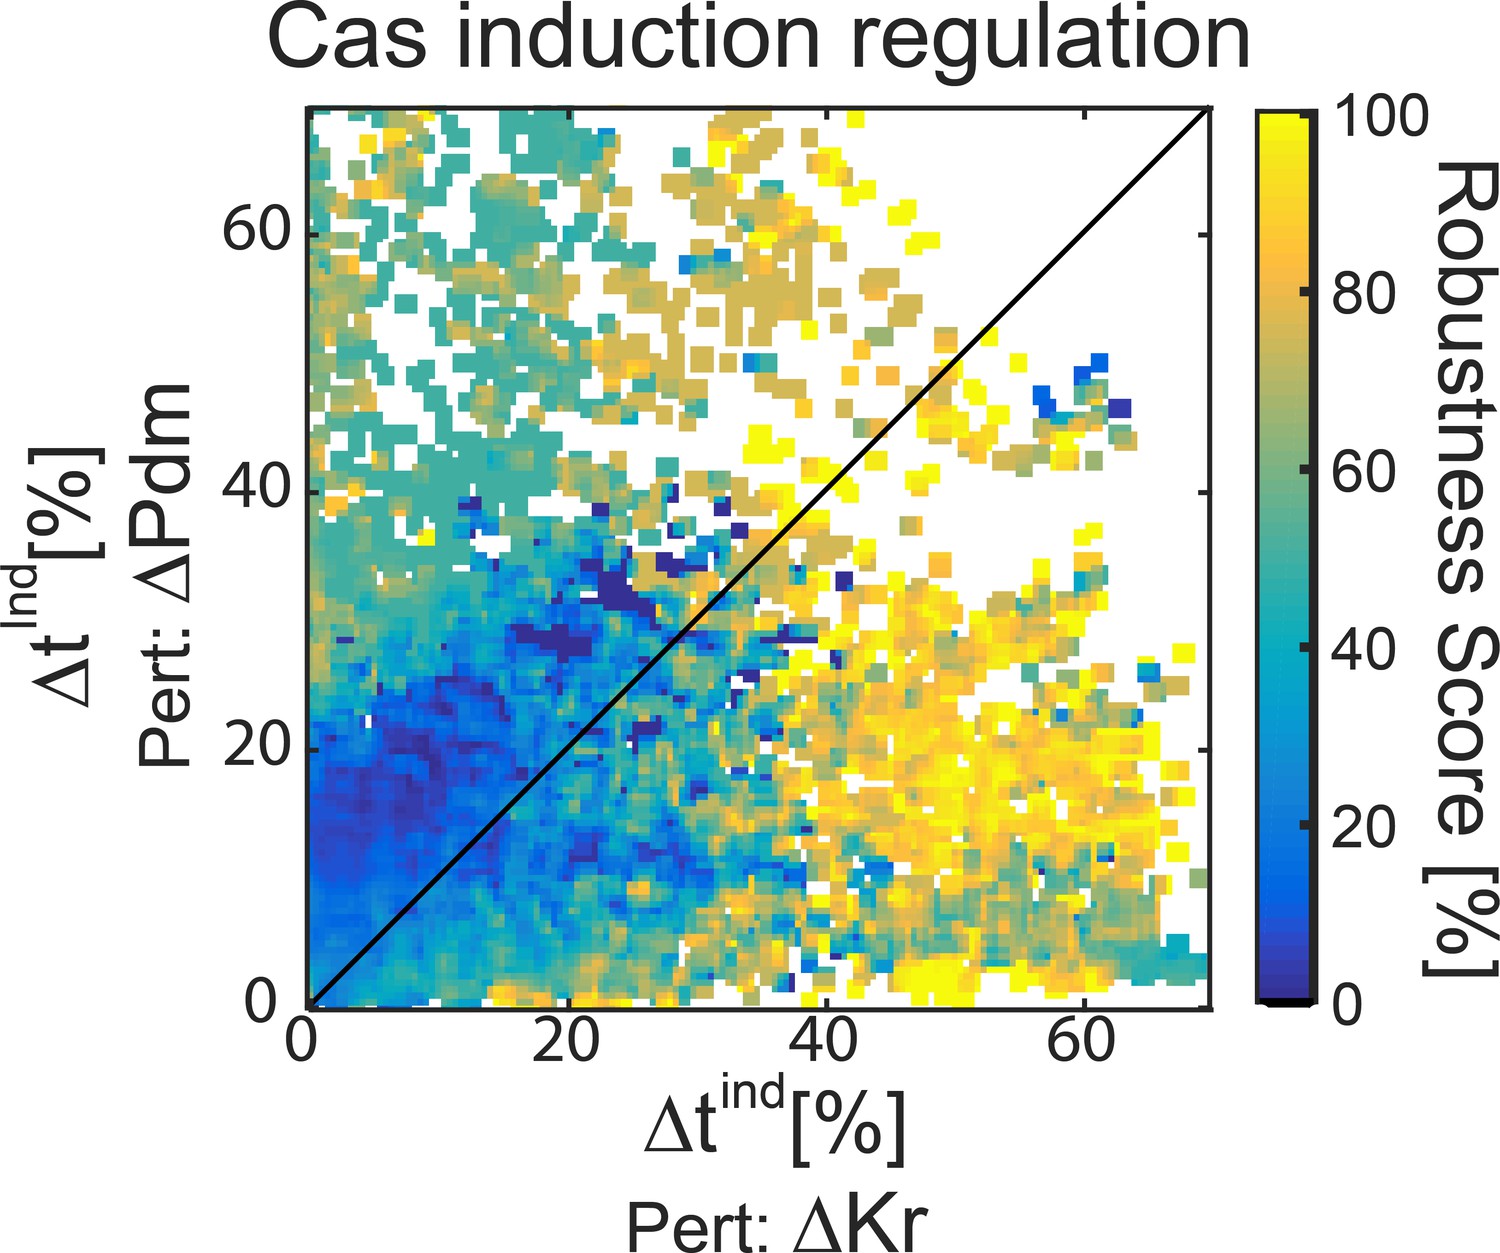
(A–C) Robustness of single-step timers: a single-step timer can be implemented by the accumulation of an activator (A) or by the decay of a repressor (B). In the accumulation of an activator scenario (A), activator production is initiated at t = 0. Once it accedes the threshold Tr, target genes are induced. In the decay of a repressor scenario (B), production of a repressor is stopped at t = 0. Once repressor levels have decayed below Tr, target genes would no longer be inhibited. The temporal dynamics of the regulatory proteins are shown in (A–B) for reference parameters (solid line) and following two-fold reduction in regulator production rate (dashed line). Timer output is defined by the time-delay from the onset of the dynamics until the regulator reaches the indicated threshold Tr. The change in this output following two-fold change in production rate is indicated (black double arrow), and is shown in (C) for different threshold values. See also analytical analysis in (Rappaport et al., 2005). (D) Illustration of robustness score calculation. Parameter sets were scored for robustness by measuring timer sensitivity to moderate (20%) variations in production parameters (see Materials and methods). When testing set robustness, we solved model equations for all combinatorial combinations of adding or subtracting 20% to all the TTFs production rates. For each noise combination, we compared all TTF expression phase durations to those of the original set solution. If a noise combination yielded phase durations which are all within 10% distance of the respective original durations, the noise combination was considered 'close' to the original. A robustness score was then calculated as the percentage of 'close' noise combinations. An example for a specific parameter set: left- production rates color coded by TTF, right – simulation of Pdm dynamics. Upper: original parameter set, below: two noise combinations:#1 and #N (- sign and lighter shade for reduced production rate, + sign and darker shade for increased production rate). For #1, the perturbed dynamics are 'close' to the original while for #N, a substantial error in phase duration, Δ, occurred and dynamics are not 'close'. Formula at the bottom of the panel indicates that the robustness score for the original set is a function of all noise combinations 1,2,…,N and durations of all TTF expression phases. (E) Distribution of robust circuits in the Decay-Relay timer space. Consistent circuits were positioned on the Decay-Relay plot based on both Pdm and Cas induction, as is Figure 1H, and their robustness scores (see Materials and methods), averaged over closely positioned circuits, were color-coded. Considering the positioning of all circuits in the Decay-Relay timer space based on Pdm and Cas separately (Figure 2—figure supplement 1) and based on both TTFs combined (Figure 2E), high robustness scores were found in the region of repressor-decay timers.
Figure 2—figure supplement 1
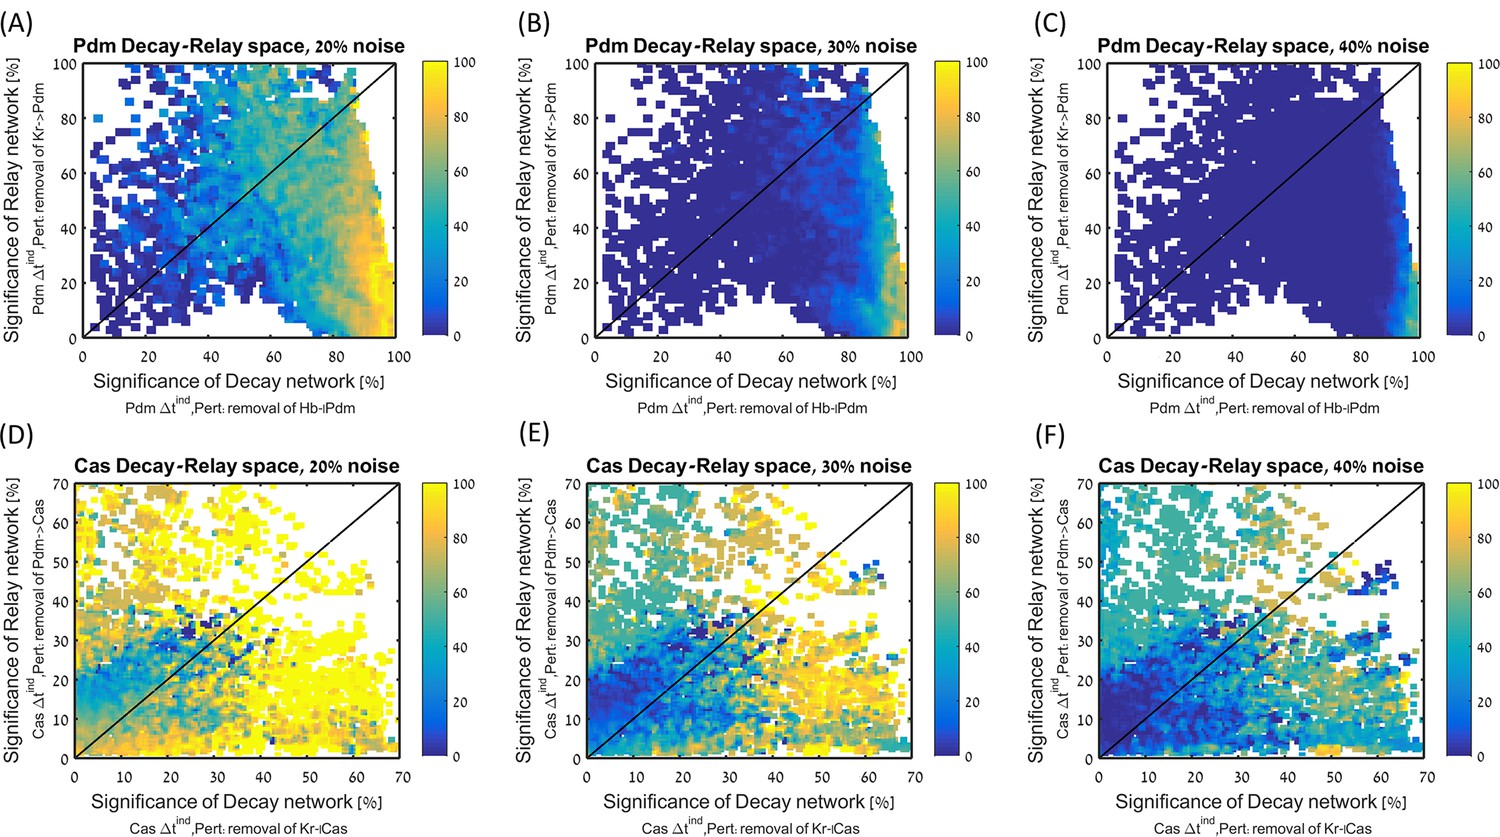
Robustness in decay-relay space separated by TTF.
All consistent circuits, as described in Figures 1–2, were considered. Each consistent circuit was scored by measuring the change in Pdm (A–C) or Cas (D–F) induction times following deletion of decay or relay regulations, as indicated on plots axis labels. These values were used to uniquely position each circuit in the Decay-Relay sensitivity space (see Materials and methods), per TTF. Parameter sets are color-coded based on their robustness score for the WT circuit (calculated as in Figure 2E), for increasing noise levels from 20% to 40%, as indicated in plot titles.
Figure 2—figure supplement 2

Expression durations for Pdm (A) and Cas (B), divided by total simulation time (same for all parameter sets).
All consistent circuits, as described in Figures 1–2, were considered. Each consistent circuit was scored by measuring the change in Pdm and Cas induction times following deletion of decay or relay regulations (same as Figures 1H and 2E). These values were used to uniquely position each circuit in the Decay-Relay sensitivity space (see Materials and methods). Parameter sets are color-coded based on the duration of Pdm (A) and Cas (B) upregulation duration, normalized by the total duration of the simulation. Pdm and Cas upregulation durations are not correlated with location in Decay-Relay space, the consistent parameter sets are therefore comparable in terms of robustness.
Figure 3 with 1 supplement
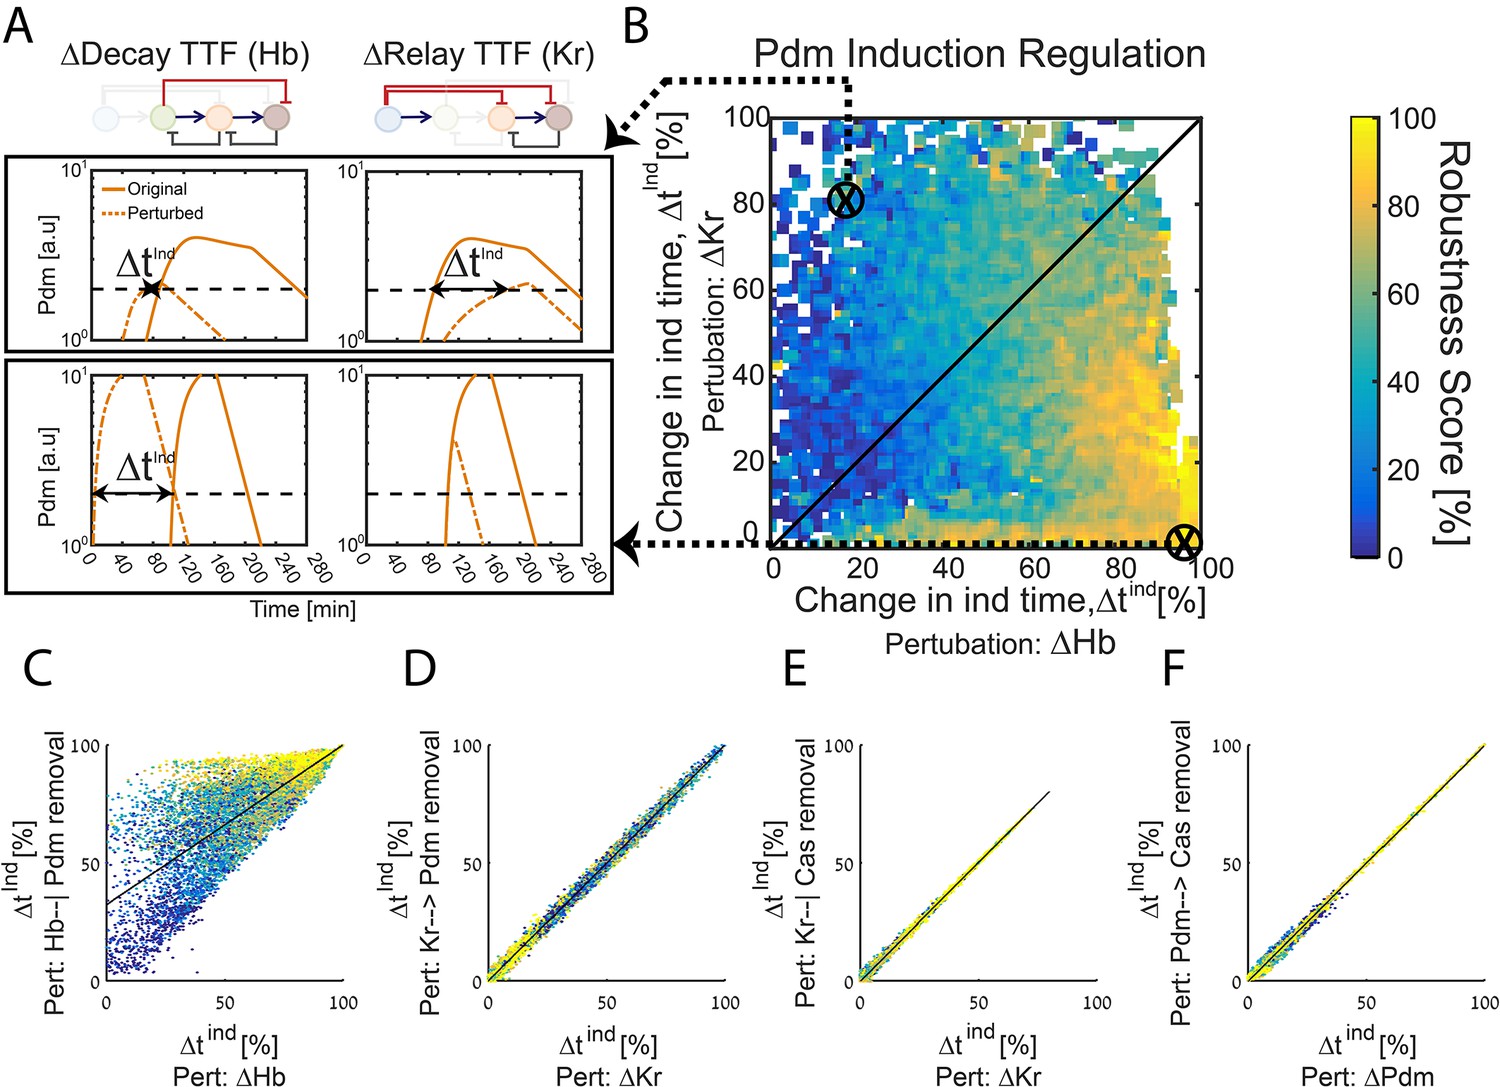
The TTF circuit can be positioned in the Decay-Relay timer space based on TTF deletion phenotypes.
(A–B) TTF deletion phenotypes can distinguish robust circuits: all consistent circuits, as described in Figures 1–2 above, were considered. Each consistent circuit was scored by measuring the change in Pdm induction times following deletion of Hb (A, left) or deletion of Kr (A, right). These two values define the ‘Hb deletion’ and ‘Kr deletion’ sensitivity of Pdm induction respectively, for each parameter set. We then use these two values to define the Hb-Kr deletion sensitivity space, where we uniquely position each consistent circuit (B). Color-coding circuits based on their robustness score for the WT circuit (as in Figure 2E), allows us to observe robustness of WT circuits as function of their Pdm induction sensitivity to Hb and Kr deletions. This analysis shows that robust circuits are only found in a small region in the Kr-Hb sensitivity space, in which Pdm induction time is much more sensitive to Hb than to Kr deletion. (C–F) Sensitivity to TTF deletion (X axis) correlates with the sensitivity to the specific removal of the respective activator-relay or repressor-decay interactions (Y axis): all consistent circuits, as described in Figures 1–2 above, were considered. For each consistent circuit, the changes in Pdm or Cas induction times following TTF deletion or removal of regulatory interactions was measured. Correlations between the effects of TTF deletion and removal of the respective regulatory link are shown. Each dot in these correlation figures represent one consistent circuit, color-coded by its robustness score for the WT circuit.
Figure 3—figure supplement 1
All consistent circuits, as described in Figures 1–2, were considered.
Each consistent circuit was scored by measuring the change in Cas induction time following deletion of Kr or deletion of Pdm. These values were used to uniquely position each circuit in the Kr-Pdm sensitivity space. Color-coding circuits based on their WT robustness score for 30% noise (see Materials and methods), shows that most robust circuits are found in the region where Cas induction time is more sensitive to Kr than to Pdm deletion.
Figure 4 with 1 supplement
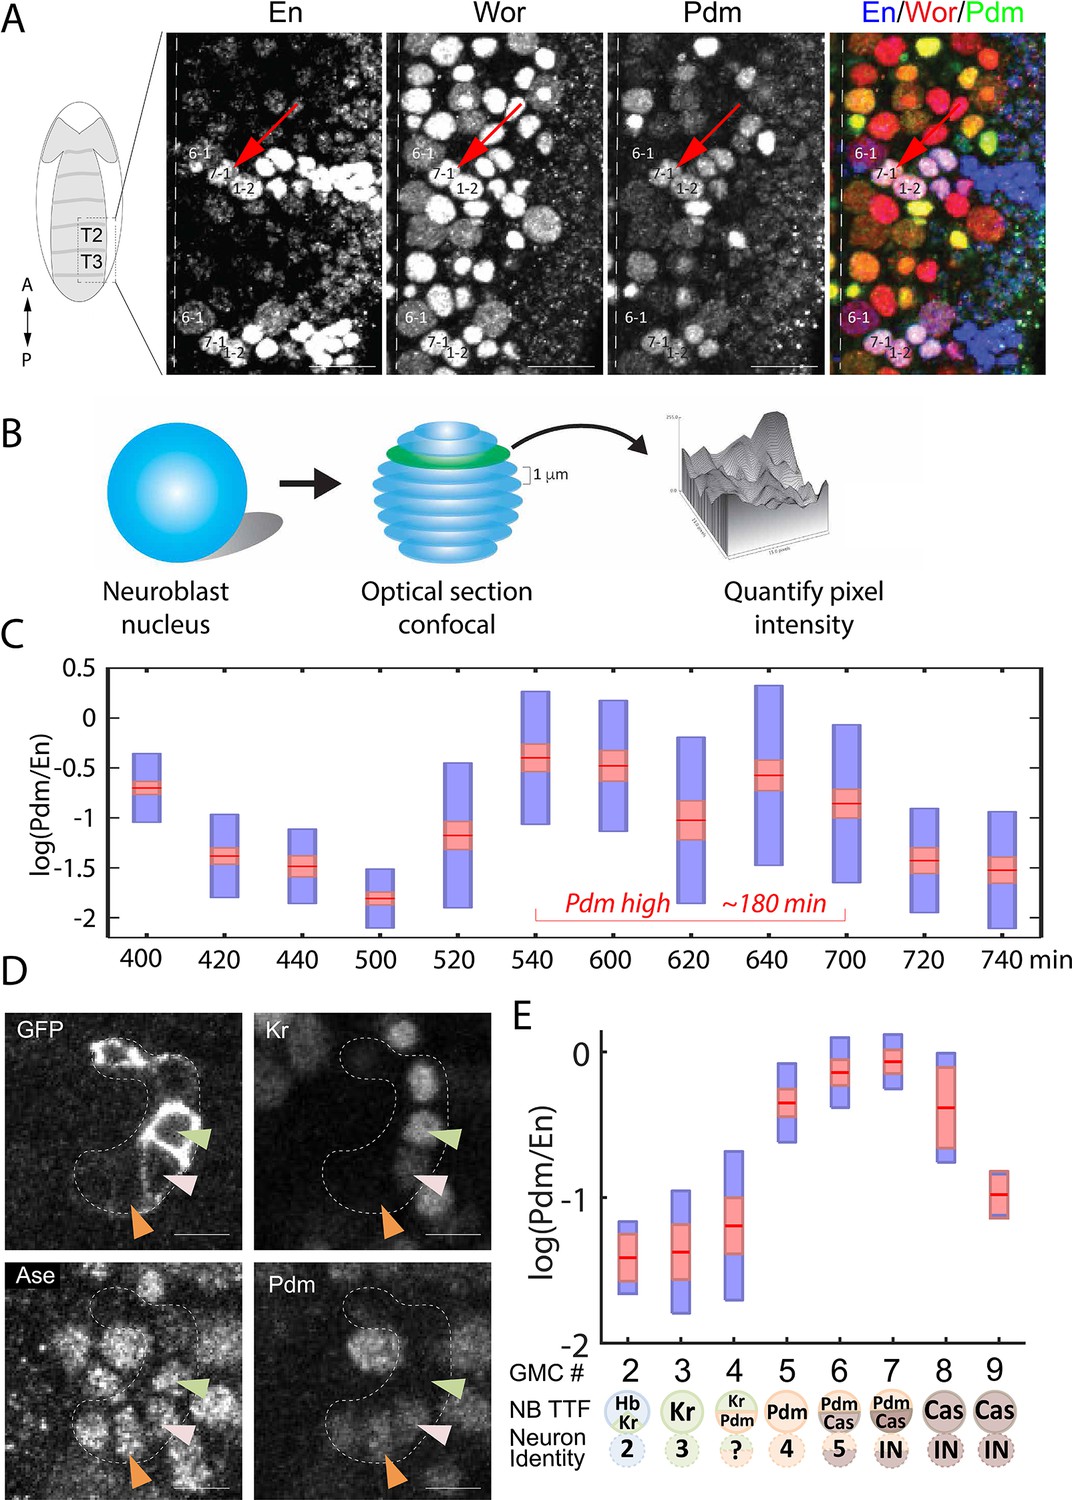
High temporal resolution analysis of Pdm expression.
(A) Confocal image of the neuroblast layer from ventral nerve cord segments T2 and T3 of an early stage 11 embryo (boxed area in illustrated embryo on the left). The NB7-1 was identified by the pan-NB marker Worniu (Wor) and the NB spatial marker Engrailed (En). NB6-1 is the most anterior medial En +NB, with the En +NB7-1 just posterior and lateral (red arrow), and En +NB1-2 completing the diagonal. Genotype: y1 w1. Scale bar: 20 um. (B) Methodology for obtaining transcription factor levels in G1/G2/S-phase of NB7-1. Confocal section stacks (at a 1 um interval) of individual NB nuclei were obtained, and the area and signal intensity of each section were measured and summed to obtain the total intensity of TTFs. (C) Data from the number of NB7-1 indicated in Supplementary file 3 is summarized by box plots of measured log(Pdm/En) staining intensity as a function of time. The 1.96 SEM (95% confidence interval) is shown as a red rectangle with a horizontal red line for the mean, with a blue rectangle marking the limits of one standard deviation above and below the mean. Time duration of the Pdm phase (approximately 180 min) is indicated in red. We do not yet have an explanation for the moderate transient decrease in Pdm levels around 620 min. (D) Confocal image of a NB7-1 lineage marked with GFP (NB7-1-Gal4, UAS-GFP) in an early stage 11 embryo. Arrowheads indicate three consecutive GMCs (Ase+) which are Kr+Pdm- (green), Kr+Pdm+ (pink), and Kr-Pdm+ (orange). Genotype: ac-VP16AD gsb-Gal4DBD UAS-superfoldGFP. Scale bar: 5 um. (E) Data from the number of NB7-1 indicated in Supplementary file 3 is summarized by box plots of measured log(Pdm/En) staining intensity as a function of the number of progeny GMC. The 1.96 SEM (95% confidence interval) is shows in red rectangle with a horizontal red line for the mean, one standard deviation above and below the mean in blue rectangle. Scheme below the X axis shows which neuronal progeny is hypothesized to be derived from the GMC.
Figure 4—figure supplement 1
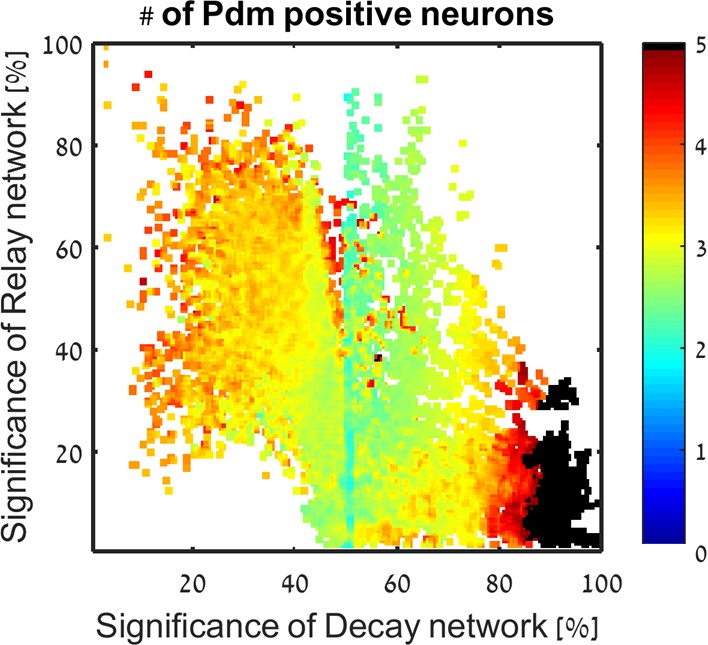
In color: the number of Pdm positive neurons predicted to be created for each consistent parameter set, averaged over close parameter sets.
The number of Pdm derived neurons does not depend on location in Decay-Relay space.
Figure 5 with 2 supplements
Positioning the in-vivo TTF circuit in the Decay-Relay timer space.
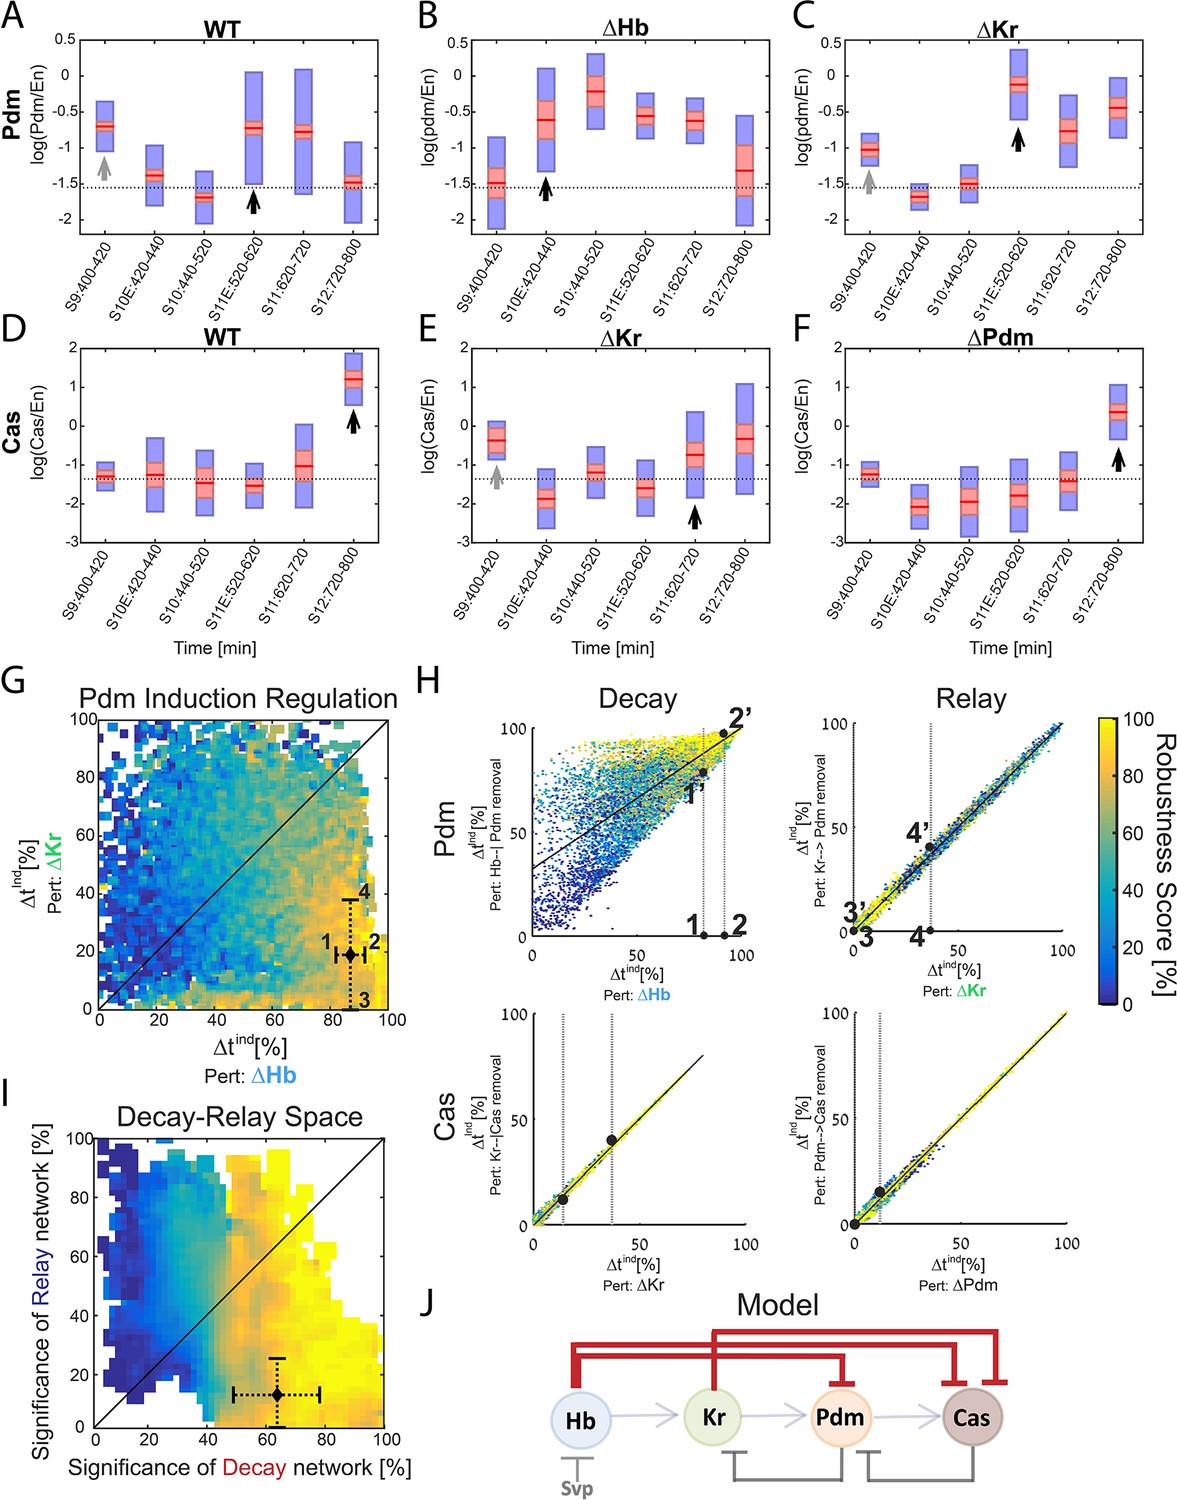
(A–C) Pdm levels in NB7-1. Pdm levels was quantified in wild-type and mutant embryos. Data from the number of NB7-1 indicated in Supplementary file 3 is summarized by a box-plot, with 95% confidence interval shown in red rectangle, mean in red horizontal line and the one SD above and below the mean in blue. Developmental stages are indicated on the X axis. Stages of Pdm induction are indicated by black arrows. Induction stages were determined by calculating a background Pdm level as the mean of Pdm in the second and third stages (S10E and S10), in WT. The stage of induction was defined as the first stage for which the 1.96 SEM (95% confidence interval- red rectangle) was above background (see Materials and methods for details). Early transient inductions are indicated by grey arrows. (D–F) Cas levels in NB7-1 wild type and mutant embryos. Data was plotted as described in (A–C). For both Pdm in WT (A) and Cas in the Kr mutant (E), early transient induction of the TTF was detected at stage 9. We attribute this to basal transcription levels which cause protein production until enough repressor is accumulated. Interestingly, for Cas no such transient early induction appears in WT and Hb mutant (E, Figure 5—figure supplement 1). These results suggest the transient early induction is an Hb-related phenomenon which could stem from slow Hb accumulation, compared to Pdm and Cas. (G) Position of the in vivo timer in the Pdm Hb-Kr sensitivity space: The measured changes in Pdm induction time following Kr and Hb deletions were used to position the in vivo circuit in the Hb-Kr sensitivity space (black diamond), as described for the simulated data Figure 3B. Error bars are based on the experimental temporal resolution (see Materials and methods for details). (H) Estimating the sensitivity of the in vivo timer to removal of delay or relay interactions: The measured changes in Pdm and Cas induction times following TTF deletions were used to position the in vivo circuit on the correlation plots from Figure 3C–F by taking the measured range denoted by 1,2 for ΔHb and 3,4 for ΔKr in Figure 5G and measuring the corresponding ranges for regulation removal. These are denoted by 1’,2’ and 3’, 4’ respectively in Figure 5H upper plots. Similarly, this was done for Cas regulation in Figure 5H lower plots (see Materials and methods for details). (I) The TTF circuit is positioned in the region of repressor-delay timers: data from A-H above defined the positioning of the TTF circuit on the Decay-Relay timer space. The location of the in vivo circuit on the X axis, indicating the significance of the decay network, was defined by the range between points 1’ and 2’: point 1’ is the lower bound on decay significance and point 2’ is the upper bound- based on Pdm. Together with a corresponding analysis for Cas, these points determined the location and error margin for the in vivo circuit on the X axis. Similarly, the location on the Y axis, indicating the significance of the relay network, was defined by points 3’,4’ together with the corresponding points for Cas (see text and Materials and methods). Location of the in vivo circuit is indicated by a black diamond, with error margins indicated by dashed error bars. (J) Our analysis indicates that the progress of TTF expression is dominated by repressor-decay, and not activator-accumulation. The NB TTF timer regulatory network is shown again, with dominant decay regulations in bold.
Figure 5—figure supplement 1

Cas levels in Hb mutant NB7-1.
Cas levels were quantified and summarized by a box-plot, with 95% confidence interval shown in red and the 1 SD in blue. Developmental stages are indicated on the X axis. Stage of Cas induction is indicated by black arrow. Induction stages were determined by calculating a background Cas level as the mean of Cas in the second and third stages (S10E and S10), in WT. The stage of induction was defined as the first stage for which the 1.96 SEM (95% confidence interval- red rectangle) was above background (see Materials and methods for details).
Figure 5—figure supplement 2
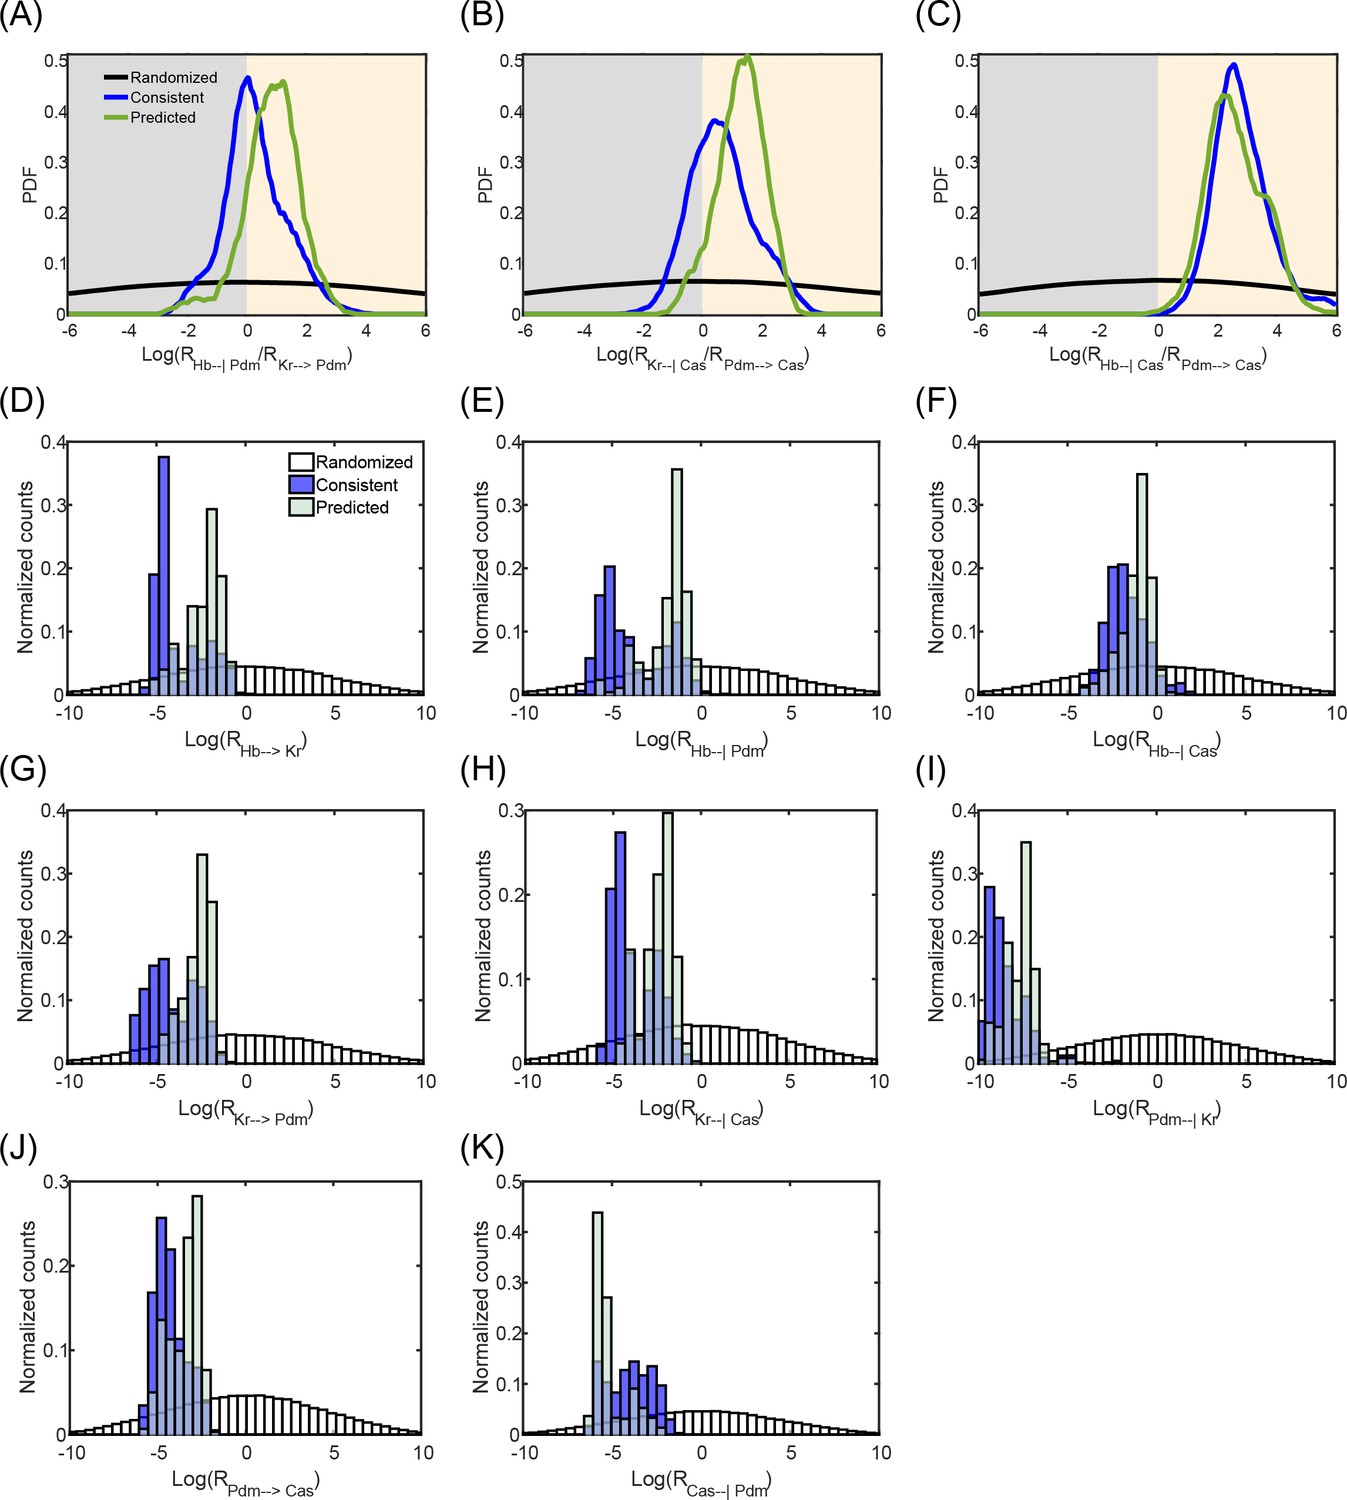
Predicted model parameter values.
For each of the eight regulations in the model, from TTF i to TTF j, the following unit-less quantity was defined: the ratio between total production rate of the regulating TTF and degradation rate multiplied by the regulation coefficient (Supplementary file 1): . The greater this ratio, the faster TTF i will surpass the appropriate threshold and perform its regulatory role on TTF j. Therefore, can be viewed as the 'strength' of the regulation of TTF j by TTF i. Since absolute parameter values may be rescaled between circuits which will then exhibit similar behavior, this ratio better captures the regulations in the model. We further define three groups of parameter sets (circuits).
1. Randomized: randomly drawn parameter sets (both consistent and inconsistent, see Materials and methods, Supplementary file 1,3).
2. Consistent: all consistent circuits, as described in Figures 1–2.
3. Predicted: consistent circuits which are still consistent with our new measurements (Figure 5A–F) and are robust. These circuits are found in Decay-Relay space at the intersection between the area defined by our measurements and the robust zone (Figure 5I: significance of decay network 65–80%, significance of relay network <30%).
In order to compare the relative strength of two interactions governing TTF j within the circuits (a decay interaction by TTF i and a relay interaction by TTF k), we calculate . Note that it is only meaningful to compare interaction governing the same event: the upregulation of TTF j or the downregulation of TTF j. (A-C) We then plot the Probability Density Function (PDF) of for each of the three circuit groups described above, subtracting the mean of the Randomized PDF from all 3 PDFs. Values below 0 indicate , the relay interaction is 'stronger' while values above 0 indicate , the decay interaction is 'stronger'. In all three interaction pairs examined, for consistent and predicted circuits, the PDF is asymmetrical around 0 and is spread out more to the right. This indicates decay dominance for most circuits in these groups. In (A) and (B), this phenomenon is stronger for the predicted PDF than the consistent PDF. Therefore, the predicted circuits are more decay dominated than the consistent circuits. (D-K) On the same plot, normalized histograms of log(Ri,j) (i,j indicated in X axis label), for the three groups of circuits mentioned above, color coded as indicated in the legend of panel D. Consistent parameter sets are a subset of randomized parameter sets; predicted parameter sets further restrict parameter values.
Author response image 1
Additional files
-
Supplementary file 1
Mathematical model of the TTF timer – equations and parameters.
- https://doi.org/10.7554/eLife.38631.013
-
Supplementary file 2
Table of neuronal fates Neuronal fates induced by TTF co-expression in the NB.
Neuronal fates for co-expression of TTFs in the NB at time of division were deduced from lineages described in Figure 1D. For every combination, the resulting fate is specified along with the genotypes from Figure 1D from which fate was deduced. Constitutive expression genotypes are denoted by const and deletions by Δ.
- https://doi.org/10.7554/eLife.38631.014
-
Supplementary file 3
Table of number of NB7-1s scored per box.
- https://doi.org/10.7554/eLife.38631.015
-
Supplementary file 4
Table of Parameter ranges used when searching for consistent sets.
Drawing was done from a log-uniform distribution on indicated ranges. When no specific TTF is indicated for the parameter, it is the same for all four TTFs.
- https://doi.org/10.7554/eLife.38631.016
-
Transparent reporting form
- https://doi.org/10.7554/eLife.38631.017
Download links
A two-part list of links to download the article, or parts of the article, in various formats.
Downloads (link to download the article as PDF)
Open citations (links to open the citations from this article in various online reference manager services)
Cite this article (links to download the citations from this article in formats compatible with various reference manager tools)
A repressor-decay timer for robust temporal patterning in embryonic Drosophila neuroblast lineages
eLife 7:e38631.
https://doi.org/10.7554/eLife.38631


