α-actinin accounts for the bioactivity of actin preparations in inducing STAT target genes in Drosophila melanogaster
- The Francis Crick Institute, United Kingdom
- Biomedical Sciences, University of Bristol, United Kingdom
- Instituto Gulbenkian de Ciencia, Portugal
- Imperial College London, United Kingdom
- MRC Centre for Inflammation Research, University of Edinburgh, United Kingdom
Figures
Figure 1
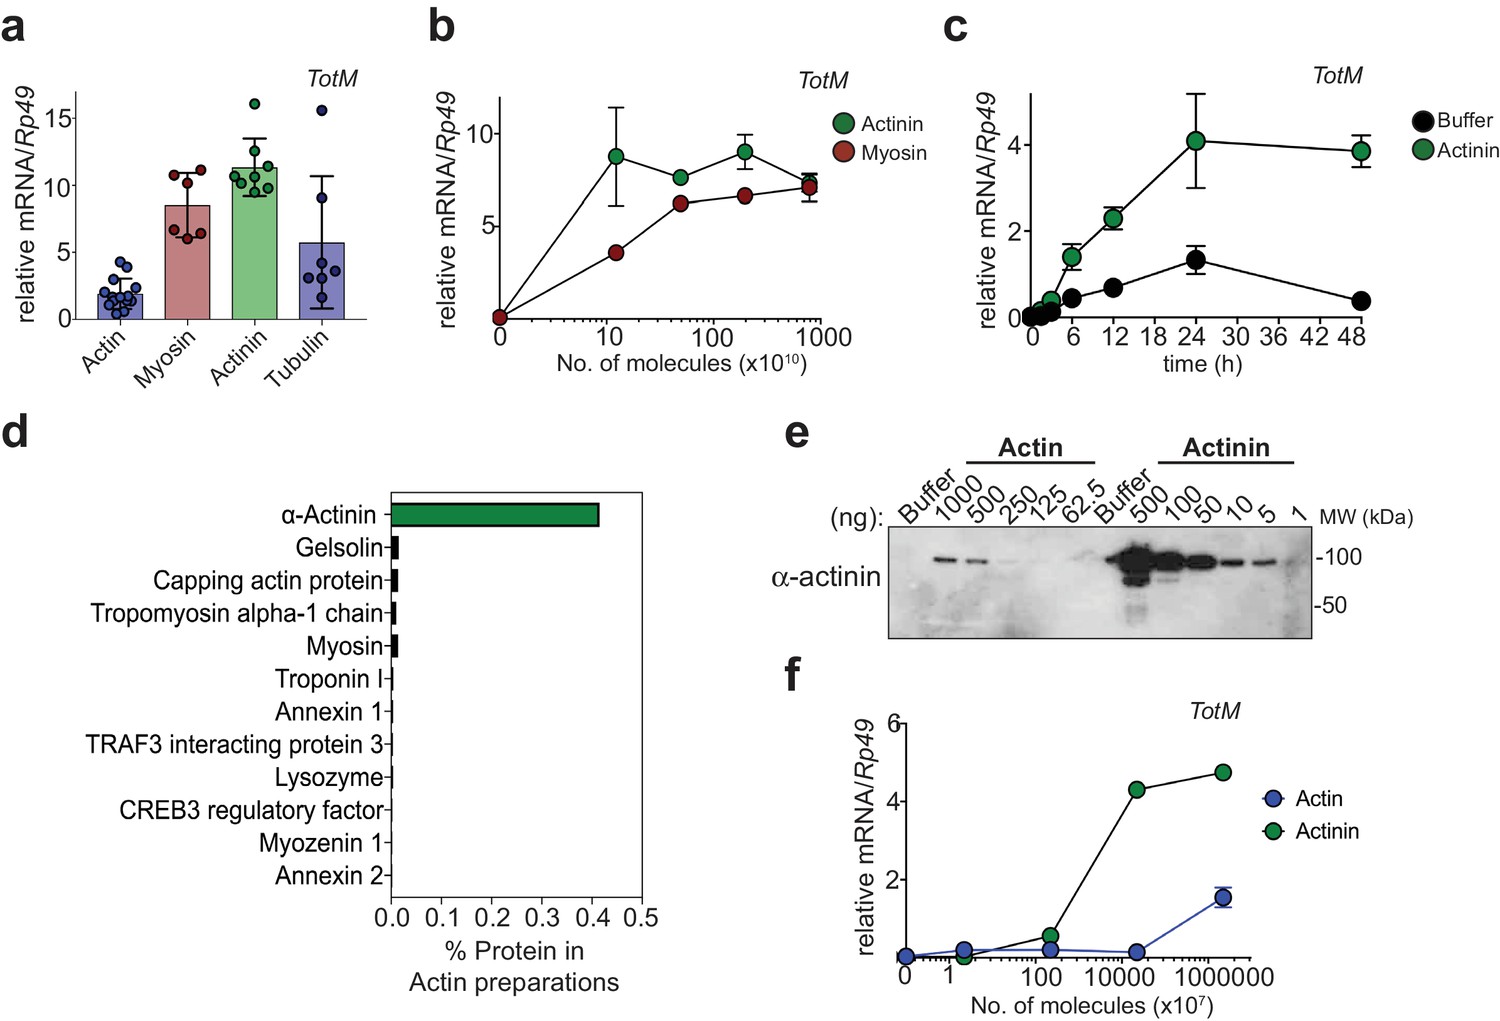
α-actinin is the most potent inducer of STAT-dependent genes.
(a) w1118 flies were injected with equimolar preparations of purified actin, α-actinin, myosin and tubulin (9.4 × 10¹⁷ molecules). Relative expression of TotM 24 hr post injection is shown. Data are pooled from two independent experiments with 10 flies/sample with at least triplicate samples. (b) w1118 flies were injected with preparations containing the indicated number of molecules of purified myosin or purified α-actinin. Relative expression of TotM 24 hr post injection is shown. Data are representative of two independent experiments with 10 flies/sample with duplicate samples. (c) w1118 flies were injected with buffer or 3.68 ng of purified α-actinin. Relative expression of TotM over a 48 hr period is shown. Data are representative of two independent experiments with 10 flies/sample with triplicate samples. (d) Purified actin was subjected to mass spectrometry analysis and contaminating proteins are expressed as % of protein preparation. (e) Indicated protein amounts (ng) of purified actin and α-actinin were analysed by western blot using an anti-α-actinin antibody. Data are representative of three independent experiments. (f) w1118 flies were injected with preparations containing the indicated number of molecules of rabbit muscle purified actin or purified α-actinin. Relative expression of TotM 24 hr post injection is shown. Data are representative of three independent experiments with 10 flies/sample with duplicate samples. TotM relative levels were calculated using the housekeeping gene Rp49 as a reference gene. Bars represent mean ± SD.
Figure 2 with 1 supplement
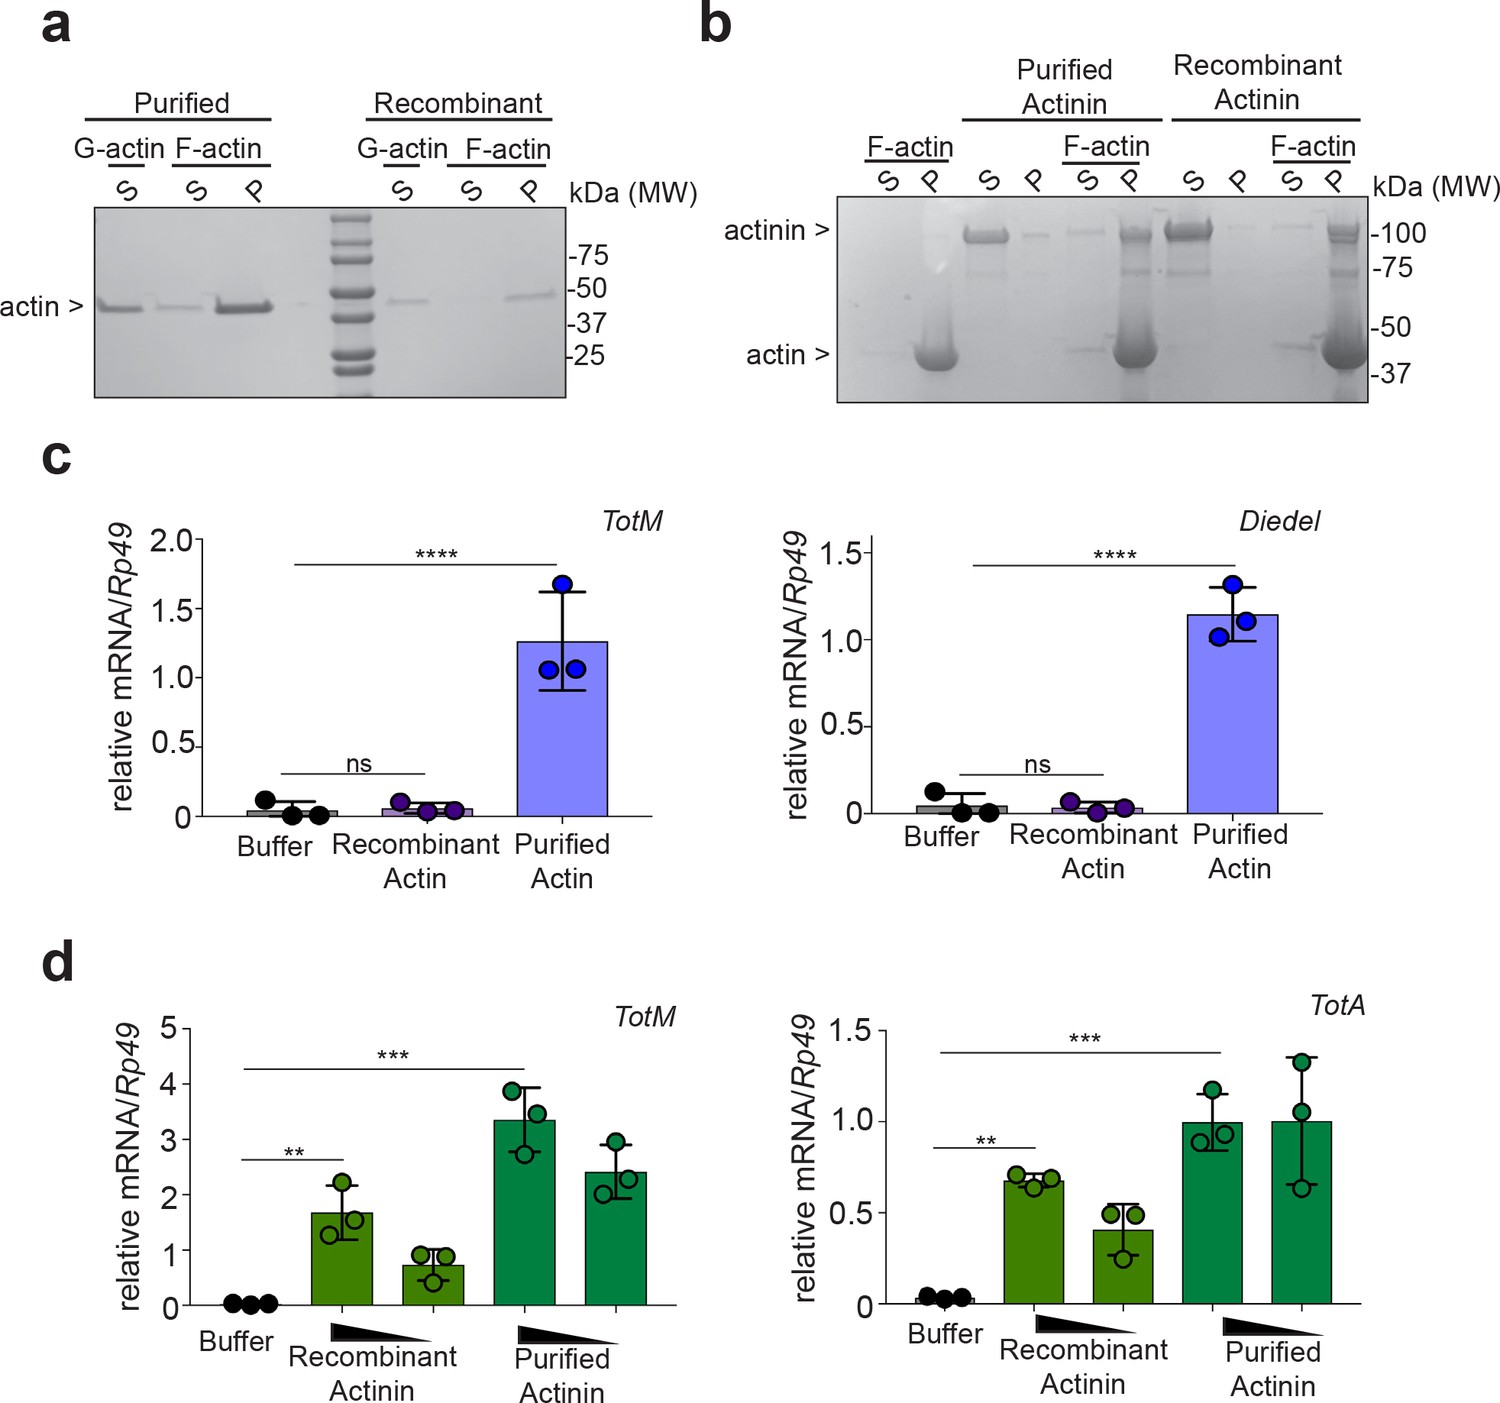
Bacterially-expressed recombinant α-actinin but not actin induces STAT-responsive genes.
(a) Actin purified from rabbit muscle or recombinantly made in bacteria was incubated in either G-actin or F-actin buffers before subjecting samples to ultracentrifugation to separate globular and filamentous actin. Supernatant (S) and pelleted (P) fractions were analysed by Tris-Gylcine gels and visualized by Coomassie staining. Data are representative of two independent experiments. (b) α-actinin from rabbit muscle or recombinantly made in bacteria was added or not to polymerised F-actin. Then, samples were subjected to ultracentrifugation, and proteins in the supernatant (S) or pellet (P) were analysed by Tris-Gylcine gels and visualized by cCoomassie staining. (c) w1118 flies were injected with PBS buffer or equal amounts of bacterially-expressed recombinant or rabbit muscle purified actin (11.04 ng per fly). Relative expression of TotM and Diedel 24 hr post injection is shown. Data are representative of two independent experiments with 10 flies/sample with triplicate samples. (d) w1118 flies were injected with PBS buffer, or equal amounts of bacterially-expressed recombinant or rabbit muscle purified α-actinin (3680 pg or 368 pg per fly). Relative expression of TotM and TotA 24 hr post injection is shown. Data are representative of two independent experiments with 10 flies/sample with triplicate samples. TotM relative levels were calculated using the housekeeping gene Rp49 as a reference gene. Bars represent mean ± SD. Statistical analysis was performed using one-way ANOVA with Sidak’s multiple comparison test as post-test for pairwise comparisons. Significant differences with Sidak’s multiple comparison test are shown (ns, not significant; *p<0.05; **p<0.01; ***p<0.001; ****p<0.0001).
Figure 2—figure supplement 1
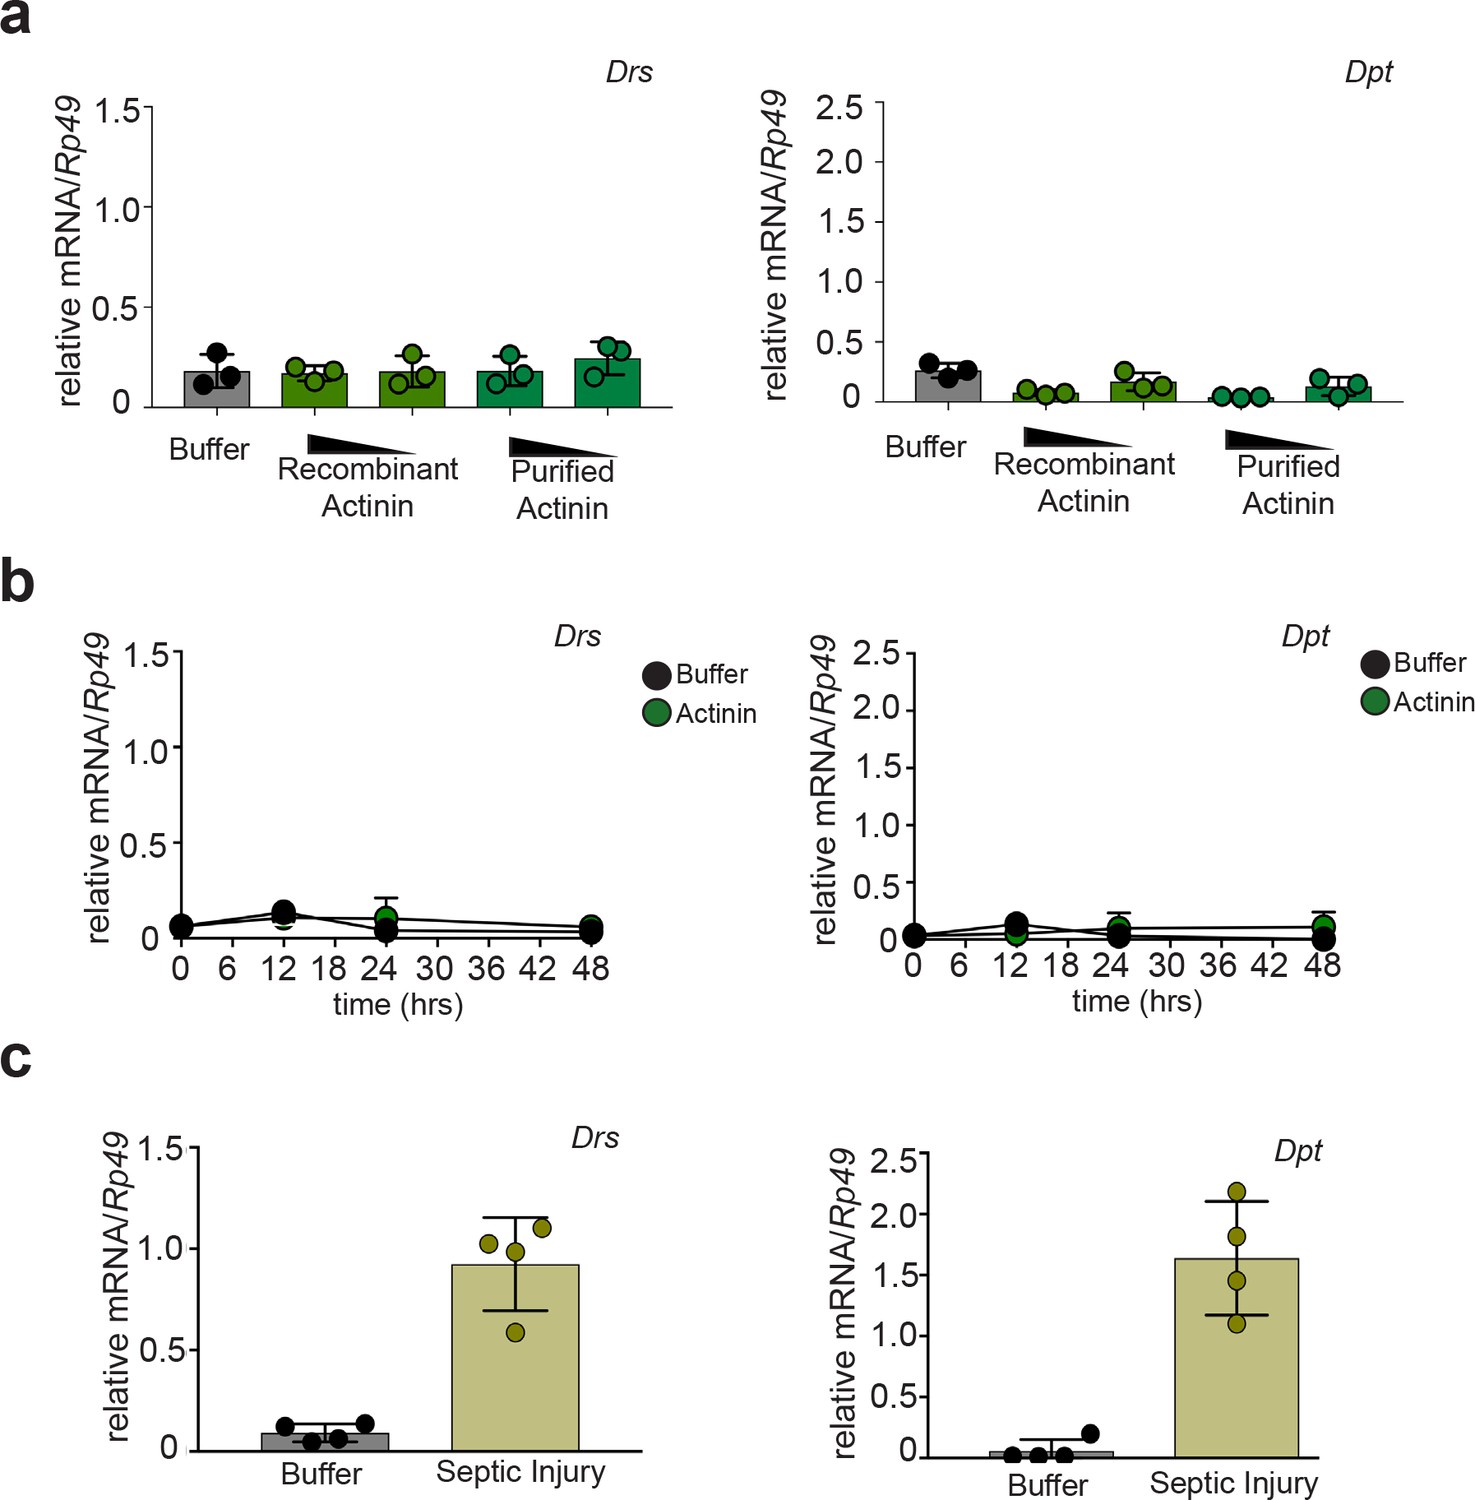
Bacterially-expressed recombinant or rabbit muscle purified α-actinin do not induce the expression of antimicrobial genes.
(a) w1118 flies were injected with PBS buffer, or equal amounts of bacterially-expressed recombinant or rabbit muscle purified α-actinin (3.68 ng or 368 pg per fly). Relative expression of Drosomycin (Drs) and Diptericin (Dpt) 24 hr post injection is shown. Data are representative of two independent experiments with 10 flies/sample with triplicate samples. (b) w1118 flies were injected with PBS buffer or 3.68 ng rabbit muscle purified α-actinin and relative expression of Drs and Dpt monitored over a 48 hr timeframe. (c) w1118 flies were subjected to injury with a fine needle that was either previously dipped in PBS (buffer) or a concentrated mixture of M. luteus and E. coli (septic injury). Relative expression of Drs and Dpt 24 hr after injury is shown. Data are representative of two independent experiments with 10 flies/sample with quadruplicate samples. Drs and Dpt relative levels were calculated using the housekeeping gene Rp49 as a reference gene. Bars represent mean ± SD.
Figure 3
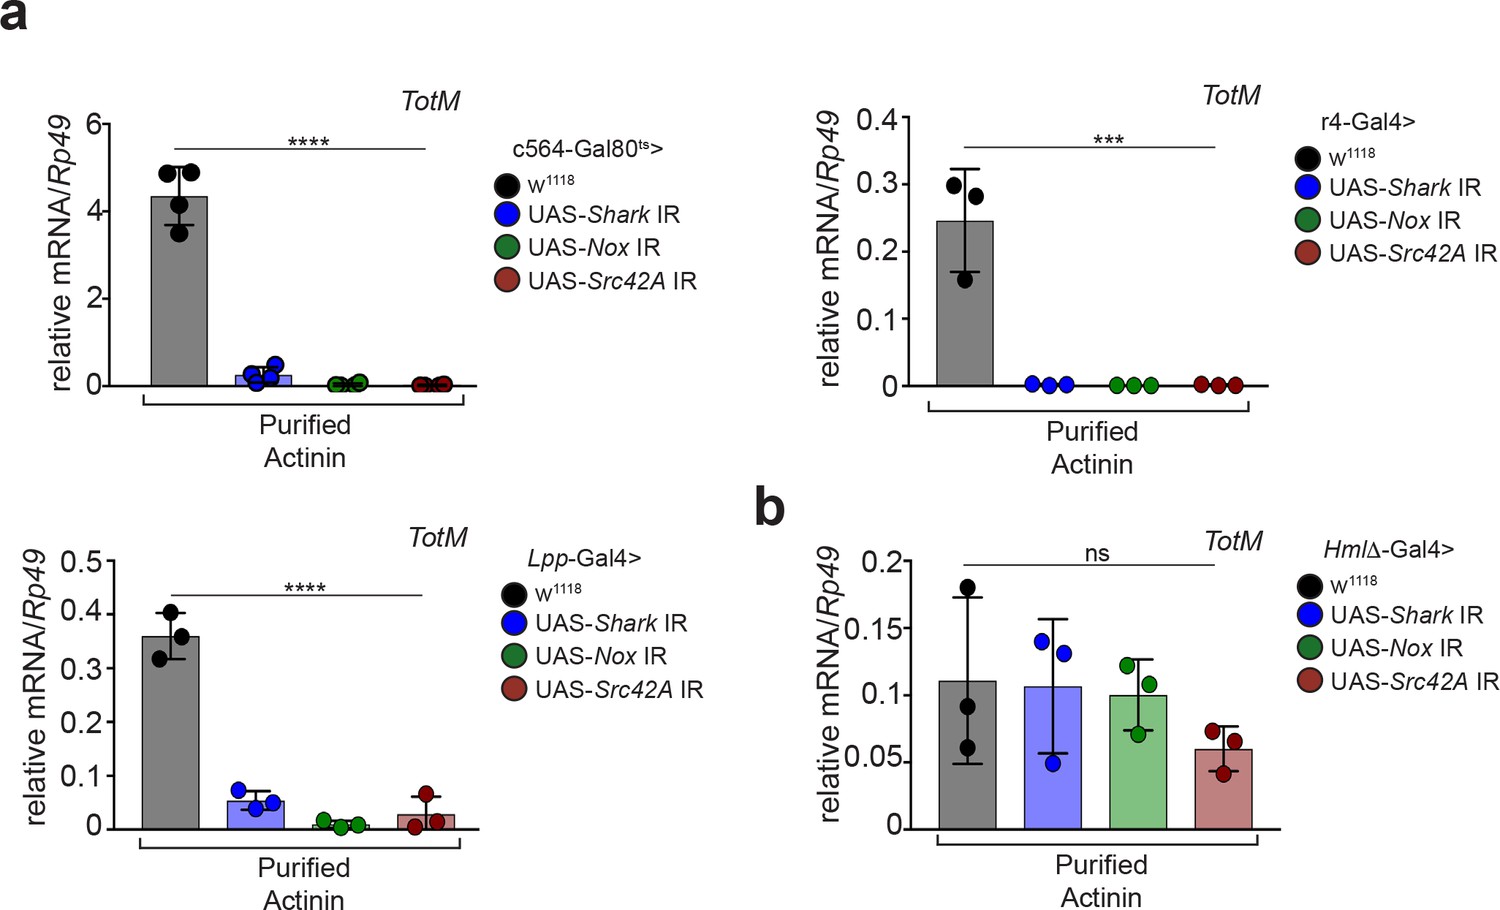
α-actinin induced STAT-dependent genes require Nox, Shark and Src42A expression in the fat body.
(a) Flies in which Shark, Nox, or Src42A were knocked down in the fat body using three different driver lines (c564-Gal80ts, r4-Gal4 or Lpp-Gal4), or control flies lacking UAS-target sequences, were injected with either PBS buffer or rabbit muscle purified α-actinin (13.8 pg per fly). Relative expression of TotM 24 hr post injection is shown. Data are representative of two independent experiments with 5 – 10 flies/sample with at least triplicate samples. (b) Flies in which Shark, Nox, or Src42A were knocked down in haemocytes (HmlΔ-Gal4), or control flies lacking UAS-target sequences, were injected with either PBS buffer or rabbit muscle purified α-actinin (13.8 pg per fly). Relative expression of TotM 24 hr post injection is shown. Data are representative of two independent experiments with 5 – 10 flies/sample with triplicate samples. TotM relative levels were calculated using the housekeeping gene Rp49 as a reference gene. Bars represent mean ± SD. Statistical analysis was performed using one-way ANOVA with Sidak’s multiple comparison test as post-test for pairwise comparisons. Significant differences with Sidak’s multiple comparison test are shown (ns, not significant; *p<0.05; **p<0.01; ***p<0.001; ****p<0.0001).
Author response image 1
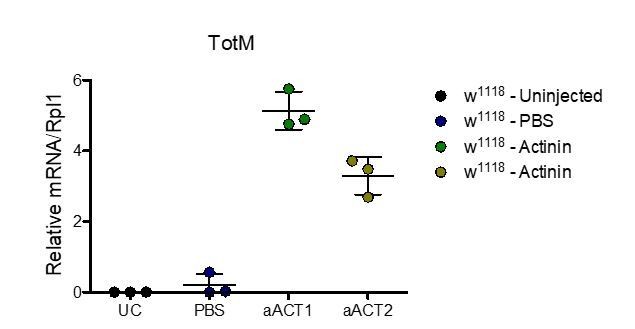
Injection experiment performed in the Dionne lab.
Relative expression of TotM 18hr post injection. Data are representative of two independent experiments with 3 flies/sample. Relative levels of expression were calculated using the housekeeping gene Rlp1 as a reference gene. Bars represent mean ± SD.
Author response image 2
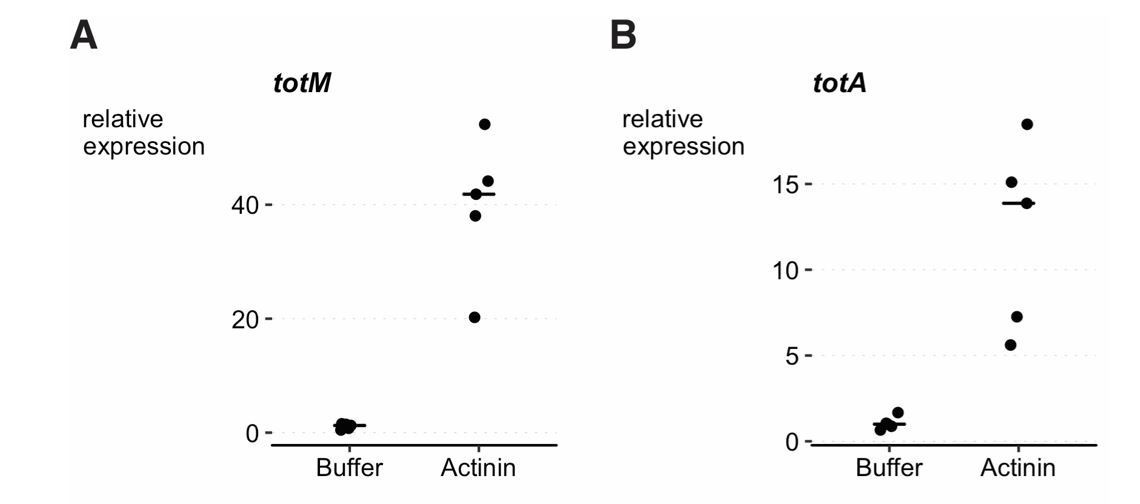
Injection experiment performed in the Teixeira lab.
3-6 day old w1118 DrosDel isogenic (Ryder et al., 2004; Chrostek et al., 2013) females were injected with 36.8nL of either buffer (4mM Tris-HCL pH 7.6, 4mM NaCl, 20µM EDTA, 1% (w/v) sucrose and 2% w/v dextran) or α–Actinin in buffer (1μg/μl, Cytoskeleton, #027AT01-A). Flies were collected 24h post infection and RNA extracted from 5 pools of 10 flies per condition, using tripleXtractor reagent (GRiSP, # GB23.0200) followed by DNase treatment (Promega, #M6101). cDNA synthesis was performed with M-MLV Reverse Transcriptase (Promega, #M1705) and Random Primers (Promega, #C1181). cDNA was diluted ten times in DEPC water (Invitrogen, #46-2224) and analysed for gene expression by qPCR using iTaq Universal SYBR Green Supermix (Bio-rad, #1725125). Reactions were carried out using a QuantStudio 7 Flex machine. Relative expression ratios of TotM (A) and TotA (B) were calculated with the Pfaffl method (Pfaffl, 2001), using Rp49 as reference gene and buffer injected flies as control values. TotM and TotA expression is induced by Actinin (linear mixed model, p < 0.001).
Additional files
-
Transparent reporting form
- https://doi.org/10.7554/eLife.38636.007
Download links
A two-part list of links to download the article, or parts of the article, in various formats.
Downloads (link to download the article as PDF)
Open citations (links to open the citations from this article in various online reference manager services)
Cite this article (links to download the citations from this article in formats compatible with various reference manager tools)
α-actinin accounts for the bioactivity of actin preparations in inducing STAT target genes in Drosophila melanogaster
eLife 7:e38636.
https://doi.org/10.7554/eLife.38636


