Predicting mutational routes to new adaptive phenotypes
- Massey University at Albany, New Zealand
- Umeå University, Sweden
- Santa Fe Institute, United States
- Max Planck Institute for Evolutionary Biology, Germany
- CNRS UMR 8231, PSL Research University, France
Figures
Figure 1

The Pseudomonas fluorescens SBW25 wrinkly spreader model.
(A) Selection for access to oxygen allows wrinkly spreader (WS) mutants to invade the ancestral smooth (SM) population in static microcosms. WS mutants form a mat at the air-liquid interface through increased expression of the main structural component, cellulose, encoded by the wss operon. Expression of cellulose is controlled by the second messenger c-di-GMP, which is produced by diguanylate cyclases (DGCs). Mutations in the wsp, aws and mws operons, that activate their respective DGCs (WspR, AwsR, MwsR), are the primary mutational pathways to WS. (B) When a reporter construct connecting expression of the wss operon to resistance to kanamycin is used under shaken non-selective conditions, WS mutants can be isolated without the biasing influence of natural selection. This allows estimation of the mutation rate to WS and an unbiased spectrum of mutations defining the mutational target. Fitness can then be assayed in competition with a common reference strain.
Figure 2
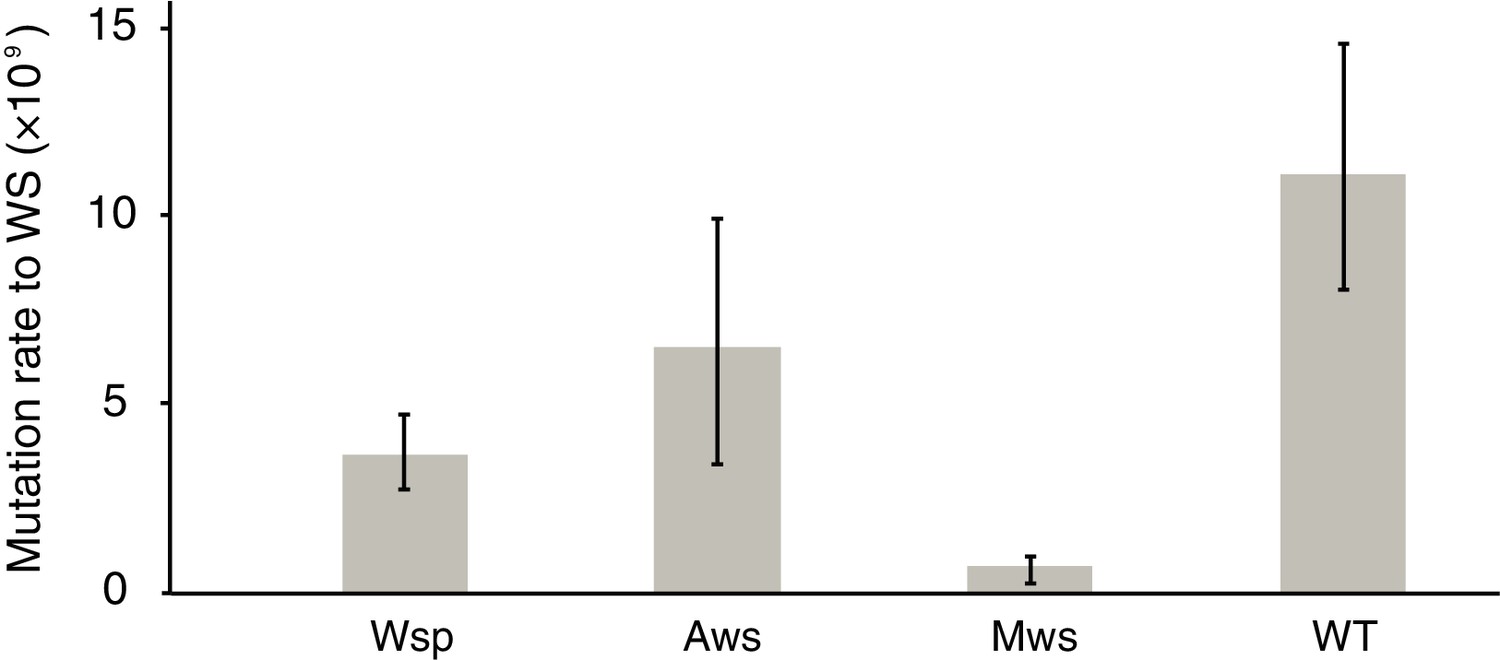
Mutation rates to WS.
Fluctuation tests were used to estimate the mutation rate to WS for the three common mutational pathways to WS. Error bars represent mean and 95% confidence intervals. All mutation rates are significantly different from all others (t-test p<0.05, see Materials and method section for details). Number of replicates n = 200 for Aws and Wsp, n = 400 for Mws, n = 100 for WT.
Figure 3
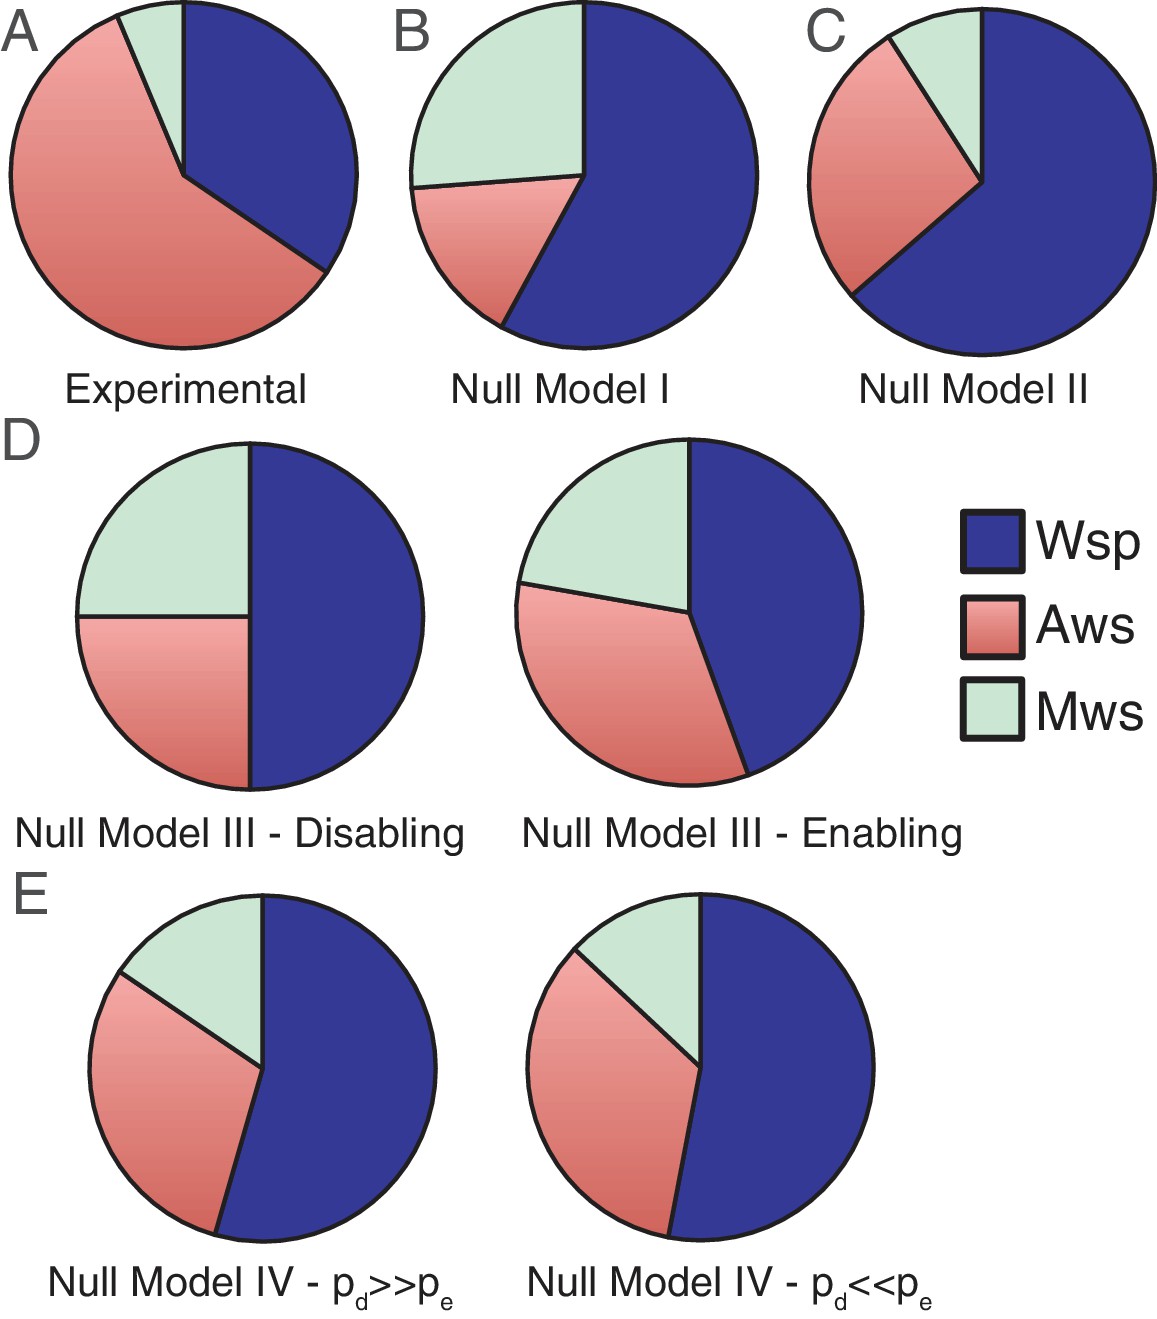
Comparisons of experimental data and null model predictions for the use of the Wsp, Aws and Mws pathways.
(A) Experimental data from Figure 2. (B) Null Model I: number of base pairs as proxy for mutational target size. (C) Null Model II: number of genes as a proxy for mutational target size. (D) Null Model III: function and interactions between components determine mutational target size. To indicate the range of possible states we consider the situation with enabling mutations only (left hand panel) and disabling mutations only (right hand panel). (E) Null Model IV: as per null Model III, but interactions have both pleiotropic and continuous effects. To indicate the range of possible states we consider the probability of disabling mutational effects (pd) to be 10 times more common than enabling changes (pe), pd = 0.001, pe = 0.0001 (left hand panel) the probability of enabling mutational effects (pe) to be 10 times more common than disabling changes (pd), pd = 0.0001, pe = 0.001.
Figure 4 with 3 supplements
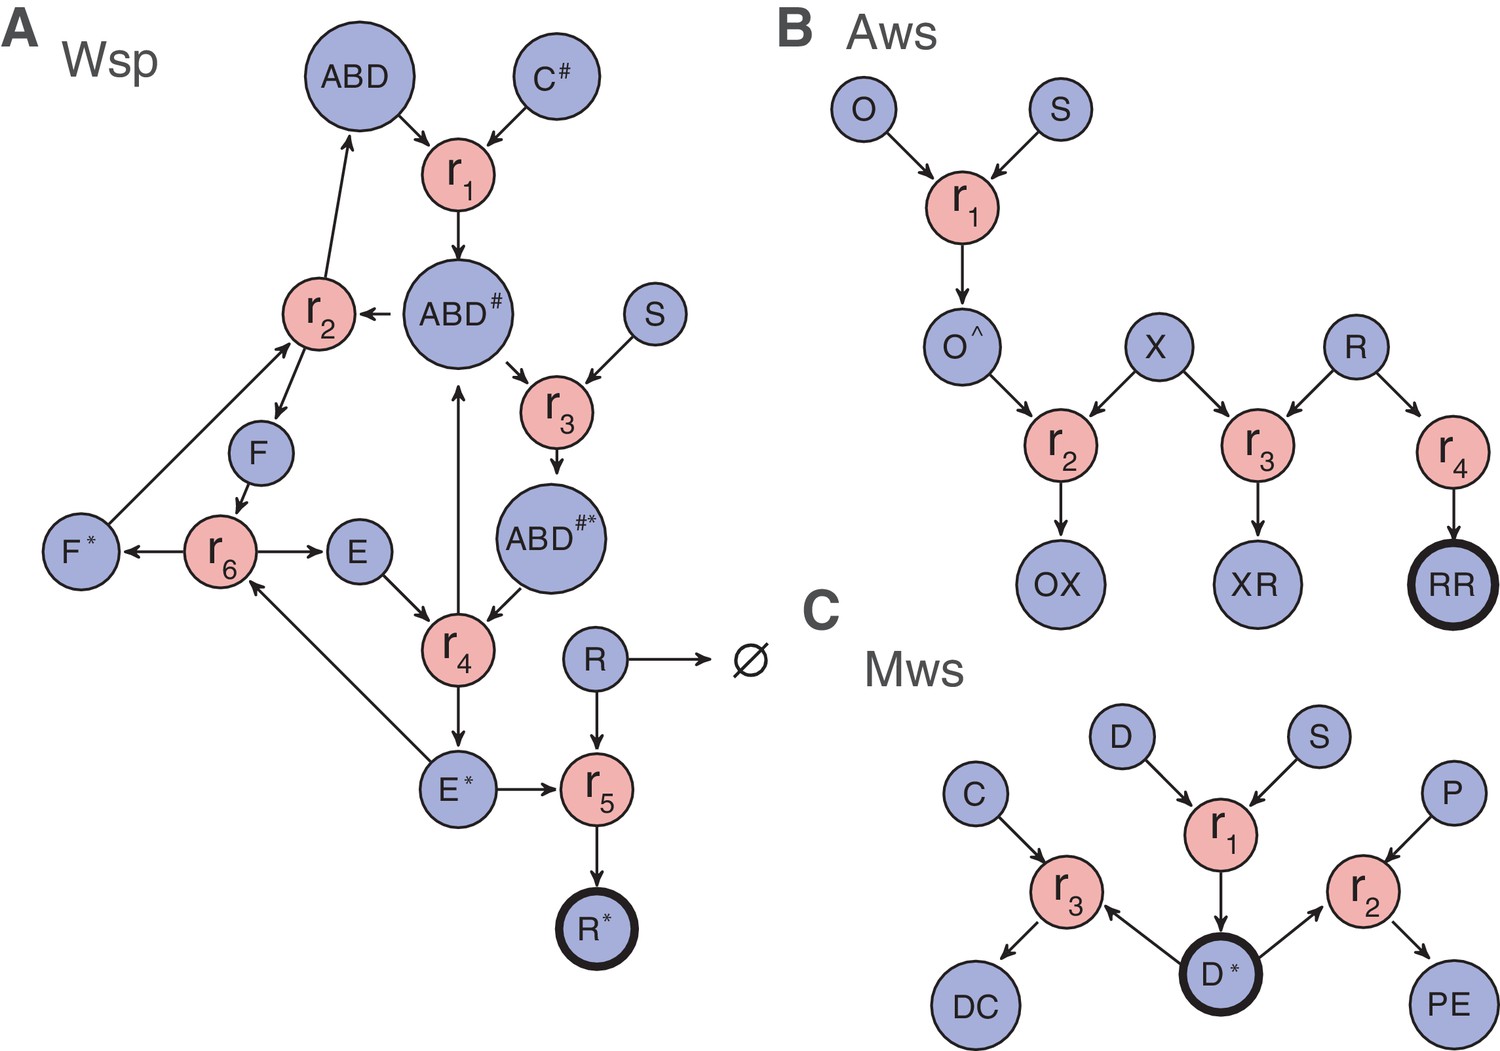
Reaction diagrams for null models III and IV.
Reaction diagrams show the interactions governing production of a wrinkly spreader in (A) Wsp, (B) Aws and (C) Mws pathways. The blue circles indicate molecular components, the red circles indicate reactions, and arrows indicate which molecular components are reactants and which are products. Full descriptions of the models including all reactions and the resulting systems of differential equations are found in Figure 4—figure supplement 1 for Wsp, Figure 4—figure supplement 2 for Aws and Figure 4—figure supplement 3 for Mws. The black edged circles are the reporter proteins, which is the activated forms of the diguanylate cyclases that directly determine whether a pathway generates a wrinkly spreader. Increased production of any reporter leads to increased c-di-GMP concentration causing increased cellulose production and thereby a wrinkly spreader.
Figure 4—figure supplement 1
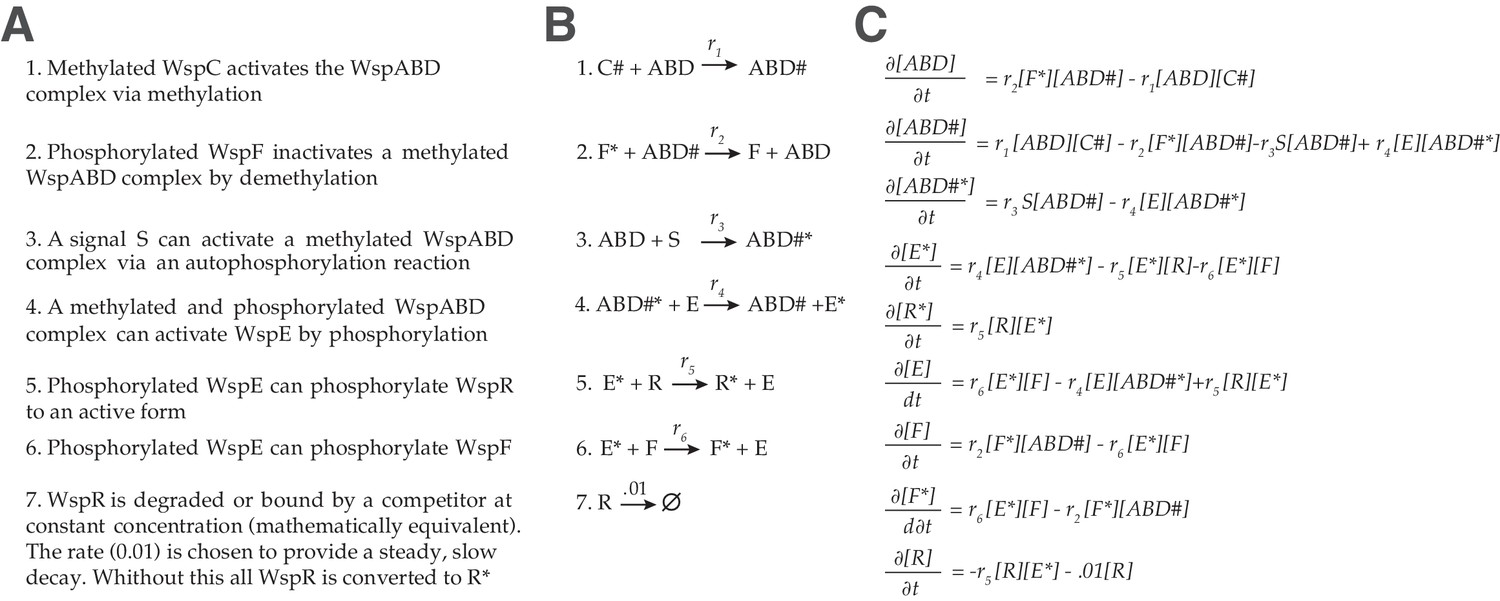
Wsp model.
(A) Description of functional interactions (B) Description of molecular reaction (C) Differential equations describing the dynamics of the Wsp pathway.The activity of WspA is modulated by methylation, where it is activated by the CheR-like methyltransferase WspC (PFLU1221). The CheB-like methylesterase WspF (PFLU1224) functions as a negative regulator. Modulation of WspR activity through changes in oligomerization state and clustering is not explicitly included in the model (De et al., 2008; Huangyutitham et al., 2013), but can be interpreted as changes in the rate of WspR activation.
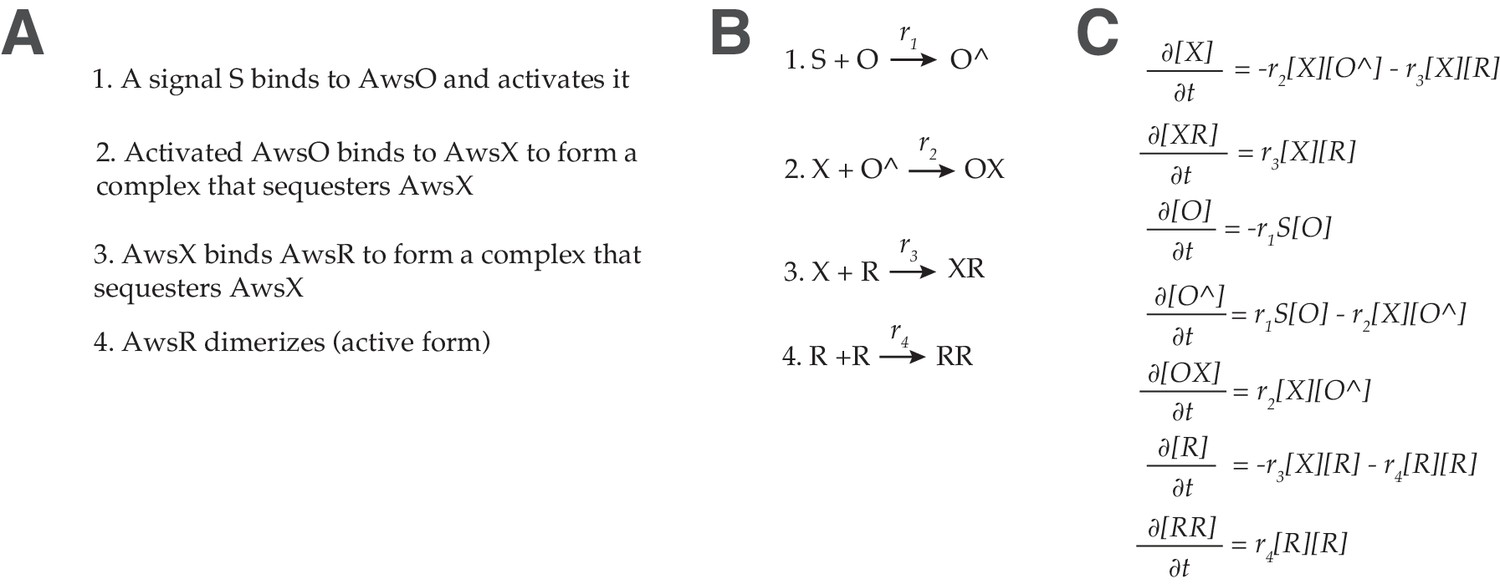
Figure 4—figure supplement 2
Aws model.
(A) Description of functional interactions (B) Description of molecular reaction (C) Differential equations describing the dynamics of the Aws pathway. Release of AwsX mediated repression results in a conformational shift that in the model is represented as formation of an active dimer.
Figure 4—figure supplement 3
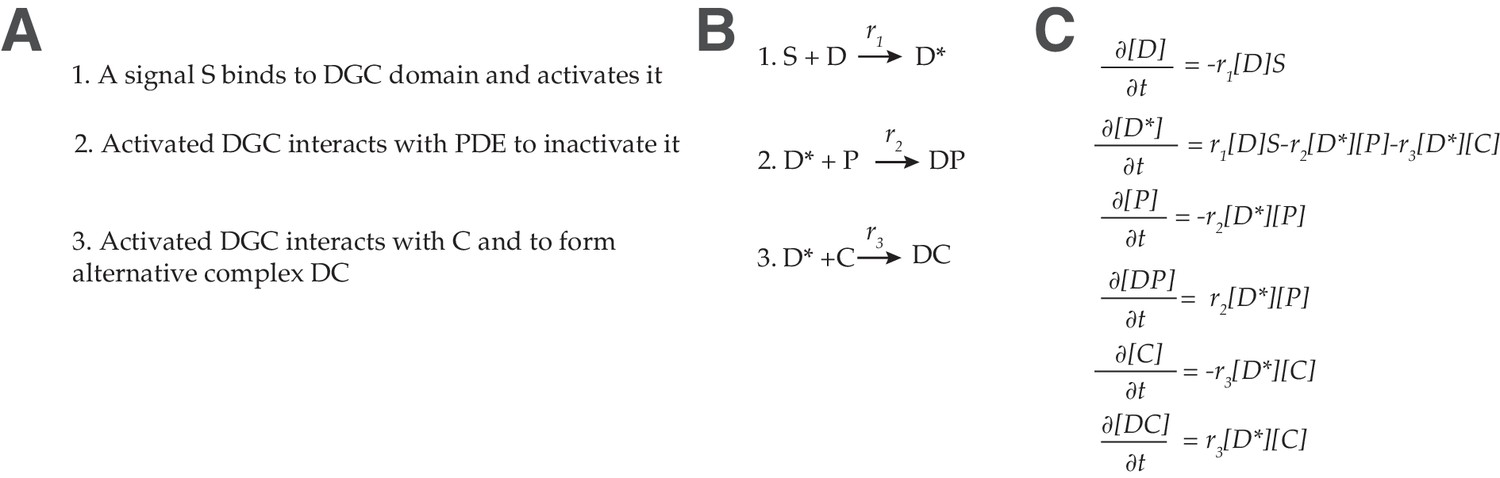
Mws model.
(A) Description of functional interactions (B) Description of molecular reactions (C) Differential equations describing the dynamics of the Aws pathway.
Figure 5 with 3 supplements
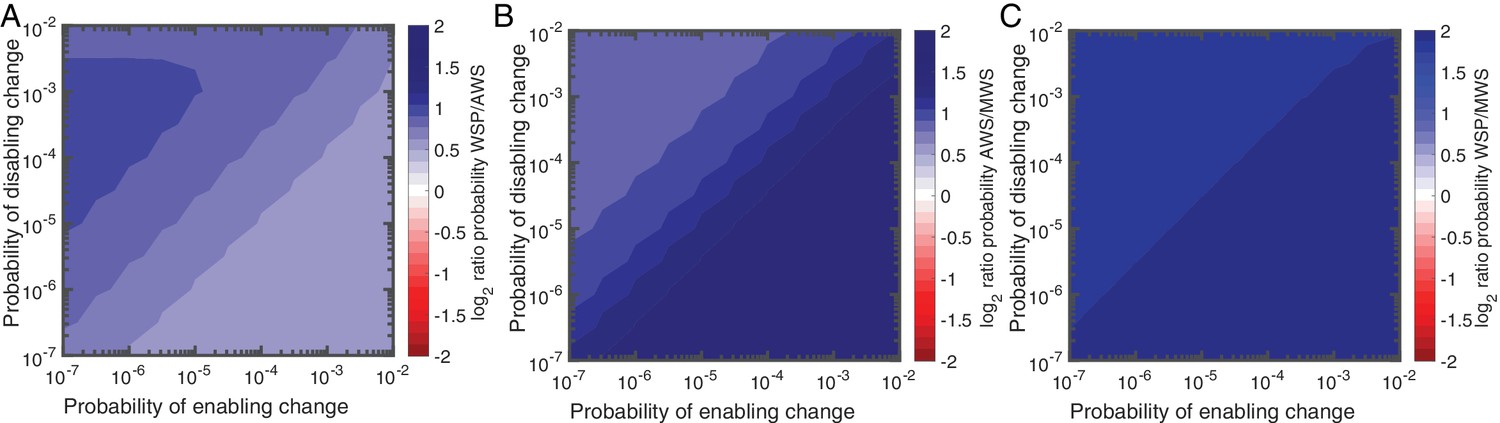
Null Model 4 predictions of the probability of using the Wsp, Aws and Mws pathways.
(A) Probability of Wsp relative to Aws. (B) Probability of Mws relative to Aws. (C) Probability of Mws relative to Wsp. The relative contributions of individual reactions rates are available in Figure 5—figure supplement 1 for Wsp and Figure 5—figure supplement 2 for Aws. Sensitivity analysis is shown in Figure 5—figure supplement 3.
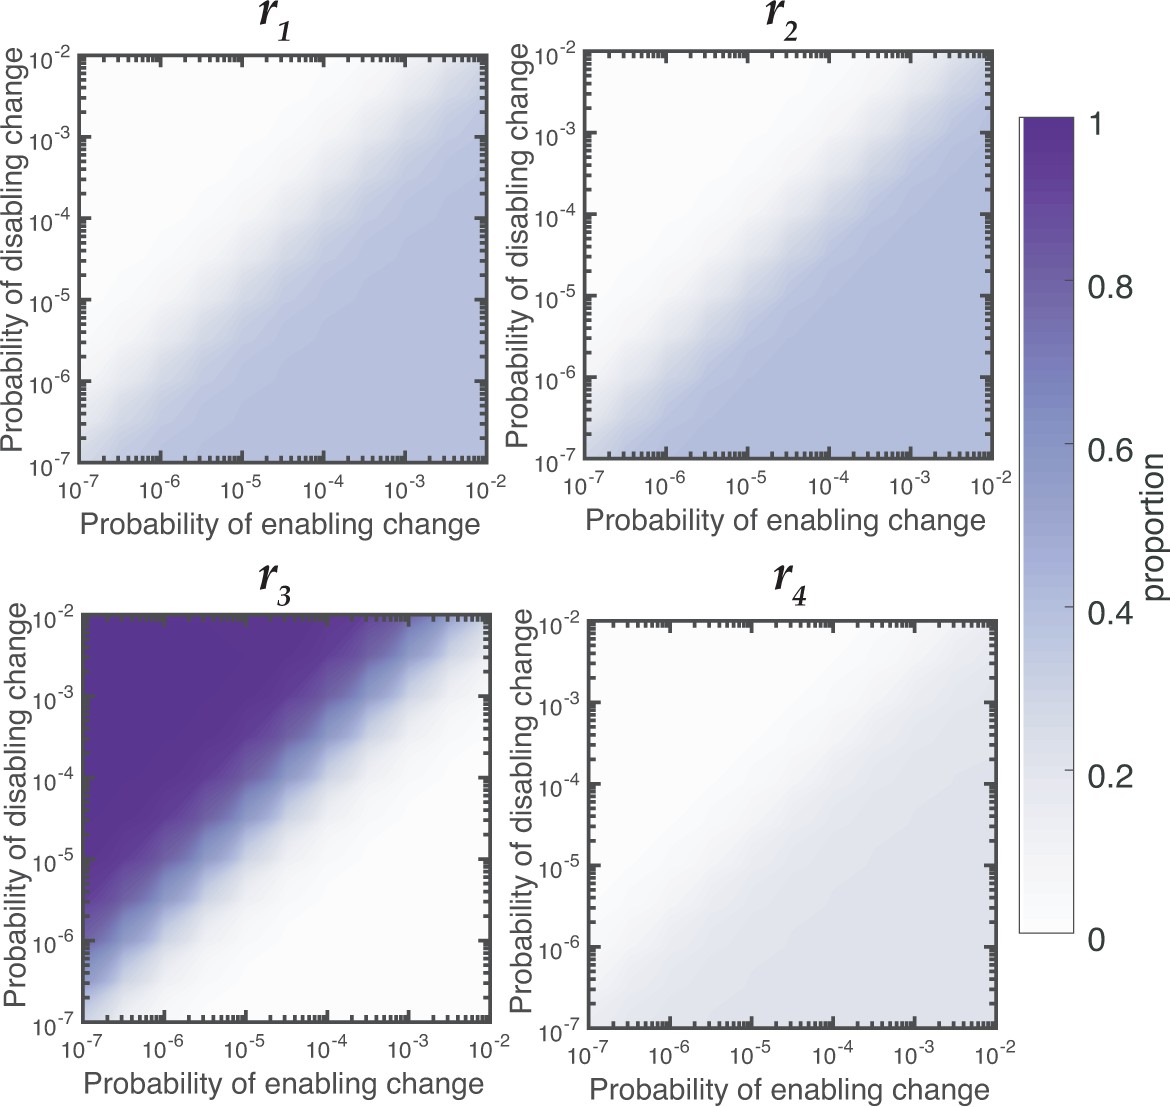
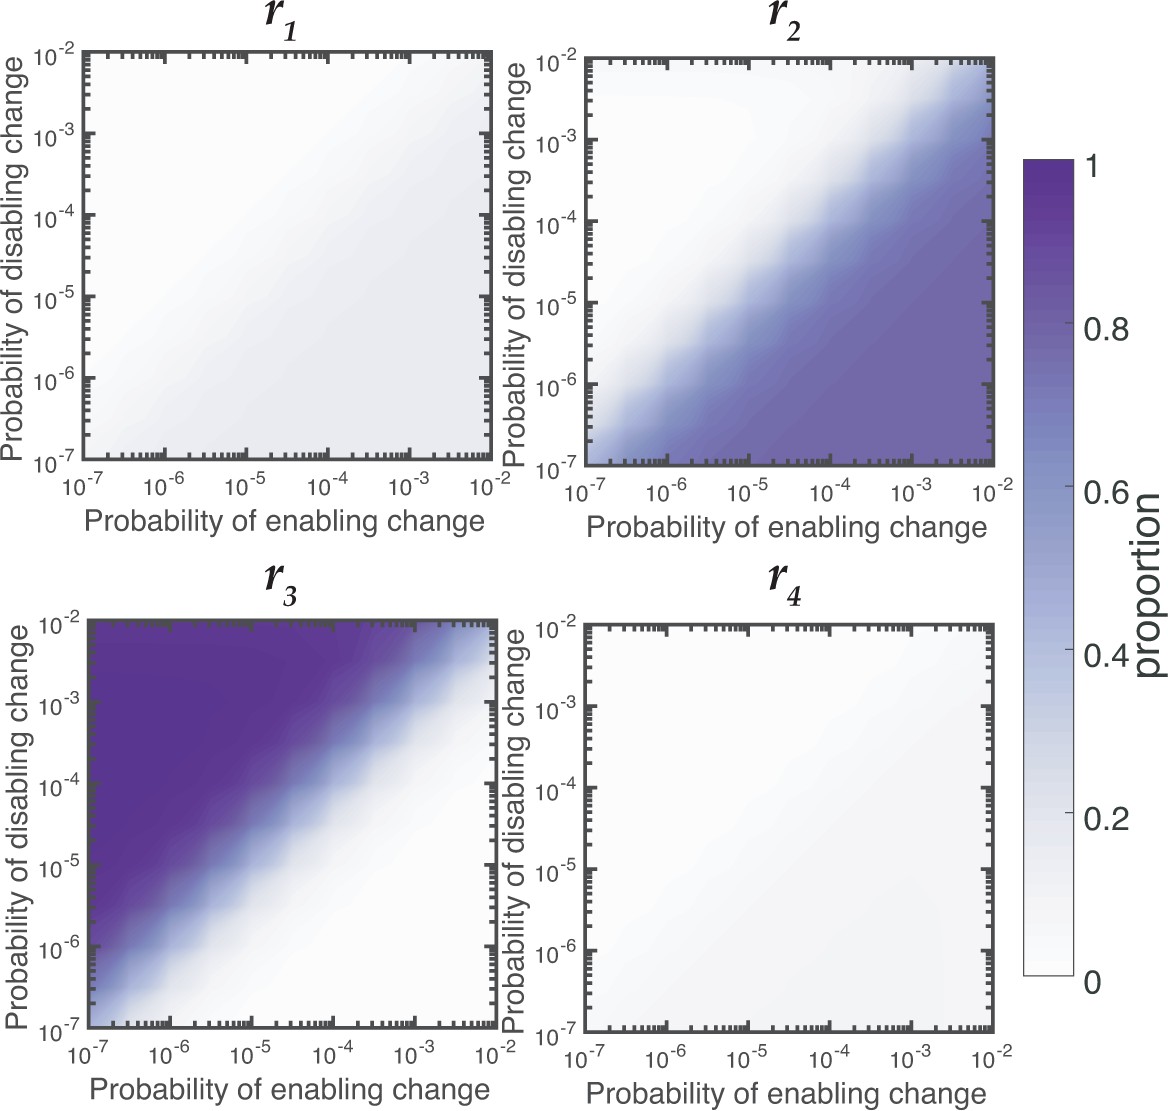
Figure 5—figure supplement 1
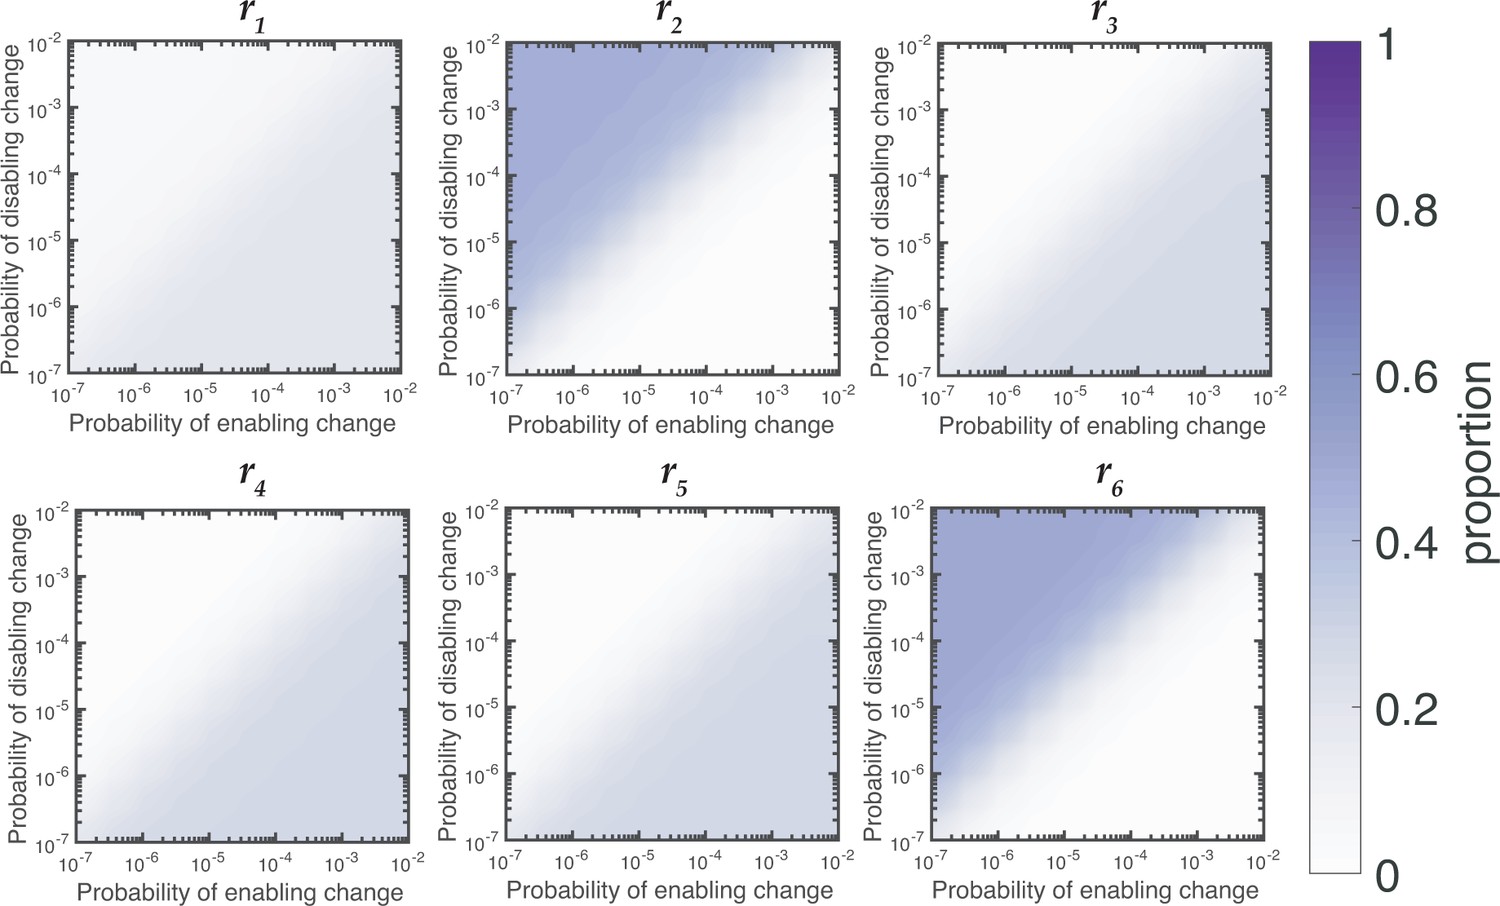
Relative contributions of reaction rates for Wsp for null Model IV.
Proportion of WS mutants that are produced by changes to each reaction rates is dependent on the rates of enabling and enabling mutations. When the rate of disabling mutations is much higher than the rate of enabling mutations the majority of WS mutations in Wsp are produced by changes to r2 and r6.
Figure 5—figure supplement 2
Relative contributions of reaction rates for Aws for null Model IV.
Proportion of WS mutants that are produced by changes to each reaction rates is dependent on the rates of enabling and enabling mutations. When the rate of disabling mutations is much higher than the rate of enabling mutations the majority of WS mutations in Wsp are produced by changes to r3.
Figure 5—figure supplement 3
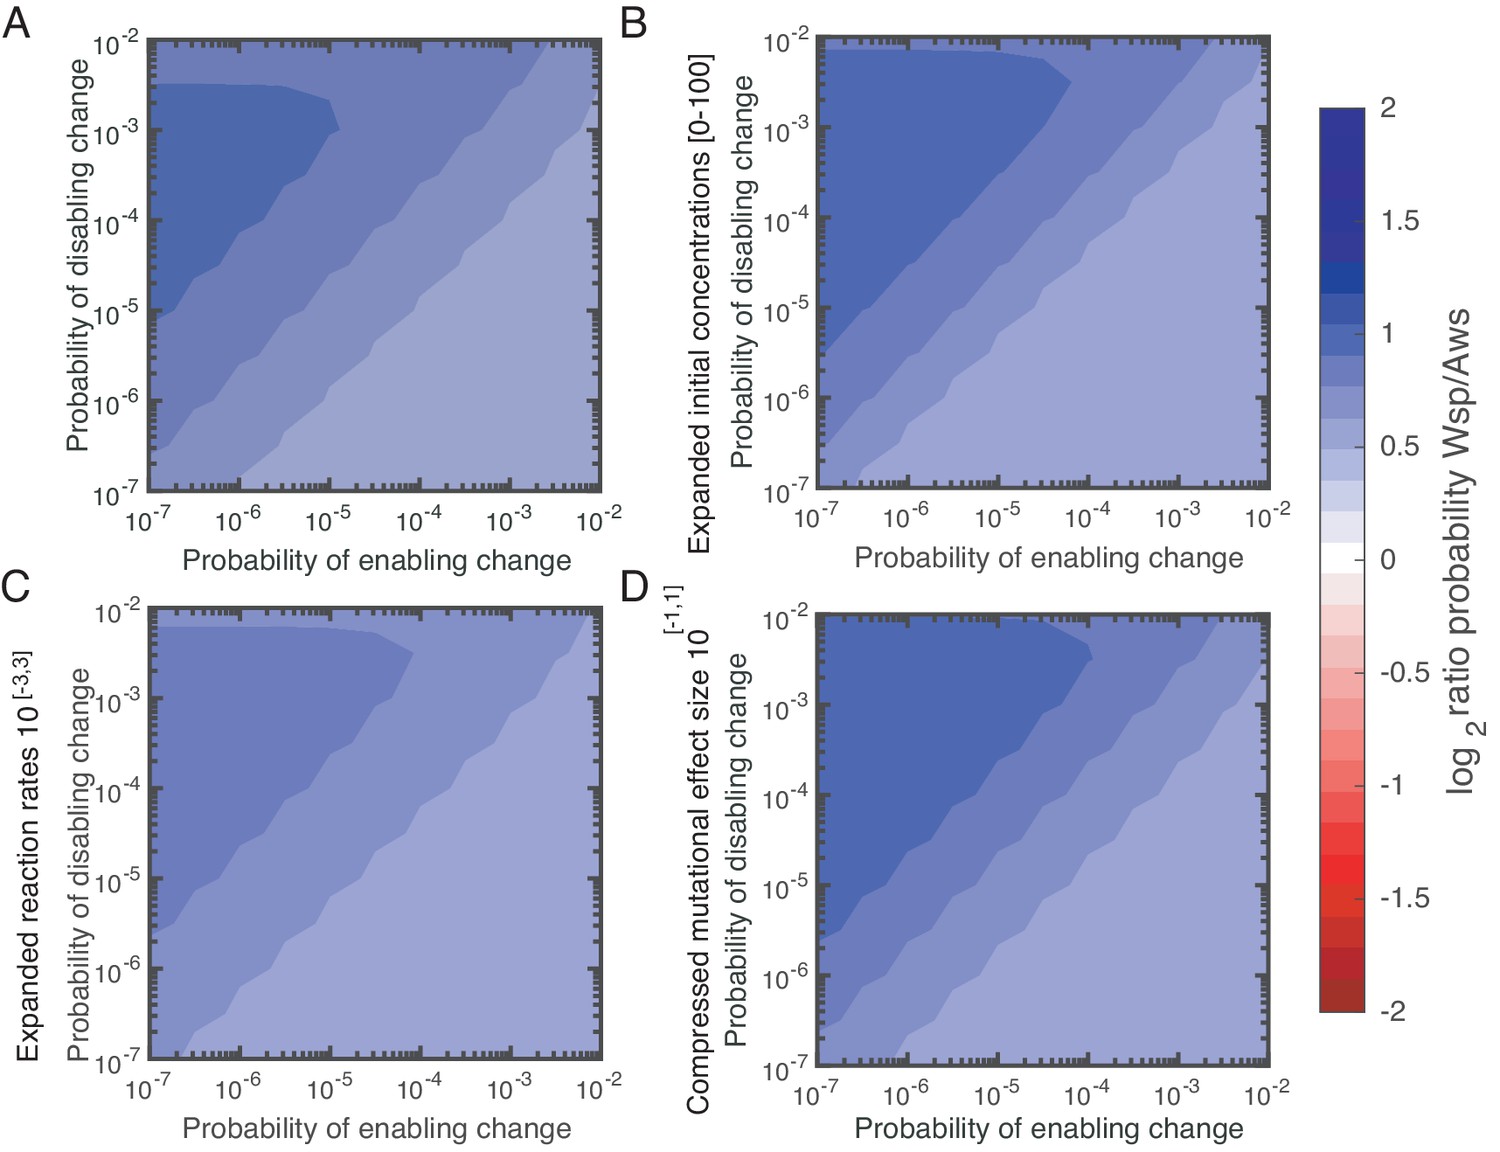
Parameter sensitivity analysis.
To assess the effect of the chosen parameter (A) ranges on our results, we redid our sampling procedure for WSP for three different parameter regimes: (B) an expanded range for initial concentrations [0–100], (C) an expanded range for reaction rates 10 [-3,3], (D) a compressed range for mutational effect size 10 [-1,1]. We found that our qualitative results are robust to these changes.
Figure 6
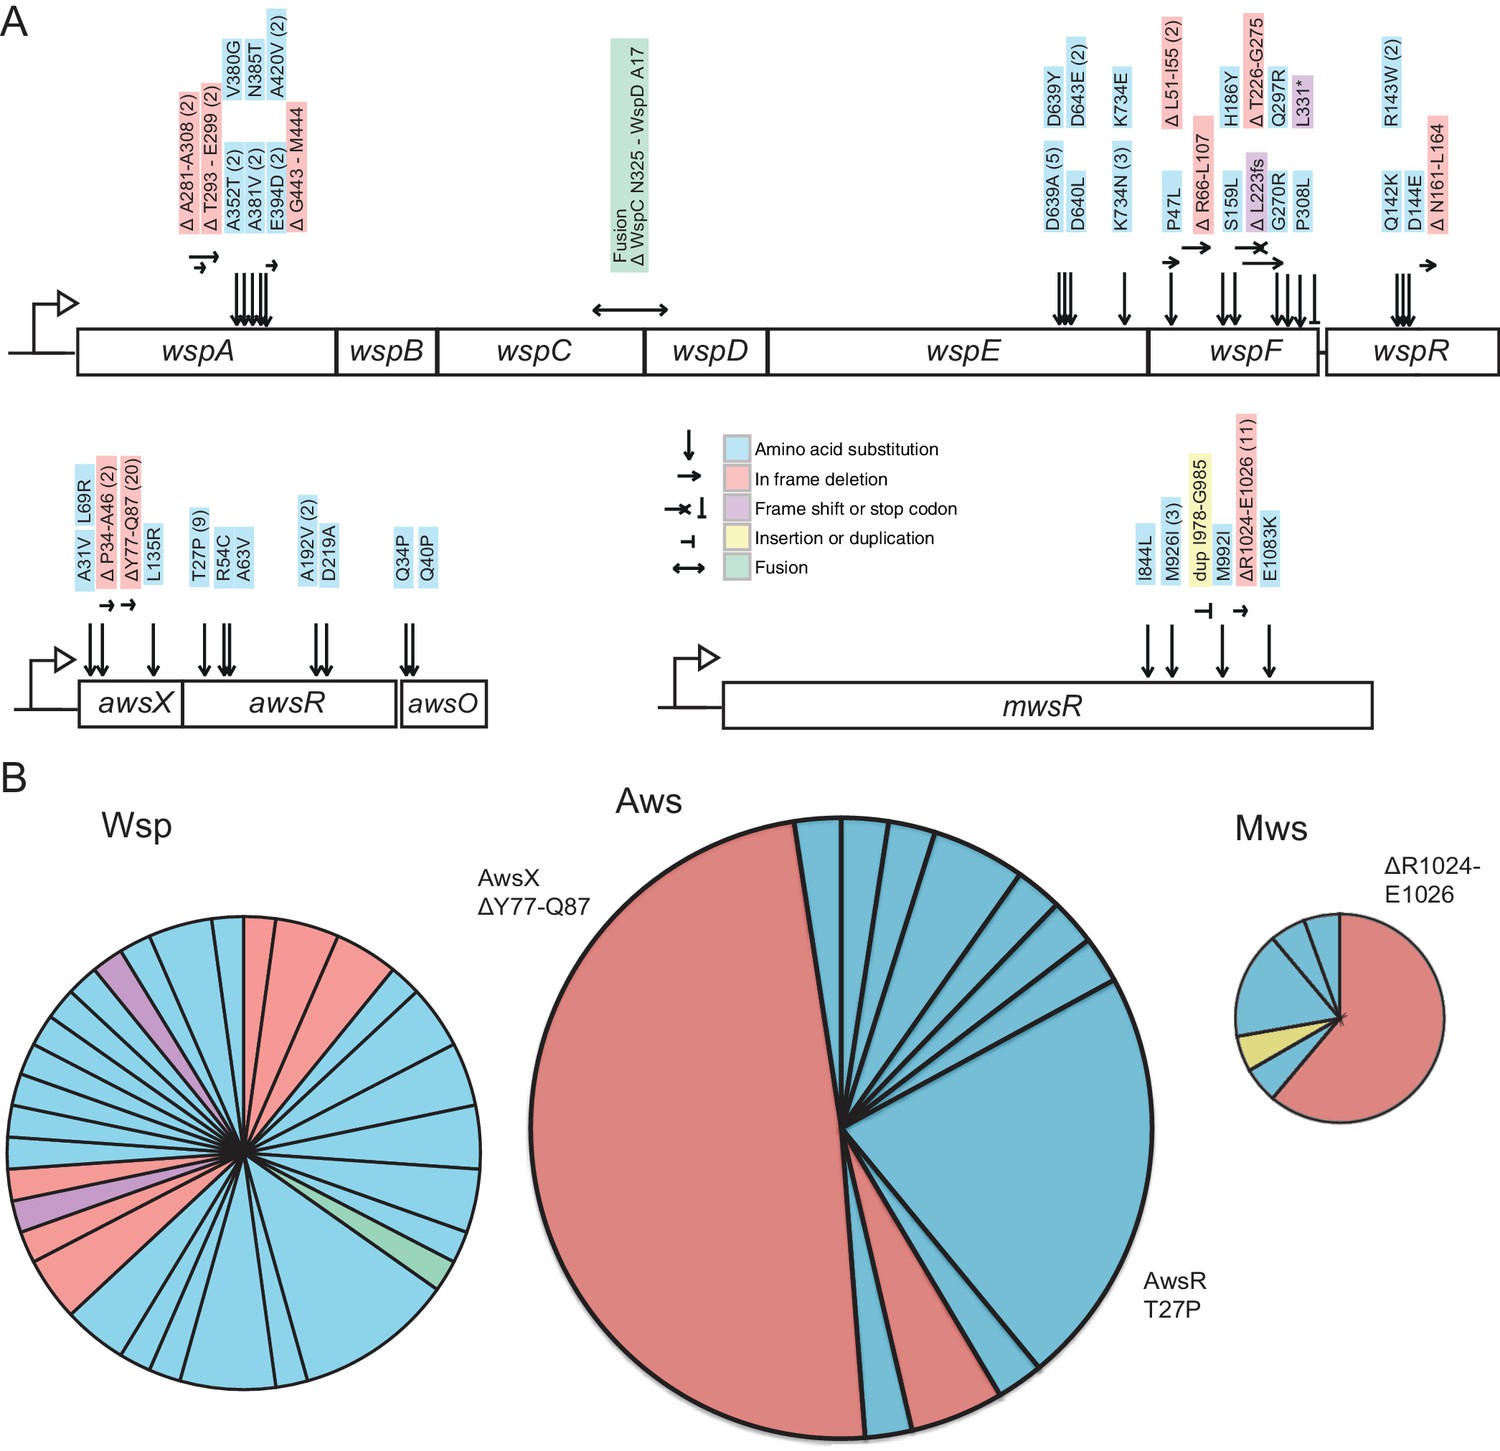
Mutational targets.
(A) 105 independent mutations in the wsp (n = 46), aws (n = 41) and mws (n = 18) operons were identified. Numbers of independent mutants are shown in brackets. Full details on the mutations are available in Figure 5—source data 1. (B) Diversity of mutations with area proportional to mutation rate (Figure 2). Two mutations (AwsX ΔY77-Q87 and AwsR T27P) contribute 41% of all mutations to WS suggesting that these are mutational hot spots.
-
Figure 6—source data 1
Table of all WS mutations in Wsp, Aws and Mws.
- https://doi.org/10.7554/eLife.38822.015
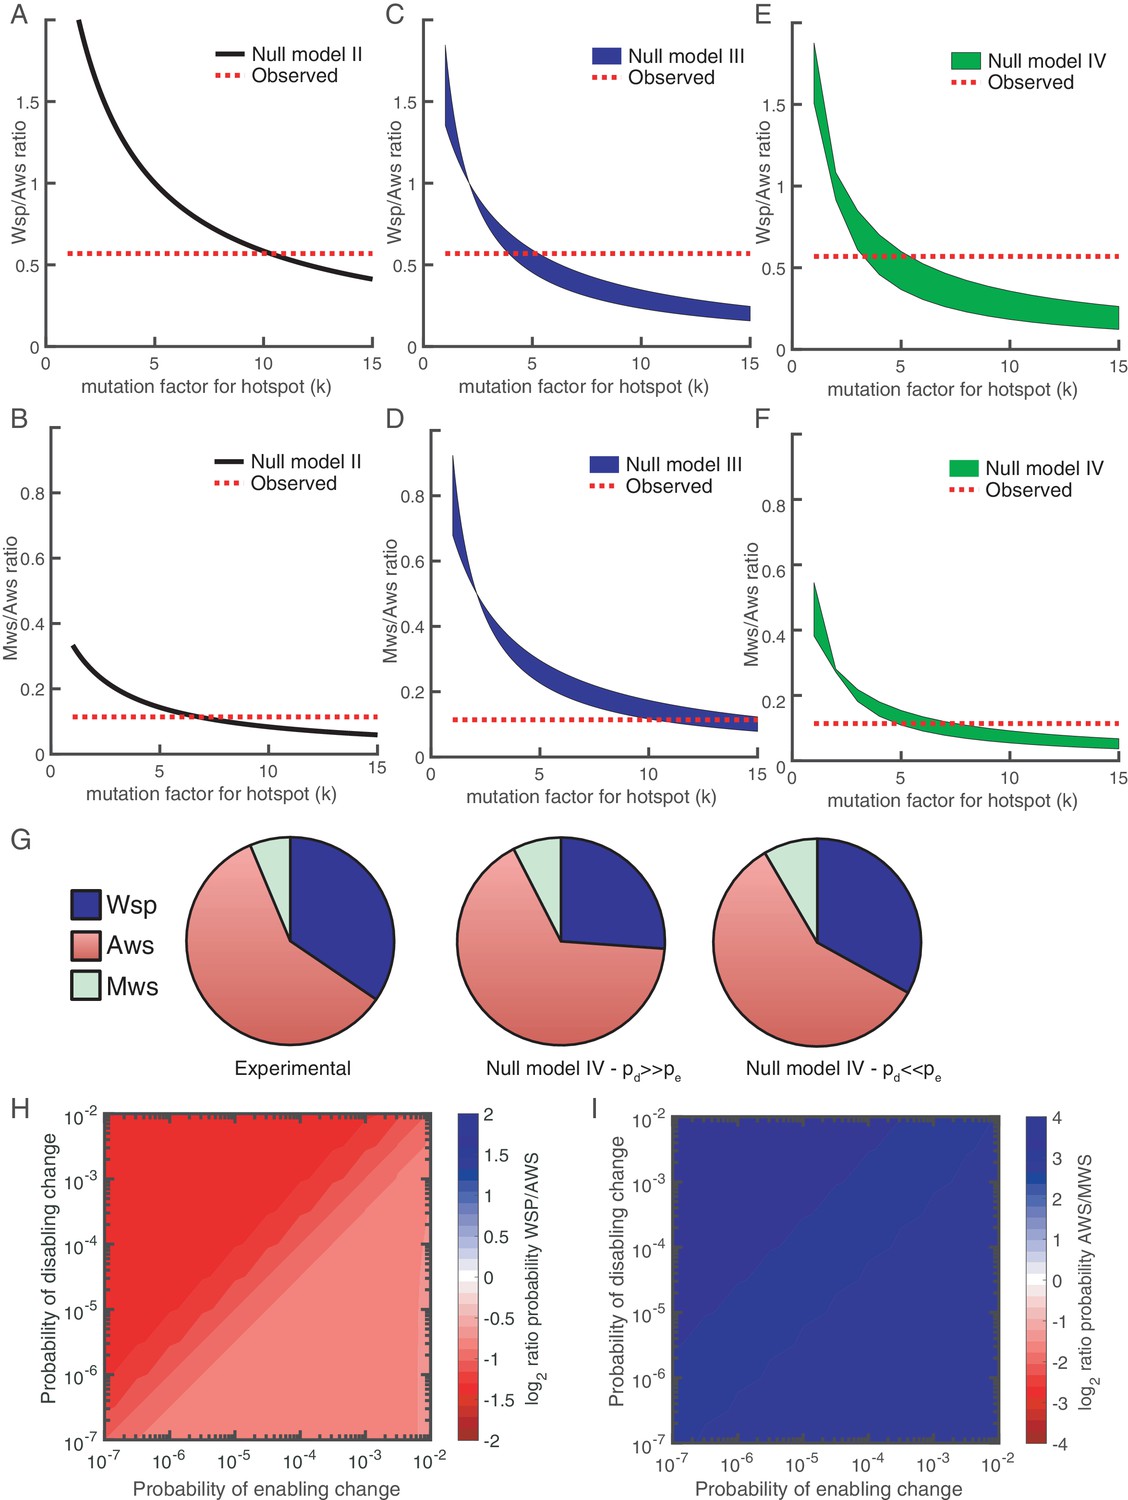
Figure 7 with 1 supplement
Revised models including mutational hot spot.
Null Models II (A, B), III (C, D) and IV (E, F) can be revised to take into account the mutational hot spot in AwsX by including a mutation factor (k). Each plot (A-F) shows the predicted ratios of Wsp/Aws or Aws/Mws compared to the experimental results (dashed red line). For null models III and IV a range is shown that depends on the probabilities of enabling (pe) and disabling (pd) changes. (G) Comparison of experimental data (left) and revised predictions from null model IV (middle, right), incorporating a five-fold increase in pe and pd for r2 and r3 in the Aws differential equation system. Middle pie chart use pd = 0.001, pe = 0.0001 and right pie chart pd = 0.0001, pe = 0.001 to allow comparison to Figure 3F and G. (H) Null Model IV predicted probability of Wsp relative to Aws with a hotspot in AwsX that increases the mutation rate five-fold for pe and pd for r2 and r3 in the Aws system of differential equation (I) Null Model IV predicted probability of Aws relative to Mws with a hotspot in AwsX that increase the mutation rate five-fold for pe and pd for r2 and r3 in the Aws system of differential equation. Figure 7—figure supplement 1 shows the relative contribution of each reaction rate in the Aws network to the production of WS for the revised null model IV with a 5 times increase for pe and pd for r2 and r3.
Figure 7—figure supplement 1
Relative contributions of reaction rates for Aws for null Model IV with a five-fold increase in mutation factor for r2 and r3.
Proportion of WS mutants that are produced by changes to each reaction rates is dependent on the rates of enabling and enabling mutations. When the rate of disabling mutations is much higher than the rate of enabling mutations the majority of WS mutations in Wsp are produced by changes to r3.
Figure 8
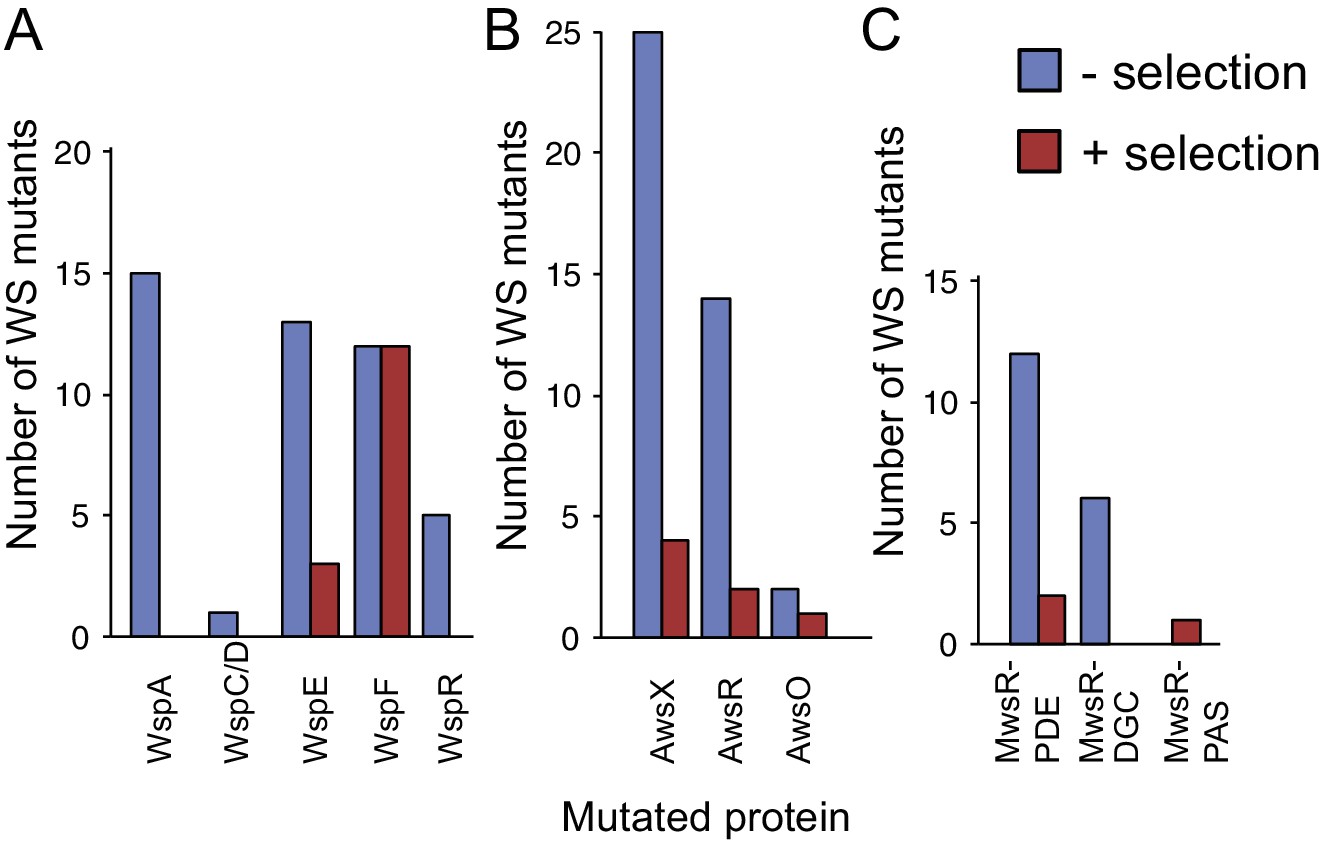
WS mutations isolated with and without selection.
(A) The mutational spectrum observed under selection suggests underrepresentation of WspA and WspR compared to WspF and WspE. (B) Similar fitness effects of different Aws mutants lead to similar patterns regardless of selective conditions. However the frequency of all Aws mutants isolated under selection is much lower than expected from its high mutation rate. (C) The low number of MwsR mutants isolated does not allow an analysis of relative rates. Only within operon comparisons are valid for this figure as the mutants isolated without selection had double deletions of the other operons. Between operon mutation rates are available in Figure 2.
Figure 9
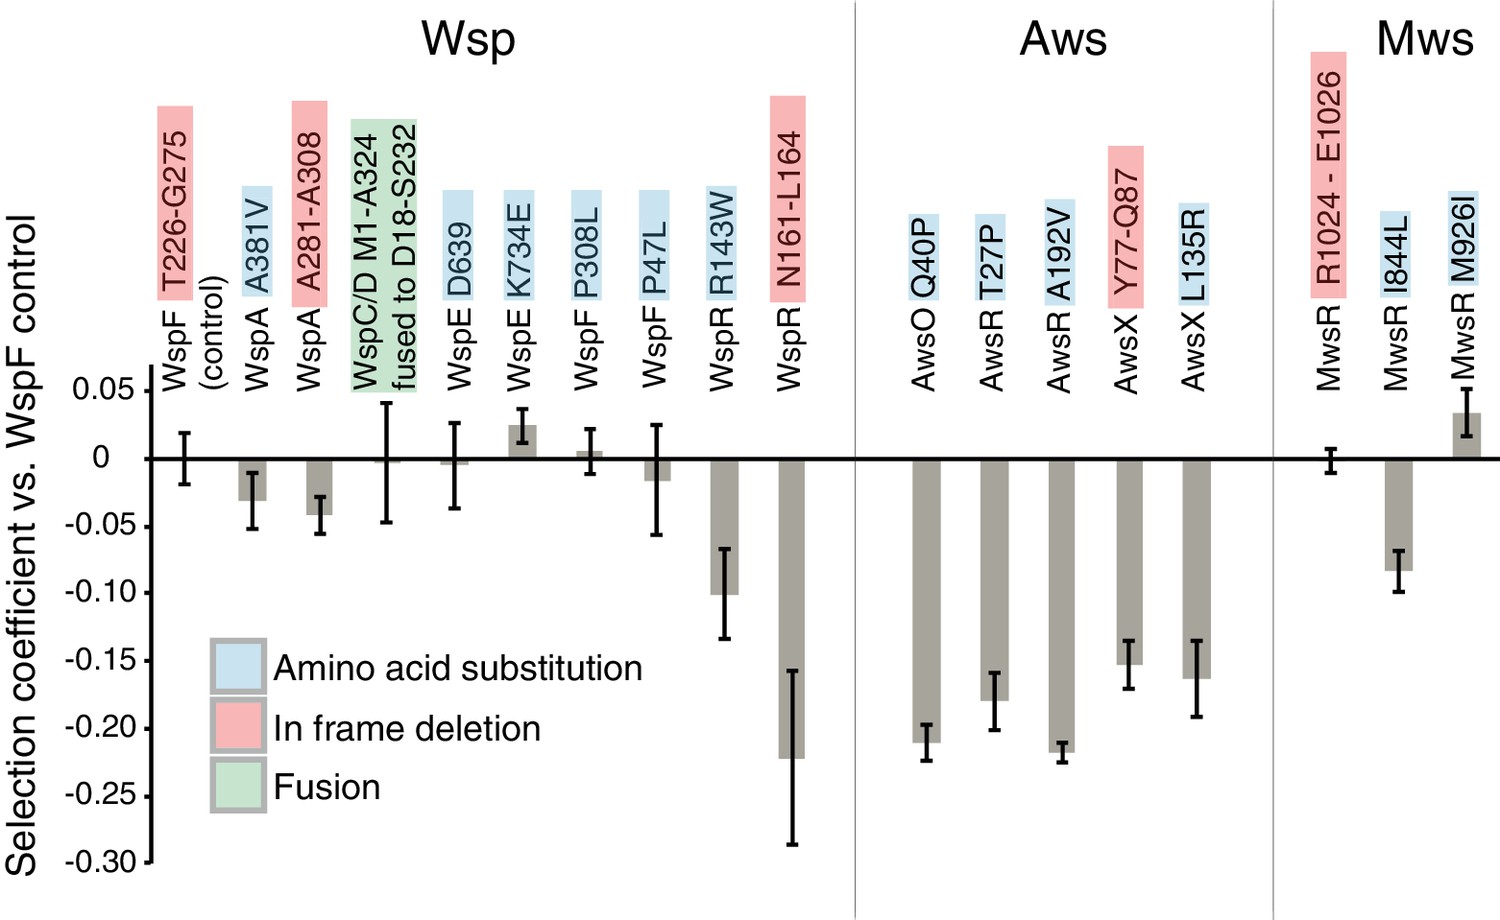
Fitness of different WS mutants.
Competitive fitness against a WspF ΔT226-G275 reference strain was measured for representative mutations in the Wsp, Aws, Mws pathways. Pairwise competitions were performed in quadruplicates and error bars represent ±one standard deviation. Full data, including statistical tests are available in Figure 9—source data 1.
-
Figure 9—source data 1
Data from fitness assay.
- https://doi.org/10.7554/eLife.38822.021
Tables
Table 1
Connection of mutational effects to reaction rates
https://doi.org/10.7554/eLife.38822.018| Protein | Mutation class | Proposed molecular effect | Proposed reaction rate effect | References |
|---|---|---|---|---|
| WspA | Amino acidsubstitutions 352–420 | Trimer-of-dimer formation, localisation of Wsp clusters,interaction with WspD | Increase r3 | (O'Connor et al., 2012; Griswold et al., 2002 ) |
| WspA | Deletions A281-A308 | Disrupt demethylation by WspF | Decrease r2 | (McDonald et al., 2009) |
| WspC/D | Fusion of WspC and WspD | Increased methylation byWspC, blocking access of WspF | Increase r1, decrease r2 | |
| WspE | Response regulatory domain phosphorylation site | Disrupt phosphorylation of WspF | Decrease r6 | Homology model |
| WspF | Any disabling mutation | Loss of negative regulation by WspF by demethylation of WspA | Decrease r2 | (Bantinaki et al., 2007; McDonald et al., 2009) |
| WspR | Amino acid substitutionsand small deletion inlinker region betweenresponse regulator and DGC domain | Constitutive activationof DGC withoutphosphorylation.Effects on subcellular clustering or multimeric state. | Increase r5 | (Goymer et al., 2006; De et al., 2009; Huangyutitham et al., 2013) |
| AwsX | In frame loss of function mutations | Loss of negative regulation of AwsR | Decrease r3 | (Malone et al., 2012) |
| AwsR | Amino acidsubstitutionstransmembranehelix, periplasmic domain | Disruption of interaction with AwsX | Decrease r3 | (Malone et al., 2012) |
| AwsR | Amino acid substitutionsHAMP linker domain | Changes in dimerization, packing of HAMP domainscausing constitutive activation | Increase r4 | (Parkinson, 2010; Malone et al., 2012) |
| AwsO | Amino acid substitutionsin between signal peptide and OmpA domain | Constitutive activation andsequestering of AwsX | Increase r2 | (McDonald et al., 2009; Malone et al., 2012; Xu et al., 2016) |
| MwsR | Amino acid substitutions and small in frame deletions in interfacebetween EAL and DGC domains | Changes to interdomain interaction or dimerization leading to constitutive activation of DGC function | Decrease r2, increase r1 | Homology model, (McDonald et al., 2009) |
| MwsR | Amino acid substitutionsnear DGC active site | Loss of feedback regulationor changes to interdomain interaction | Decrease r2, increase r1 | Homology model, (McDonald et al., 2009) |
Key resources table
| Reagent type (species) or resource | Designation | Source or reference | Identifiers | Additional information |
|---|---|---|---|---|
| Gene | wspA; PFLU1219 | NA | ||
| Gene | wspB; PFLU1220 | NA | ||
| Gene | wspC; PFLU1221 | NA | ||
| Gene | wspD; PFLU1222 | NA | ||
| Gene | wspE; PFLU1223 | NA | ||
| Gene | wspF; PFLU1224 | NA | ||
| Gene | wspR; PFLU1225 | NA | ||
| Gene | awsX; PFLU5211, yfiR | NA | ||
| Gene | awsR; PFLU5210, yfiN, tpbB | NA | ||
| Gene | awsO; PFLU5209, yfiB | NA | ||
| Gene | mwsR; PFLU5329, morA | NA | ||
| Gene | wss; PFLU0300-PFL0309 | NA | ||
| Strain, strainbackground | Pseudomonas fluorescens SBW25 | PMID: 19432983;PMID: 8830243 | ||
| Genetic reagent | PBR721; ∆aws ∆mws | PMID: 19704015 | ||
| Genetic reagent | PBR713; ∆wsp ∆mws | PMID: 19704015 | ||
| Genetic reagent | PBR712; ∆wsp ∆aws | PMID: 19704015 | ||
| Genetic reagent | WT with pMSC | PMID: 17377582 | ||
| Genetic reagent | PBR721 with pMSC | This work | Wsp pathway with pMSC | |
| Genetic reagent | PBR713 with pMSC | This work | Aws pathway with pMSC | |
| Genetic reagent | PBR712 with pMSC | This work | Mws pathway with pMSC | |
| Cell line | ||||
| Transfected construct | ||||
| Biological sample | ||||
| Antibody | ||||
| RecombinantDNA reagent | pMSC | PMID: 17377582 | ||
| Recombinant DNA reagent | mini-Tn7(Gm)PrrnB P1 gfp-a | PMID: 15186351 | ||
| Sequence-based reagent | PFLU1219_1294R | Sigma-Aldrich | agacactgcggactggatct | |
| Sequence-based reagent | PFLU1219_UF | Sigma-Aldrich | ttgcctgtggagcgttctat | |
| Sequence-based reagent | PFLU1219_1130F | Sigma-Aldrich | accaggtggtggtgaccat | |
| Sequence-based reagent | PFLU1220_DR | Sigma-Aldrich | gacgatcactgcttcgatca | |
| Sequence-based reagent | wspD1r | Sigma-Aldrich | gttgcgttccagggcgag | |
| Sequence-based reagent | PFLU1221_DR | Sigma-Aldrich | acttatcgccatggataccg | |
| Sequence-based reagent | PFLU1221_UF | Sigma-Aldrich | tggatcggtgtaaacgacct | |
| Sequence-based reagent | PFLU1223_1511F | Sigma-Aldrich | atgacatcgtgcaactggaa | |
| Sequence-based reagent | PFLU1223_DR | Sigma-Aldrich | caggtccatcaggatcaggt | |
| Sequence-based reagent | PFLU1223_841F | Sigma-Aldrich | cgcccaagtgttgtatgaca | |
| Sequence-based reagent | PFLU1223_DR | Sigma-Aldrich | caggtccatcaggatcaggt | |
| Sequence-based reagent | PFLU1224_160R | Sigma-Aldrich | tccatcaccggcatgatca | |
| Sequence-based reagent | PFLU1224_DR | Sigma-Aldrich | ttttcgtcggtcttgatgtc | |
| Sequence-based reagent | PFLU1224_UF | Sigma-Aldrich | aagccagtttccacgatgac | |
| Sequence-based reagent | PFLU1225_DR | Sigma-Aldrich | gtgagggtacaccgagccta | |
| Sequence-based reagent | PFLU1225_UF | Sigma-Aldrich | tgccaaatgaacatgacctc | |
| Sequence-based reagent | PFLU5329_1888F | Sigma-Aldrich | cgtggattgggtgttcaaga | |
| Sequence-based reagent | PFLU5329_3118R | Sigma-Aldrich | cggttggtaatagagcacga | |
| Sequence-based reagent | wspF-seqR | Sigma-Aldrich | ataacggtcggcttgatacg | |
| Sequence-based reagent | Aws11f | Sigma-Aldrich | gctggttcagcttgatcgaaccc | |
| Sequence-based reagent | Aws16r | Sigma-Aldrich | atggatgctgccgatggttc | |
| Sequence-based reagent | Aws7f | Sigma-Aldrich | gcaaactcaccgcggatgag | |
| Sequence-based reagent | Aor | Sigma-Aldrich | cccgtcgattctccgtgcgc | |
| Peptide, recombinantprotein | ||||
| Commercial assay or kit | ||||
| Chemicalcompound, drug | ||||
| Software, algorithm | Ma-Sandri-Sarkar MLE estimator | PMID: 19369502 | www.keshavsingh.org/protocols/FALCOR.html | |
| Software, algorithm | Julia v1.0 | https://julialang.org | ||
| Software, algorithm | Matlab 9.4 | |||
| Software, algorithm | Phyre2 | PMID: 25950237 | http://www.sbg.bio.ic.ac.uk/phyre2 | |
| Software,algorithm | Geneious 7.1 | https://www.geneious.com | ||
| Software, algorithm | FACSDiva 7.0 | BD Biosciences | ||
| Other |
Additional files
-
Supplementary file 1
Equations and source code.
- https://doi.org/10.7554/eLife.38822.022
-
Transparent reporting form
- https://doi.org/10.7554/eLife.38822.023
Download links
A two-part list of links to download the article, or parts of the article, in various formats.
Downloads (link to download the article as PDF)
Open citations (links to open the citations from this article in various online reference manager services)
Cite this article (links to download the citations from this article in formats compatible with various reference manager tools)
Predicting mutational routes to new adaptive phenotypes
eLife 8:e38822.
https://doi.org/10.7554/eLife.38822


