Reciprocal regulation among TRPV1 channels and phosphoinositide 3-kinase in response to nerve growth factor
- University of Washington, United States
- Seattle Children’s Research Institute, United States
Figures
Figure 1 with 4 supplements
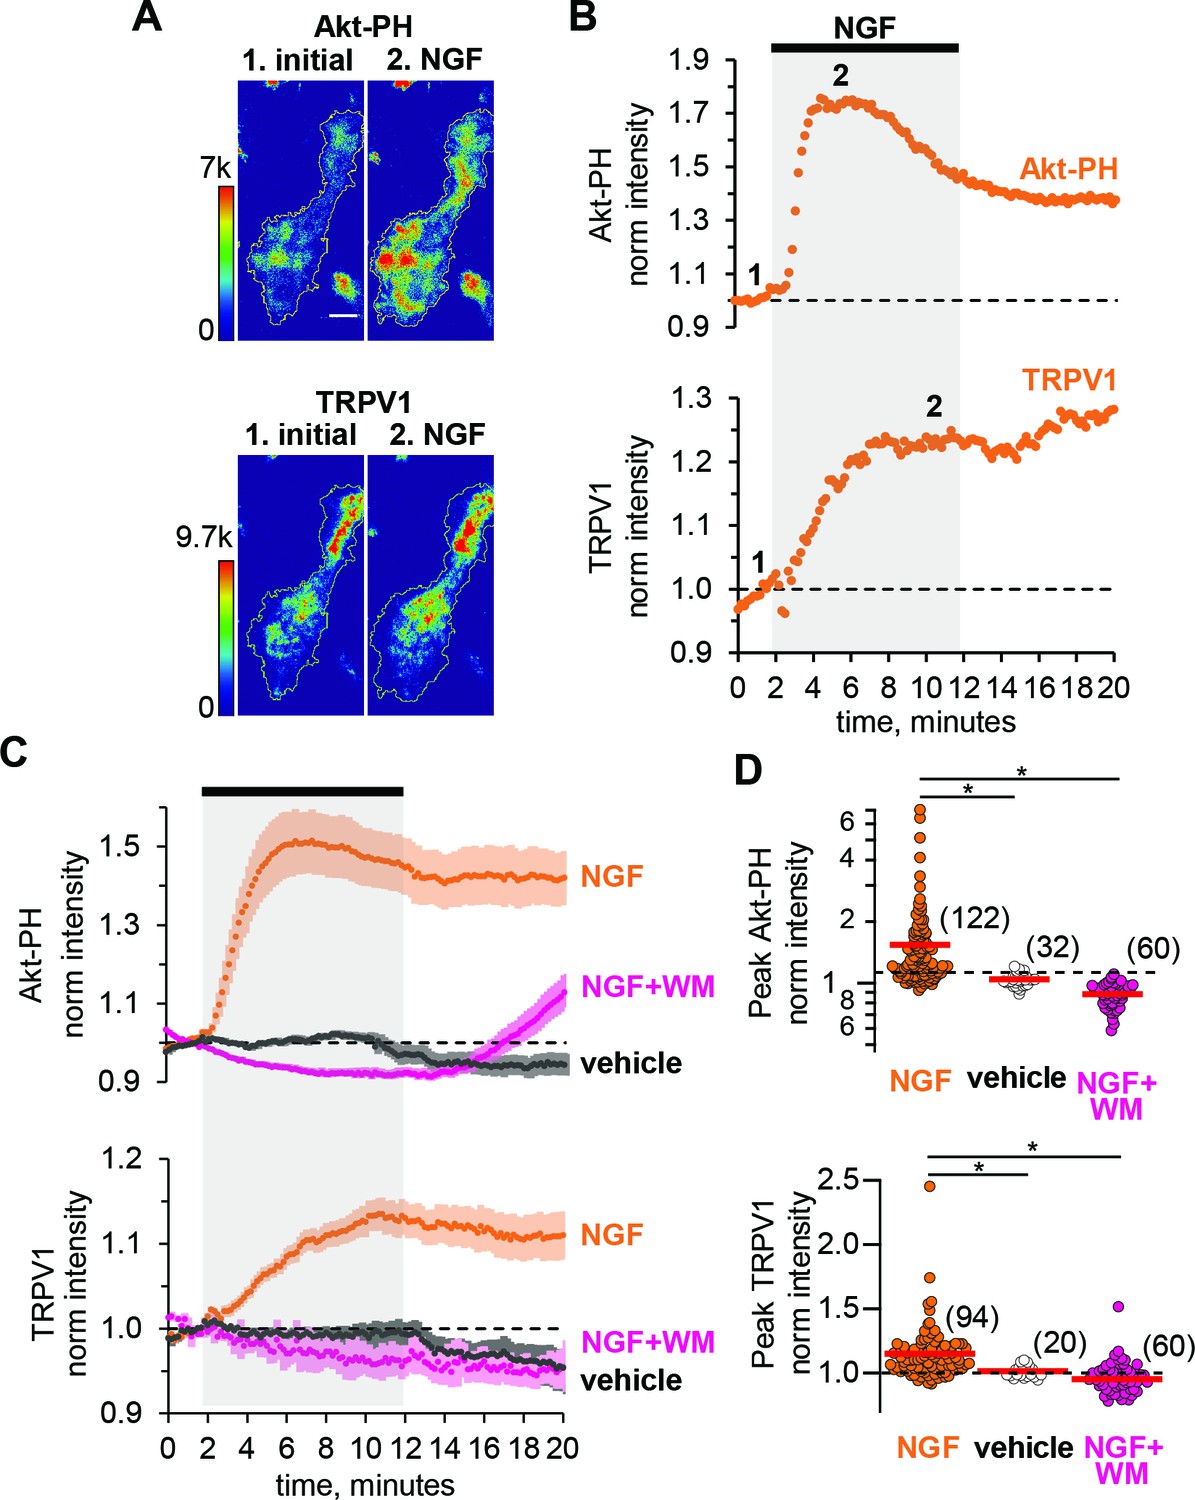
NGF increases PIP3 and recruits TRPV1 to the PM.
(A) TIRF images of a representative F-11 cell transfected with TrkA/p75NTR, TRPV1 and Akt-PH. Images labeled one were collected before NGF application and those labeled two were collected at the plateau during NGF application, as indicated by the time points labeled in B. Scale bar is 10 µm. LUT bars represent background-subtracted pixel intensities. The yellow border represents the outline of the cell footprint. (Top) Fluorescence intensity from Akt-PH. (Bottom) Fluorescence intensity from TRPV1. (B) Time course of NGF-induced changes in fluorescence intensity for the cell shown in A. NGF (100 ng/mL) was applied during the times indicated by the black bar/gray shading. Intensity at each time point was measured as the mean gray value within the footprint (yellow outline in A). Data were normalized to the mean intensity values during the two minutes prior to NGF application. (C) And (D) Collected data for the group of cells tested. (C) Time course of NGF-induced changes in fluorescence intensity. Averaged time courses of TIRF intensity normalized as in B. Cells treated with either NGF (orange), vehicle (black) or NGF +wortmannin (NGF +WM, magenta), as indicated. TRPV1 (bottom) and Akt-PH (top). Error bars are SEM (D) NGF-induced change in fluorescence intensity. Cells were treated with NGF (orange), vehicle (open symbols) or NGF +wortmannin (NGF +WM, magenta), as indicated. Averaged normalized TIRF intensity during NGF application (6–8 min for Akt-PH (top) and 10–12 min for TRPV1 (bottom)). The red bars indicate the mean Akt-PH fluorescence (top) and TRPV1 fluorescence (bottom). Asterisks indicate Wilcoxon rank test significance p value < 0.001.
Figure 1—figure supplement 1
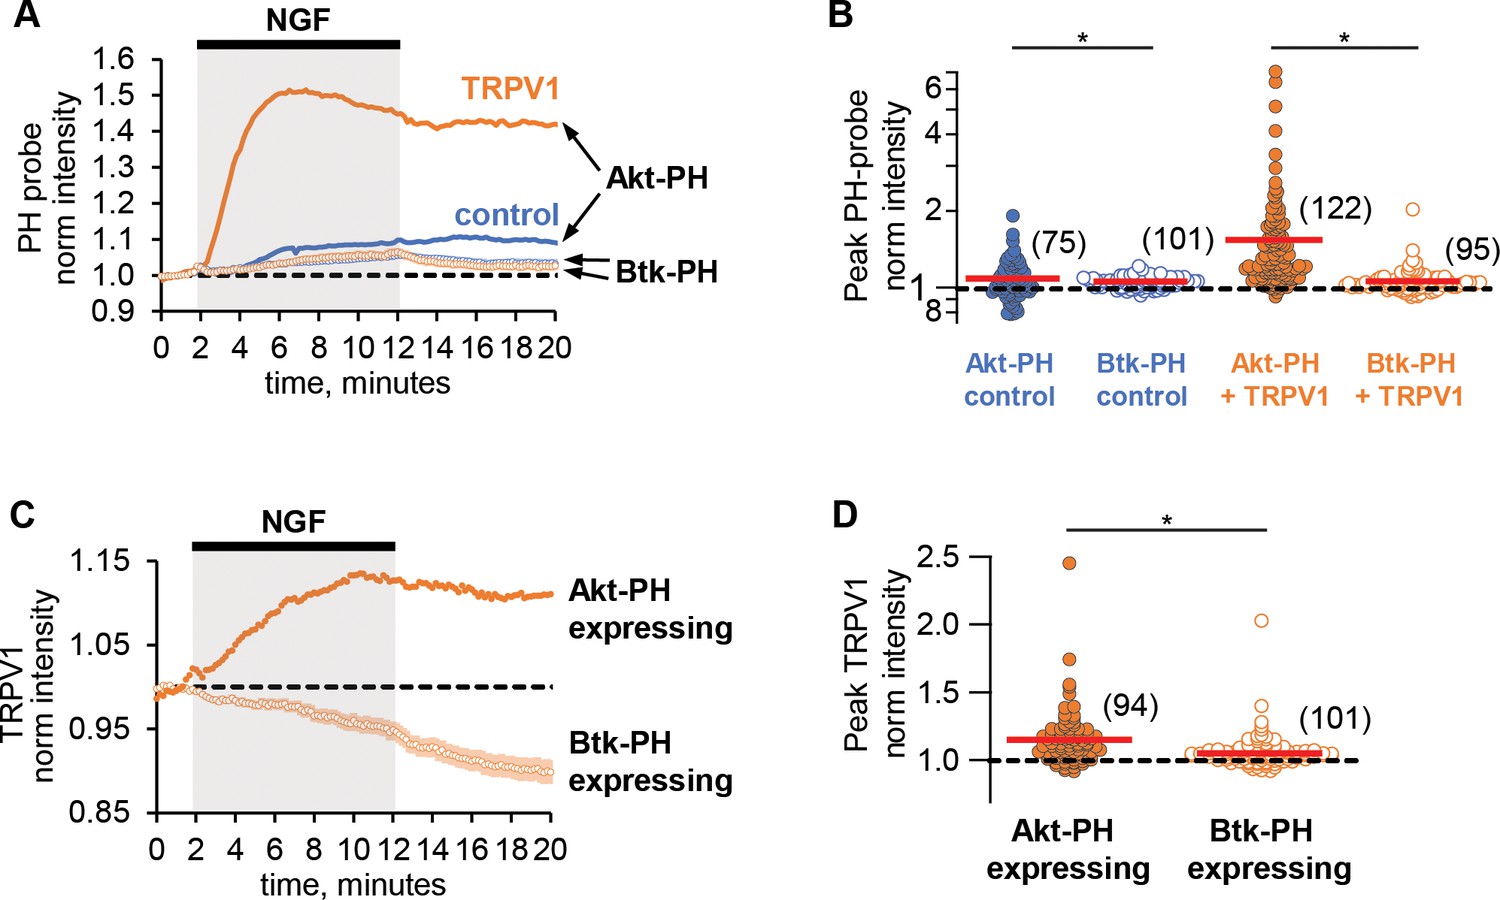
Btk-PH is not compatible with NGF signaling to TRPV1.
(A) Time course of NGF-induced changes in PH-probe fluorescence intensity. TRPV1 (orange) and control cells (blue) are shown expressing either Akt-PH (filled symbols, traces as in Figure 1C, error bars removed for clarity) or Btk-PH (open symbols; error bars are SEM). (B) NGF-induced change in peak PH-probe fluorescence intensity. TRPV1 (orange) and control cells (blue) are shown expressing either Akt-PH (filled symbols, data same as in Figure 1D) or Btk-PH (open symbols). Peak referes to averaged normalized TIRF Akt-PH or Btk-PH intensity during NGF application (6–8 min). The red bars indicate the mean. Asterisks indicate significance of Wilcoxon rank test p value < 0.05. (C) Time course of NGF-induced changes in TRPV1 fluorescence intensity. Averaged time courses of TIRF intensity normalized as in Figure 1B. Cells expressing TRPV1 and either Btk-PH (open symbols, error bars are SEM) or Akt-PH (filled symbols, trace as in Figure 1C, error bars removed for clarity). (D) NGF-induced change in peak TRPV1 fluorescence intensity. Cells expressing TRPV1 and either Btk-PH (open symbols) or Akt-PH (filled symbols, data same as in Figure 1D). Peak referes to averaged normalized TIRF TRPV1 intensity during NGF application (10–12 min). The red bars indicate the mean. Asterisks indicate significance of Wilcoxon rank test p value < 0.05.
Figure 1—figure supplement 2
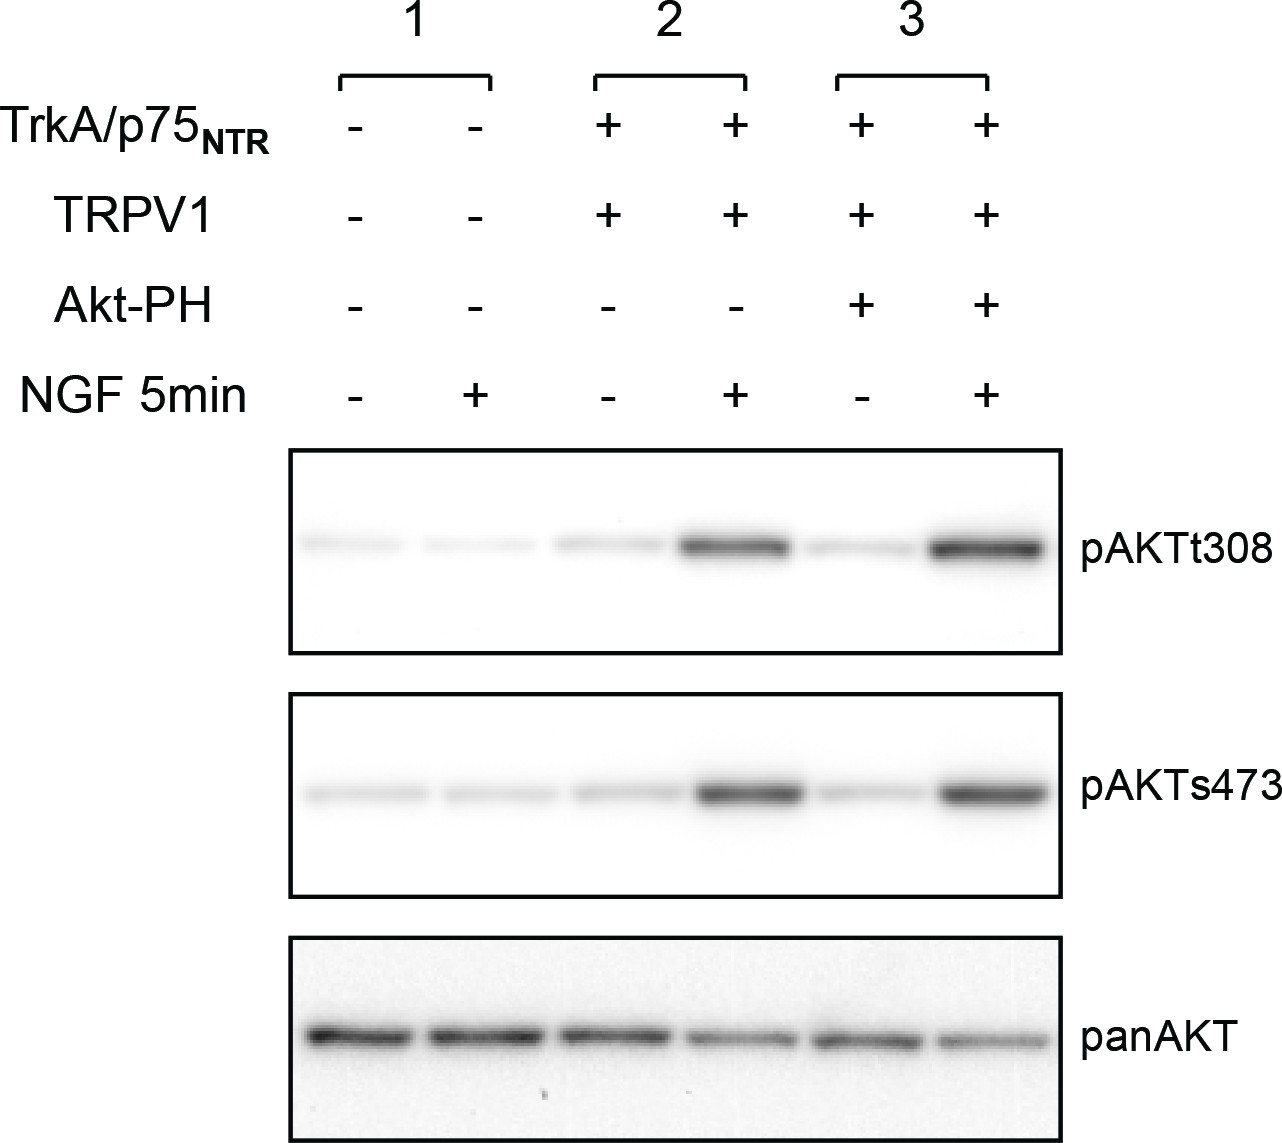
Akt-PH expression does not interfere with NGF-induced Akt phosphorylation.
Immunoblot analysis for Akt-phosphorylation in cells lacking TrkA/p75NTR (pair of lanes #1) treated with vehicle or NGF 100 ng/ml for 5 min. Cells lacking Akt-PH (pair of lanes #2) have comparable NGF-induced Akt-phosphorylation to cells transfected with Akt-PH (pair of lanes #3).
-
Figure 1—figure supplement 2—source data 1
Full images of gel in Figure 1—figure supplement 2.
- https://doi.org/10.7554/eLife.38869.007
Figure 1—figure supplement 3
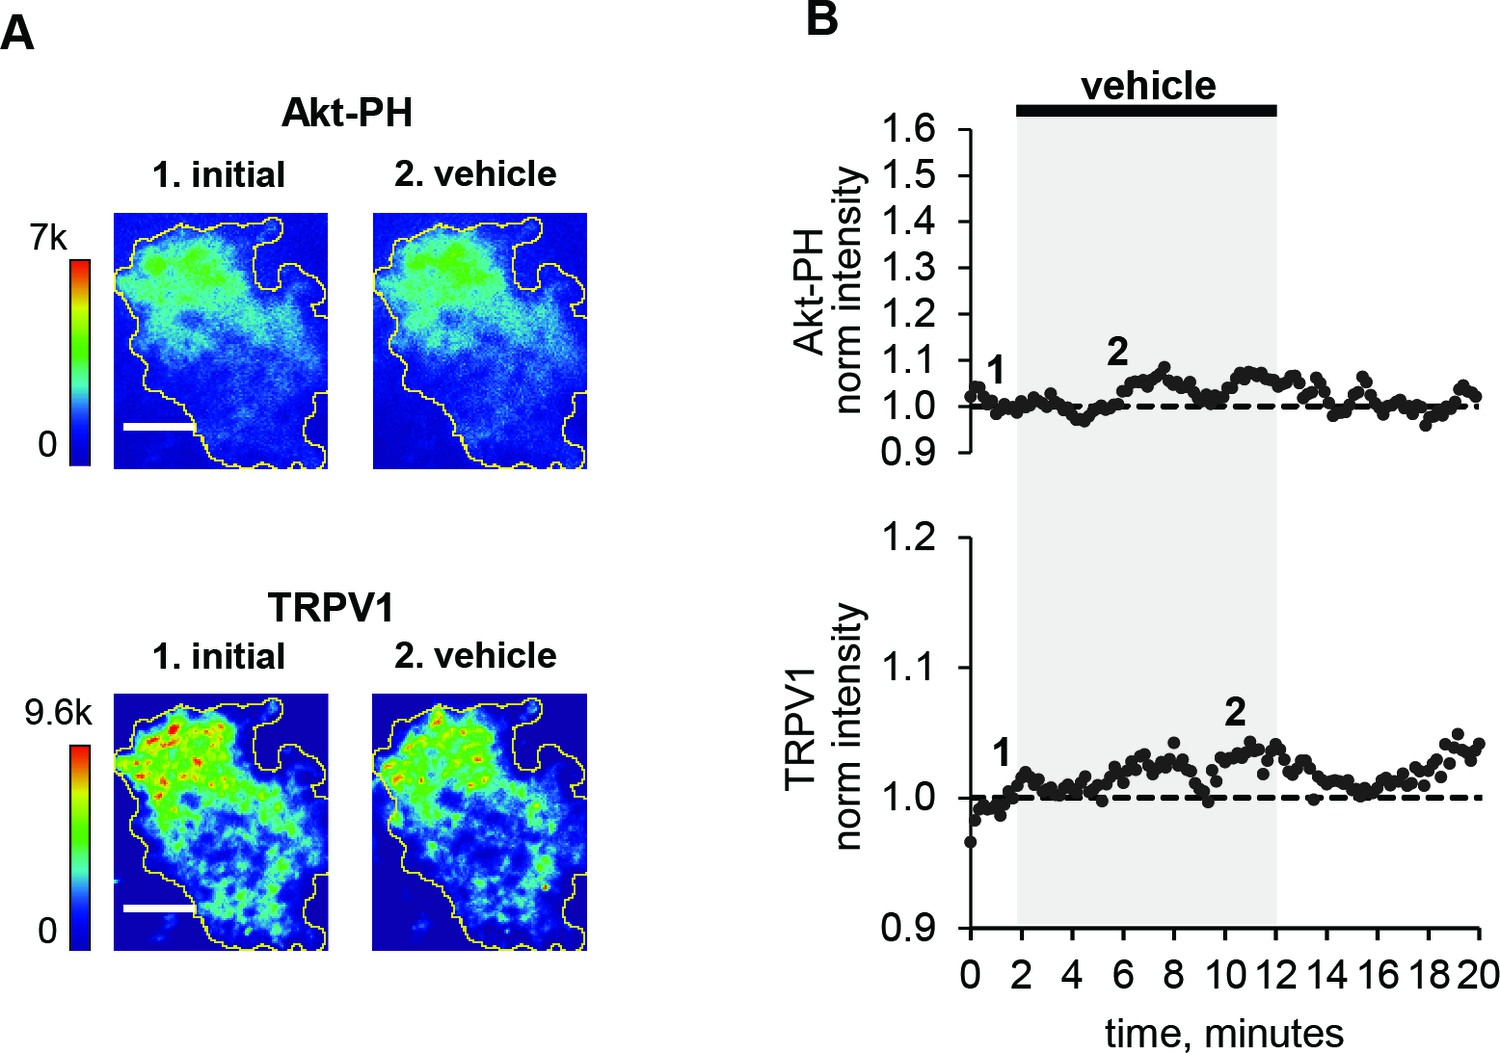
Vehicle does not increase PIP3 or recruit TRPV1 to PM.
(A) TIRF images of a representative F-11 cell transfected with TrkA/p75NTR, TRPV1 and Akt-PH. Images labeled one were collected before vehicle application and those labeled two were collected at the time points labeled in B. Scale bar is 10 µm. LUT bars represent background-subtracted pixel intensities. The yellow border represents the outline of the cell footprint. (Top) Fluorescence intensity from Akt-PH. (Bottom) Fluorescence intensity from TRPV1. (B) Time course of vehicle-induced changes in fluorescence intensity for the cell shown in A. Vehicle was applied during the times indicated by the black bar/gray shading. Intensity at each time point was measured as the mean gray value within the footprint (yellow outline in A). Data were normalized to the mean intensity values during the two minutes prior to vehicle application.
Figure 1—figure supplement 4
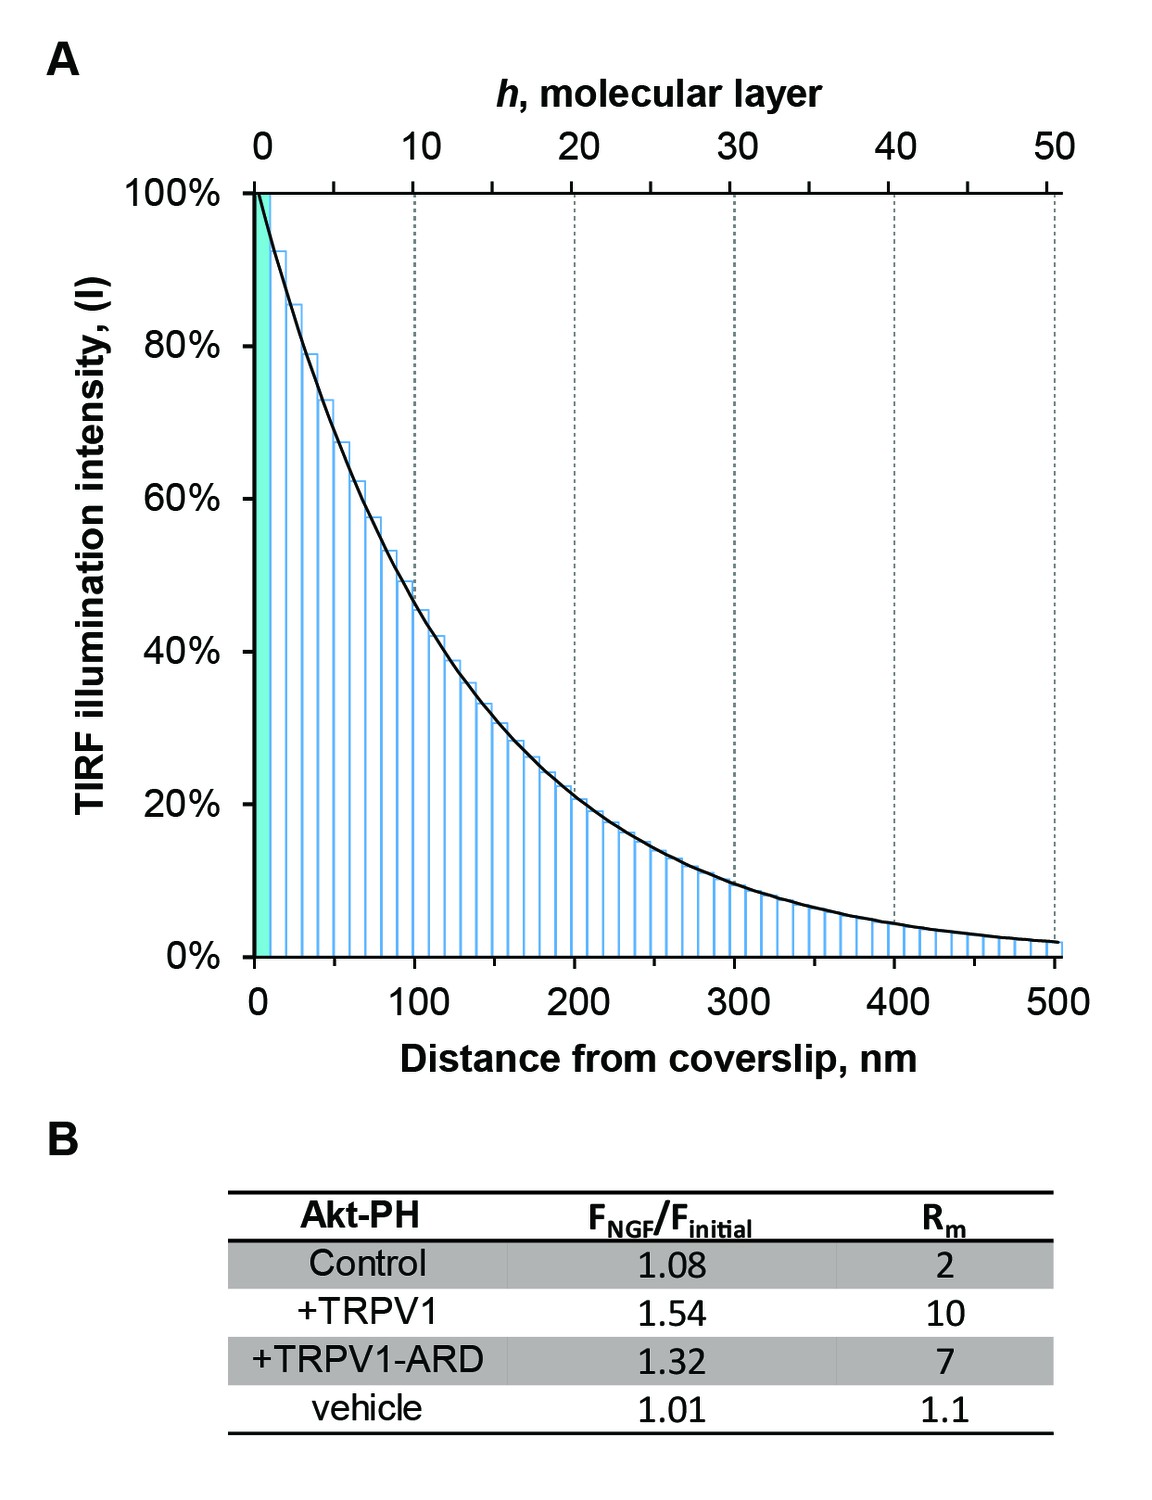
Model for TIRF illumination and estimation of Akt-PH translocation to the PM.
(A) TIRF illumination intensity over distance in nanometers and molecular layers according to our model, see Materials and methods, Figure 1—figure supplement 4—source data 1. Refractive indexes of solution, coverslip and an incidence angle were all determined by our experimental conditions. Bars represent molecular layers, solid fill – membrane layer, open – cytosol layers. (B) Table for measured Akt-PH TIRF fluorescence (FNGF/Finitial), and estimated ratio of molecules at the membrane after NGF to that before NGF (Rm) TRPV1 and vehicle are measurements of data in Figure 1, control and TRPV1-ARD – from Figure 2. We consider the membrane and associated proteins to reside in layer h0. At rest, we assume that Akt-PH molecules are distributed evenly throughout layers h0-h49. We also assumed a fixed number of molecules in the field and that the only NGF-induced change was a redistribution of molecules among layers.
-
Figure 1—figure supplement 4—source data 1
Depth of TIRF field and membrane translocation estimation.
- https://doi.org/10.7554/eLife.38869.020
Figure 2 with 3 supplements
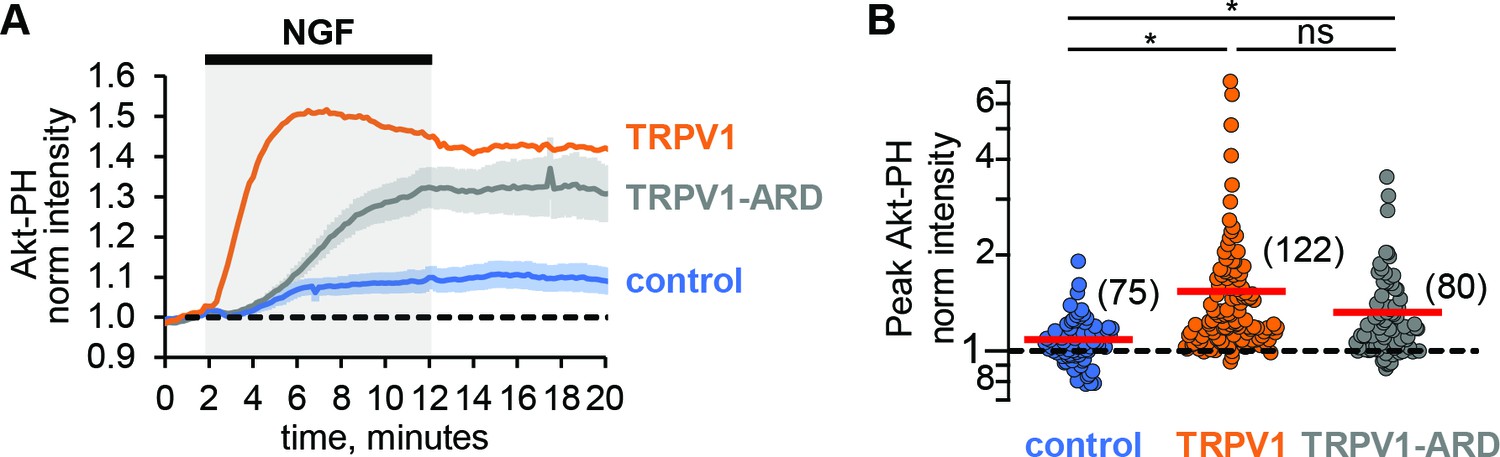
TRPV1-ARD is necessary and sufficient for potentiation of NGF-induced PI3K activity.
(A) Time course of NGF-induced changes in Akt-PH fluorescence intensity. NGF (100 ng/mL) was applied during the times indicated by the black bar/gray shading. Averaged normalized TIRF intensity from cells transfected with TrkA/p75NTR and Akt-PH: control cells without TRPV1 (blue, n = 75), TRPV1 (orange, n = 122), or TRPV1-ARD (gray, n = 80). Traces represent the mean and error bars represent the SEM. TRPV1 data are the same as in Figure 1C, error bars removed for clarity. (B) NGF-induced changes in Akt-PH fluorescence intensity for control cells (blue), cells expressing TRPV1 (orange data are the same as in Figure 1D) and cells transfected with TRPV1-ARD (gray). Averaged normalized TIRF intensity during NGF application (6–8 min). Red bars indicate mean (see Table 2 for values). Asterisks indicate significance of Holm-Bonferroni post-hoc adjusted Wilcoxon rank test p value < 0.001 (see Table 2 for values).
Figure 2—figure supplement 1

Representative images of NGF-induced recruitment Akt-PH and TRP channels to the PM.
Representative images of Akt-PH fluorescence from F-11 cells transfected with TrkA/p75NTR, and Akt-PH without TRPV1 – control. (A) and cells additionally transfected with TRPV1-ARD (B). Timing of images and labels as in Figure 1A. Scale bar is 10 µm. LUT bar is background subtracted pixel intensities. Yellow outline represents the cell footprint.
Figure 2—figure supplement 2

PI(3,4)P2/PIP3 generation is diminshed by PI3K inhibitor wortmannin.
(A) Time course of NGF-induced changes in Akt-PH fluorescence intensity. Averaged normalized TIRF intensity from control cells transfected with TrkA/p75NTR and Akt-PH but no TRPV1 treated with NGF (blue, n = 75, data are the same as in Figure 2A, error bars removed for clarity) or NGF +wortmannin (WM, magenta, n = 53). Traces represent the mean and error bars represent the SEM. control data are the same as in Figure 2A, error bars removed for clarity. (B) NGF-induced changes in averaged normalized TIRF Akt-PH fluorescence intensity for control cells treated with NGF (blue data are the same as in Figure 2B) or NGF +Wortmannin (WM, magenta, n = 53). Peak referes to averaged normalized TIRF intensity during NGF application (6–8 min). Red bars indicate mean. Asterisks indicate significance of Student’s T-test p value < 0.001.
Figure 2—figure supplement 3
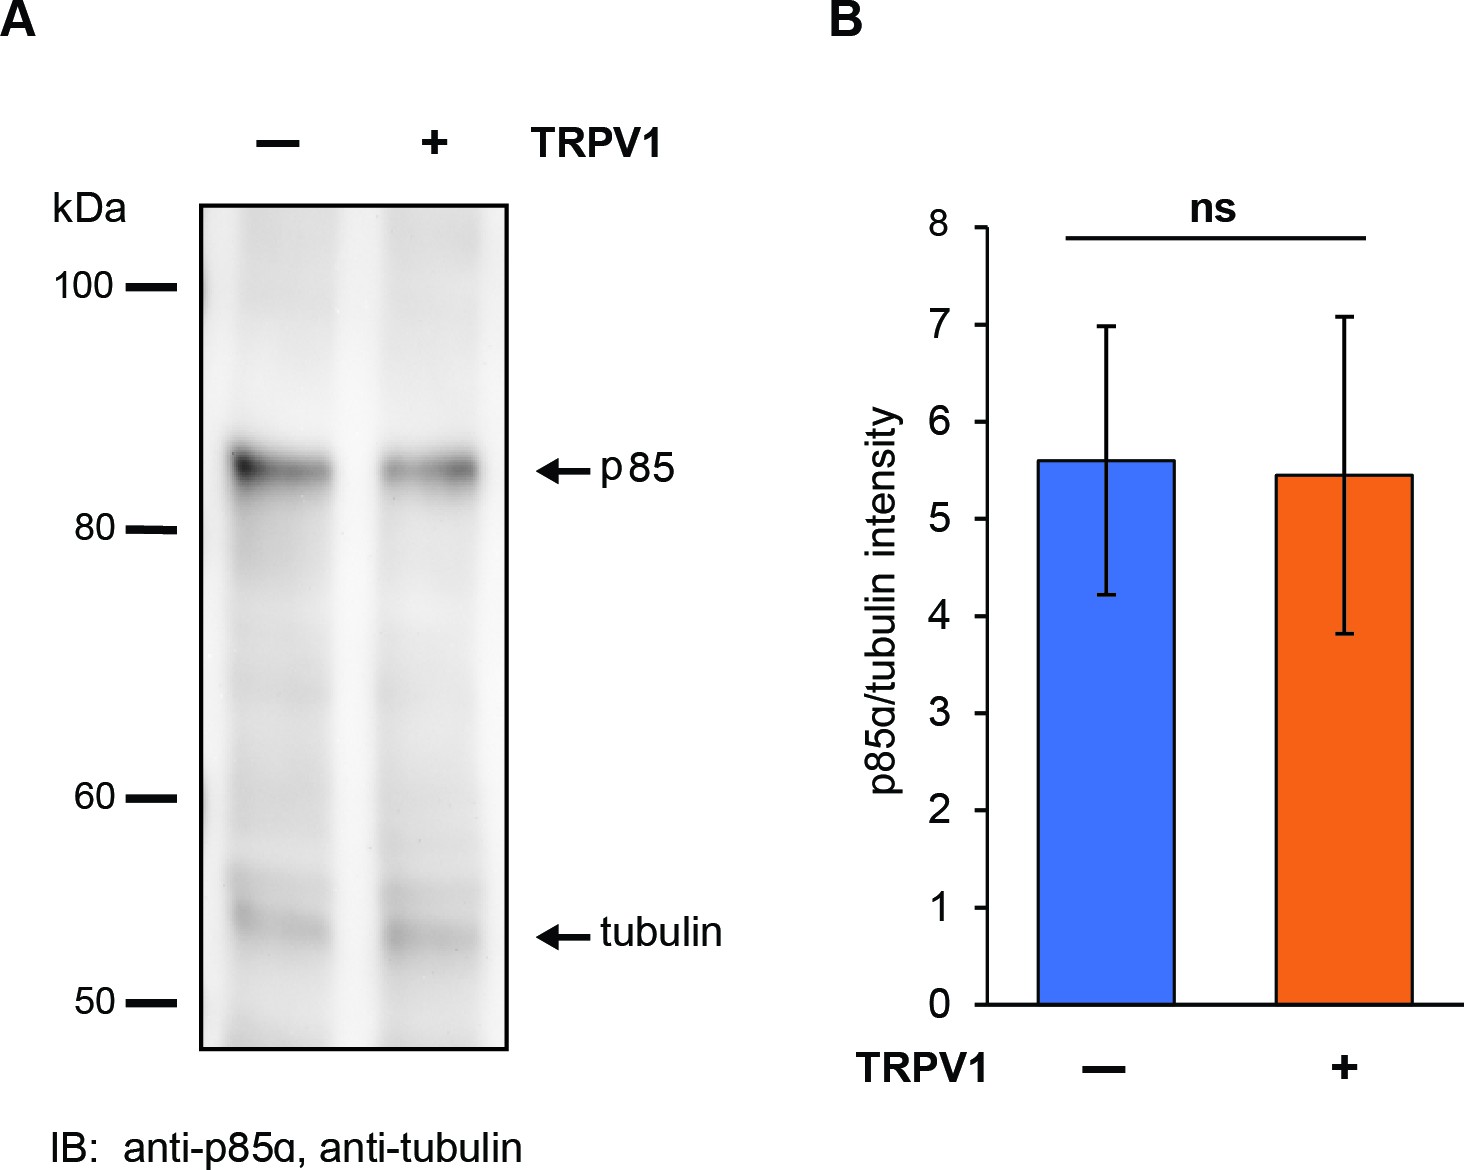
TRPV1 co-expression does not alter PI3K expression.
(A) Representative immunoblot for p85 expression in F-11 cells expressing -/+TRPV1. Membrane was stained for p85 and tubulin simultaneously. (B) Relative p85 expression in F-11 cells expressing -/+TRPV1. Immunoblots were quantified as described in Methods (n = 5 independent experiments). Mean ± SEM pixel intensity are plotted normalized to the tubulin band on each blot. Student’s t-test two-tailed p = 0.95.
-
Figure 2—figure supplement 3—source data 1
Full image of gel in Figure 2—figure supplement 3.
- https://doi.org/10.7554/eLife.38869.012
Figure 3
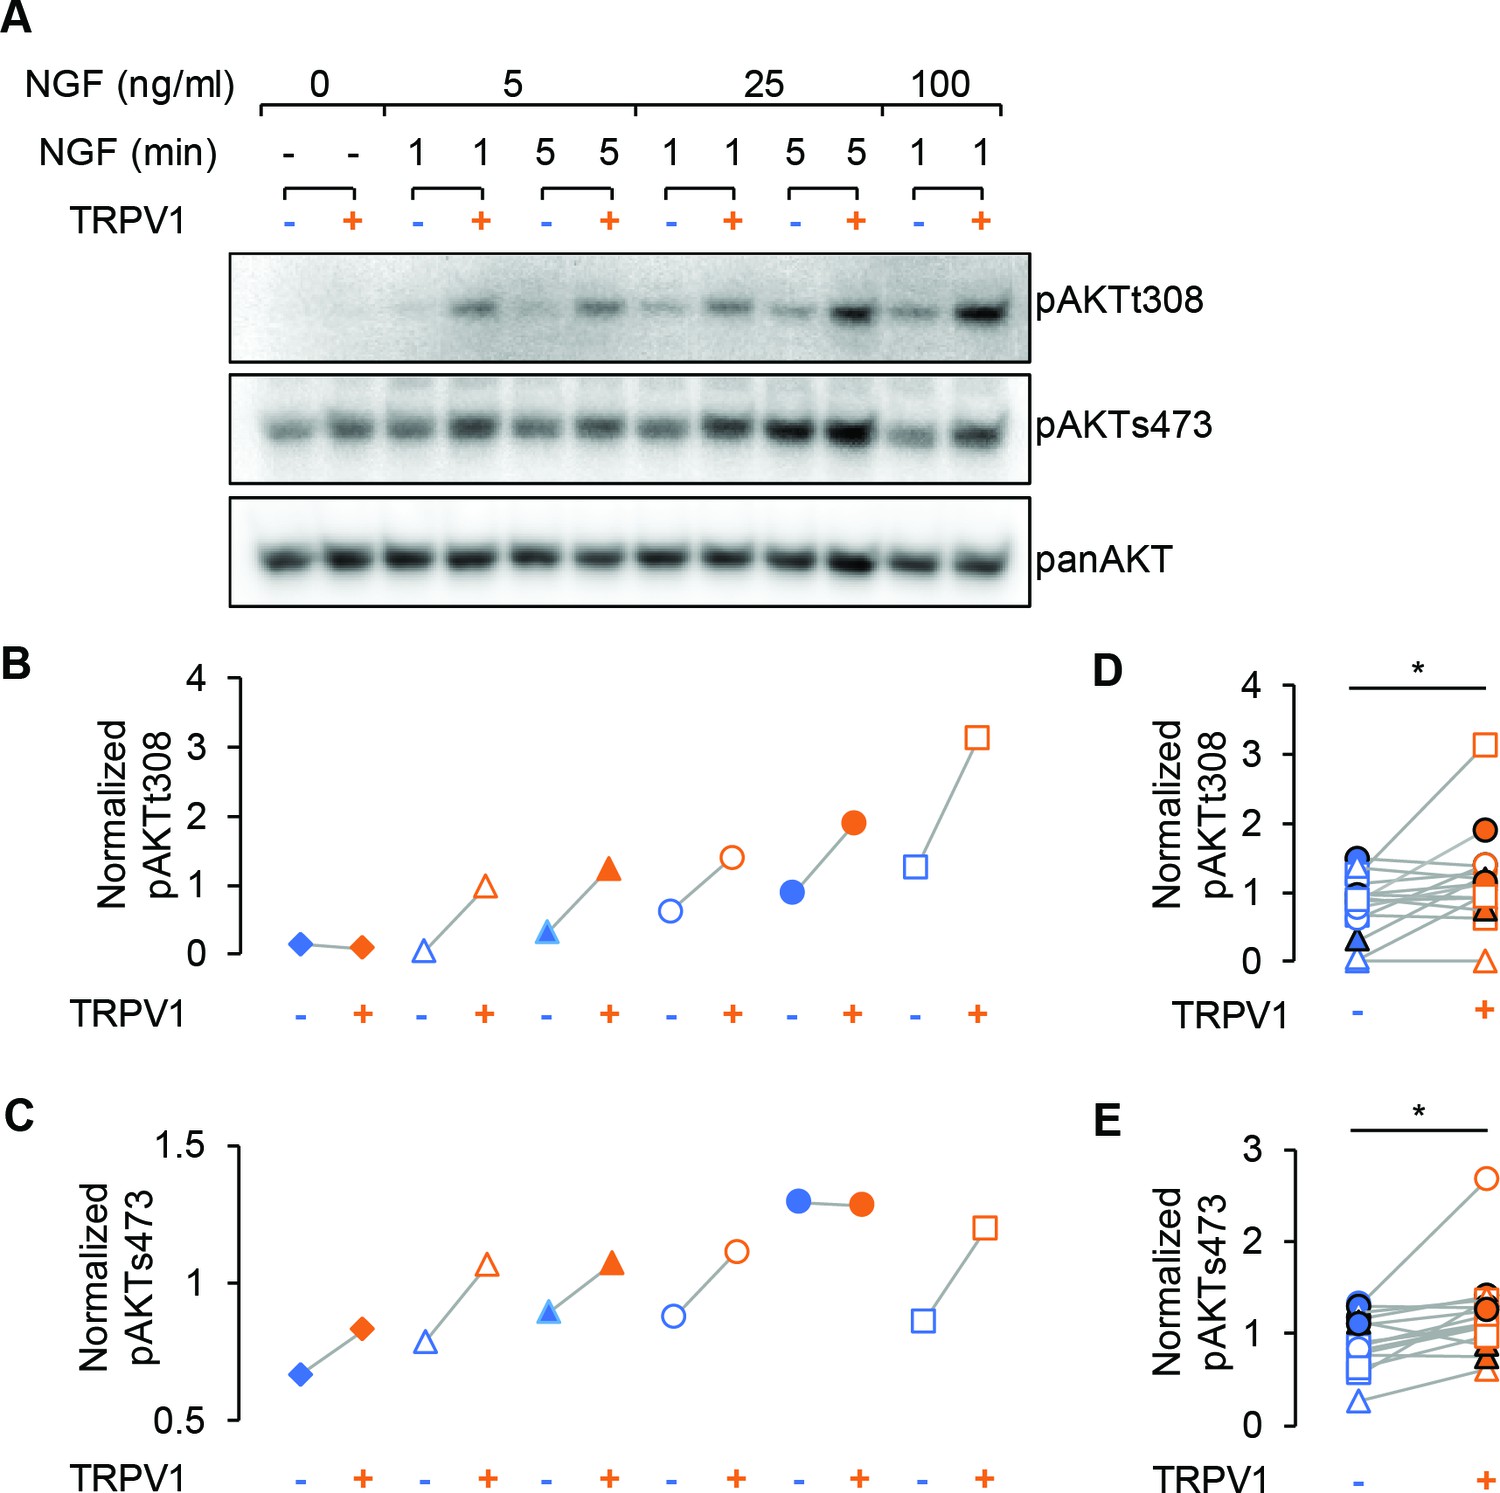
TRPV1 enhances NGF-induced Akt phosphorylation.
(A) Representative immunoblot staining for analysis of Akt phosphorylation in F-11 cells transfected same as in imaging experiments. Cells were treated with indicated dose of NGF for an indicated amounts of time, lysed and loaded on SDS-PAGE. The same membrane was probed with pAKTs473, stripped and re-probed with pAKTt308 and again with panAKT antibodies (see Materials and methods). (B) and (C) Analysis of the representative blots shown in (A). Each band average intensity was normalized to the average of the blot and then divided by that of the corresponding lane of the panAkt blot. Akt phosphorylated at T308 (B) and S473 (C) from control cells (blue symbols) and cells expressing TRPV1 (orange symbols) treated with NGF (5, 25 or 100 ng/ml) for 1 or 5 min as indicated in (A). Triangles represent treatment with NGF 5 ng/ml, circles – 25 ng/m, squares – 100 ng/ml. Open symbols represent treatments for 1 min and filled symbols – 5 min. (D) and (E) Normalized phospho-Akt intensities from all indicated conditions are pooled together for the n = 3 of independent experiments. Paired Student's t-test for pAKTt308 p=0.02 and for pAKTs473 p=0.008.
-
Figure 3—source data 1
Full images of gels in Figure 3.
- https://doi.org/10.7554/eLife.38869.016
Figure 4 with 1 supplement

Potentiation of PI3K and NGF-induced trafficking are conserved among TRPV channels.
Time course of NGF-induced changes in fluorescence intensity. NGF (100 ng/mL) was applied during the times indicated by the black bar/gray shading. Traces represent the mean, error bars are SEM. Control and TRPV1 data same as in Figure 2 with error bars removed for clarity. (A) Averaged normalized TIRF intensity of Akt-PH from cells transfected with TrkA/p75NTR and Akt-PH and: (A) no channel (control; blue; n = 75); TRPV1 (orange; n = 122); TRPV2 (black; n = 61); TRPV4 (yellow; n = 29). (B) Averaged normalized Akt-PH intensity during NGF application (6–8 min). The red bars indicate the mean. Asterisks indicate significance (Holm-Bonferroni post-hoc adjusted Wilcoxon rank test p < 0.05, see Table 2 for values). (C) Averaged normalized TIRF intensity of individual TRP channels. Color scheme as in (A) with the cell numbers as follows: TRPV1 (n = 94); TRPV2 (n = 62); TRPV4 (n = 48). (D). Averaged normalized TRP channel intensity during NGF application (8–10 min). The red bars indicate the mean. Asterisks indicate significance (Holm-Bonferroni post-hoc adjusted Wilcoxon rank test p < 0.05, see Table 1 for values).
Figure 4—figure supplement 1
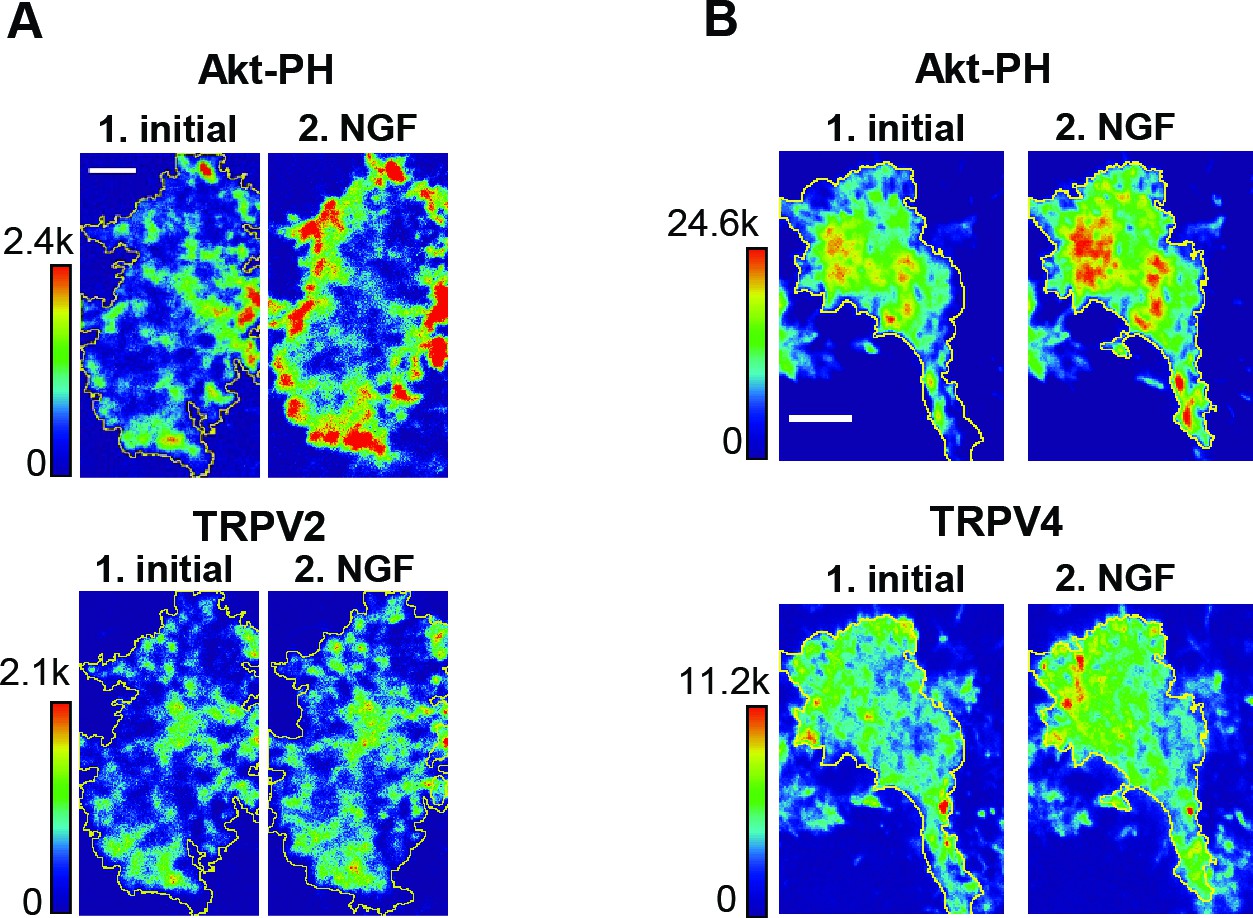
Representative images of NGF-induced recruitment Akt-PH and TRP channels to the PM.
Representative images of F-11 cells transfected with TrkA/p75NTR, Akt-PH and one of the following: (A) TRPV2; (B) TRPV4. Timing of images and labels as in Figure 1A. Scale bar is 10 µm. LUT bar is background subtracted pixel intensities. Yellow outline represents the cell footprint.
Tables
Table 1
Normalized TRP channel fluorescence intensities measured during NGF application for all discussed conditions.
The number of cells in the data set collected over at least three different experiments is given by n. Non-adjusted Wilcoxon rank test two tail p values was performed for pairwise comparisons as indicated.
| NGF Mean ± SEM | N= | TRPV1 | Vehicle | |
|---|---|---|---|---|
| TRPV1 | 1.15 ± 0.02 | 94 | - | - |
| vehicle | 1.01 ± 0.01 | 20 | 10−6 | - |
| TRPV2 | 1.12 ± 0.02 | 62 | 0.24 | 0.002 |
| TRPV4 | 1.11 ± 0.02 | 48 | 0.13 | 0.002 |
Table 2
Normalized Akt-PH fluorescence intensities measured during NGF application for all discussed conditions.
The number of cells in the data set collected over at least three different experiments is given by n. Non-adjusted Wilcoxon rank test two tail p values for pairwise comparisons as indicated.
| Akt-PH from | NGF Mean ± SEM | N= | Control | TRPV1 |
|---|---|---|---|---|
| control | 1.08 ± 0.03 | 75 | - | - |
| TRPV1 | 1.54 ± 0.8 | 122 | 10−12 | - |
| TRPV1-ARD | 1.32 ± 0.2 | 80 | 10−5 | 0.08 |
| TRPV2 | 1.23 ± 0.18 | 61 | 0.04 | 0.0002 |
| TRPV4 | 1.28 ± 0.14 | 29 | 0.02 | 0.02 |
Additional files
-
Source data 1
Source data from figures.
Excel file containing source data from the figures as indicated. The name of Excel sheet corresponds to the figure to which it is related
- https://doi.org/10.7554/eLife.38869.019
-
Transparent reporting form
- https://doi.org/10.7554/eLife.38869.021
Download links
A two-part list of links to download the article, or parts of the article, in various formats.
Downloads (link to download the article as PDF)
Open citations (links to open the citations from this article in various online reference manager services)
Cite this article (links to download the citations from this article in formats compatible with various reference manager tools)
Reciprocal regulation among TRPV1 channels and phosphoinositide 3-kinase in response to nerve growth factor
eLife 7:e38869.
https://doi.org/10.7554/eLife.38869


