Multiple factors maintain assembled trans-SNARE complexes in the presence of NSF and αSNAP
- University of Texas Southwestern Medical Center, United States
Figures
Figure 1
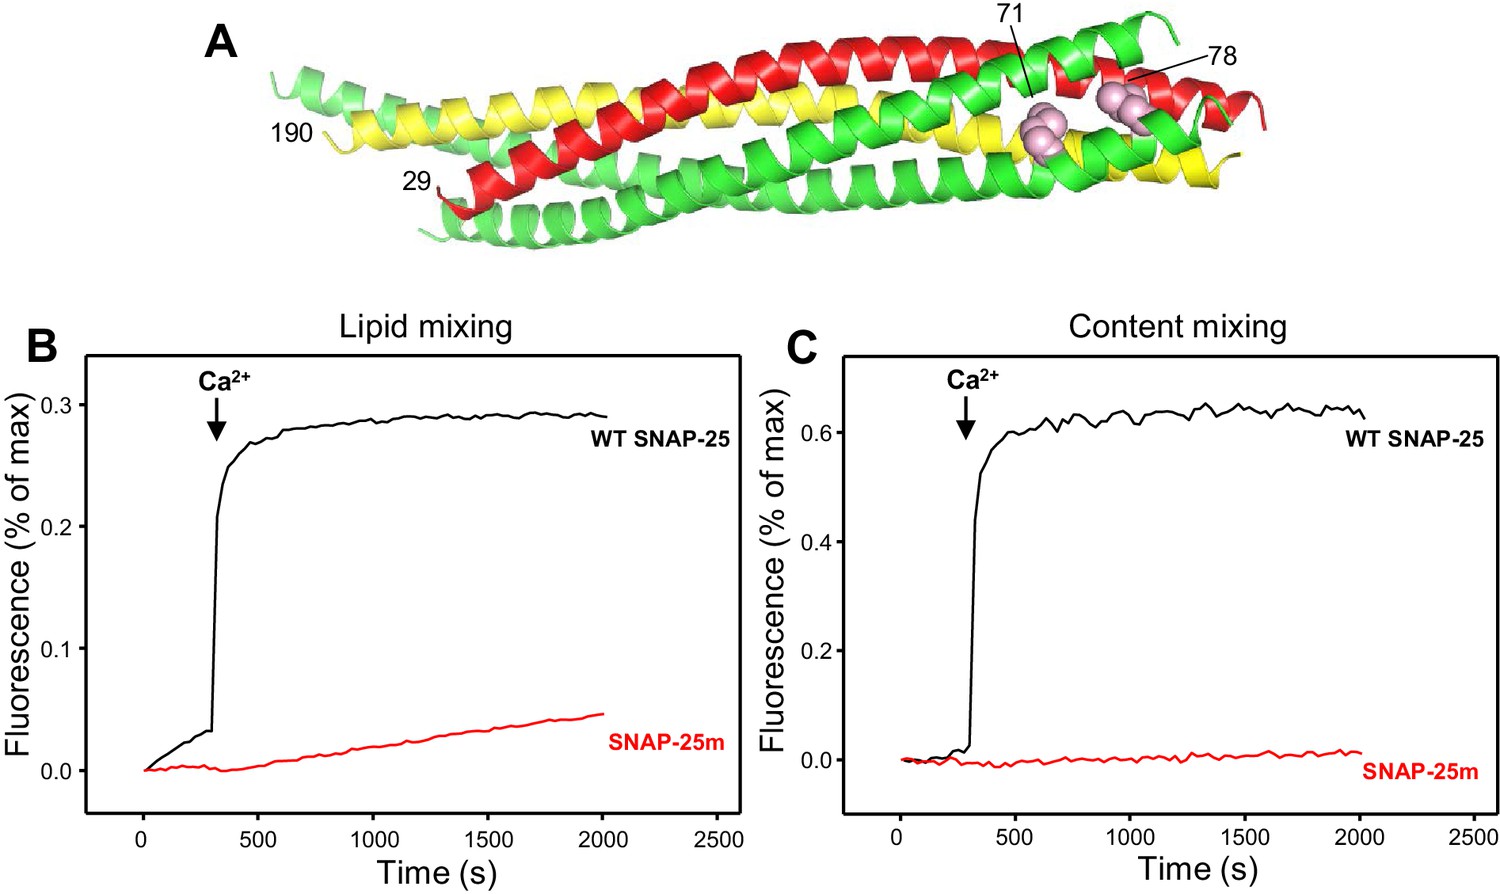
Design of a SNAP-25 mutation that abrogates its ability to support membrane fusion.
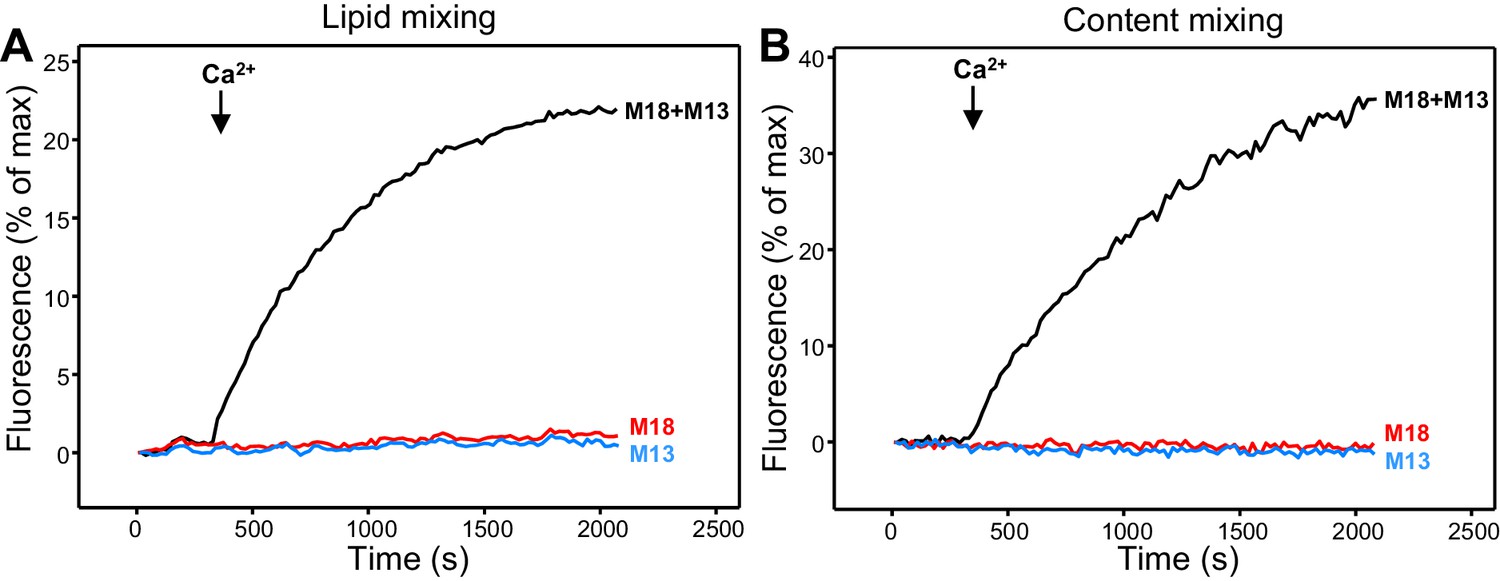
(A) Ribbon diagram of the crystal structure of the SNARE complex (PDB accession code 1SFC) (Sutton et al., 1998). Synaptobrevin is red, syntaxin-1 yellow and SNAP-25 green, with the side chains of the two residues that were mutated to aspartate (M71 and L78) shown as pink spheres. Note that the side chains are pointing toward the hydrophobic interior of the four-helix bundle. Hence, mutating these residues to aspartate is expected to prevent C-terminal zippering of the SNARE complex. The residue numbers of the two mutated residues and of the N-termini of synaptobrevin and syntaxin-1 SNARE motifs are indicated. (B,C) The SNAP-25 M71D,L78D mutation abrogates membrane fusion in reconstitution assays. Lipid mixing (B) between V- and T-liposomes was monitored from the fluorescence de-quenching of Marina Blue lipids and content mixing (C) was monitored from the increase in the fluorescence signal of Cy5-streptavidin trapped in the V-liposomes caused by FRET with PhycoE-biotin trapped in the T-liposomes upon liposome fusion. The assays were performed in the presence of Munc18-1, Munc13-1 C1C2BMUNC2C, NSF and αSNAP with T-liposomes that contained syntaxin-1 and wild type (WT) SNAP-25 or SNAP-25 M71D,L78D mutant (SNAP-25m). Experiments were started in the presence of 100 μM EGTA and 5 μM streptavidin, and Ca2+ (600 μM) was added at 300 s.
Figure 2 with 4 supplements
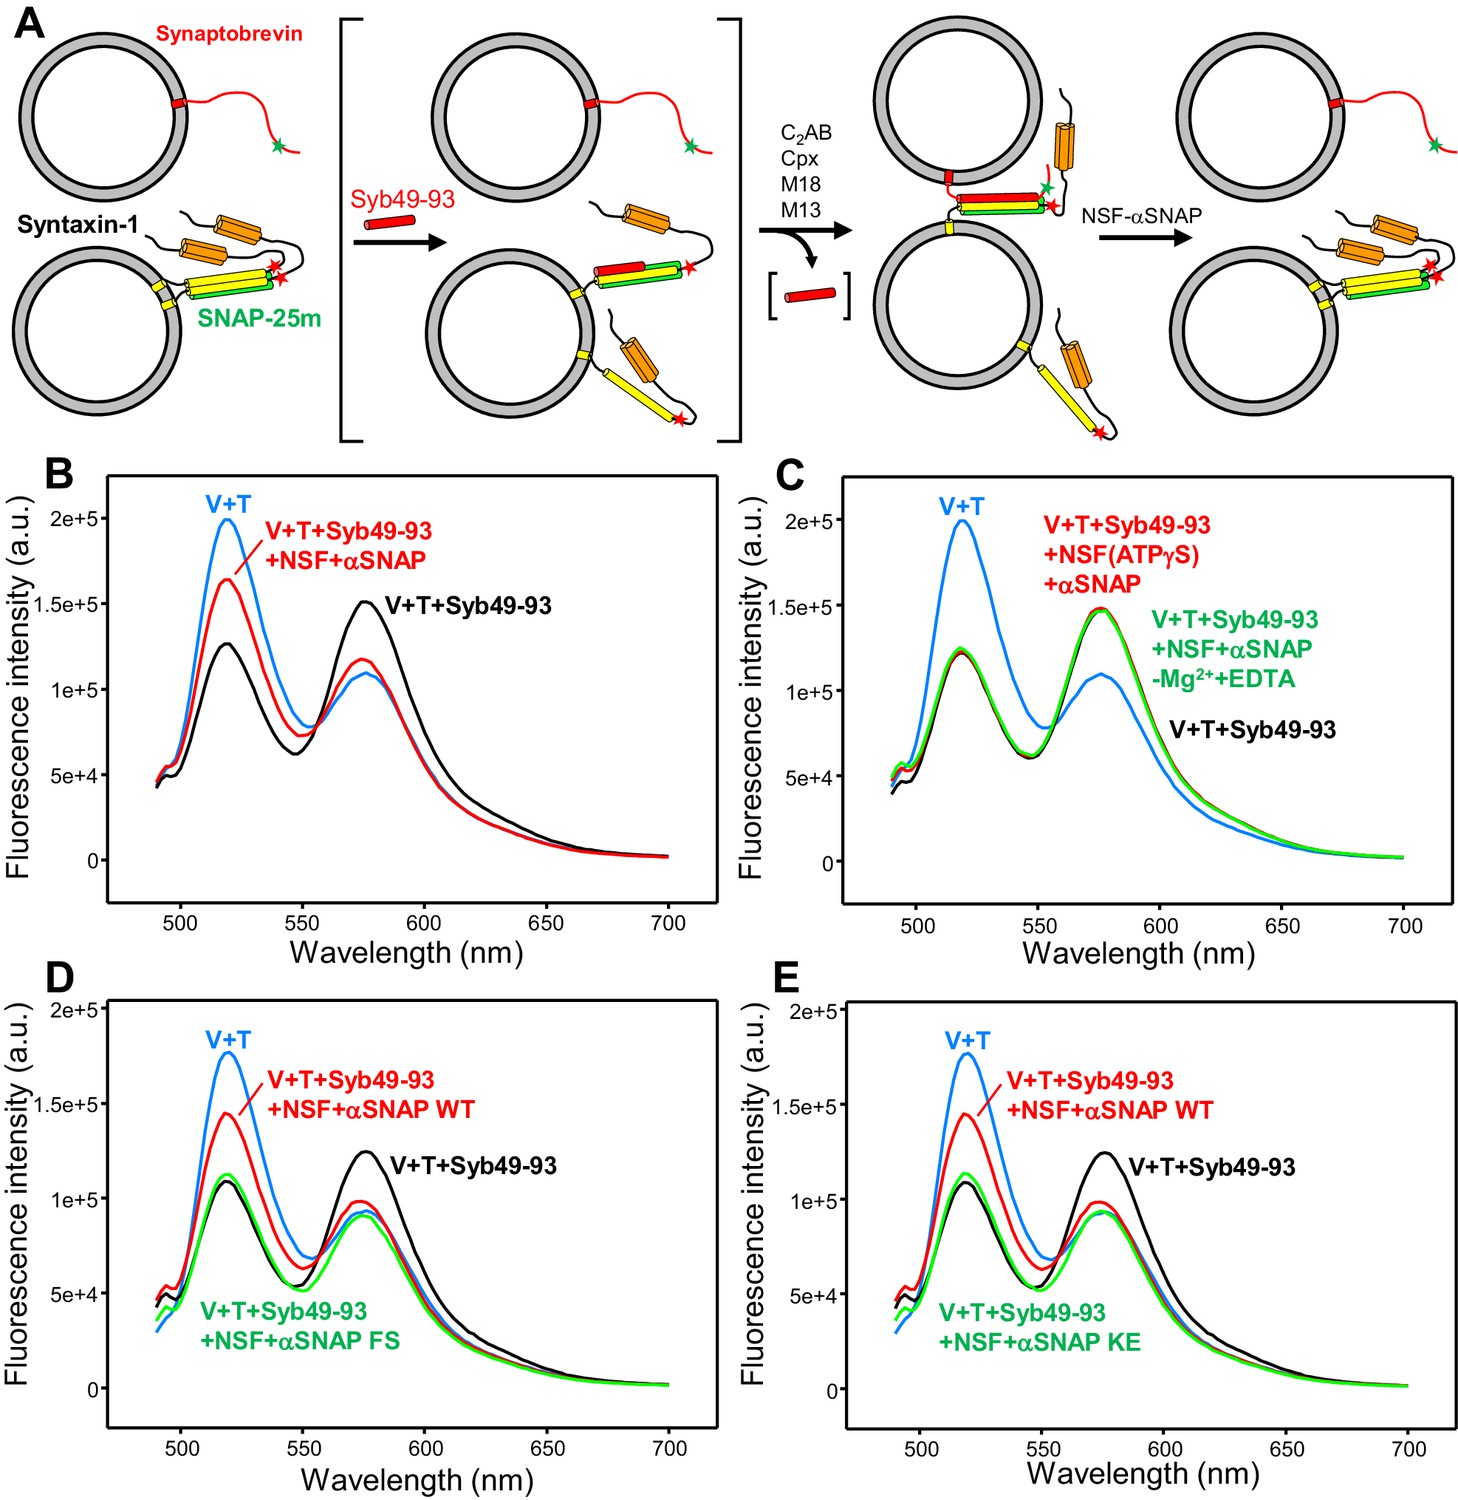
An assay to measure assembly of trans-SNARE complexes and disassembly by NSF-αSNAP.
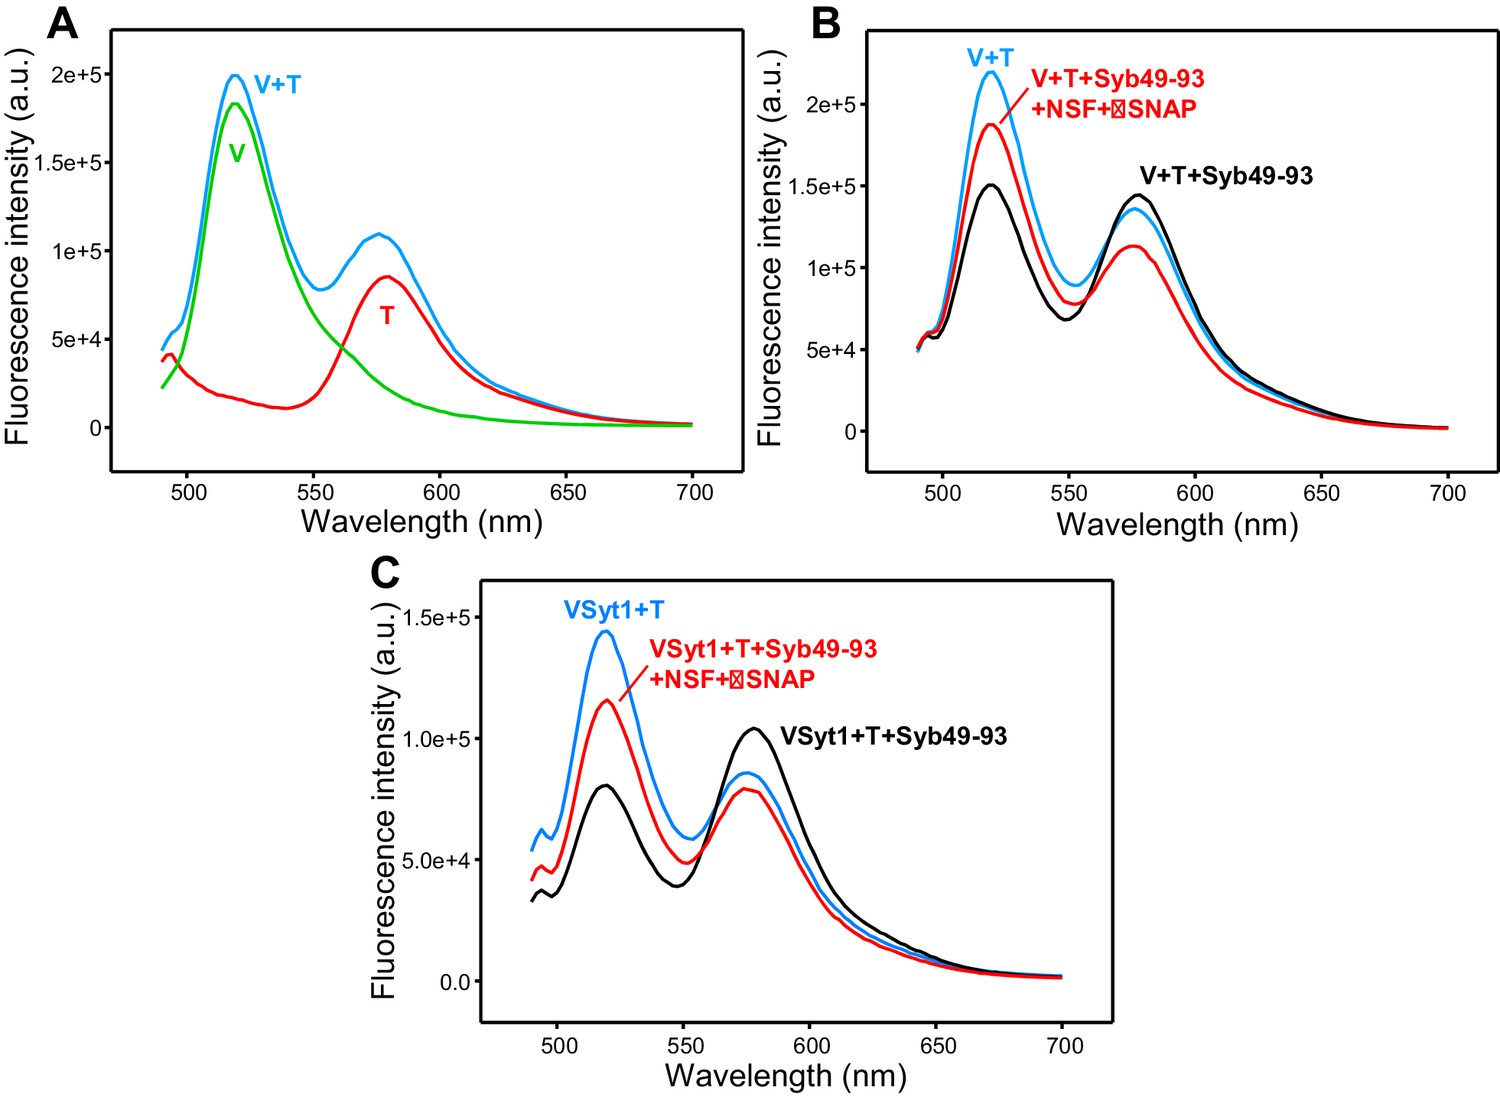
(A) Diagram illustrating the assay used to monitor trans-SNARE complex assembly and disassembly. V-liposomes containing synaptobrevin labeled with a FRET donor (Alexa488, green star) at residue 26 are mixed with T-liposomes containing SNAP-25m and syntaxin-1 labeled at residue 186 with a FRET acceptor (TMR, red star) in the presence of different factors. After monitoring the decrease in donor fluorescence intensity resulting from trans-SNARE complex formation under diverse conditions, NSF and αSNAP are added to test for disassembly of trans SNARE complexes. Synaptobrevin is red, SNAP-25m green and syntaxin-1 orange (N-terminal Habc domain) and yellow (SNARE motif). Although an excess of SNAP-25m was used in preparing the syntaxin-1-SNAP-25m liposomes, the majority of syntaxin-1-SNAP-25m complexes are expected to have a 2:1 stoichiometry such that the second syntaxin-1 SNARE molecule occupies the position of the synaptobevin SNARE motif in the SNARE four-helix bundle (bottom left diagram), hindering SNARE complex formation (reviewed in Rizo and Südhof, 2012). In some of the experiments, trans-SNARE complex assembly was facilitated by inclusion of the Syb49-93 peptide, which spans the C-terminal part of the synaptobrevin SNARE motif and displaces the second syntaxin-1 molecule from the syntaxin-1-SNAP-25m heterodimer, yielding the intermediate shown between brackets. Because Syb49-93 lacks the N-terminal half of the synaptobrevin SNARE motif, it can readily be displaced by full-length synaptobrevin to form trans-SNARE complexes (Pobbati et al., 2006). In other experiments, NSF-αSNAP were added from the beginning to investigate trans-SNARE complex assembly in their presence. (B) Fluorescence emission spectra (excitation at 468 nm) of a mixture of V-liposomes containing Alexa488-synaptobrevin and T-liposomes containing TMR-syntaxin-1-SNAP-25m (1:4 V- to T-liposome ratio) that had been incubated for five hours with Syb49-93 (black trace), and of the same sample after adding NSF-αSNAP plus ATP and Mg2+ (red trace). The blue curve shows a control spectrum obtained by adding spectra acquired separately for V- and T-liposomes at the same concentrations. (C) Fluorescence emission spectra acquired under conditions similar to those of (B), with pre-incubated mixtures of Syb49-93 with V- and T-liposomes before (black curve) or after addition of NSF-αSNAP plus ATP and EDTA (green curve) or NSF-αSNAP plus ATPγS and Mg2+ (red curve). (D,E) Fluorescence emission spectra acquired under similar conditions to those of (B), except that for the green curve WT αSNAP was replaced with the αSNAP FS (D) or KE (E) mutant. The red, black and blue curves are the same as in panel (B). All spectra were corrected for dilution caused by addition of reagents.
Figure 2—figure supplement 1
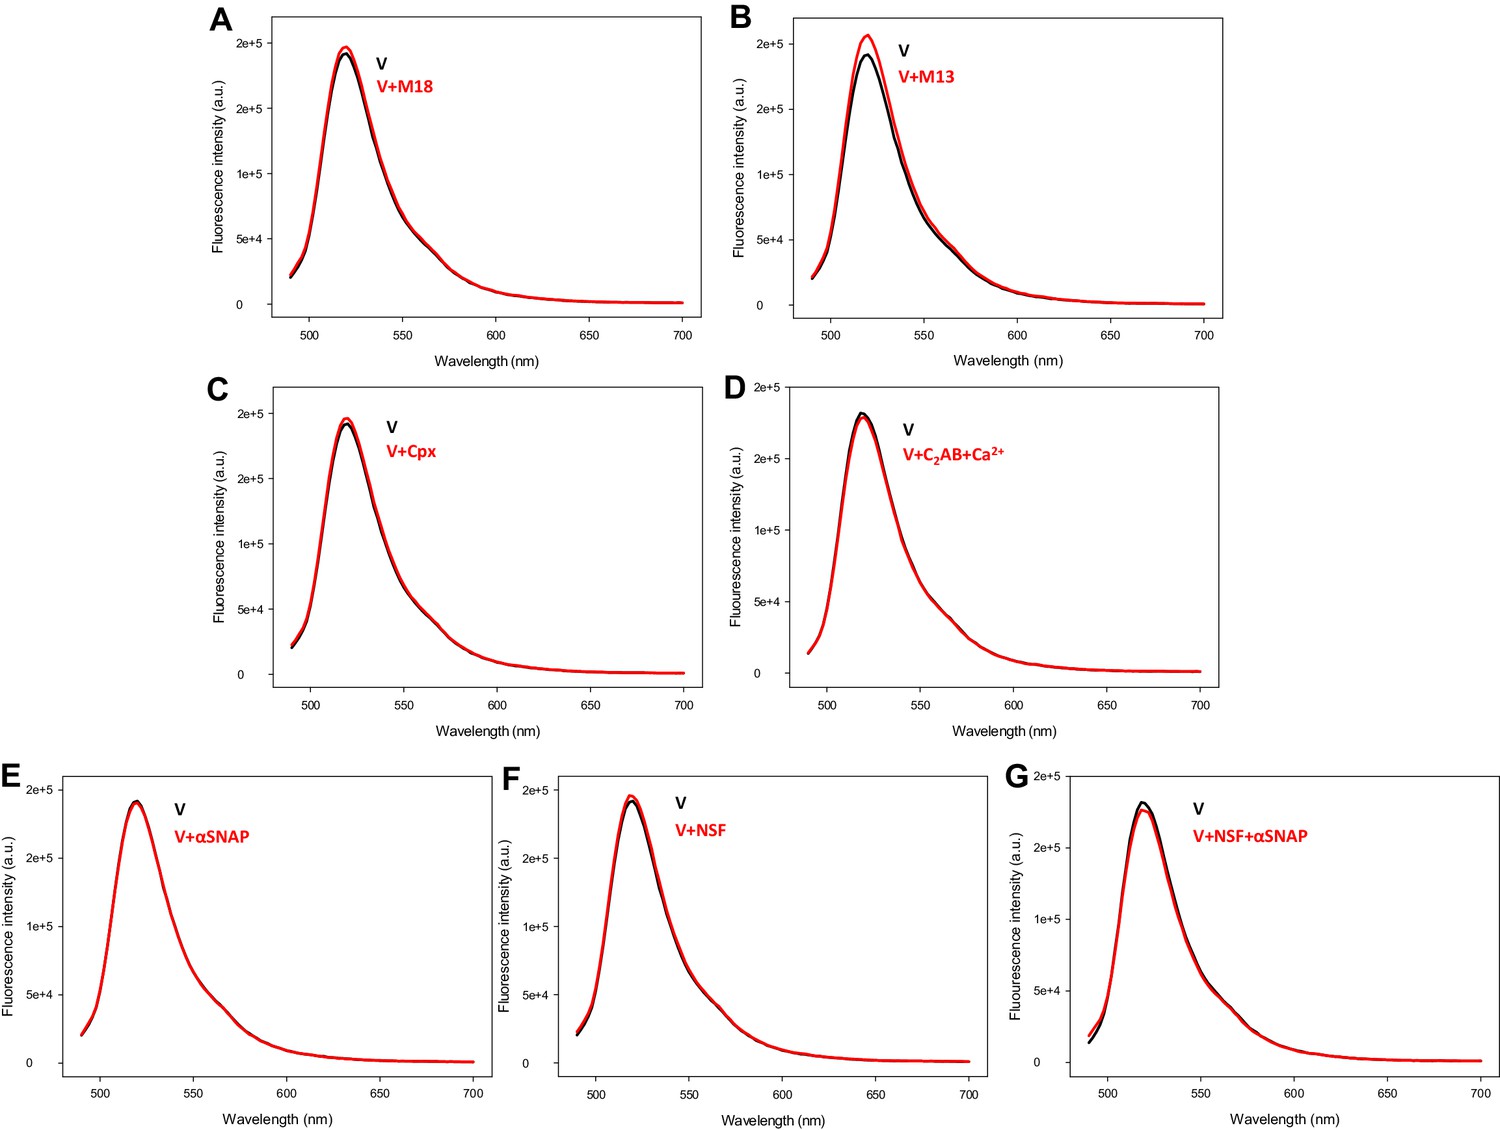
Control experiments acquired to assess the effects of various factors on the fluorescence emission spectra of V-liposomes containing Alexa488-synaptobrevin.
Spectra were acquired before (V) (black traces) or after (red traces) addition of Munc18-1 (M18), Munc13-1 C1C2BMUNC2C (M13), complexin-1 (Cpx), Ca2+-bound synaptotagmin-1 C2AB, NSF, αSNAP or NSF+αSNAP.
Figure 2—figure supplement 2

Syb49-93 strongly accelerates trans-SNARE complex assembly.
(A) Kinetic assays where the donor fluorescence emission intensity was measured to monitor trans-SNARE complex assembly as a function of time upon mixing V- and T-liposomes (1:4 ratio) in the absence (black) and presence (red) of Syb49-93. (B) Analogous experiments performed to monitor trans-SNARE complex assembly between VSyt1- and T-liposomes (1:4 ratio) in the absence (black) and presence (red) of Syb49-93.
Figure 2—figure supplement 3
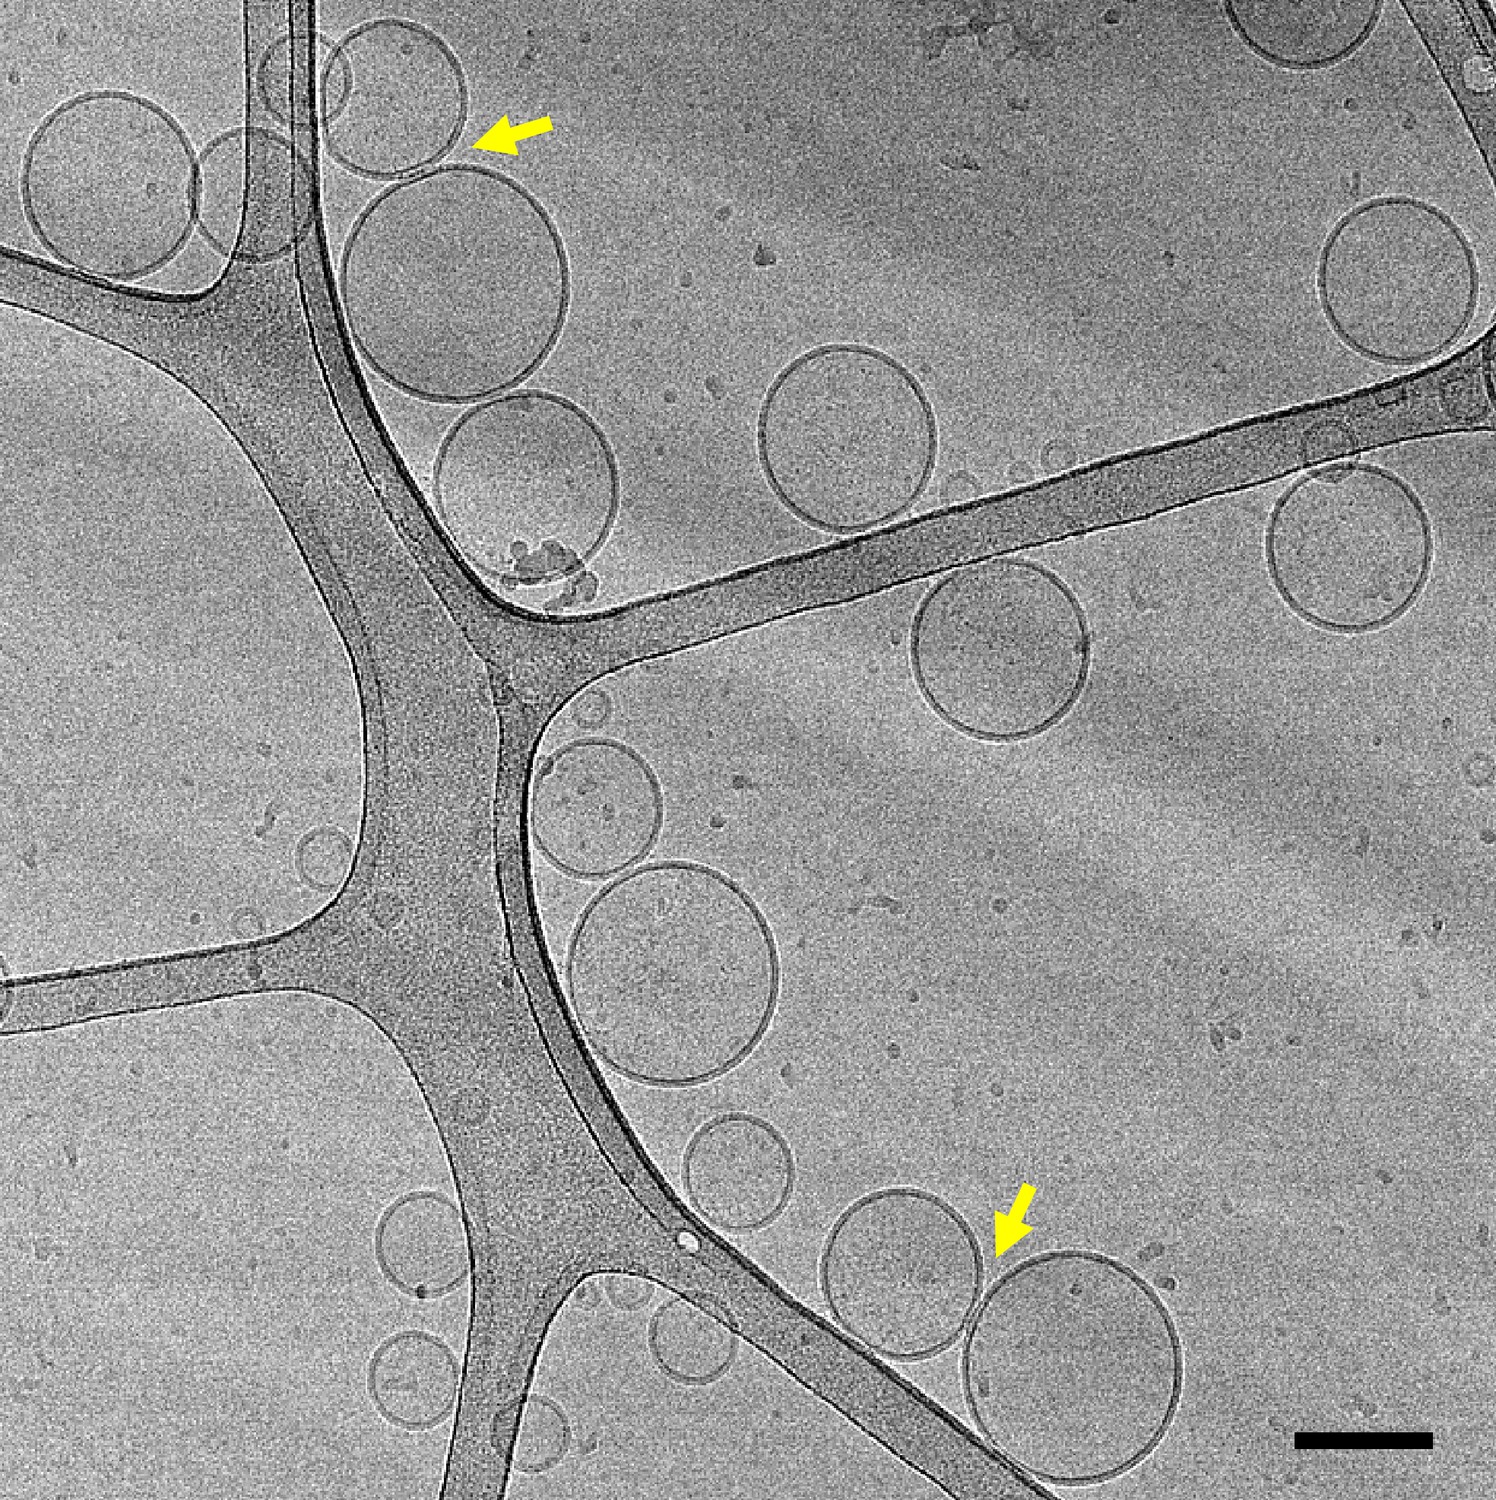
Representative cryo-EM image of a mixture of V- and T-liposomes (1:4 ratio) that had been incubated with Syb49-93 for 5 hours before rapid freezing (scale bar, 100 nm).
The yellow arrows point to somewhat extended interfaces between liposomes.
Figure 2—figure supplement 4
Additional supporting fluorescence emission spectra.
(A) Fluorescence emission spectra (excitation at 468 nm) of separate samples of V-liposomes containing Alexa488-synaptobrevin (green trace) and T-liposomes containing TMR-syntaxin-1-SNAP-25m (1:4 V- to T-liposome ratio) (red trace) acquired at the same concentrations used for the spectra of Figure 2B–E. The blue curve shows the addition of the red and green curves. (B) Analogous fluorescence emission spectra acquired on a mixture of V-liposomes containing Alexa488-synaptobrevin and T-liposomes containing TMR-syntaxin-1-SNAP-25 WT (1:4 V- to T-liposome ratio) that had been incubated overnight at 4°C with Syb49-93 before (black trace) and after adding NSF-αSNAP plus ATP and Mg2+ (red trace). The blue curve shows a control spectrum obtained by adding spectra acquired separately for V- and T-liposomes at the same concentrations. These experiments are analogous to those shown in Figure 2B but using WT SNAP-25 instead of SNAP-25m, and performing the incubation overnight at low temperature to form trans-SNARE complexes while preventing membrane fusion. (C) Fluorescence emission spectra of a mixture of VSyt1-liposomes containing Alexa488-synaptobrevin and T-liposomes containing TMR-syntaxin-1-SNAP-25m (1:4 V- to T-liposome ratio) that had been incubated with Syb49-93 overnight at 4°C (black trace), and of the same sample after adding NSF-αSNAP plus ATP and Mg2+ (red trace). The blue curve shows a control spectrum obtained by adding spectra acquired separately for VSyt1- and T-liposomes at the same concentrations. All spectra in (B,C) were corrected for dilution caused by addition of reagents.
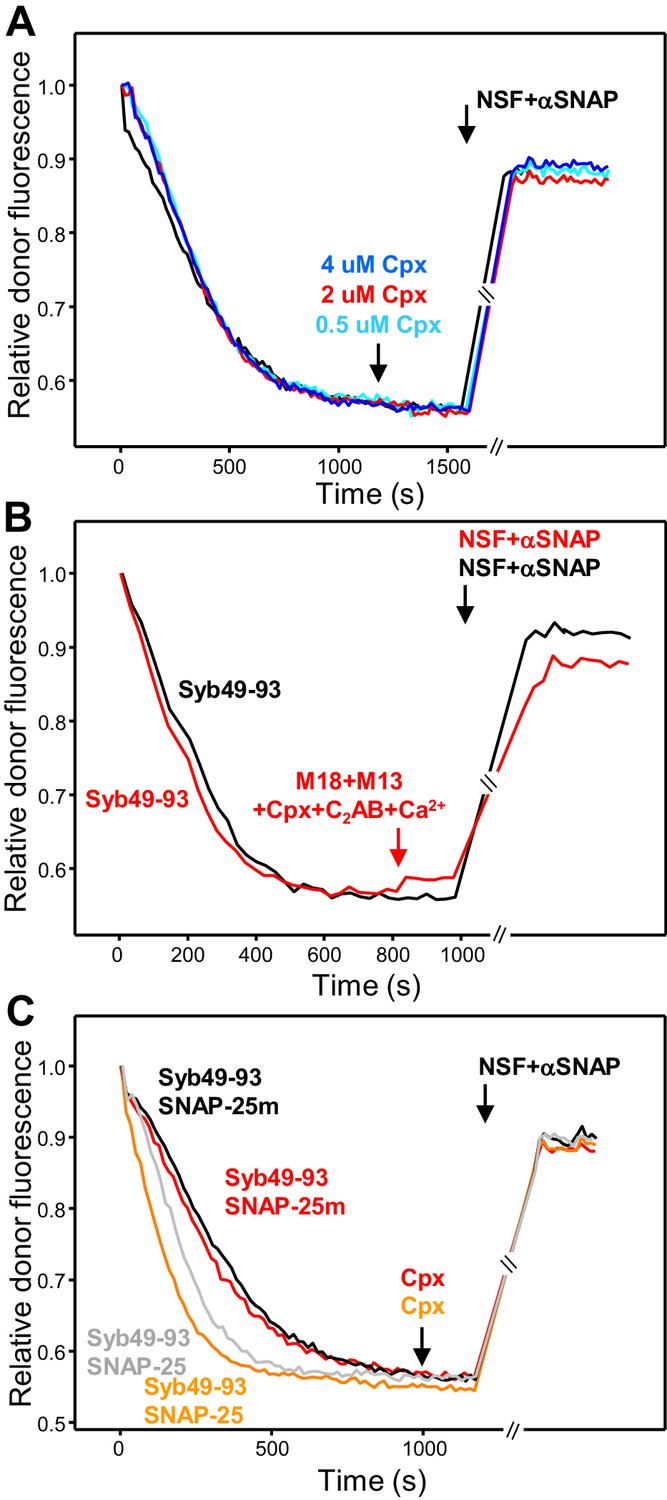
Figure 3 with 2 supplements
Influence of Munc18-1, Munc13-1 C1C2BMUNC2C, complexin-1 and synaptotagmin-1 on trans-SNARE complex assembly-disassembly in the presence of NSF-αSNAP.
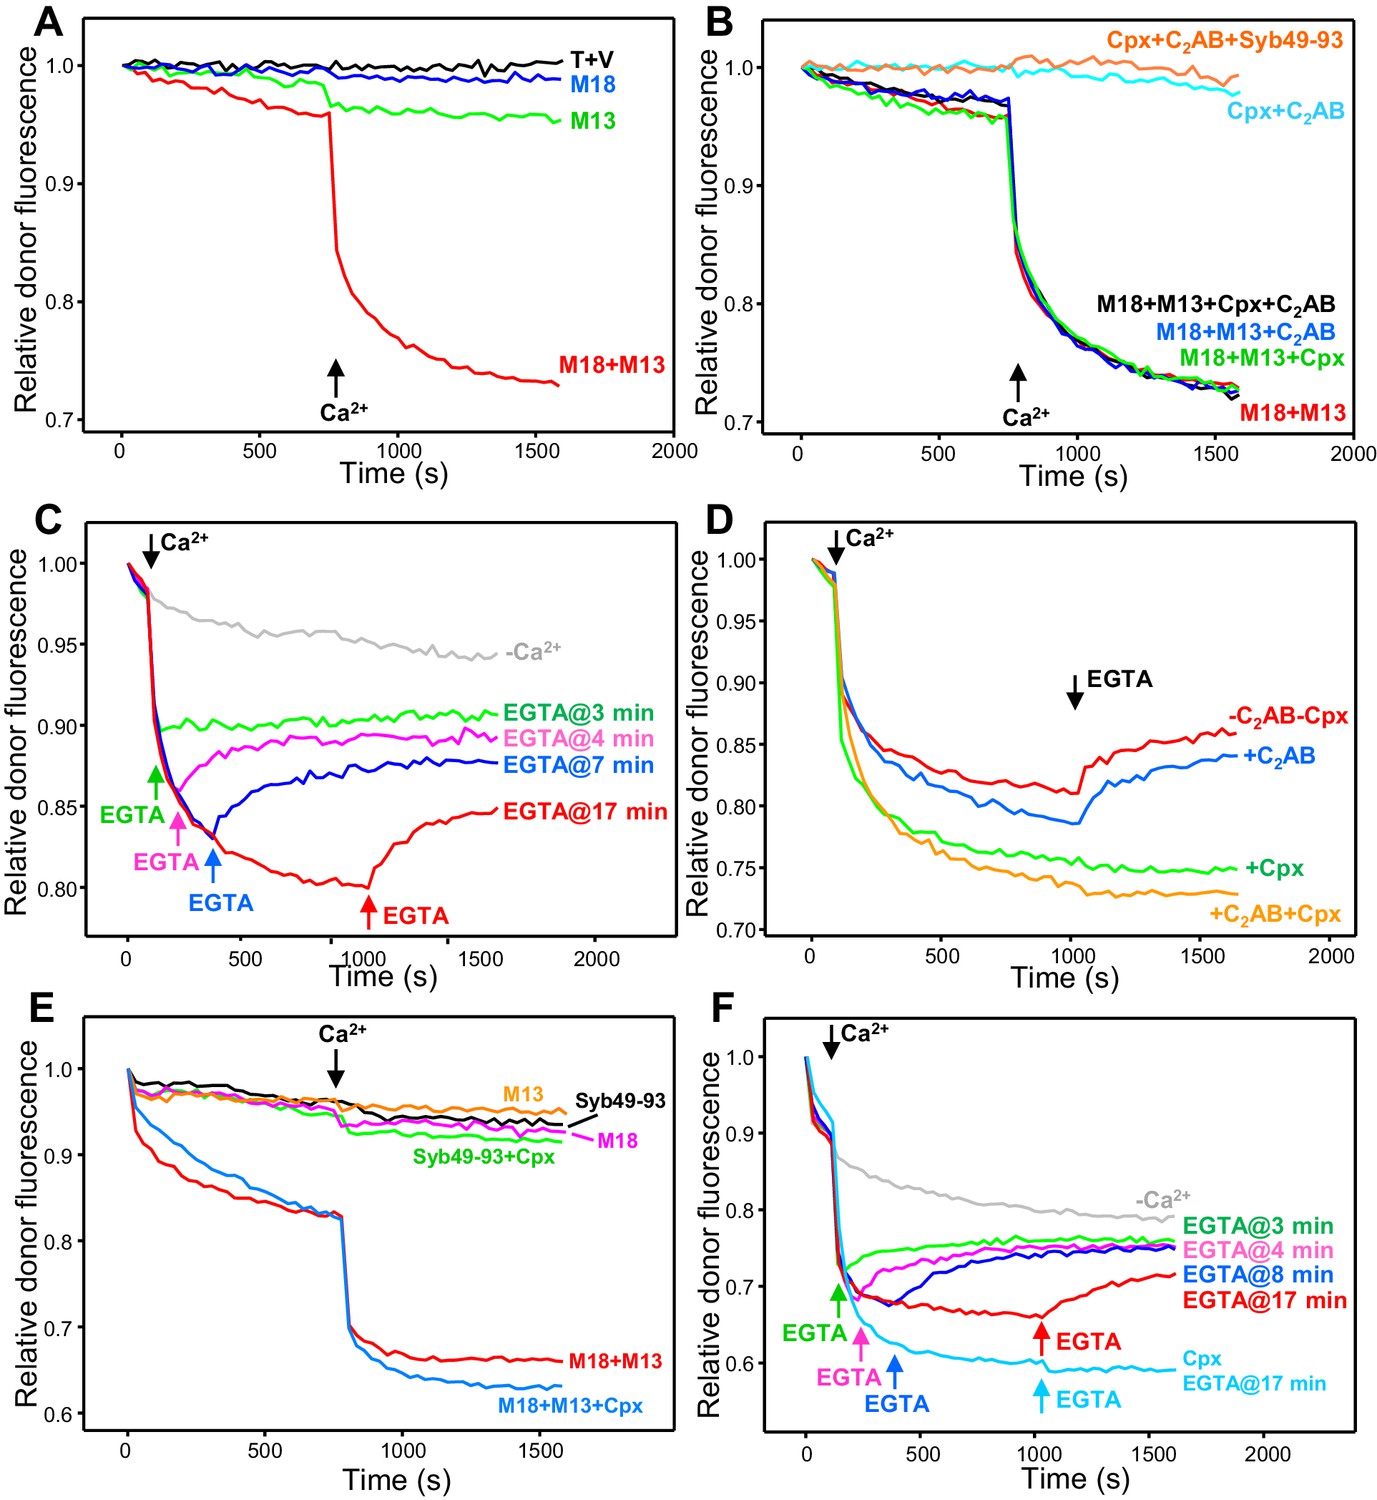
(A,B) Kinetic assays monitoring trans-SNARE complex assembly between V- and T-liposomes (1:4 ratio) in the presence of NSF-αSNAP from the decrease in the donor fluorescence emission intensity. The experiments were performed in the absence of other proteins (T + V) or in the presence of different combinations of Munc18-1 (M18), Munc13-1 C1C2BMUNC2C (M13), complexin-1 (Cpx), synaptotagmin-1 C2AB and Syb49-93, as indicated by the colors. Experiments were started in 100 μM EGTA and Ca2+ (600 μM) was added after 750 s. (C) Analogous kinetic assays performed in the presence of Munc18-1, Munc13-1 C1C2BMUNC2C, NSF-αSNAP and 100 μM EGTA, but adding 240 μM Ca2+ at 2 min to stimulate trans-SNARE complex assembly and adding 500 μM EGTA at different times to chelate the Ca2+ and interrogate whether there is trans-SNARE complex disassembly. An experiment that was also started in 100 μM EGTA but without addition of Ca2+ or EGTA at later times (gray trace) is shown for comparison. (D) Experiments analogous to those of (C), with addition of 240 μM Ca2+ at 2 min and 500 μM EGTA at 17 min, performed in the absence or presence of complexin-1 and/or synaptotagmin-1 C2AB. (E) Kinetic assays monitoring trans-SNARE complex assembly between VSyt1- and T-liposomes (1:4 ratio) in the presence of NSF-αSNAP and different combinations of Munc18-1, Munc13-1 C1C2BMUNC2C, complexin-1 and Syb49-93, as indicated by the colors. Experiments were started in 100 μM EGTA and Ca2+ (600 μM) was added after 750 s. (F) Kinetic assays analogous to those of (E) performed in the presence of Munc18-1, Munc13-1 C1C2BMUNC2C, NSF-αSNAP and 100 μM EGTA, but adding 240 μM Ca2+ at 2 min to stimulate trans-SNARE complex assembly and adding 500 μM EGTA at different times to chelate the Ca2+ and interrogate whether there is trans-SNARE complex disassembly. An experiment that was also started in 100 μM EGTA but without addition of Ca2+ or EGTA at later times (gray trace) is shown for comparison. The light blue trace shows an additional experiment started in 100 μM EGTA in the presence of complexin-1, with addition of 240 μM Ca2+ at 2 min and 500 μM EGTA at 17 min. All experiments were performed in the presence of Mg2+ and ATP. For all traces shown in (A–F), fluorescence emission intensities were normalized with the intensity observed in the first point and corrected for the dilution caused by the addition of reagents.
Figure 3—figure supplement 1
Complexin-1 increases the efficiency of Ca2+-independent trans-SNARE complex assembly between VSyt1- and T-liposomes in the presence of NSF-αSNAP.
The traces show kinetic assays monitoring trans-SNARE complex assembly between VSyt1- and T-liposomes (1:4 ratio) in the presence of Munc18-1, Munc13-1 C1C2BMUNC2C, NSF-αSNAP and 100 μM EGTA, without (red trace) or with complexin-1 (Cpx) (blue trace). The experiments are analogous to those of Figure 3E (red and blue traces), but without addition of Ca2+.
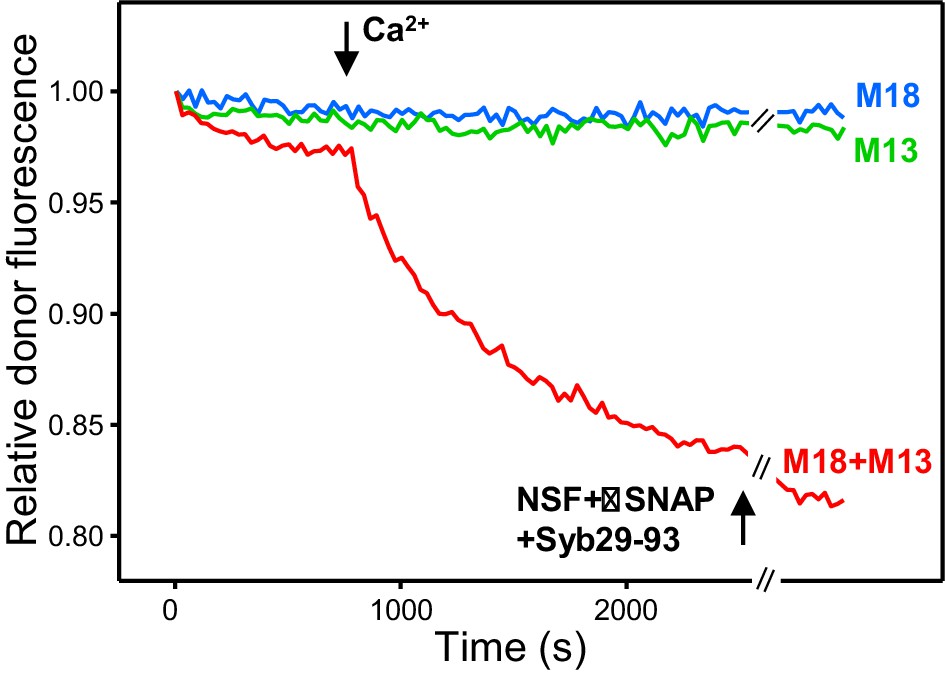
Figure 3—figure supplement 2
Ca2+-dependent fusion between VSyt1- and T-liposomes.
(A,B) Lipid mixing (A) between VSyt1-liposomes (synaptobrevin-to-lipid ratio 1:10,000; synaptotagmin-1-to-lipid ratio 1:1,000) and T-liposomes was monitored from the fluorescence de-quenching of Marina Blue lipids and content mixing (B) was monitored from the increase in the fluorescence signal of Cy5-streptavidin trapped in the V-liposomes caused by FRET with PhycoE-biotin trapped in the T-liposomes upon liposome fusion. The assays were performed in the presence of NSF-αSNAP, and Munc18-1 (M18), Munc13-1 C1C2BMUNC2C (M13) or both. Experiments were started in the presence of 100 μM EGTA and 5 μM streptavidin, and Ca2+ (600 μM) was added at 300 s.
Figure 4 with 1 supplement
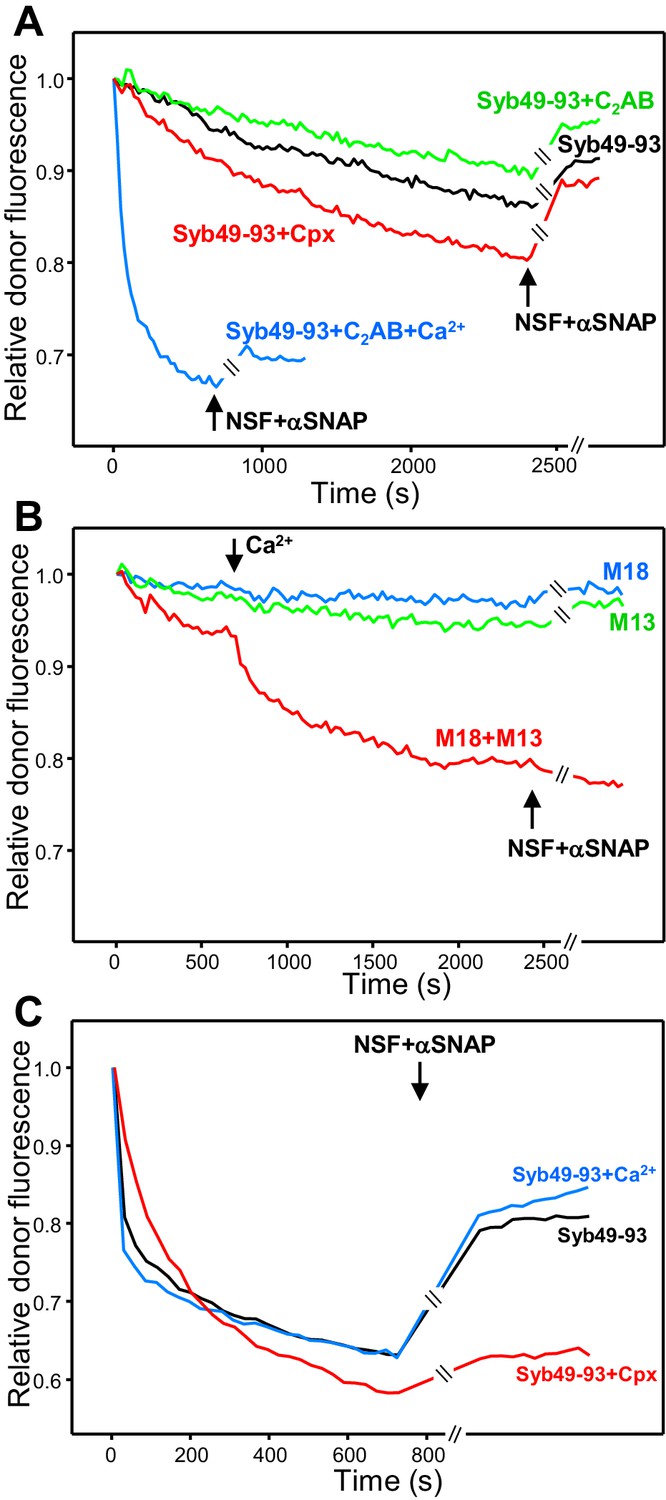
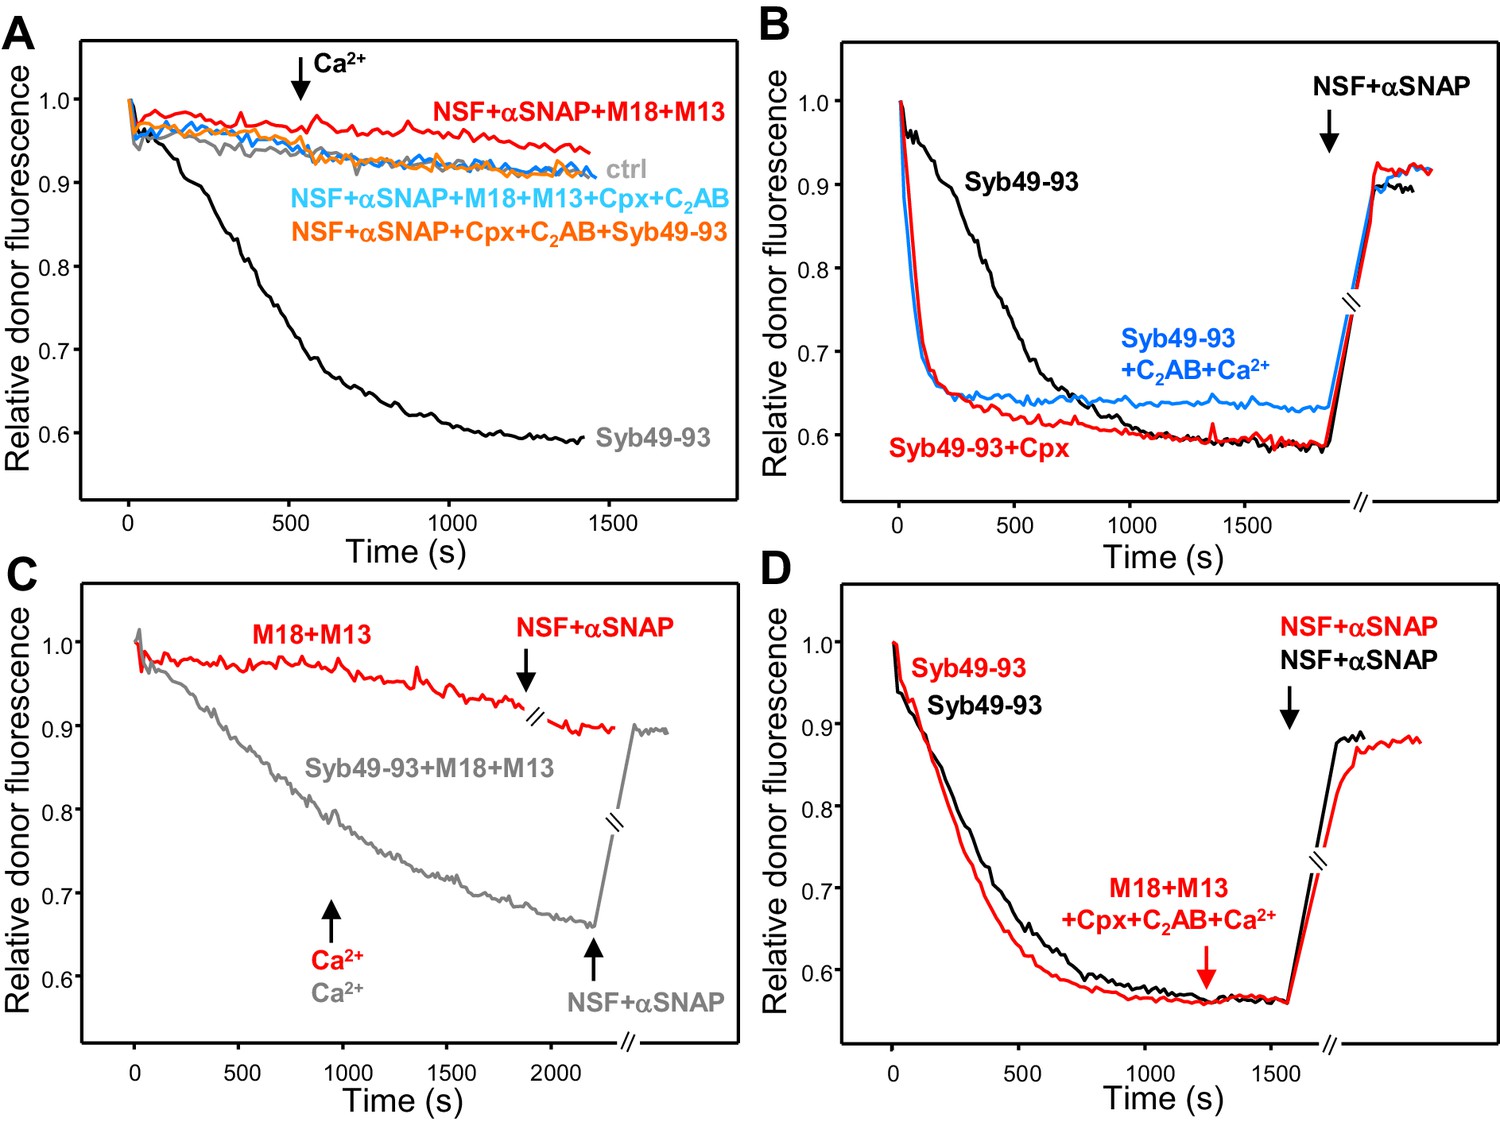
Influence of Munc18-1, Munc13-1 C1C2BMUNC2C, complexin-1 and synaptotagmin-1 on trans-SNARE complex assembly in the absence of NSF-αSNAP and on protection against disassembly upon addition of NSF-αSNAP.
(A) Kinetic assays monitoring trans-SNARE complex assembly upon mixing V- and T-liposomes (1:4 ratio) in the presence of Syb49-93 and disassembly upon addition of NSF-αSNAP (indicated by the arrows), from the changes in the donor fluorescence emission intensity. The experiments included Syb49-93 alone (black trace) or together with complexin-1 (Cpx) (red trace), synaptotagmin-1 C2AB (green trace) and synaptotagmin-1 plus Ca2+ (blue trace). (B) Kinetic assays analogous to those of (A) but performed in the absence of Syb49-93 and the presence of Munc18-1 (M18), Munc13-1 C1C2BMUNC2C (M13) or both (blue, green and red traces, respectively). Experiments were started in 100 μM EGTA and Ca2+ (600 μM) was added after 700 s. (C) Analogous kinetic assays monitoring trans-SNARE complex assembly between VSyt1- and T-liposomes (1:4 ratio) in the presence of Syb49-93 alone (black trace) or together with Ca2+ (blue trace) or complexin-1 (Cpx) (red trace), and addition of NSF-αSNAP at the end (black arrow). In the experiments shown in (A–C), we stopped monitoring the donor fluorescence intensity to add the reagents for disassembly, and a few minutes elapsed until we started to monitor the reaction again (indicated by the double slanted bars on the traces and on the x axis). For all traces shown in (A–C), fluorescence emission intensities were normalized with the intensity observed in the first point and corrected for the dilution caused by the addition of reagents.
Figure 4—figure supplement 1
The SNARE motif of synaptobrevin does not affect the results observed upon addition of NSF-αSNAP to trans-SNARE complexes formed in the presence of Munc18-1, Munc13-1 C1C2BMUNC2C and Ca2+.
The plots show kinetic assays monitoring trans-SNARE complex assembly upon mixing V- and T-liposomes (1:4 ratio) in the presence of Munc18-1 (M18), Munc13-1 C1C2BMUNC2C (M13) or both (blue, green and red traces, respectively). Experiments were started in 100 μM EGTA and Ca2+ (600 μM) was added after 700 s. NSF-αSNAP were added at the end together with a fragment spanning the synaptobrevin SNARE motif (Syb29-93) (black arrow). The experiments are analogous to those of Figure 4B except for the inclusion of Syb29-93 at the end. Note that Syb (Araç et al., 2006) was added in large excess (2 μM) compared to the synaptobrevin anchored on the V-liposomes (6.25 nM) to hinder the potential re-assembly of trans-SNARE complexes.
Figure 5 with 5 supplements

Quantitative analysis of how Munc18-1, Munc13-1 C1C2BMUNC2C, complexin-1 and synaptotagmin-1 protect pre-formed trans-SNARE complexes against disassembly by NSF-αSNAP.
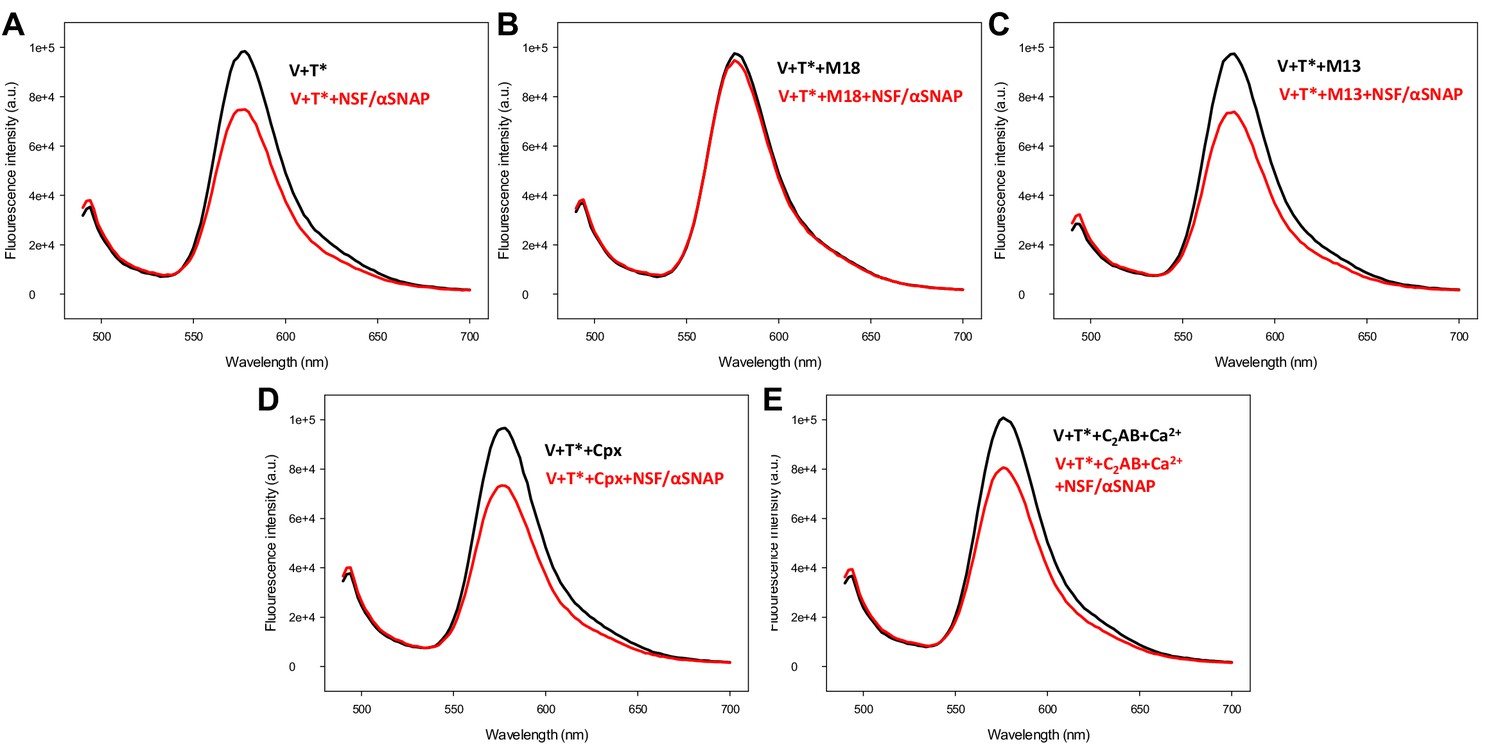
(A) Fluorescence emission spectra of mixtures of V-liposomes containing Alexa488-synaptobrevin and T-liposomes containing TMR-syntaxin-1-SNAP-25m (1:4 V- to T-liposome ratio) that were incubated for five hours with Syb49-93; Munc18-1 (M18), Munc13-1 C1C2BMUNC2C (M13), complexin-1 (Cpx), synaptotagmin-1 C2AB (C2AB) and Ca2+ were then added and, after an additional incubation for five minutes, spectra were acquired before (black trace) or after (red trace) addition of NSF-αSNAP. (B) Bar diagram illustrating the ability of Munc18-1, Munc13-1 C1C2BMUNC2C, complexin-1, synaptotagmin-1 C2AB and Ca2+ to protect pre-formed trans-SNARE complexes against disassembly by NSF-αSNAP. As in (A), V- and T-liposomes were incubated for five hours with Syb49-93 to preform trans-SNARE complexes and then they were incubated for five minutes with different combinations of Munc18-1, Munc13-1 C1C2BMUNC2C, complexin-1, synaptotagmin-1 C2AB and Ca2+. Fluorescence emission spectra were acquired before and after addition of NSF-αSNAP and the ratio r between the donor fluorescence intensities at 518 nm measured after and before NSF-αSNAP addition was calculated. Representative examples of the spectra acquired under different conditions are shown in Figure 5—figure supplement 1. (C) Bar diagram illustrating the ability of Munc18-1, Munc13-1 C1C2BMUNC2C, complexin-1 and Ca2+ to protect pre-formed trans-SNARE complexes between VSyt1- and T-liposomes against disassembly by NSF-αSNAP. Similar to (B), VSyt1- and T-liposomes were incubated with Syb49-93 (but for 24 hr at 4°C) to preform trans-SNARE complexes, and then they were incubated for five minutes with different combinations of Munc18-1, Munc13-1 C1C2BMUNC2C, complexin-1 and Ca2+. Fluorescence emission spectra were acquired before and after addition of NSF-αSNAP and the ratio r between the donor fluorescence intensities at 518 nm measured after and before NSF-αSNAP addition was calculated. Representative examples of the spectra acquired under different conditions are shown in Figure 5—figure supplement 4. In (B,C), ‘No additions’ indicates experiments where none of these factors were included before addition of NSF-αSNAP. Control experiments with no additions and replacing ATP with ATPγS or replacing Mg2+ with EDTA were also performed. All experiments were performed in triplicate. Values indicate means ±standard deviations. A few examples of statistical significance are indicated to illustrate which differences among the r values obtained under different conditions are meaningful. Statistical significance and P values were determined by one-way analysis of variance (ANOVA) with Holm-Sidak test (*p<0.05; ***p<0.001).
Figure 5—figure supplement 1
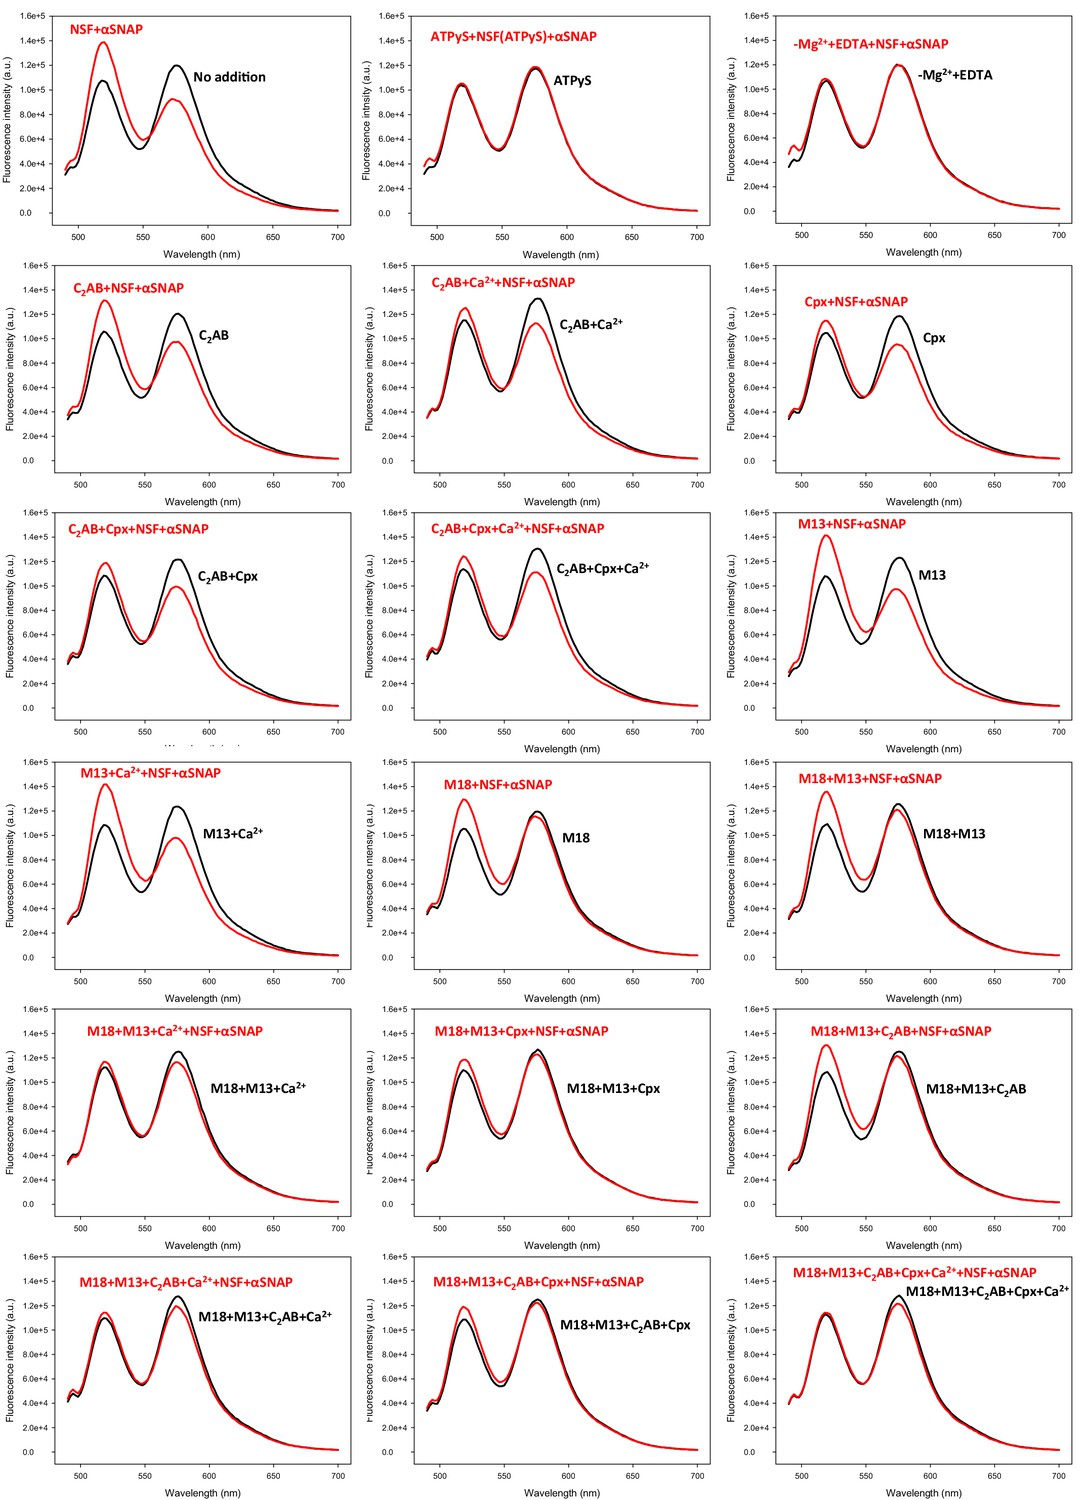
Representative fluorescence emission spectra used in the experiments of Figure 5B to obtain a quantitative measurement of how Munc18-1, Munc13-1, complexin-1, synaptotagmin-1 and Ca2+ in different combinations protect pre-formed trans-SNARE complexes against disassembly by NSF-αSNAP.
V- and T-liposomes were incubated for five hours with Syb49-93 to preform trans-SNARE complexes and then they were incubated for five minutes with different combinations of Munc18-1 (M18), Munc13-1 C1C2BMUNC2C (M13), complexin-1 (Cpx), synaptotagmin-1 C2AB (C2AB) and Ca2+. Black curves show spectra acquired before addition of NSF-αSNAP, and red curves the spectra obtained after addition of NSF-αSNAP.
Figure 5—figure supplement 2
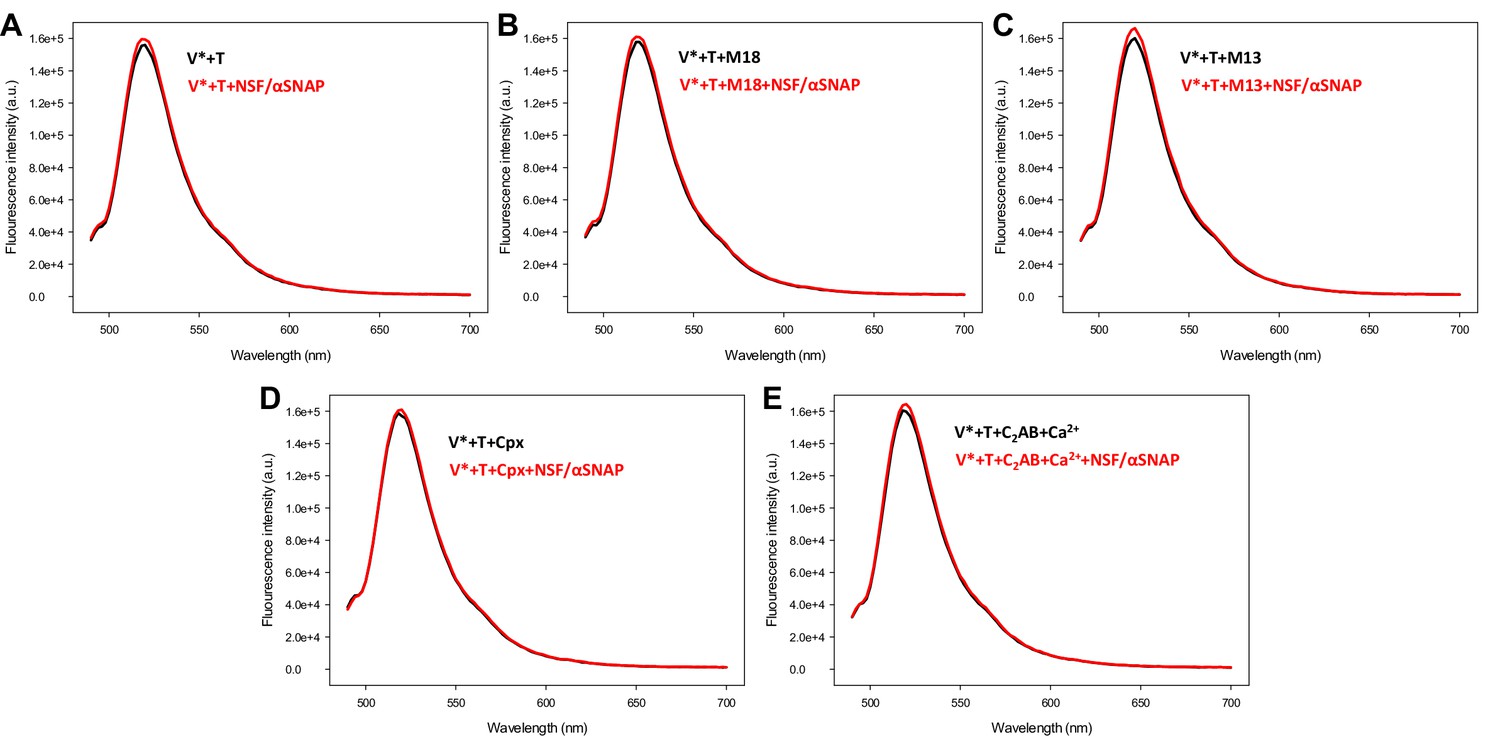
Control spectra acquired to assess the effects of various factors on the fluorescence emission spectra of V-liposomes incorporated into trans-SNARE complexes in the absence of FRET.
V-liposomes containing Alexa488-synaptobrevin (V*) were incubated for five hours with Syb49-93 and T-liposomes containing syntaxin-1-SNAP-25m (T) (1:4 V- to T-liposome ratio). The mixture was then incubated with Munc18-1 (M18), Munc13-1 C1C2BMUNC2C (M13), complexin-1 (Cpx) or synaptotagmin-1 C2AB/Ca2+ for 5 minutes, and spectra were acquired before (black traces) or after (red traces) addition of NSF-αSNAP.
Figure 5—figure supplement 3
Control spectra acquired to assess the effects of various factors on the fluorescence emission spectra of T-liposomes incorporated into trans-SNARE complexes in the absence of FRET.
V-liposomes containing synaptobrevin (V) were incubated for five hours with Syb49-93 and T-liposomes containing TMR-syntaxin-1-SNAP-25m (T*) (1:4 V- to T-liposome ratio). The mixture was then incubated with Munc18-1 (M18), Munc13-1 C1C2BMUNC2C (M13), complexin-1 (Cpx) or synaptotagmin-1 C2AB/Ca2+ for five minutes, and spectra were acquired before (black traces) or after (red traces) addition of NSF-αSNAP.
Figure 5—figure supplement 4
Representative fluorescence emission spectra used in the experiments of Figure 5C to obtain a quantitative measurement of how Munc18-1, Munc13-1, complexin-1 and Ca2+ in different combinations protect pre-formed trans-SNARE complexes between VSyt1- and T-liposomes against disassembly by NSF-αSNAP.
VSyt1- and T-liposomes were incubated with Syb49-93 (but for 24 hr at 4°C) to preform trans-SNARE complexes and then they were incubated for five minutes with different combinations of Munc18-1, Munc13-1 C1C2BMUNC2C, complexin-1 and Ca2+. Black curves show spectra acquired before addition of NSF-αSNAP, and red curves the spectra obtained after addition of NSF-αSNAP.
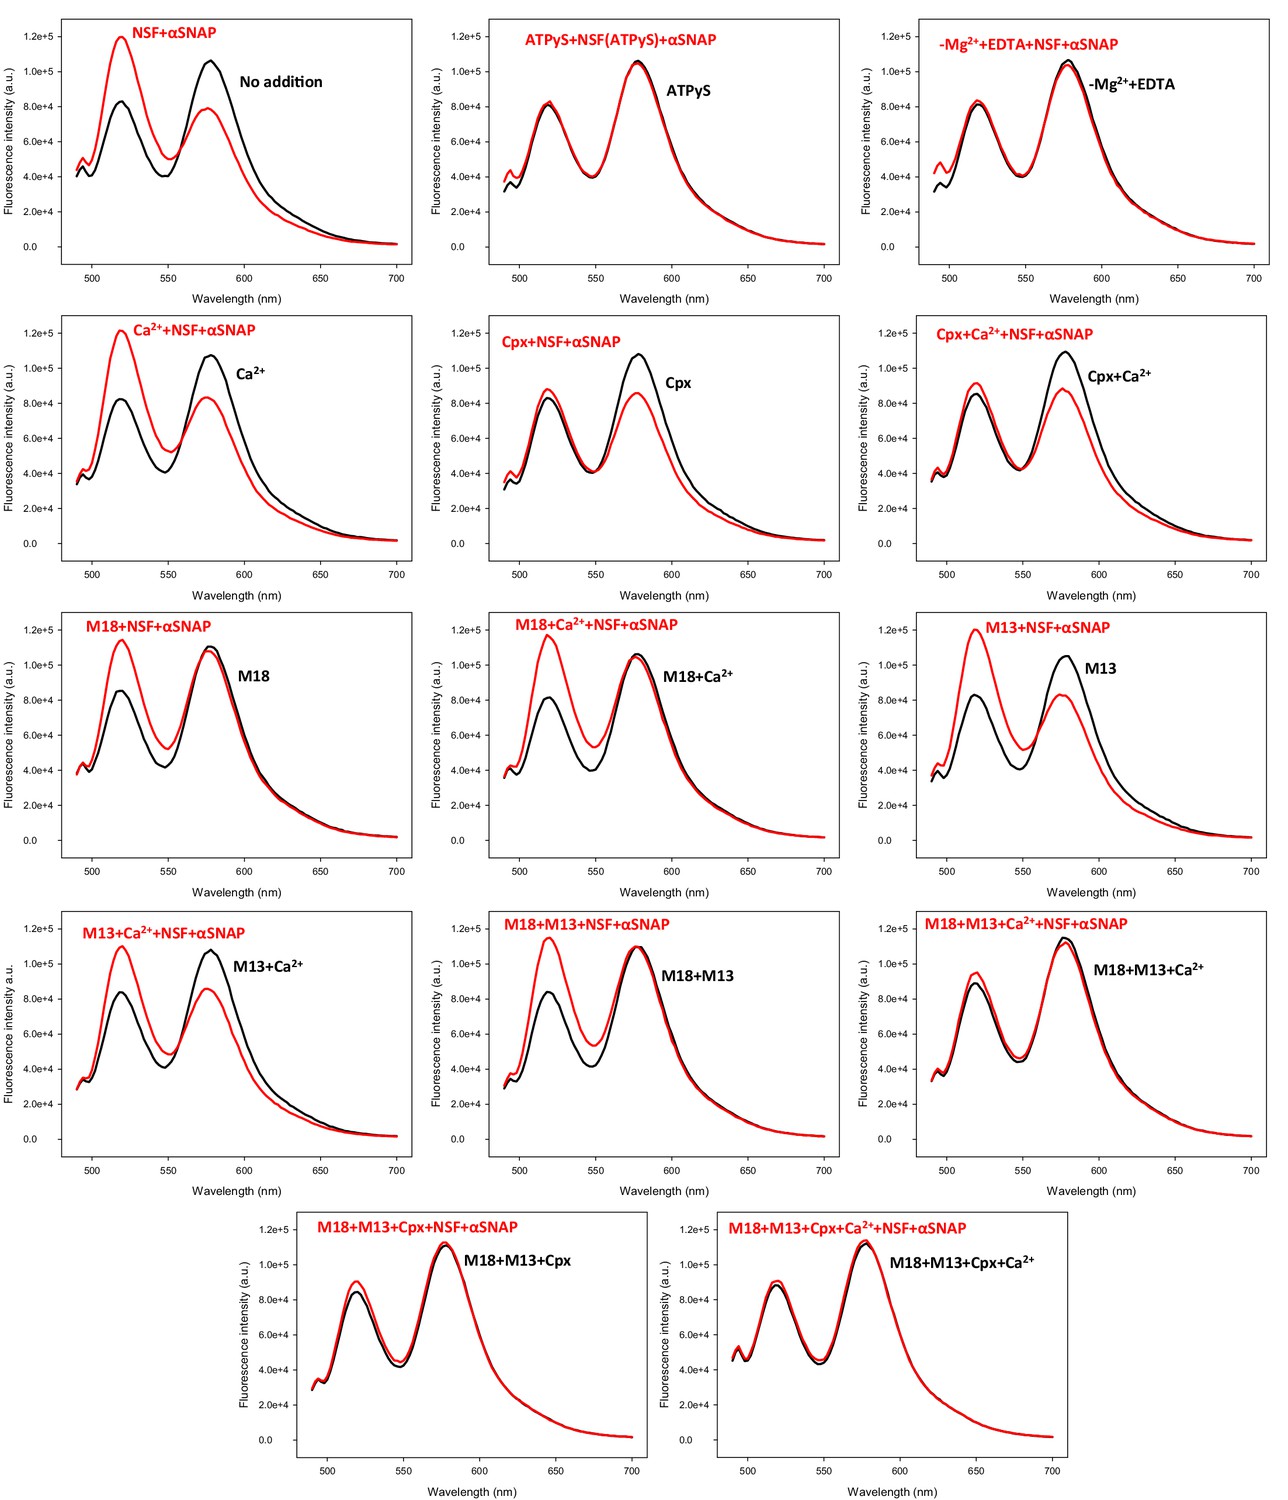
Figure 5—figure supplement 5
Complexin-1 concentration dependence of protection of trans-SNARE complexes against disassembly by NSF-αSNAP.
Protection experiments with pre-formed trans-SNARE complexes between VSyt1- and T-liposomes analogous to those of Figure 5C were performed by adding different complexin-1 concentrations, incubating for five minutes and acquiring fluorescence emission spectra before and after addition of NSF-αSNAP. The ratio r between the donor fluorescence intensities at 518 nm measured after and before NSF-αSNAP addition was calculated. All experiments were performed in triplicate. Values indicate means ±standard deviations.
Figure 6 with 1 supplement
Munc18-1, Munc13-1 C1C2BMUNC2C, complexin-1 and synaptotagmin-1 C2AB do not decrease the overall amount of cis-SNARE complex disassembly caused by NSF-αSNAP.
(A) Kinetic assays monitoring changes in the donor fluorescence emission intensity due to cis-SNARE complex formation upon mixing V-liposomes containing Alexa488-synaptobrevin with an excess of TMR-labeled syntaxin-1 (2–253) and SNAP-25m in the presence of NSF-αSNAP with no additions (ctrl) (light gray trace) or with different combinations of Munc18-1 (M18), Munc13-1 C1C2BMUNC2C (M13), complexin-1 (Cpx) and synaptotagmin-1 C2AB as indicated. Ca2+ was added at 550 s. For comparison purposes, the dark gray trace shows a cis-SNARE complex assembly reaction performed in the presence of Syb49-93 and absence of NSF-αSNAP. (B) Kinetic assays of cis-SNARE complex assembly analogous to those of (A), but performed in the absence of NSF-αSNAP and the presence of Syb49-93 alone (black trace) or together with complexin-1 (Cpx) (red trace) or synaptotagmin-1 C2AB plus Ca2+ (blue trace). NSF-αSNAP were added when the reactions reached a plateau (black arrow) to monitor cis-SNARE complex disassembly. (C) Kinetic assays analogous to those in (B), but in the presence of Munc18-1 (M18) and Munc13-1 C1C2BMUNC2C (M13) without (red trace) or with (dark gray trace) Syb49-93. Ca2+ was added after 950 s. (D) Kinetic assays where cis-SNARE complex formation was initially catalyzed by Syb49-93 and, after reaching a plateau, Munc18-1, Munc13-1 C1C2BMUNC2C, complexin-1, synaptotagmin-1 C2AB and Ca2+ were added (red arrow); after five minutes, NSF-αSNAP were added to test for disassembly (red trace). The black trace shows a control experiment where the four proteins were not included before adding NSF-αSNAP. In the experiments shown in (C–D), we stopped monitoring the donor fluorescence intensity to add the reagents for disassembly, and a few minutes elapsed until we started to monitor the reaction again (indicated by the double slanted bars on the traces and on the x axis). For all traces of (A–D), fluorescence emission intensities were normalized with the intensity observed in the first point and corrected for the dilution caused by the addition of reagents.
Figure 6—figure supplement 1
Munc18-1, Munc13-1 C1C2BMUNC2C, complexin-1 and synaptotagmin-1 C2AB do not protect cis-SNARE complexes against disassembly by NSF-αSNAP.
(A) Kinetic assays where cis-SNARE complex formation was catalyzed by Syb49-93, as in Figure 6D, and different concentrations of complexin-1 (Cpx) were added five minutes before disassembly with NSF-αSNAP. (B) Kinetic assays analogous to those of Figure 6D, but using WT SNAP-25 instead of SNAP-25m to ensure that the mutation in SNAP-25m did not affect the disassembly of cis-SNARE complexes by NSF-αSNAP in the presence of Munc18-1, Munc13-1 C1C2BMUNC2C, complexin-1, synaptotagmin-1 C2AB and Ca2+. (C) Kinetic assays analogous to those of panels (A), but adding 1 μM complexin-1 five minutes before disassembly with NSF-αSNAP (red and orange traces). In these experiments, the concentrations of NSF and αSNAP were 0.1 μM and 0.5 μM, respectively, which were lower than those of our standard conditions (0.5 μM and 2 μM, respectively) to test whether complexin-1 might hinder disassembly at a higher molar ratio with respect to αSNAP. The experiments were performed with SNAP-25m (black and red traces) or WT SNAP-25 (gray and orange traces). The black and gray traces are controls where complexin-1 was not added. In the experiments shown in (A–C), we stopped monitoring the donor fluorescence intensity to add the reagents for disassembly, and a few minutes elapsed until we started to monitor the reaction again (indicated by the double slanted bars on the traces and on the x axis). For all traces of (A–C), fluorescence emission intensities were normalized with the intensity observed in the first point and corrected for the dilution caused by the addition of reagents to make the data comparable.
Figure 7

Models illustrating the different geometric constraints of cis- and trans-SNARE complex disassembly.
(A,B) Models showing ribbon diagrams of the cryo-electron microscopy structure of the 20S complex (PDB accession code 3J96) (Zhao et al., 2015) assembled on a cis-SNARE complex on one membrane (A) or on a trans-SNARE complex between two membranes (B). Synaptobrevin is in red, syntaxin-1 in yellow, SNAP-25 in green, NSF in gray and the four molecules of αSNAP in cyan, orange, blue and pink. The positions of the αSNAP N-terminal hydrophobic loops (N-loops) are indicated. The orientation of the 20S complex in (A) was chosen to favor simultaneous interactions of the N-loops of the four αSNAP molecules with the membrane. In (B), the orientation of the 20S complex is arbitrary and is meant to illustrate the difficulty of simultaneous interactions of the N-loops from the four αSNAP molecules with membranes in the trans configuration. Note that, at the same time, the apposition of both membranes may enhance the affinity of Munc18-1, Munc13-1, synaptotagmin-1 and complexin-1 for SNARE complexes in the trans configuration due to simultaneous interactions with the membranes that are not possible or less favorable in the cis configuration, while the SNARE four-helix bundle is likely to be only partially assembled, which may weaken binding to αSNAP.
Additional files
-
Transparent reporting form
- https://doi.org/10.7554/eLife.38880.022
Download links
A two-part list of links to download the article, or parts of the article, in various formats.
Downloads (link to download the article as PDF)
Open citations (links to open the citations from this article in various online reference manager services)
Cite this article (links to download the citations from this article in formats compatible with various reference manager tools)
Multiple factors maintain assembled trans-SNARE complexes in the presence of NSF and αSNAP
eLife 8:e38880.
https://doi.org/10.7554/eLife.38880


