The flow responsive transcription factor Klf2 is required for myocardial wall integrity by modulating Fgf signaling
- Max Planck Institute for Heart and Lung Research, Germany
Figures
Figure 1 with 4 supplements
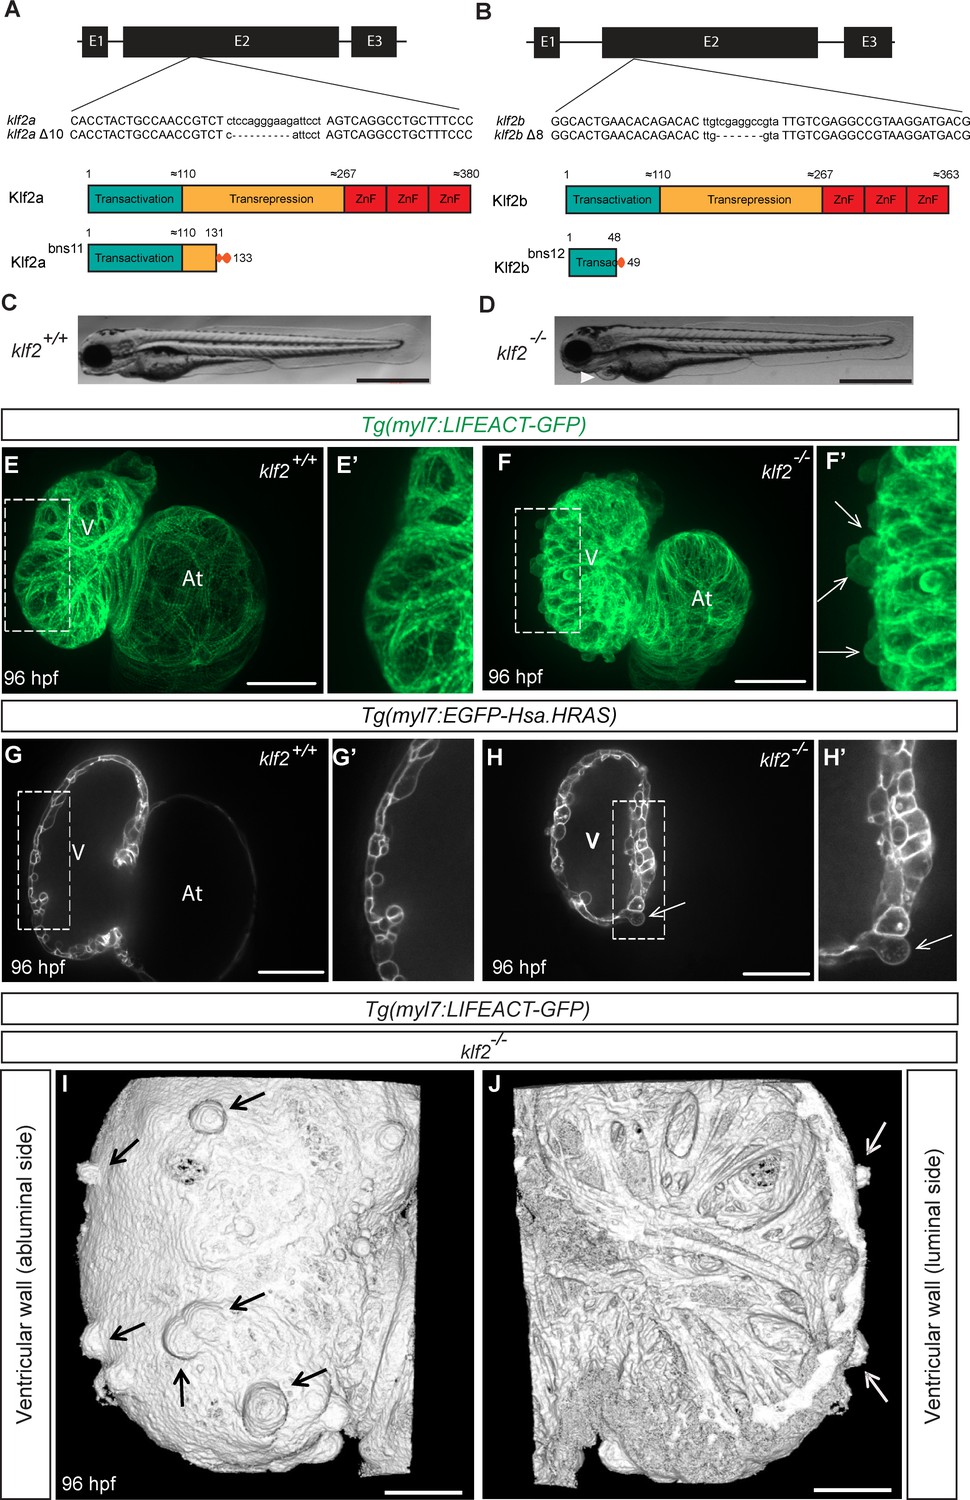
klf2 mutants exhibit a cardiomyocyte extrusion phenotype.
(A–B) Partial sequence alignment of klf2abns11 (A) and klf2bbns12 (B) alleles with WT and schematics of their predicted protein products. (C–D) Representative brightfield images of a WT (C) and a klf2abns11/bns11; klf2bbns12/bns12 double mutant (hereafter referred to as klf2 mutant) at 96 hpf (D); lateral views, anterior to the left; arrowhead points to pericardial edema. (E–F’) Maximum intensity projections of 96 hpf klf2 WT (E–E’) and mutant (F–F’) hearts; (G–H’) Two-dimensional (2D) confocal images of 96 hpf klf2 WT (G–G’) and mutant (H–H’) hearts; ventricular outer curvature (dashed boxes) in (E, F, G and H) magnified in (E’, F’, G’ and H’), respectively. (I–J) Three-dimensional reconstructions from confocal images of 96 hpf klf2 mutant ventricular wall. Arrows point to extruding cardiomyocytes; V: ventricle; At: atrium; scale bars: 0.5 mm (C–D), 50 µm (E–H), 20 µm (I–J).
Figure 1—figure supplement 1
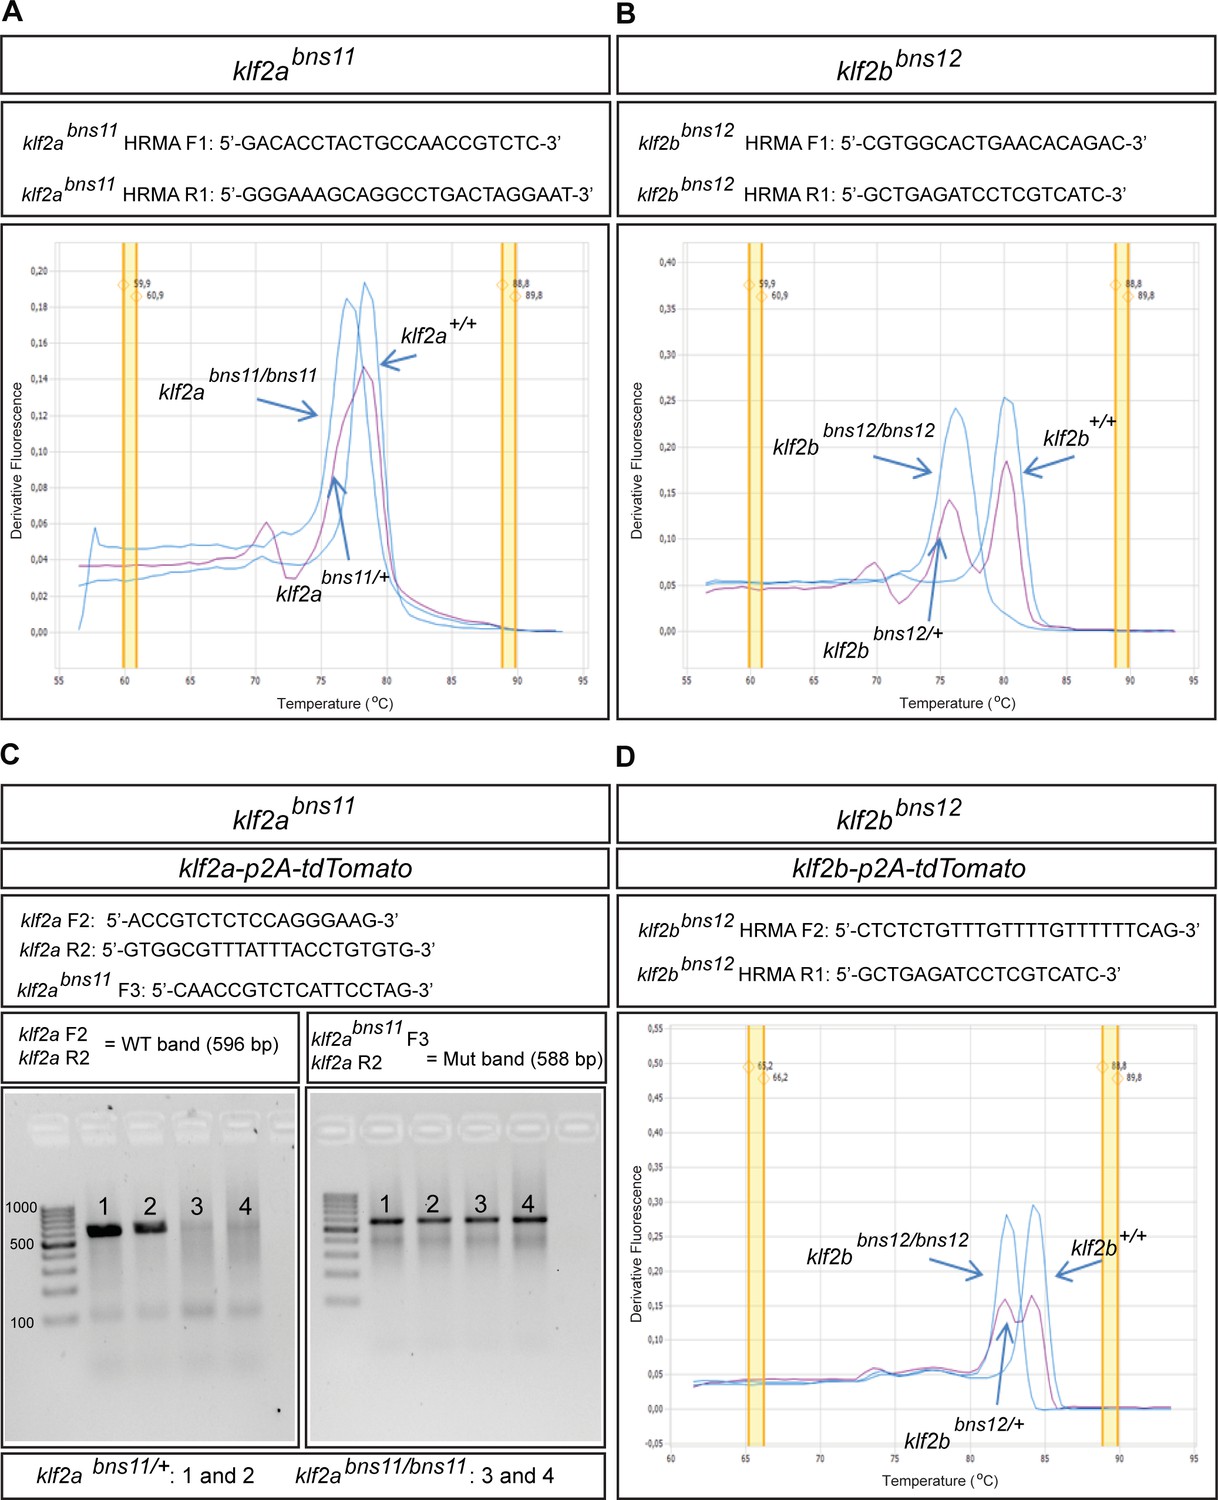
Identifying the klf2abns11 and klf2bbns12 mutant alleles in the absence or presence of the klf2-p2A-tdTomato transgene.
(A–B) klf2abns11 (A) and klf2bbns12 (B) mutant alleles can be identified by high-resolution melt analysis (HRMA) of PCR products. (C–D) Using different sets of primers (intronic), the klf2abns11 and klf2bbns12 alleles can be genotyped by PCR (C) and HRMA (D) in the presence of the klf2a-p2A-tdTomato (C) or klf2b-p2A-tdTomato (D) transgenes, respectively.
Figure 1—figure supplement 2
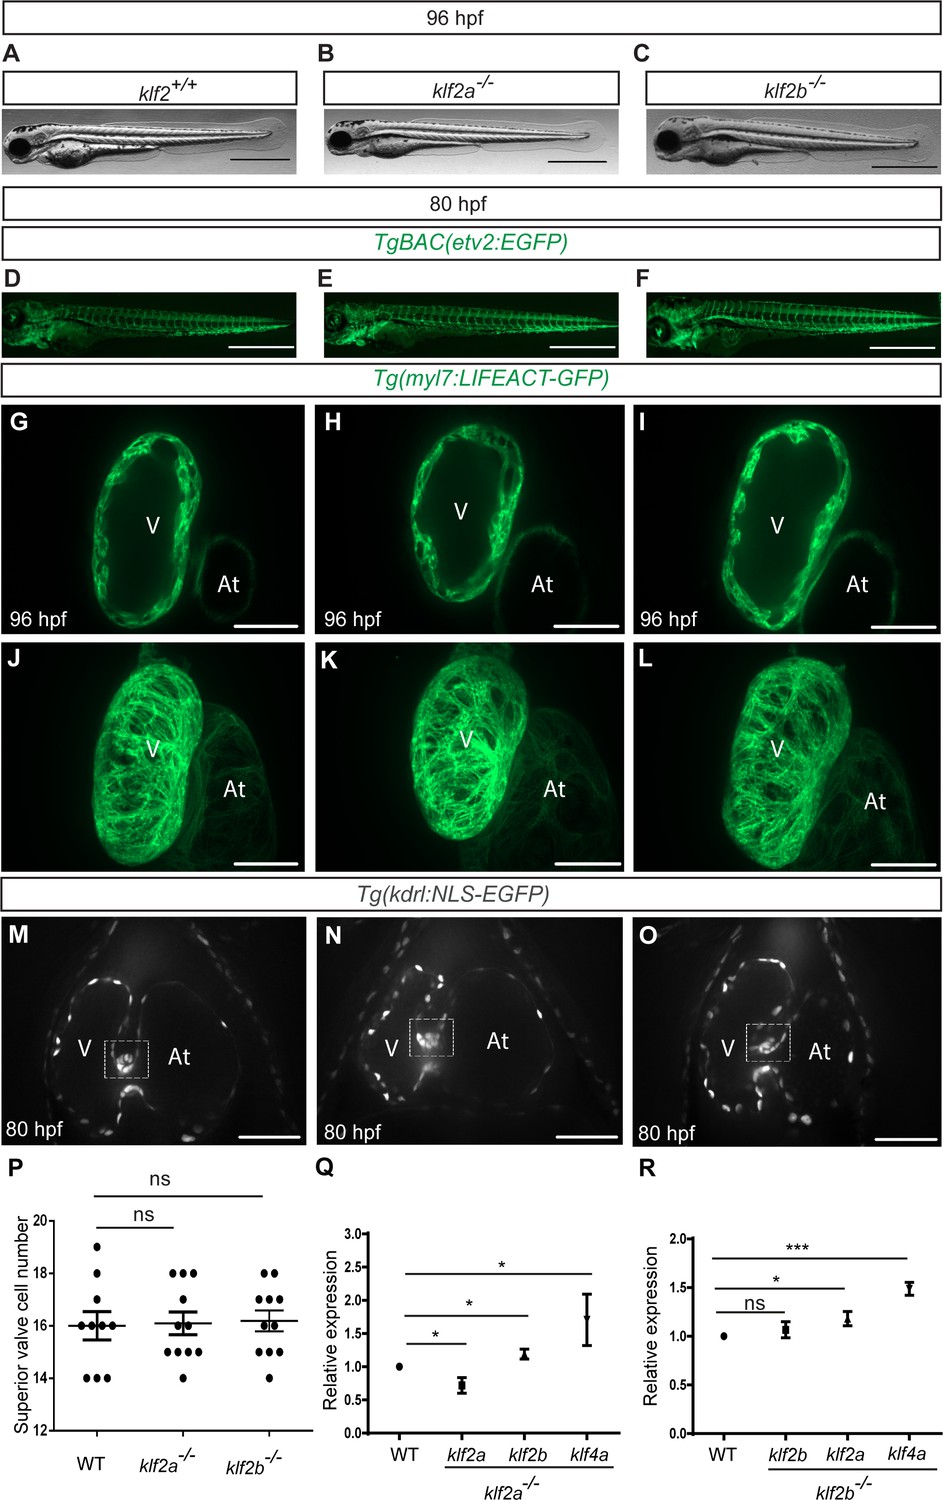
Single klf2a or klf2b mutants do not exhibit any obvious phenotypes.
(A–C) Brightfield images of 96 hpf larvae show that compared to their WT siblings (A), single klf2a mutant (B) or klf2b mutant (C) larvae do not exhibit any gross morphological defects. (D–F) Maximum intensity projections of confocal z-stacks of vascular networks in WT (D), klf2a mutant (E) and klf2b mutant (F) larvae at 80 hpf; lateral views, anterior to the left. (G–O) Confocal images of hearts from WT siblings (G, M) and klf2a (H, N) and klf2b (I, O) mutants show that cardiac development is not affected in these mutant alleles; maximum intensity projections of hearts in (G–I) are shown in (J-L). (P) Number of endocardial cells in the superior valve (dashed boxes) of WT sibling and klf2a and klf2b mutant hearts at 80 hpf;dots in this graph represent individual hearts. (Q–R) qPCR analysis of klf2a, klf2b and klf4a expression relative to WT, in klf2a (Q) and klf2b (R) mutants at 24 (Q) and 72 (R) hpf; n = 3 biological replicates; values represent means ±s.e.m.; *p≤0.05, ***, p≤0.001, ns (not significant), by Student’s t-test. Ct and dCt values are listed in Supplementary file 3. V: ventricle, At: atrium; scale bars: 0.5 mm (A–F), 50 µm (G–O).
Figure 1—figure supplement 3
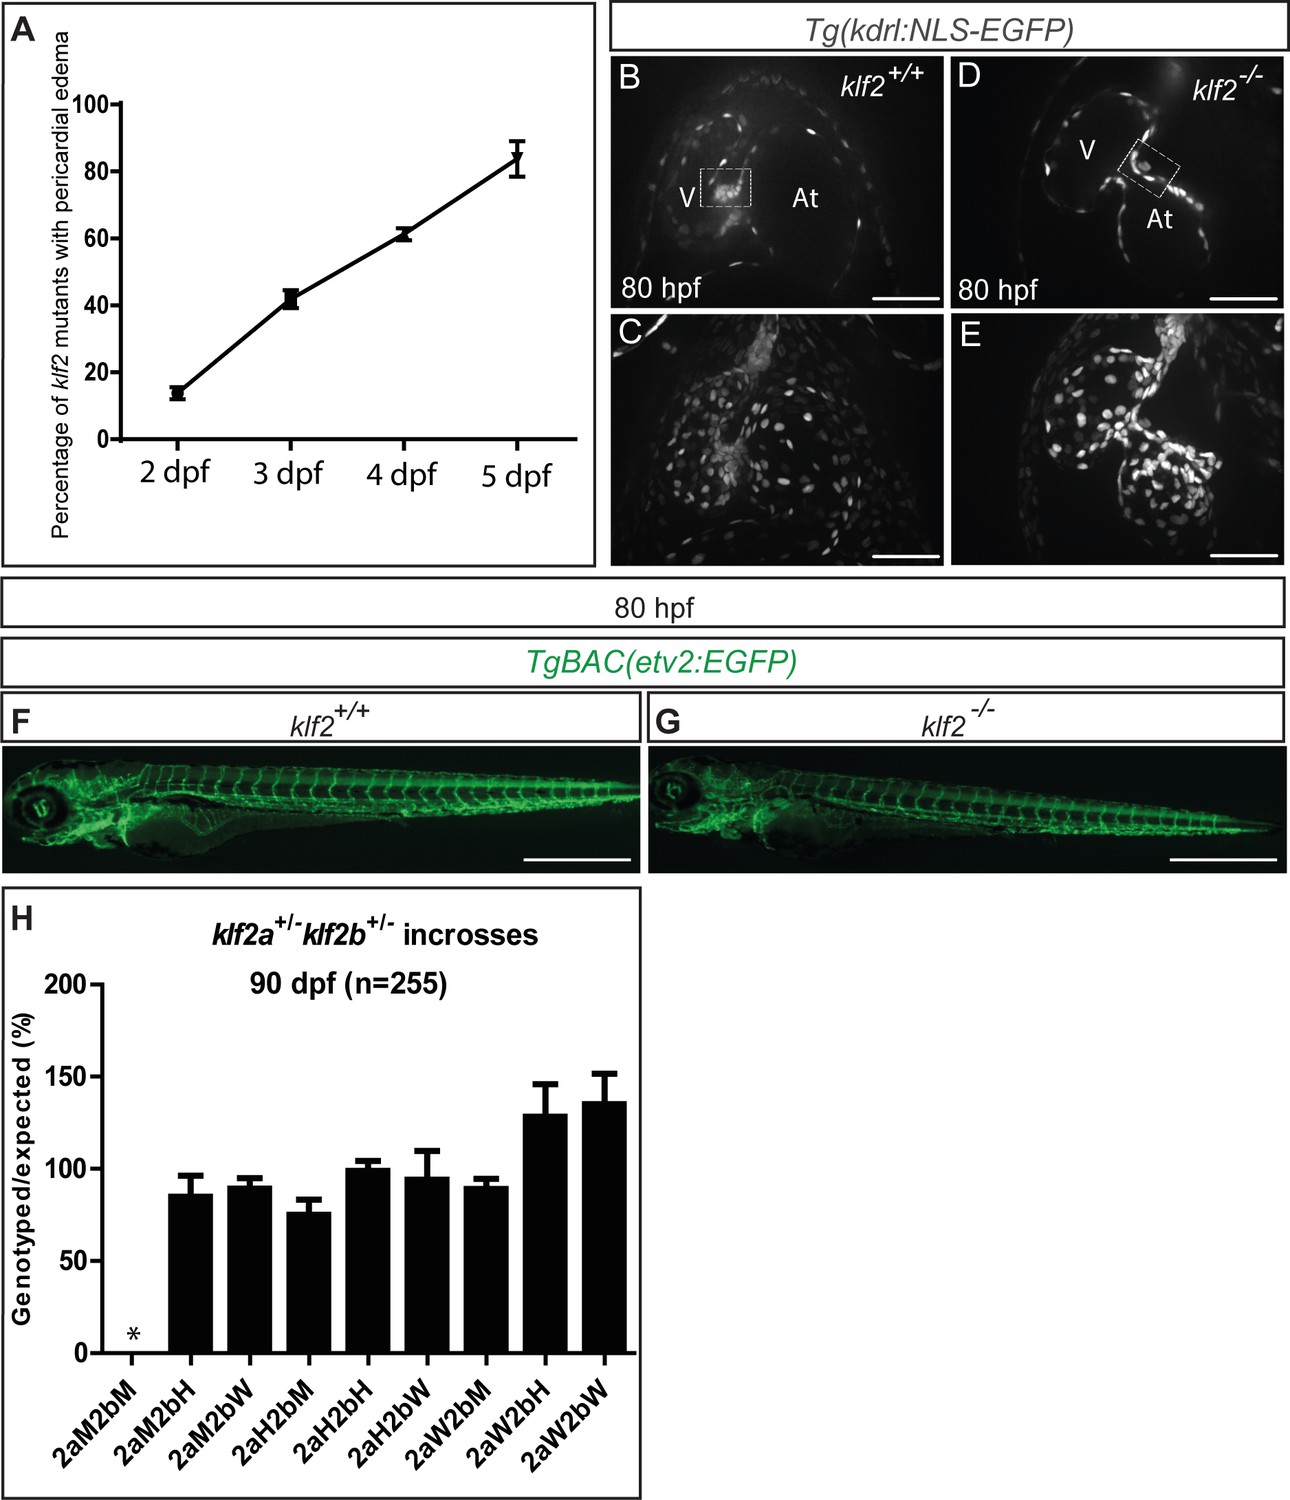
Characterizing additional cardiac phenotypes in klf2 mutants.
(A) Percentage of klf2 mutants exhibiting pericardial edema until five dpf (days post fertilization). (B–E) 2D confocal images of 80 hpf klf2 WT (B) and mutant (C) endocardial cells; superior valves are labeled with dashed boxes; maximum intensity projections of (B) and (D) are shown in (C) and (E). (F–G) Maximum intensity projections of confocal z-stacks of vascular network in klf2 WT (F) and mutant (G) animals at 80 hpf; lateral views, anterior to the left. (H) Survival rate of 90 dpf fish from klf2a+/-; klf2b-/- incrosses; W: wild-type, H: heterozygous, M: mutant. Scale bars: 50 µm (B–E), 0.5 mm (F–G).
Figure 1—figure supplement 4
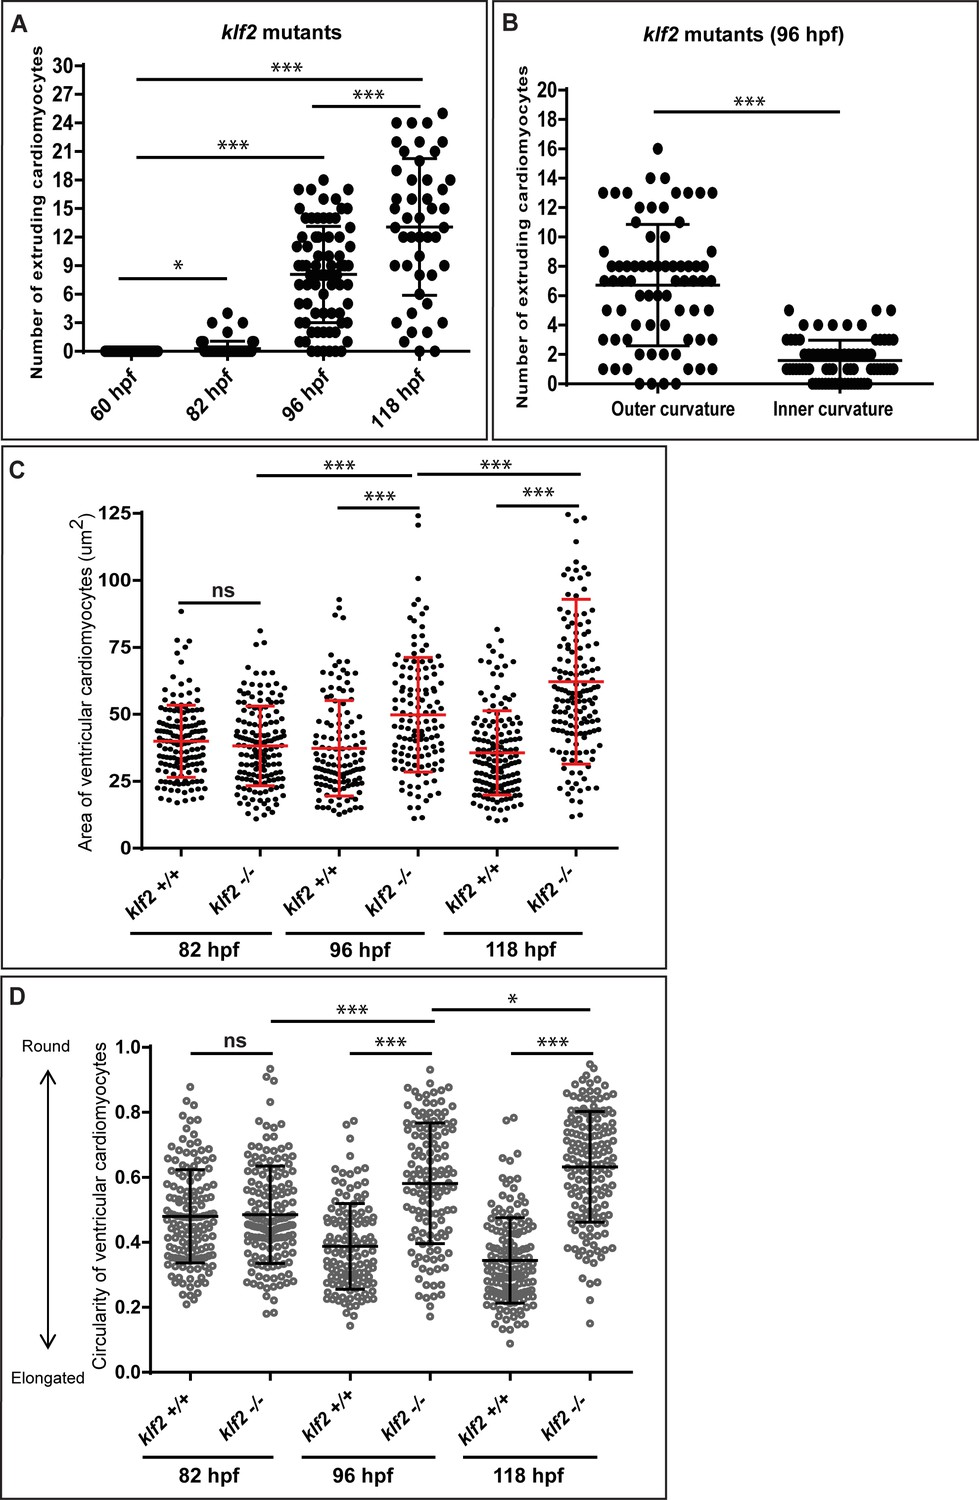
Additional quantification of the cardiomyocyte extrusion phenotype in klf2 mutants.
(A) Number of extruding cardiomyocytes in klf2 mutants at 60, 82, 96 and 118 hpf. (B) Number of extruding cardiomyocytes in inner and outer curvatures of 96 hpf klf2 mutant ventricles; dots in (A) and (B) represent individual hearts. (C–D) Size (C) and circularity (D) of ventricular (outer curvature) cardiomyocytes in klf2 WT and mutant animals at 82, 96 and 118 hpf; dots in (C) and (D) represent individual cardiomyocytes (n = 7 hearts per time point); values represent means ±s.e.m.; *p≤0.05, ***p≤0.001, ns (not significant), by Student’s t-test.
Figure 2 with 1 supplement
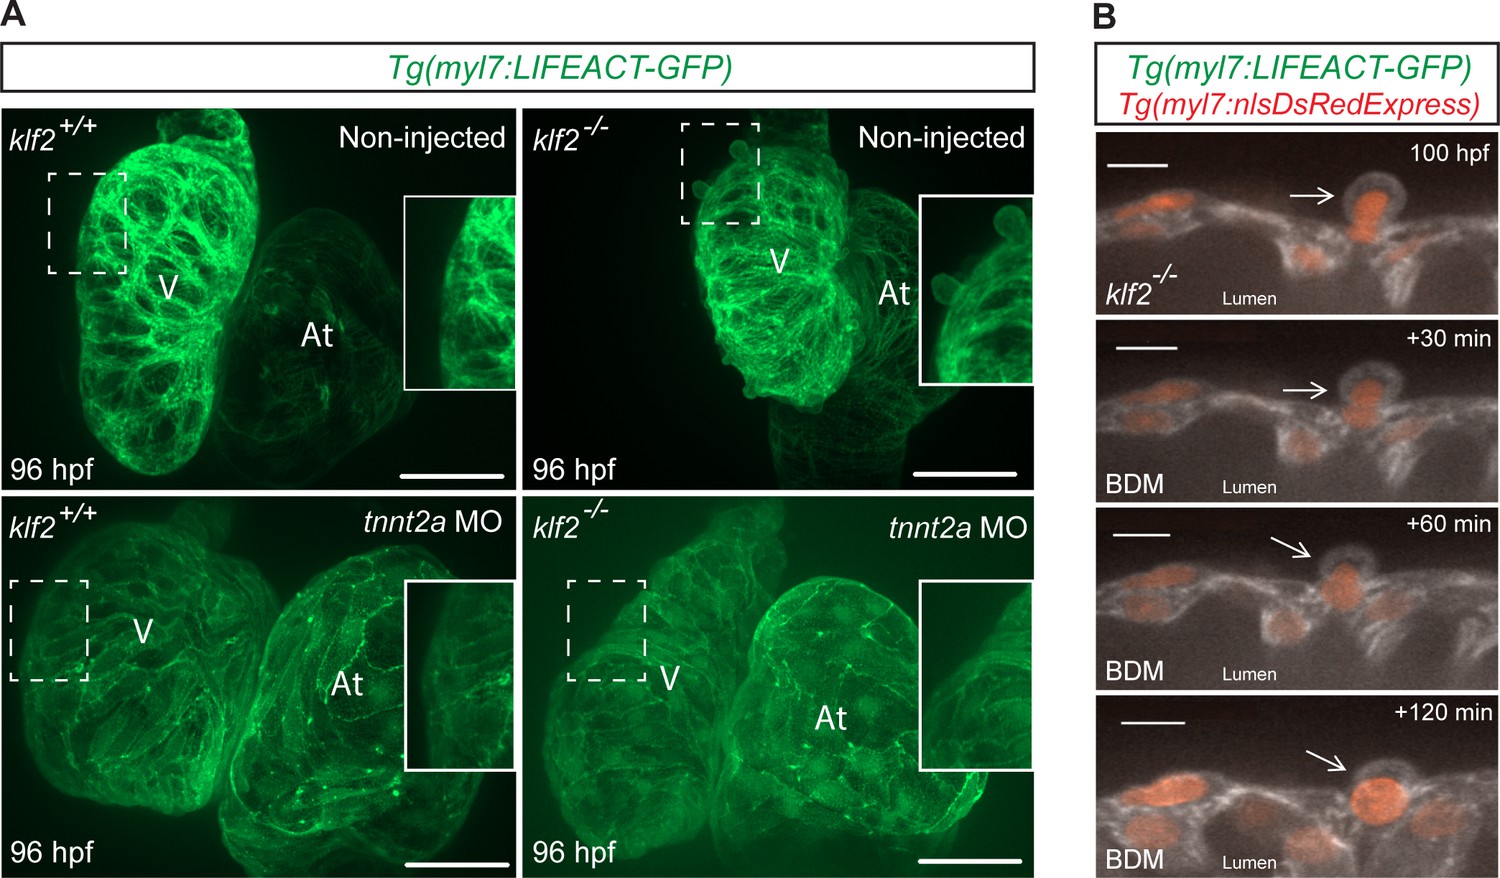
Cardiac contractility is required for cardiomyocyte extrusion.
(A) Maximum intensity projections of confocal z-stacks of 96 hpf klf2 WT and mutant hearts, non-injected or injected with tnnt2a MO at the one-cell stage; part of ventricular outer curvature (dashed boxes) magnified on the right side of each panel. (B) Time-lapse 2D confocal images of a klf2 mutant heart during BDM treatment. Arrows point to an extruding cardiomyocyte returning to the compact layer upon inhibiting contraction; V: ventricle; At: atrium; scale bars: 50 µm (A), 10 µm (B).
Figure 2—figure supplement 1
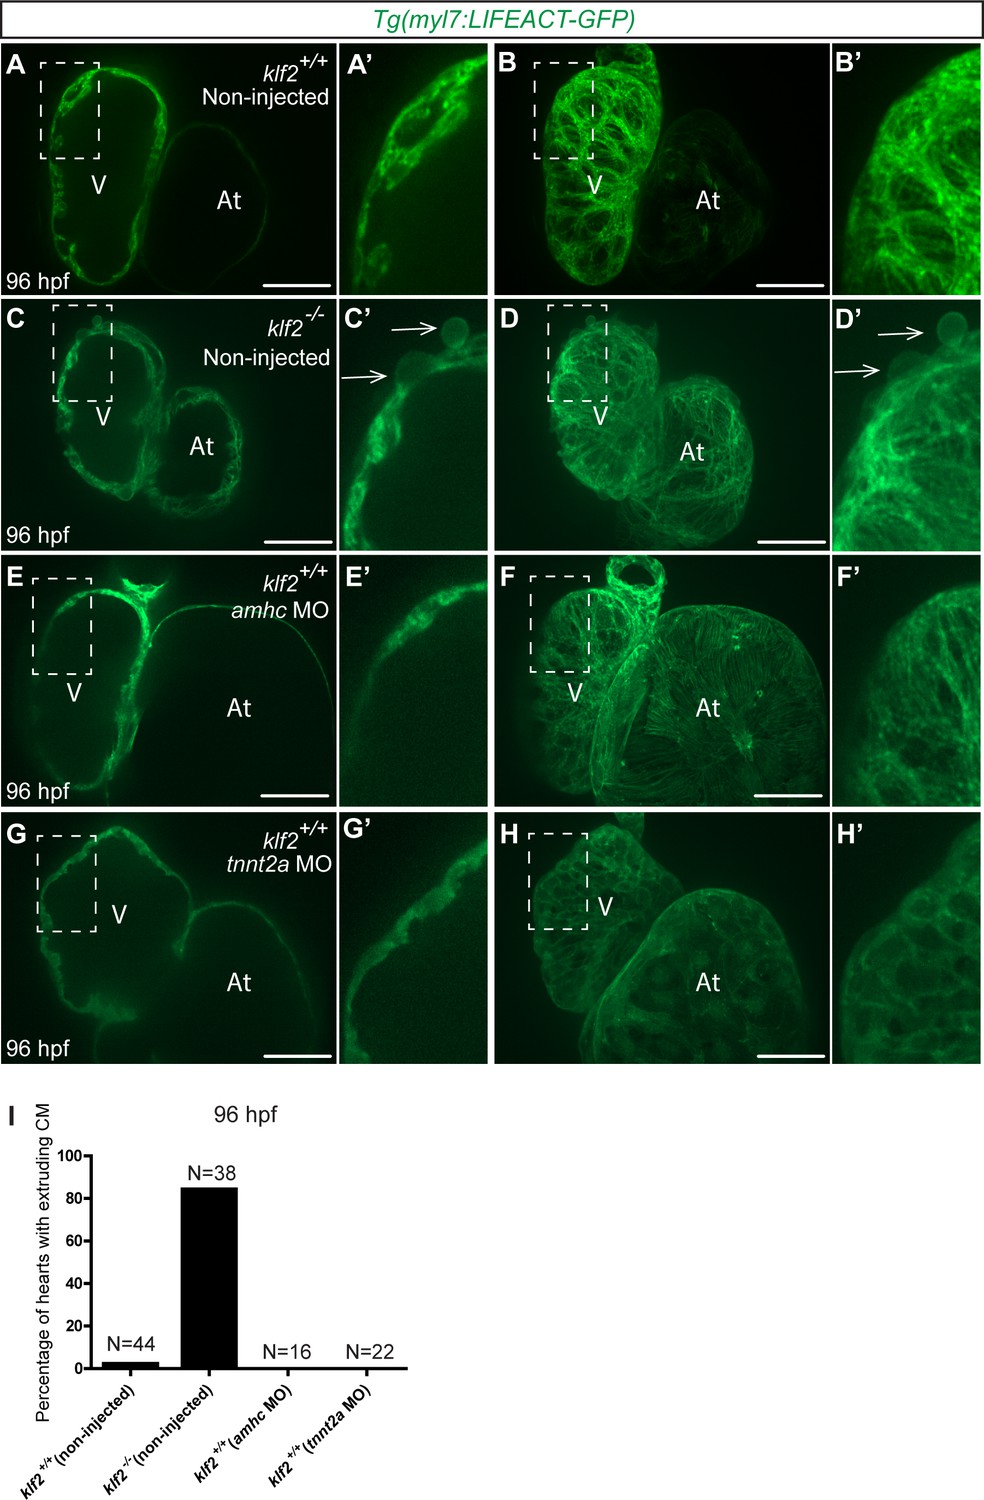
Cardiomyocyte extrusion from the compact layer is not caused by impaired contractility.
(A–H’) Confocal images of hearts from 96 hpf klf2 WT (A, E and G) and mutant (C) animals, non-injected (A and C) or injected with amhc MO (E) or tnnt2a MO (G) at the one-cell stage; maximum intensity projections of hearts in (A), (C), (E) and G) are shown in (B), (D), (F) and H), respectively; magnified images of dashed boxes in (A–H) are shown in (A’–H’), respectively; arrows point to extruding cardiomyocytes.
(I) Percentage of hearts with extruding cells in each condition; n = number of hearts. V: ventricle, At: atrium; scale bars, 50 µm.
Figure 3 with 4 supplements
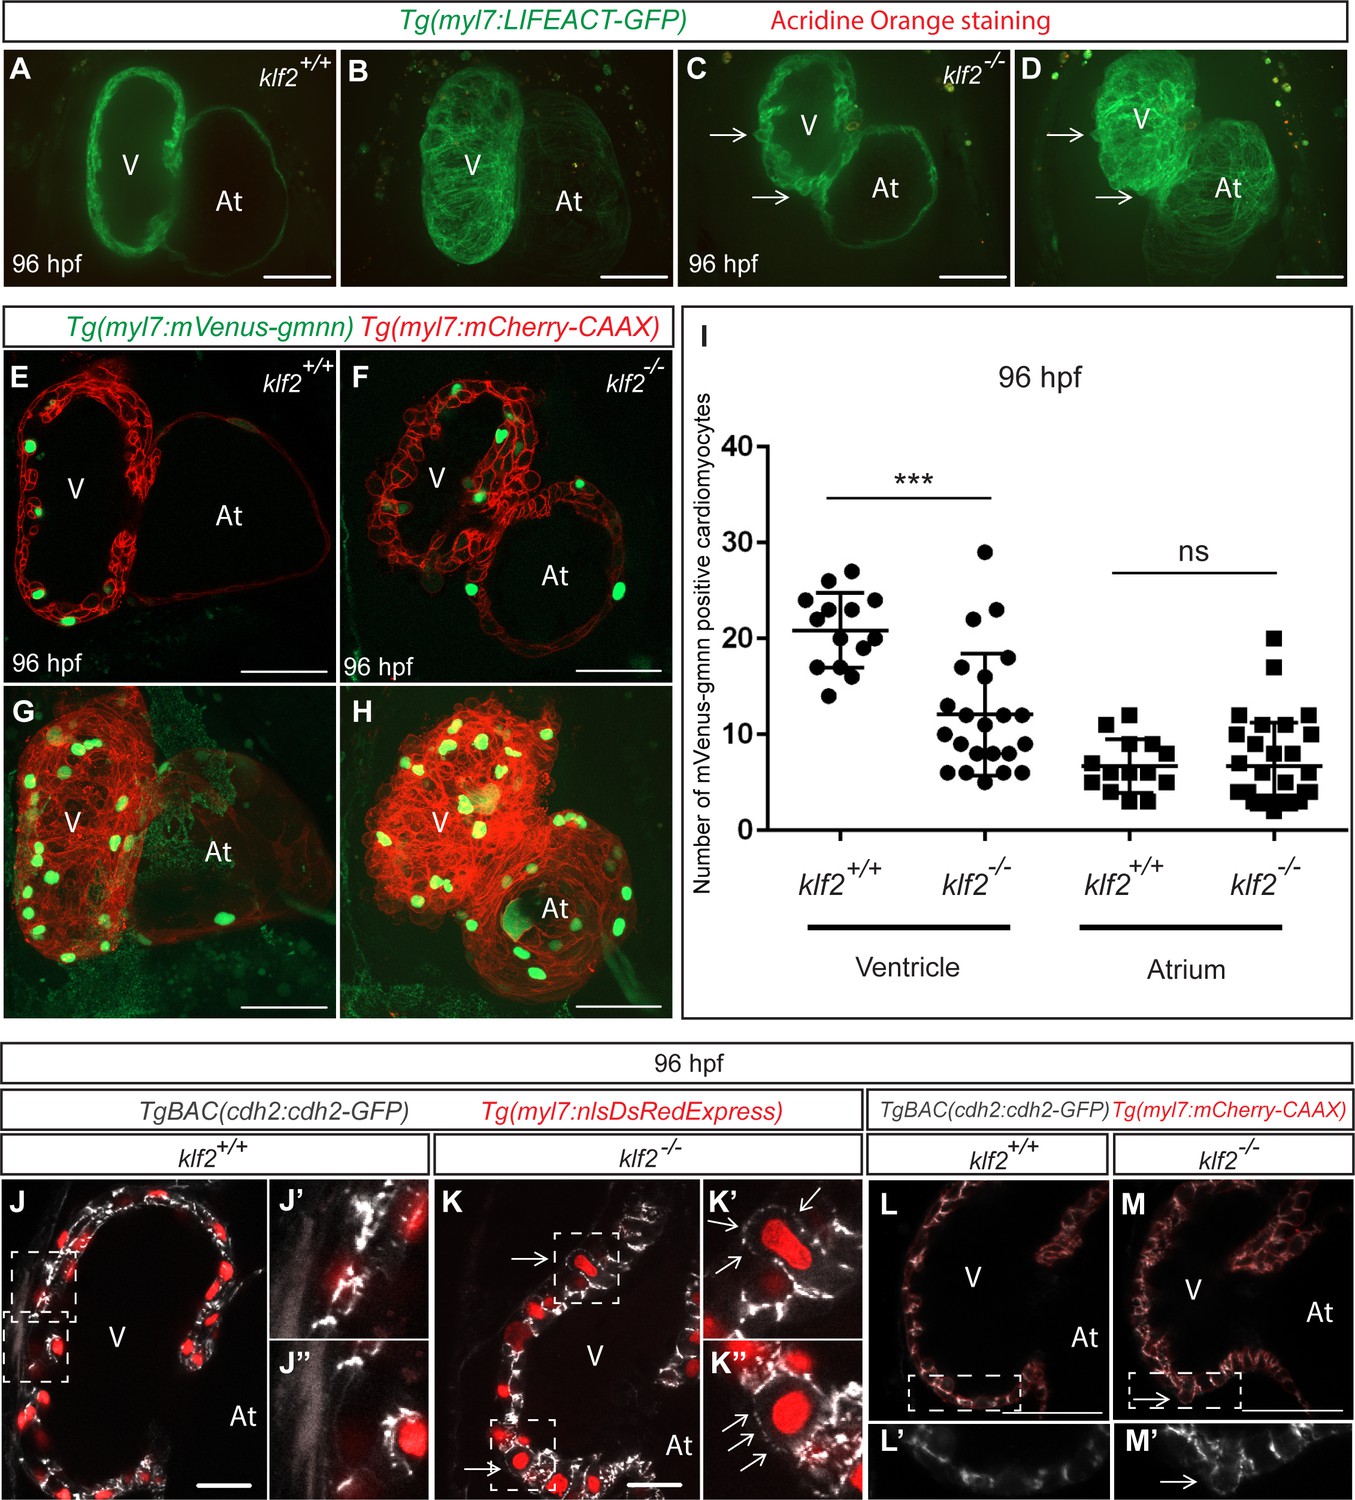
Cardiomyocyte extrusion correlates with N-cadherin mislocalization but not with cardiomyocyte death or proliferation.
(A–D) 2D (mid-sagittal sections) (A and C) and maximum intensity projections of confocal z-stacks (B and D) of 82 hpf klf2 WT (A–B) and mutant (C–D) hearts stained with Acridine Orange to visualize cell death; arrows point to extruding cardiomyocytes. (E–H) Confocal images of 96 hpf klf2 WT (E and G) and mutant (F and H) hearts to visualize cardiomyocyte proliferation. (I) Number of mVenus-gmnn positive ventricular and atrial cardiomyocytes in 96 hpf klf2 WT and mutant hearts; dots represent individual hearts; values represent means ±SEM; ***p≤0.001, ns (not significant), by Student’s t-test. (J–K’’) Mid-sagittal confocal sections of 96 hpf klf2 WT (J) and mutant (K) hearts. Higher magnification images of the outer curvature of the ventricular wall (white dashed boxes) in (J) and K) are shown in (J’), (J’’), (K’) and (K’’); arrows point to ectopic accumulation of Cdh2-EGFP proteins on the apical side of cardiomyocytes. (L–M’) 2D confocal views of 96 hpf klf2 WT (L) and mutant (M) hearts. Magnified images of dashed boxes in (L) and (M) are shown in (L’) and (M’), respectively. Arrows point to mislocalized Cdh2-GFP on the apical side of cardiomyocytes; V: ventricle, At: atrium; scale bars, 50 µm.
Figure 3—figure supplement 1
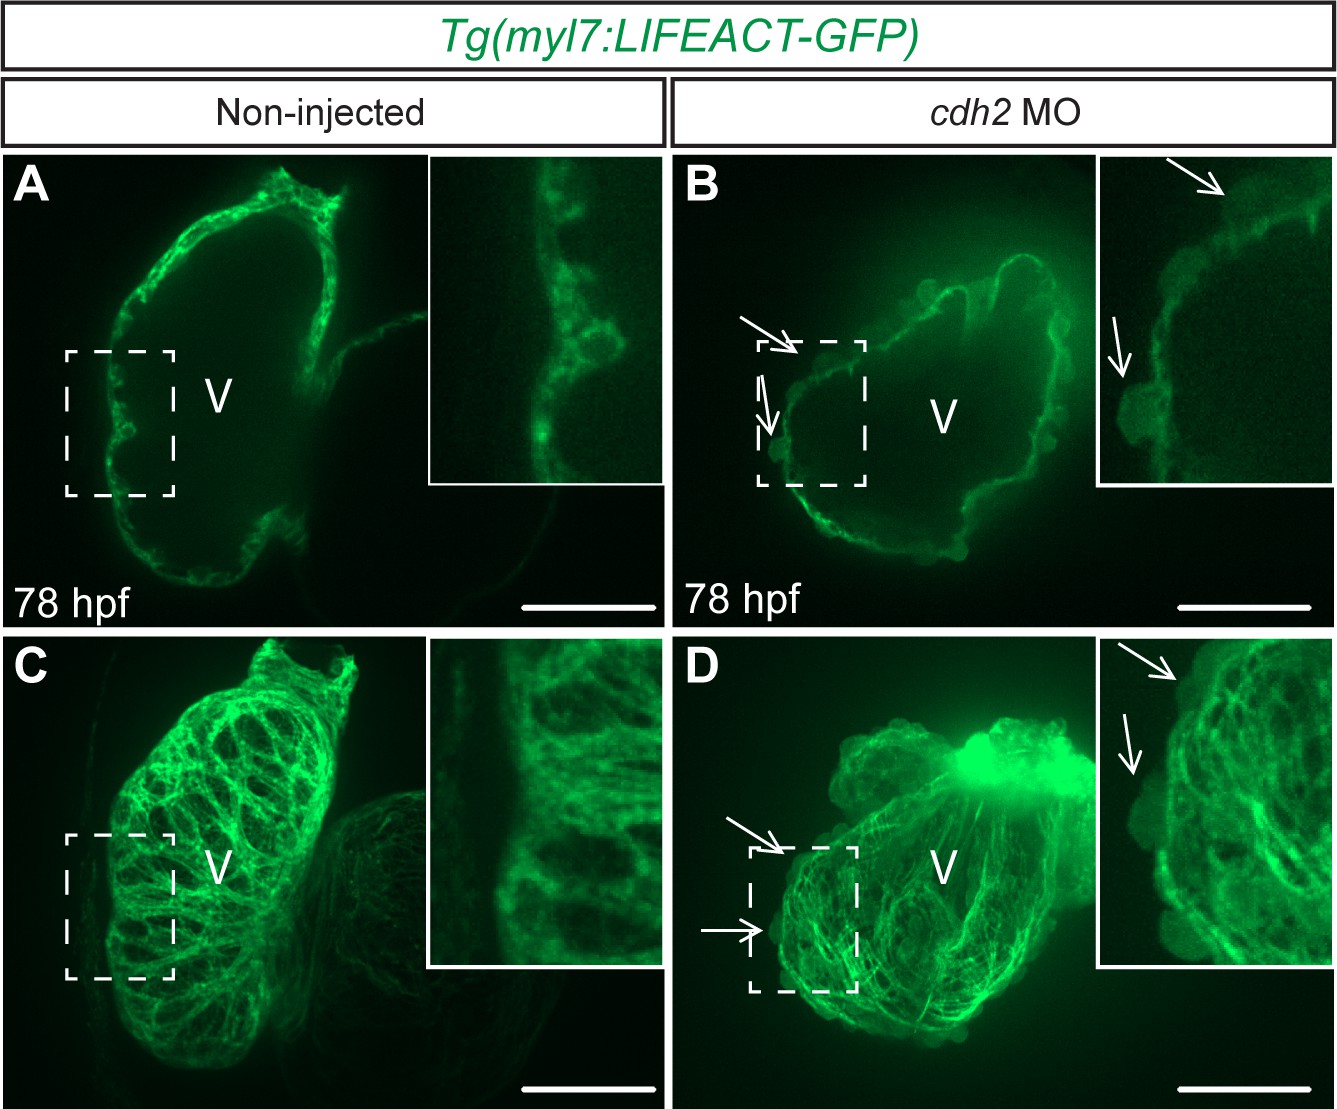
Downregulation of cdh2 leads to cardiomyocyte extrusion.
(A–D) Confocal images of 78 hpf hearts; non-injected (A and C) or injected with cdh2 MO at the one-cell stage (B and D); maximum intensity projections of hearts in (A) and (B) are shown in (C) and (D), respectively; dashed boxes are magnified in upper right corners; arrows point to extruding cardiomyocytes.
V: ventricle, At: atrium; scale bars, 50 µm.
Figure 3—figure supplement 2
The extruding cardiomyocytes appear polarized in the apicobasal axis.
(A–F) 2D confocal images (mid-sagittal views) of klf2 WT (A–C) and mutant (D–F) hearts at 96 hpf; magnified images of dashed boxes are shown on the right side of each panel; arrows point to a polarized extruding cardiomyocyte. V: ventricle, At: atrium; scale bars, 50 µm.
Figure 3—figure supplement 3
Reduction of the cardiac jelly is not obviously affected in klf2 mutants.
(A–B’) klf2 WT (A) and mutant (B) hearts were imaged at 96 hpf; dashed boxes in (A) and (B) are magnified in (A’) and (B’), respectively.
Arrows point to extruding cardiomyocytes; V: ventricle, At: atrium; scale bars, 50 µm.
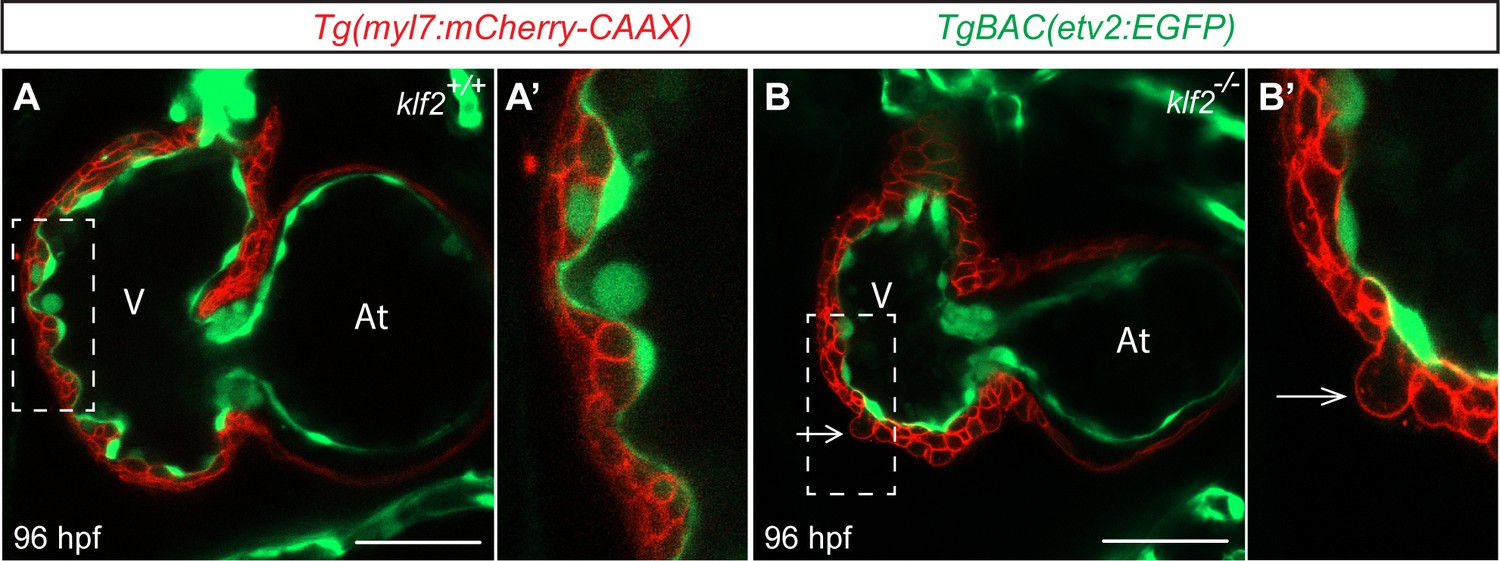
Figure 3—figure supplement 4
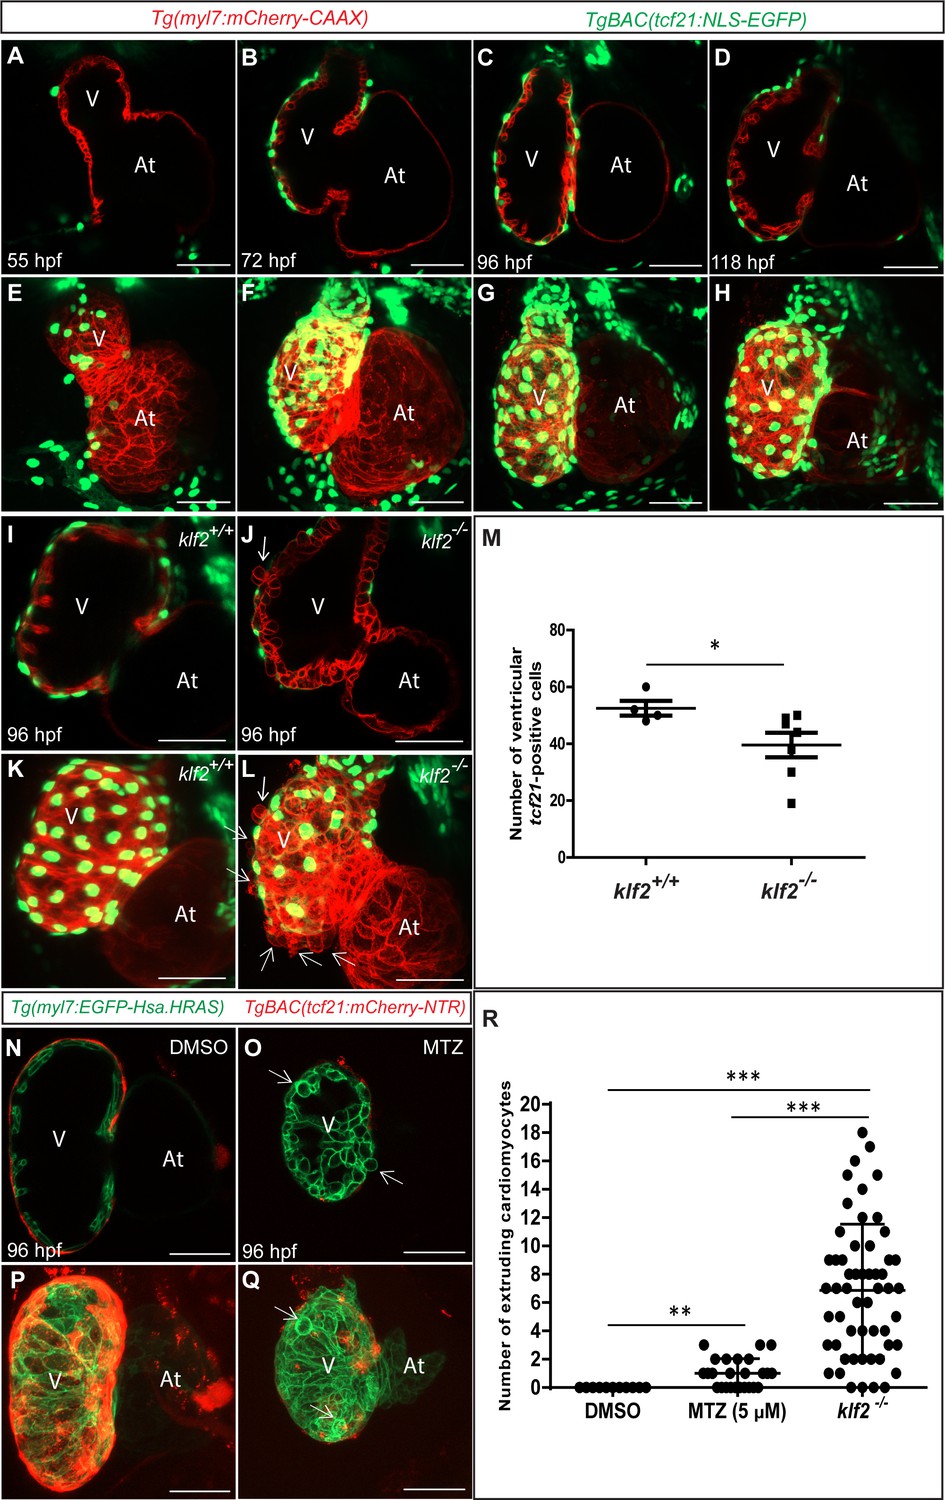
The epicardium is affected in klf2 mutants.
(A–D) 2D confocal images (mid-sagittal sections) of WT hearts at 55 (A), 72 (B), 96 (C) and 118 (D) hpf; Maximum intensity projections of hearts in (A), (B), (C) and (D) are shown in (E), (F), (G) and (H), respectively. (i–l) Hearts from klf2 +/+ (i) and klf2 -/- (J) animals were imaged at 96 hpf; maximum intensity projections of hearts in (I) and (J) are shown in (K) and (L), respectively. (M) Number of ventricular tcf21-GFP positive cells; dots in this graph represent individual hearts. (N–R) 2D confocal images of 96 hpf WT hearts treated with DMSO (N and P) or MTZ (O) and (Q) from 48 to 96 hpf. MTZ treatment ablated almost all epicardial (mCherry-NTR positive) cells (O and Q); Maximum intensity projections of hearts in (N) and (O) are shown in (P) and (Q), respectively. (R) Number of extruding cardiomyocytes in WT animals after MTZ treatment compared to DMSO treatment, as well as in klf2 mutants at 96 hpf; dots in (R) represent individual hearts; values represent means ±s.e.m.; *p≤0.05, **p≤0.01, ***p≤0.001, by Student’s t-test. Arrows point to extruding cardiomyocytes; V: ventricle, At: atrium; scale bars, 50 µm.
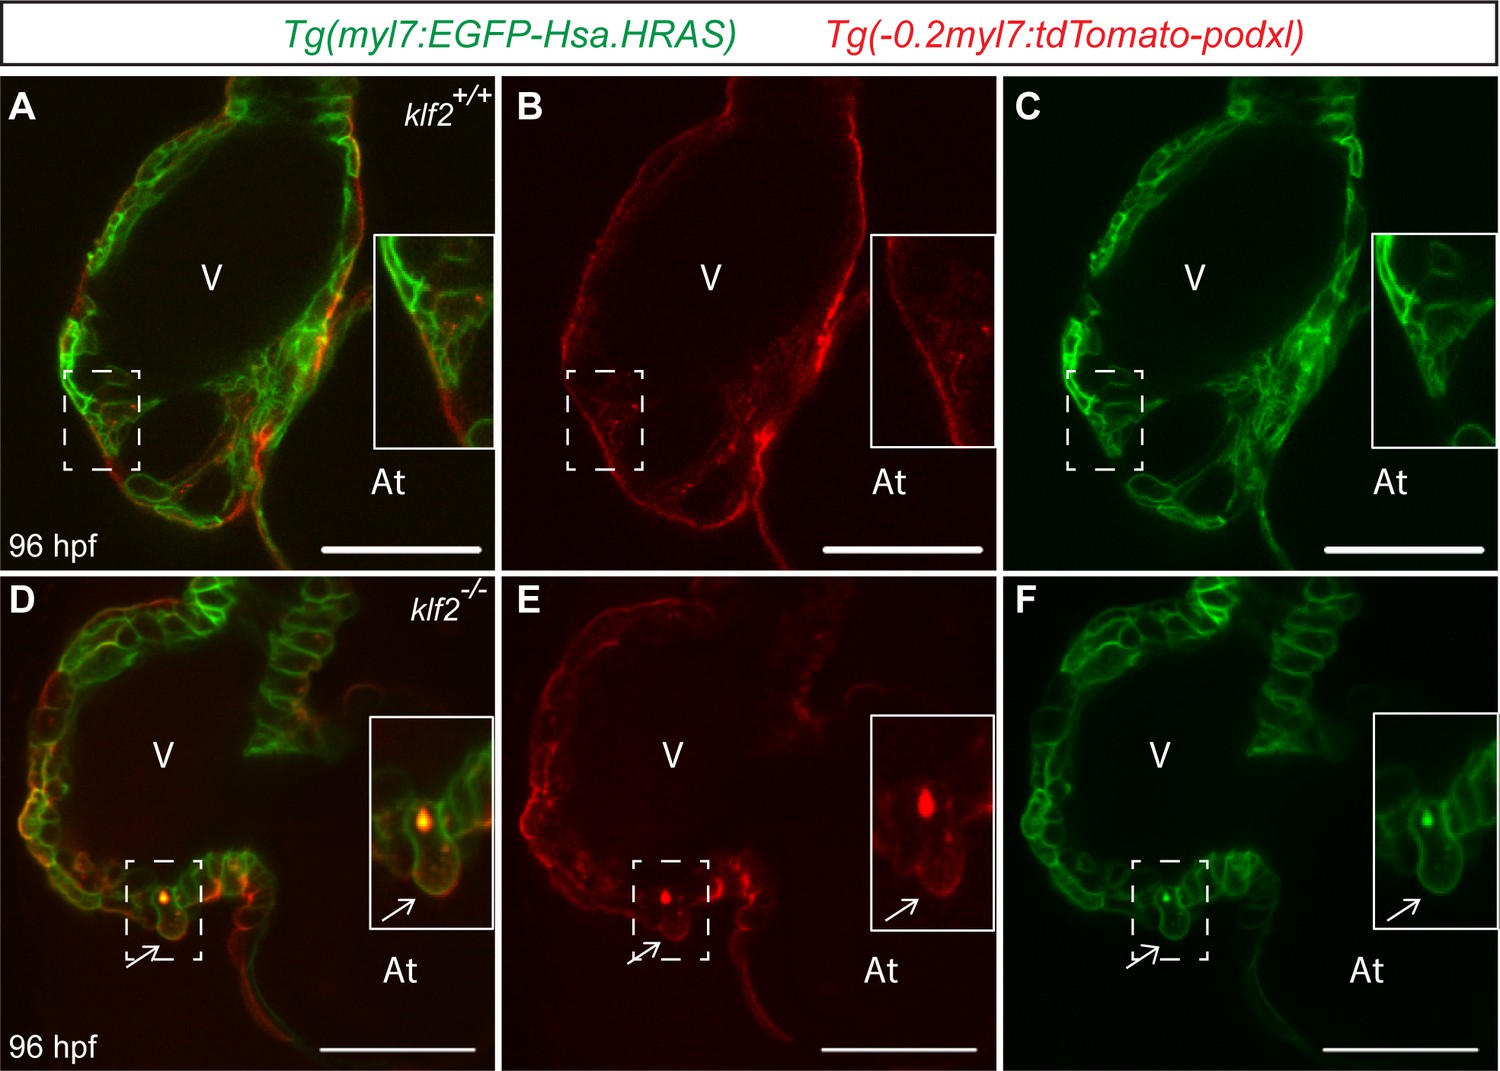
Figure 4
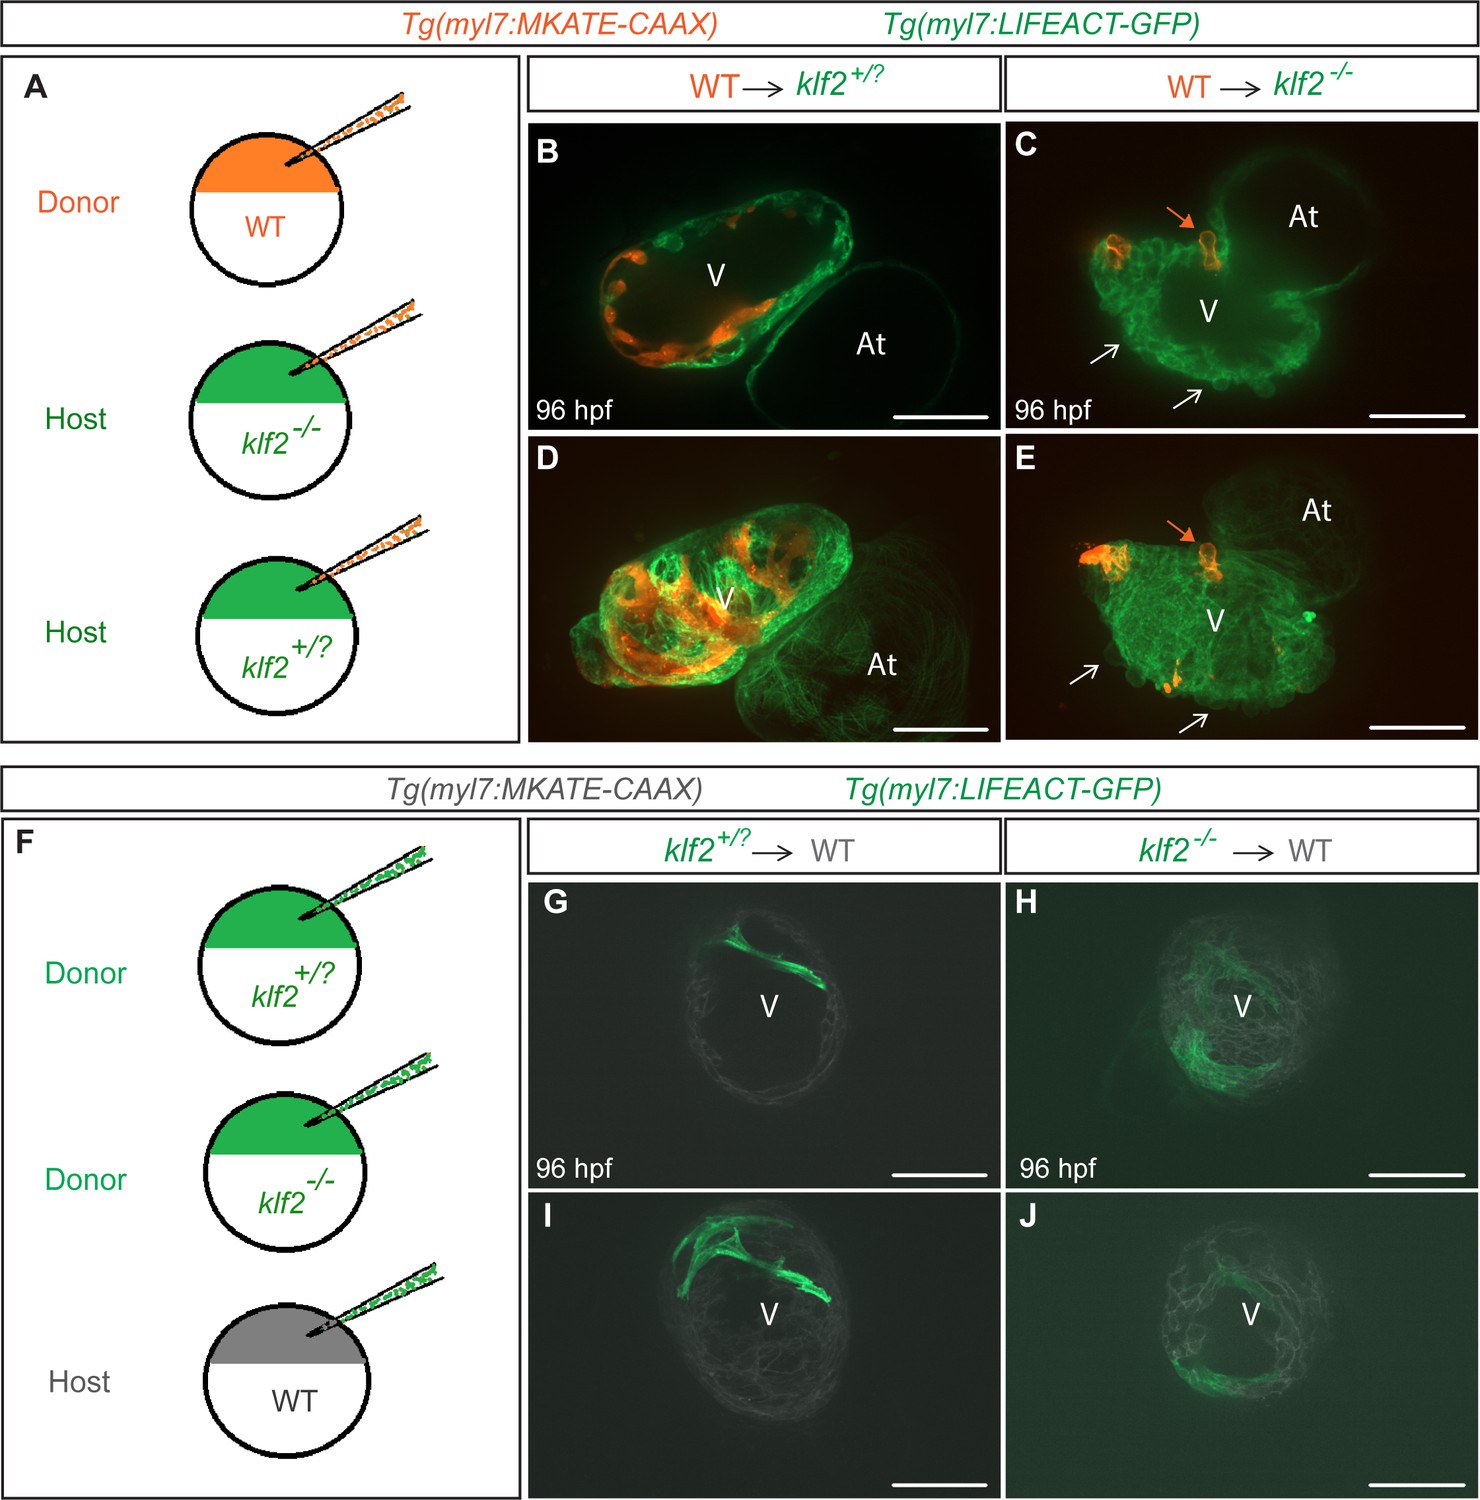
Klf2 functions cell non-autonomously to maintain the integrity of the myocardial wall.
(A) Schematic representation of the experiment shown in (B–E). (B–E) Transplantation of Tg(myl7:MKATE-CAAX); klf2+/+ donor cells into Tg(myl7:LIFEACT-GFP); klf2+/? (B and D) or klf2-/- (C and E) hosts shown at 96 hpf; white arrows point to klf2-/- extruding cardiomyocytes in klf2-/- heart, orange arrows point to klf2+/+ extruding cardiomyocytes in klf2-/- hearts; maximum intensity projections of confocal z-stacks of hearts in (B) and (C) are shown in (D) and (E), respectively. (F) Schematic representation of the experiment shown in (G-J). (G–J) Transplantation of Tg(myl7:LIFEACT-GFP); klf2+/? (G and I) or klf2-/- (H and J) donor cells into Tg(myl7:MKATE-CAAX); klf2+/+ hosts shown at 96 hpf; maximum intensity projections of confocal z-stacks of hearts in (G) and (H) are shown in (I) and (J), respectively. V: ventricle, At: atrium; scale bars, 50 µm.
Figure 5 with 4 supplements
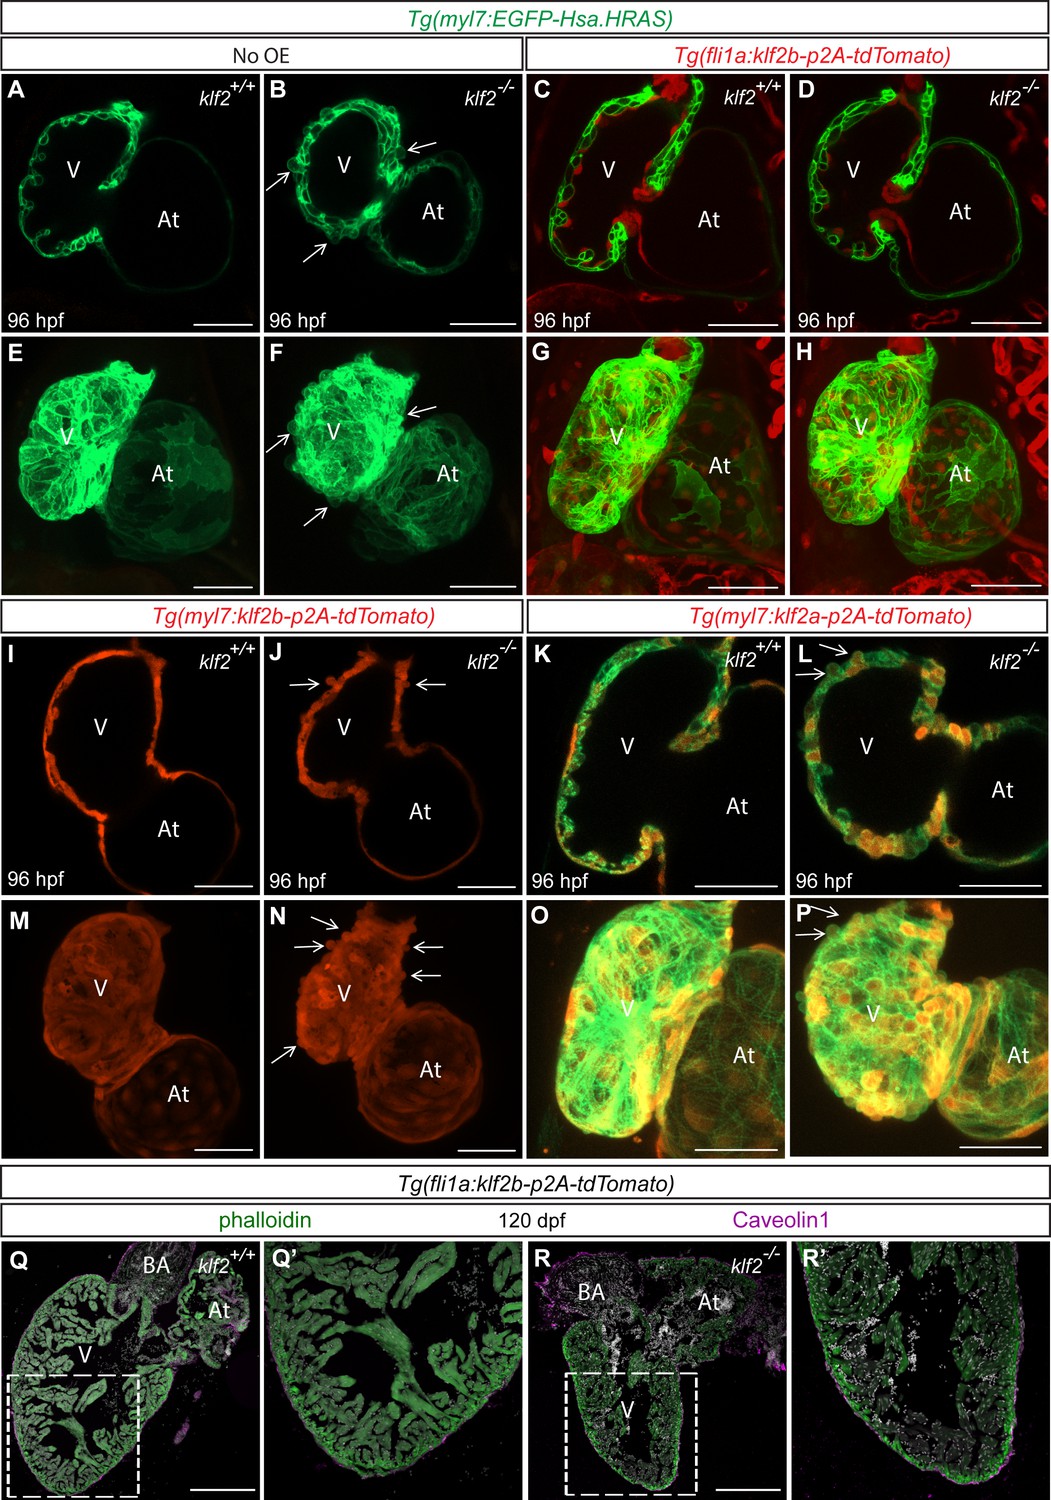
klf2b overexpression in endothelial cells can rescue the klf2 mutant cardiomyocyte extrusion phenotype.
(A–P) Endothelial- and myocardial-specific overexpression of klf2a or klf2b in klf2 WT and mutant hearts. Endothelial overexpression of klf2b (C–D, G–H). Myocardial overexpression of klf2a (K–L, O–P) or klf2b (I–J, M–N); maximum intensity projections of hearts in (A–D) and (I–L) are shown in (E–H) and (M–P), respectively. (Q–R’) Immunostaining of adult klf2 WT (Q–Q’) and rescued mutant (R–R’) heart sections for Caveolin1 to label epicardial cells and phalloidin for overall myocardial structure; magnified images of dashed boxes in (Q) and (R) are shown in (Q’) and (R’), respectively; arrows point to extruding cardiomyocytes; V: ventricle, At: atrium; scale bars: 50 µm (A–P), 300 µm (Q–R’).
Figure 5—figure supplement 1

klf2b expression at early developmental stages .
(A–C) Ventral views of in situ hybridization for klf2b expression at 36 (A), 48 (B) and 72 (C) hpf. V: ventricle, At: atrium; scale bars, 100 µm.
Figure 5—figure supplement 2
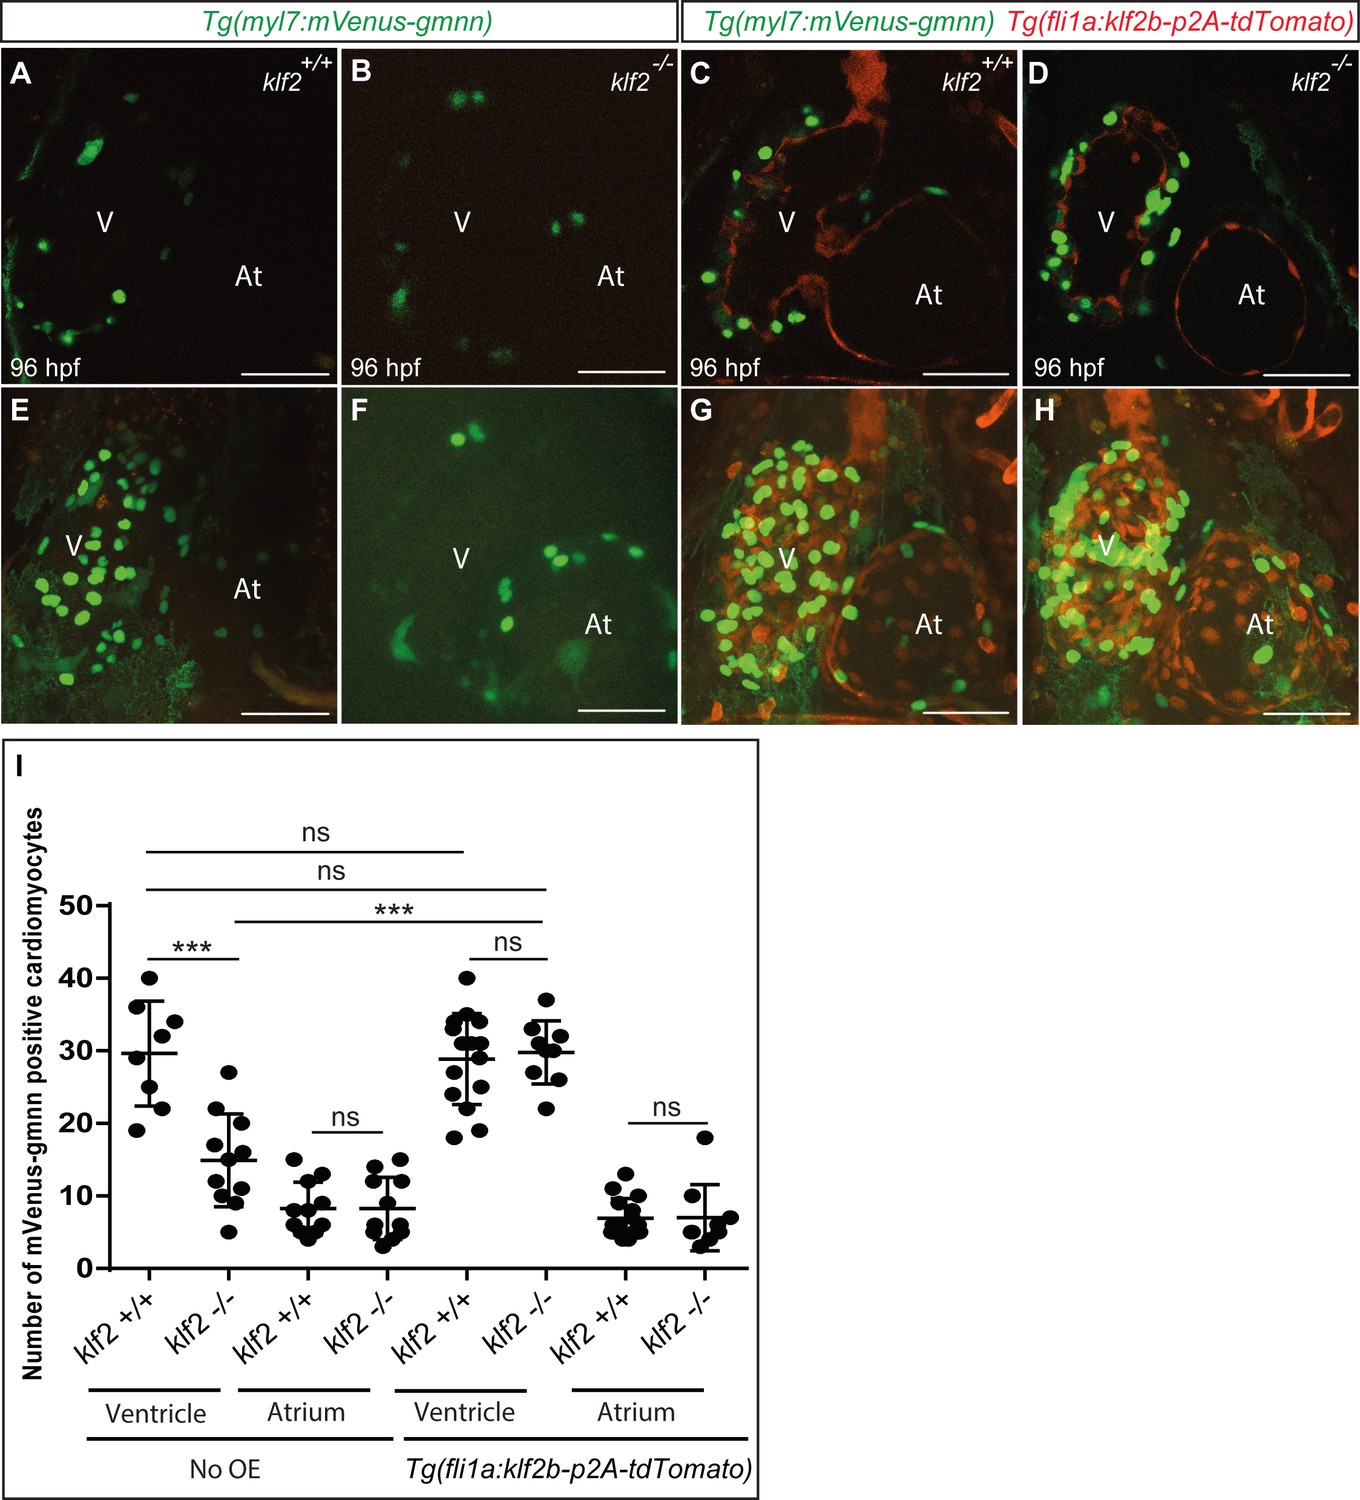
The cardiomyocyte proliferation defect in klf2 mutants is rescued by endothelial klf2b overexpression.
(A–H) Confocal images (mid-sagittal sections) of 96 hpf klf2 WT (A, E, C and G) and mutant (B, F, D and H) hearts in the absence (A, B, E and F) or presence (C, D, G and H) of endothelial klf2b overexpression to examine cardiomyocyte proliferation. Maximum intensity projections of hearts in (A–D) are shown in (E-H). (I) Number of mVenus-gmnn positive ventricular and atrial cardiomyocytes in 96 hpf klf2 WT and mutant hearts in the absence or presence of fli1a:klf2b-p2a-tdTomato transgene; dots represent individual hearts; values represent means ±SEM; ***p≤0.001, ns (not significant), by Student’s t-test. V: ventricle, At: atrium; scale bars, 50 µm.
Figure 5—figure supplement 3
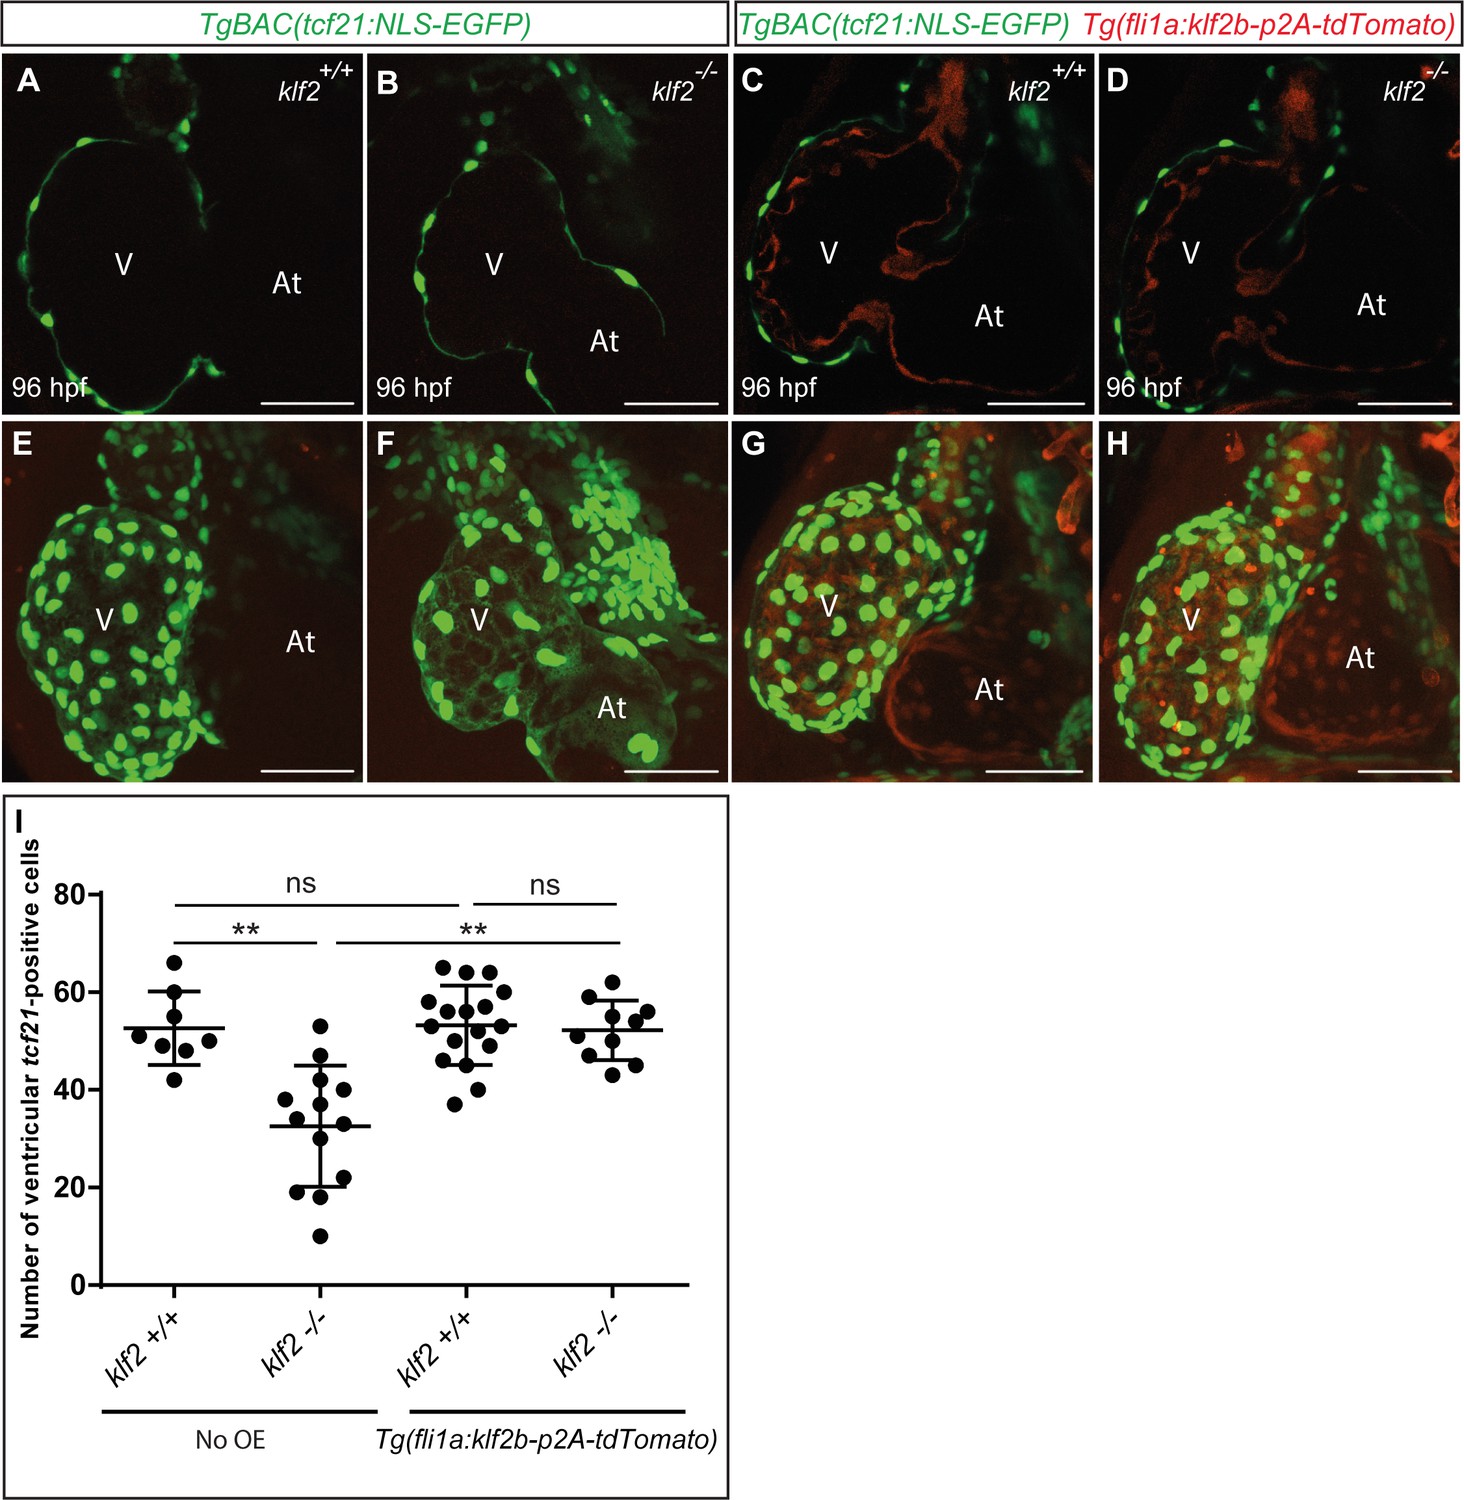
The epicardial defect in klf2 mutants is rescued by endothelial klf2b overexpression.
(A–D) 2D confocal images (mid-sagittal sections) of 96 hpf klf2 WT (A, E, C and G) and mutant (B, F, D and H) hearts in the absence (A, B, E and F) or presence (C, D, G and H) of fli1a:klf2b-p2a-tdTomato transgene to examine cardiomyocyte proliferation. Maximum intensity projections of hearts in (A–D) are shown in (E-H). (I) Number of ventricular tcf21-GFP positive cells in 96 hpf animals plotted as a graph; dots represent individual hearts; values represent means ±SEM; **p≤0.01, ns (not significant), by Student’s t-test. V: ventricle, At: atrium; scale bars, 50 µm.
Figure 5—figure supplement 4
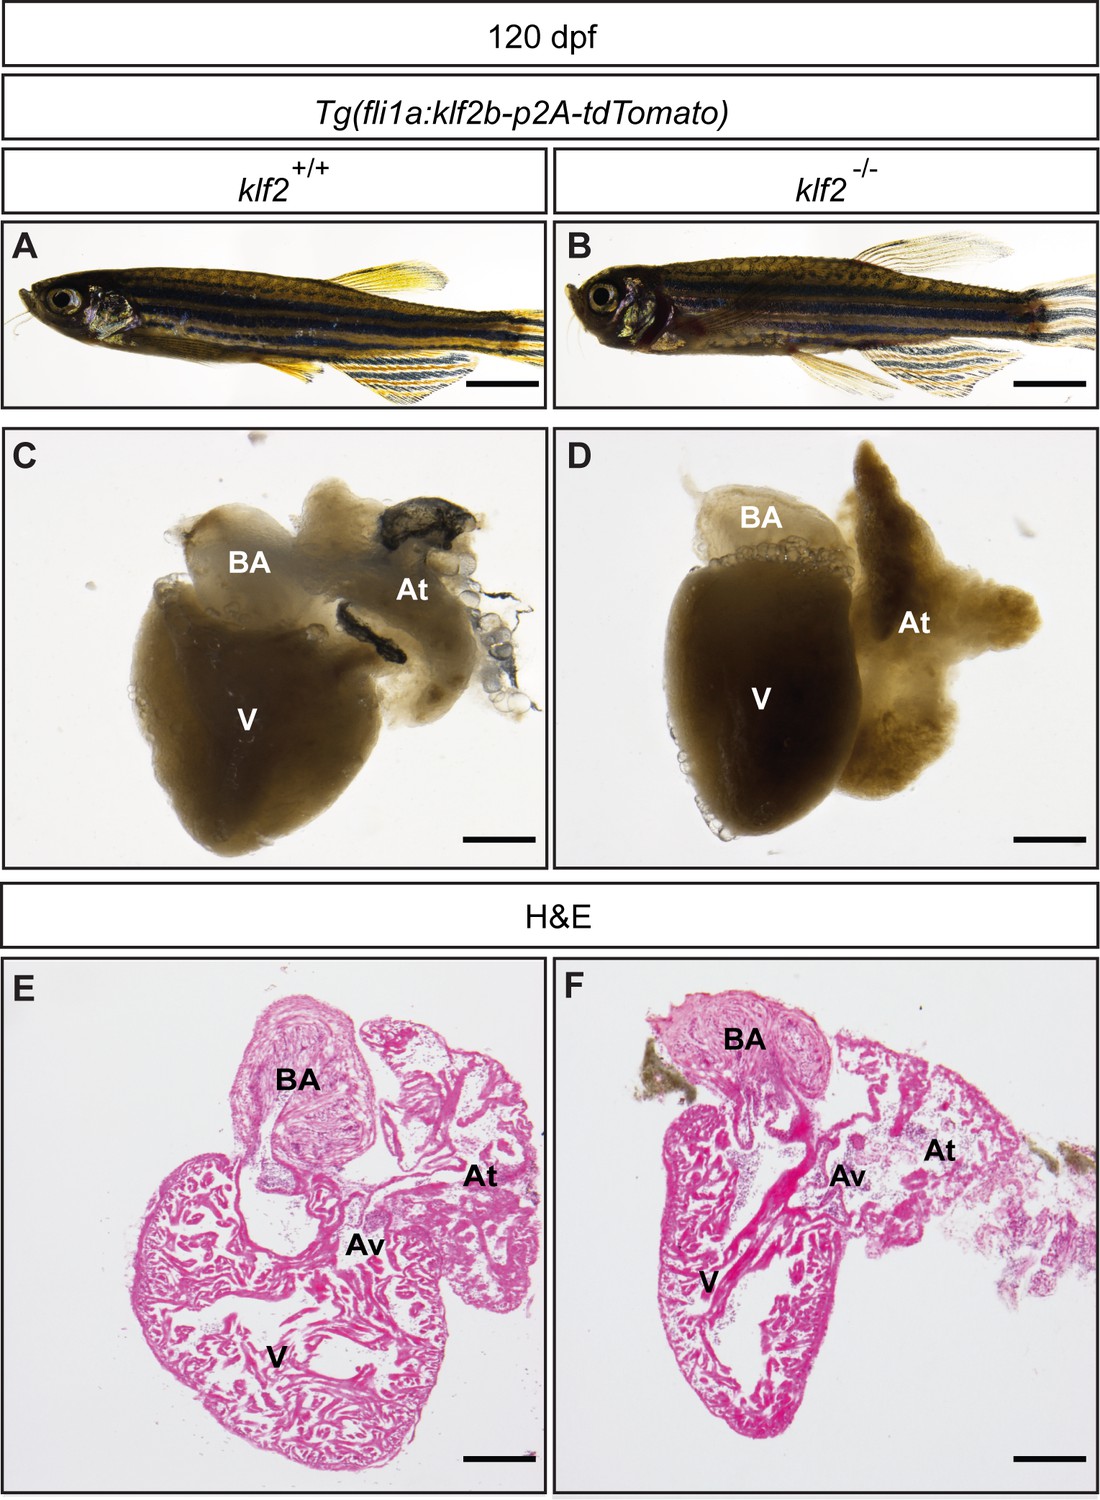
klf2 mutants rescued by endothelial klf2b overexpression can survive to adulthood.
(A–B) Representative brightfield images of 120 dpf Tg(fli1a:klf2b-p2A-tdTomato); klf2 WT (A) and mutant (rescued by endothelial klf2b overexpression) (B) animals. (C–D) Adult Tg(fli1a:klf2b-p2A-tdTomato); klf2 WT (C) and rescued mutant (D) hearts from fish shown in (A and B), respectively. (E–F) Hematoxylin and eosin staining of adult klf2 WT (E) and rescued mutant (F) heart sections. V: ventricle, At: atrium, Av: atrioventricular canal; BA: bulbus arteriosus; scale bars: 5 mm (A–B), 200 µm (C–F).
Figure 6 with 9 supplements
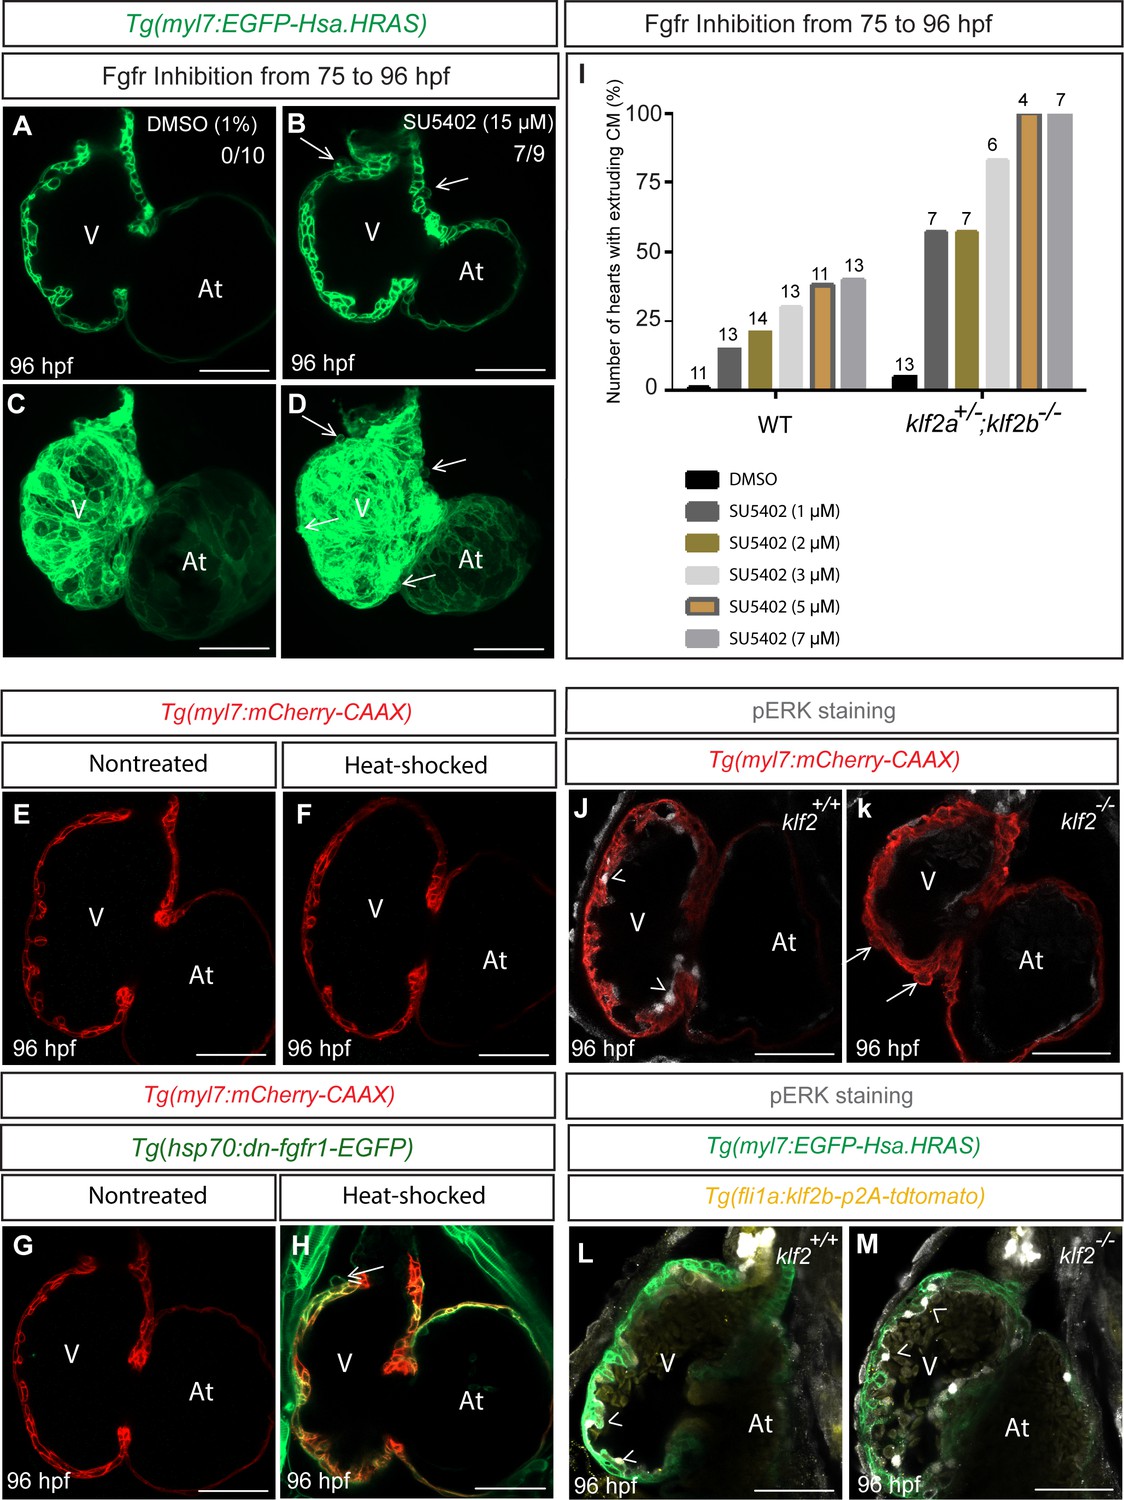
Inhibition of Fgfr signaling can lead to cardiomyocyte extrusion in WT animals.
(A–D) Confocal images of 96 hpf hearts; WT animals treated with DMSO as a control or FGFR inhibitor (SU5402) from 75 to 96 hpf; maximum intensity projections of hearts in (A) and (D) are shown in (C) and (D) respectively; arrows point to extruding cardiomyocytes. (E–H) 75 hpf Tg(myl7: mCherry-CAAX) (E–F) or Tg(hsp70:dn-fgfr1-EGFP);Tg(myl7: mCherry-CAAX) (G–H) animals were heat-stressed at 39°C for 1 hr (F and H) and their hearts imaged at 96 hpf; arrow in (H) points to an extruding cardiomyocyte (n = 9/13 hearts). (I) klf2a+/-; klf2b-/- animals are more likely than WT siblings to exhibit cardiomyocyte extrusion upon Fgfr inhibition; number of treated larvae for each condition is shown above the individual columns. (J–K) Hearts of 96 hpf Tg(myl7: mCherry-CAAX); klf2 +/+ or klf2 -/- animals immunostained for pERK. (L–M) Hearts of 96 hpf Tg(fli1a:klf2b-p2A-tdTomato);Tg(myl7:EGFP-Hsa.HRAS); klf2 +/+ or klf2 -/- animals immunostained for pERK. Arrows and arrowheads point to extruding cardiomyocytes and pERK positive endocardial cells, respectively; V: ventricle, At: atrium; scale bars, 50 µm.
-
Figure 6—source data 1
Upregulation of aldh1a2 and downregulation of cyp26b1 in klf2 mutant hearts compared to wild-type.
- https://doi.org/10.7554/eLife.38889.030
-
Figure 6—source data 2
Hedgehog signaling is affected in klf2 mutant hearts.
- https://doi.org/10.7554/eLife.38889.031
-
Figure 6—source data 3
fgf ligand and receptor genes are downregulated in klf2 mutant hearts.
- https://doi.org/10.7554/eLife.38889.032
Figure 6—figure supplement 1
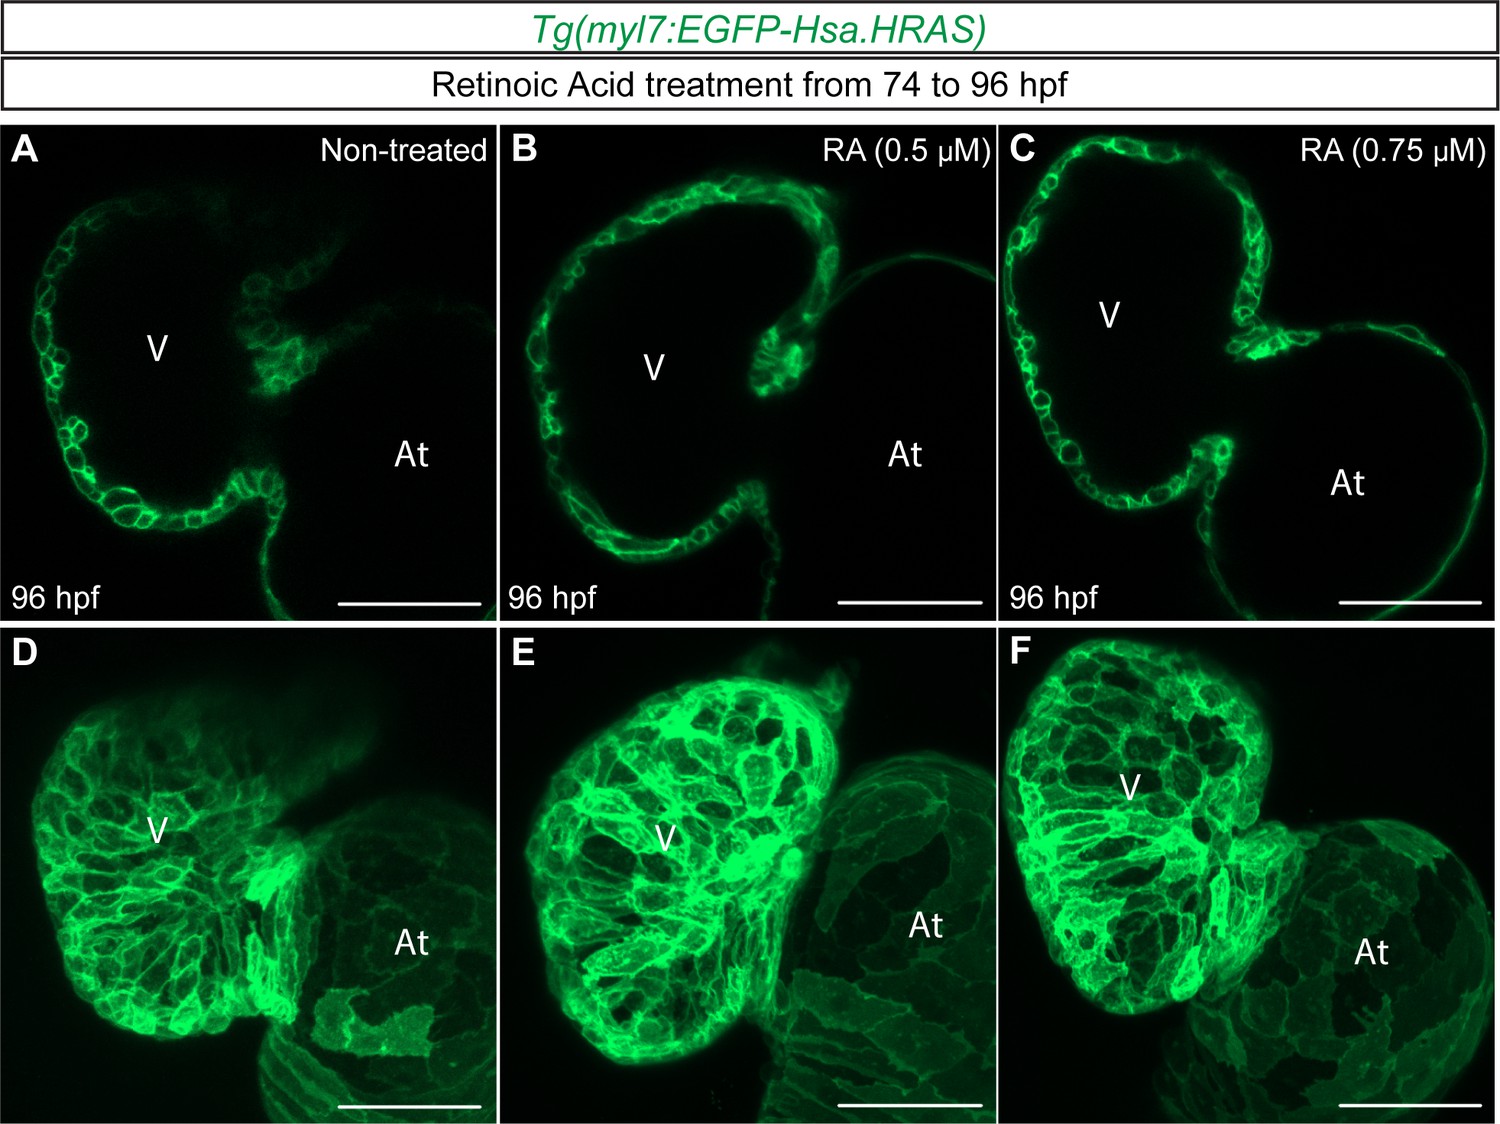
Increased Retinoic Acid signaling does not cause cardiomyocyte extrusion.
(A–F) 2D confocal images (mid-sagittal sections) of 96 hpf WT hearts, non-treated (n = 11 hearts) (A and D) or treated with retinoic acid (0.5 µM) (n = 13 hearts) (B and E) or (0.75 µM) (n = 10 hearts) (C and F) from 74 to 96 hpf; maximum intensity projections of hearts in (A) , (B) and (C) are shown in (D) , (E) and (F), respectively. V: ventricle, At: atrium; scale bars, 50 µm.
Figure 6—figure supplement 2
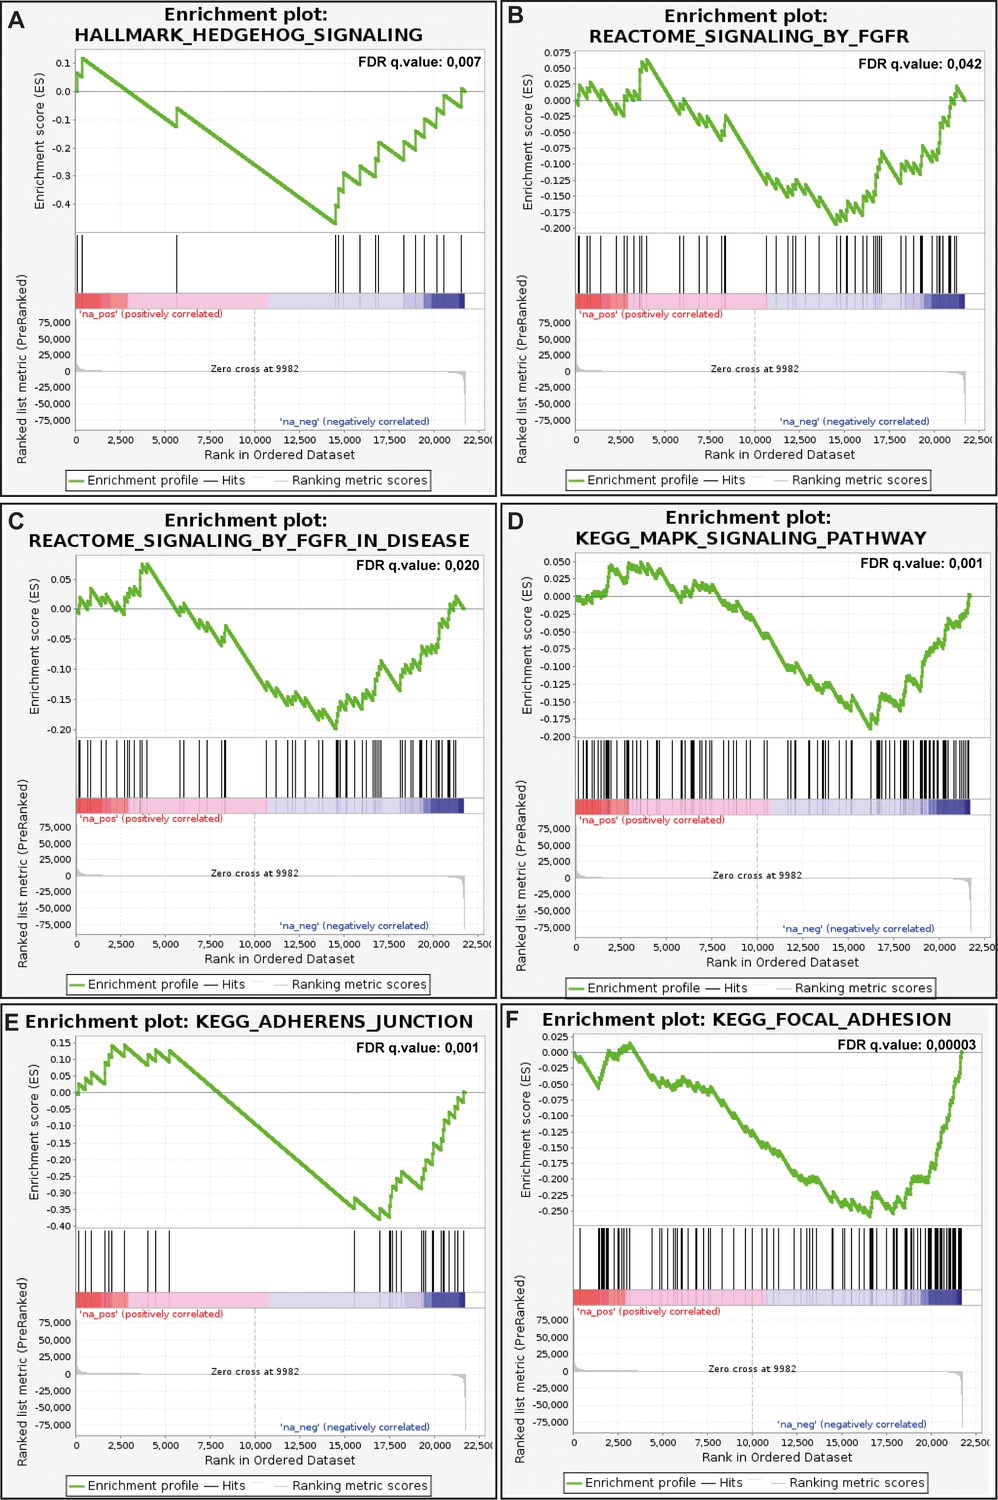
Broad GSEA enrichment plots of selected down-regulated gene sets.
(A–F) The Broad gene set enrichment algorithm (GSEA) was used to identify gene sets down-regulated in klf2 mutant hearts. The gene sets were selected at an FDR < 0.05 from the Hallmark, KEGG and Reactome databases. Enrichment plots show an ordered list of genes (black vertical bars) sorted from the most up-regulated (left) to the most down-regulated (right). Enrichment scores (green) show overrepresentation of down-regulated genes in these gene sets.
Figure 6—figure supplement 3
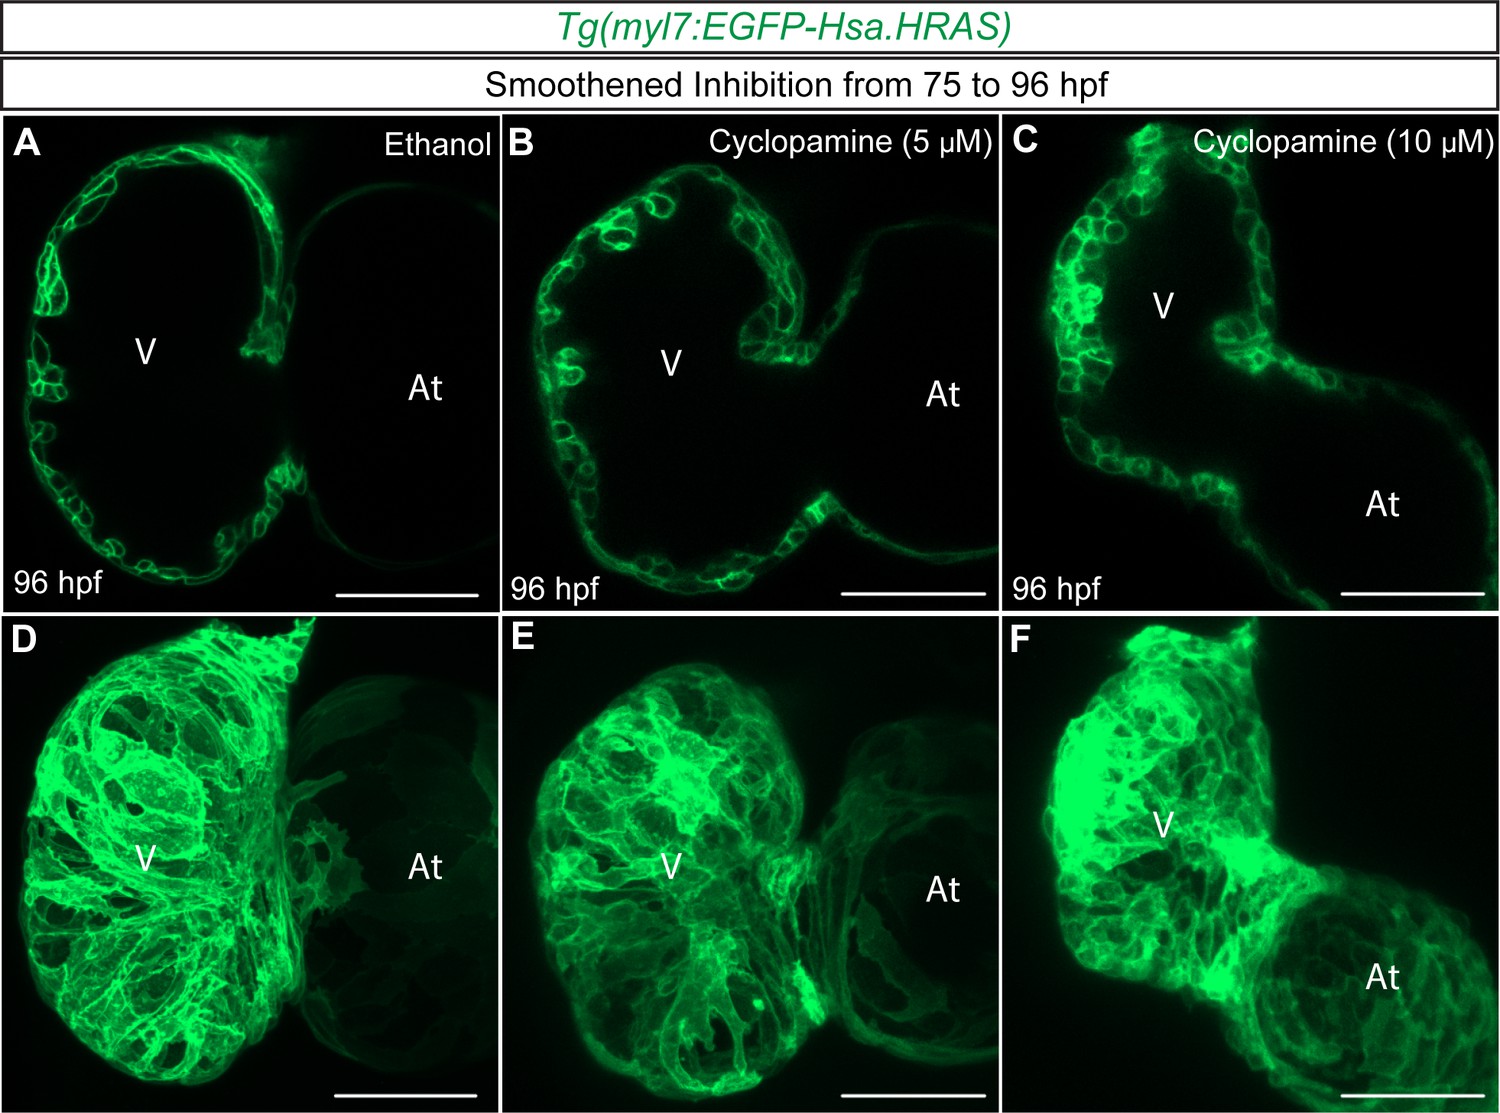
Inhibition of Hedgehog signaling does not cause cardiomyocyte extrusion.
(A–F) 2D confocal images (mid-sagittal sections) of 96 hpf WT hearts, treated with ethanol (n = 15 hearts) (A and D), or the Smoothened inhibitor Cyclopamine (5 µM) (n = 17 hearts) (B and E) or (10 µM) (n = 21 hearts) (C and F) from 75 to 96 hpf; maximum intensity projections of hearts in (A) , ( B) and (C) are shown in (D) , (E) and F), respectively. V: ventricle, At: atrium; scale bars, 50 µm.
Figure 6—figure supplement 4
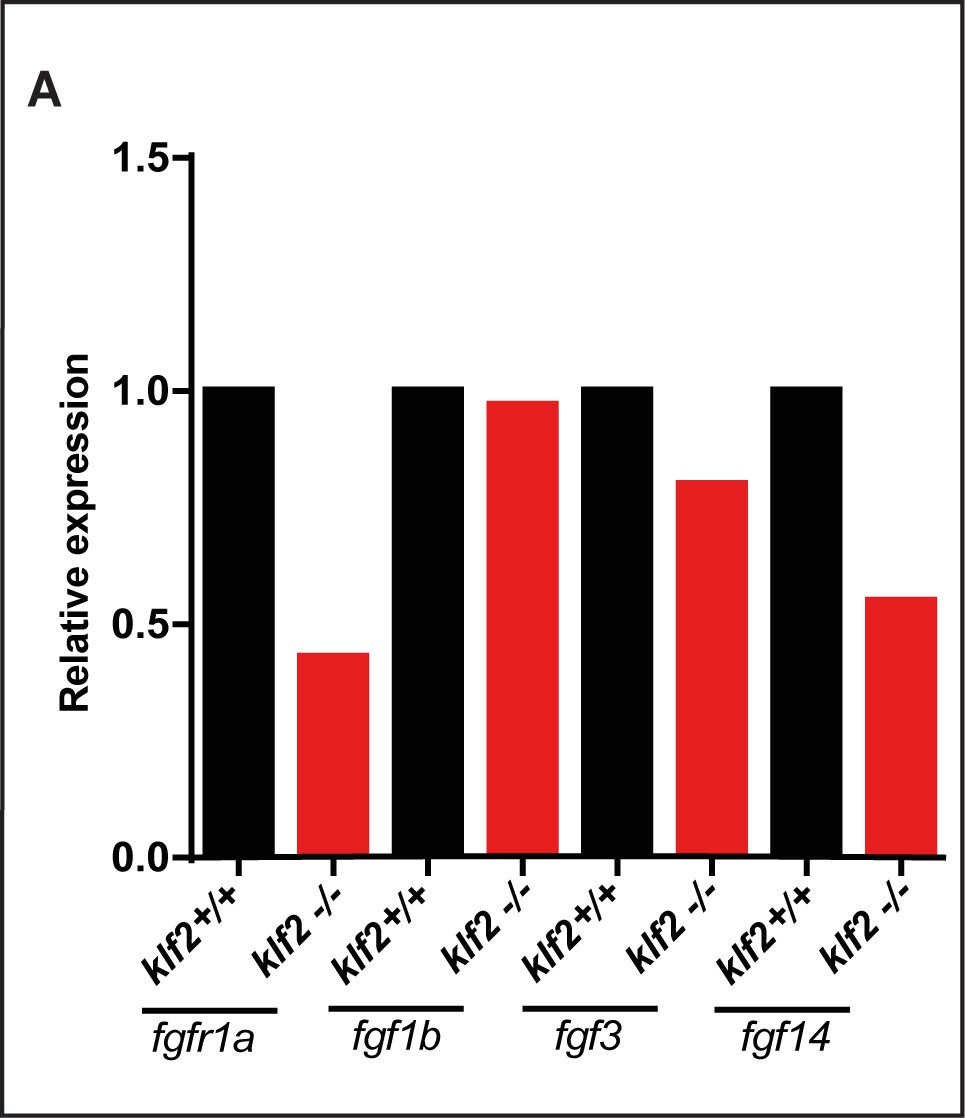
mRNA levels of fgf ligand and receptor genes in WT and klf2 mutant hearts.
(A) qPCR analysis of fgfr1a, fgf1b, fgf3 and fgf14 expression in WT and klf2 mutant hearts at 96 hpf (95 embryos were pooled for each sample). Ct and dCt values are listed in Supplementary file 3.
Figure 6—figure supplement 5
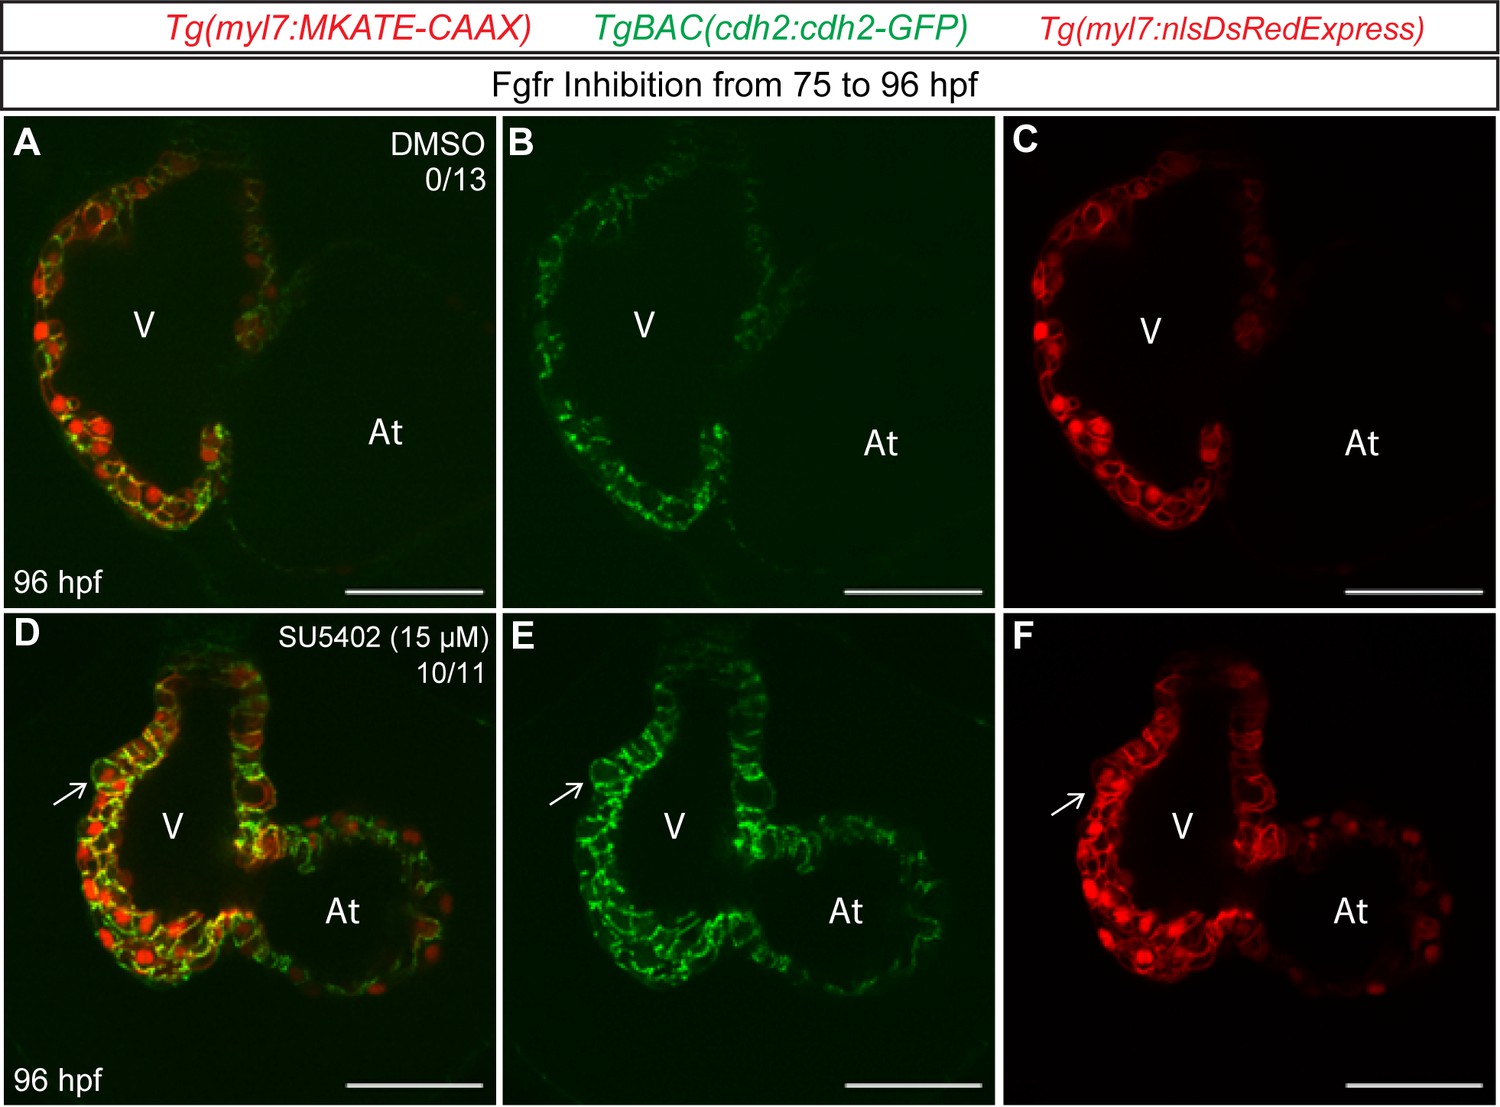
Inhibition of Fgfr signaling can lead to Cdh2-GFP mislocalization in cardiomyocytes.
(A–F) 2D confocal images (mid-sagittal sections) of 96 hpf hearts treated with DMSO (A–C) or SU5402 (D–F) from 75 to 96 hpf; arrows point to extruding cardiomyocytes. V: ventricle, At: atrium; scale bars, 50 µm.
Figure 6—figure supplement 6

Additional quantification of the cardiomyocyte extrusion phenotype upon Fgfr inhibition.
(A) Number of extruding cardiomyocytes in 96 hpf hearts. (B) Number of extruding cardiomyocytes upon inhibition of Fgfr signaling using the SU5402 inhibitor; dots in (A) and (B) represent individual hearts. Area (C) and circularity (D) of 96 hpf cardiomyocytes in ventricular outer curvature; dots in (C) and (D) represent individual cardiomyocytes.
Figure 6—figure supplement 7
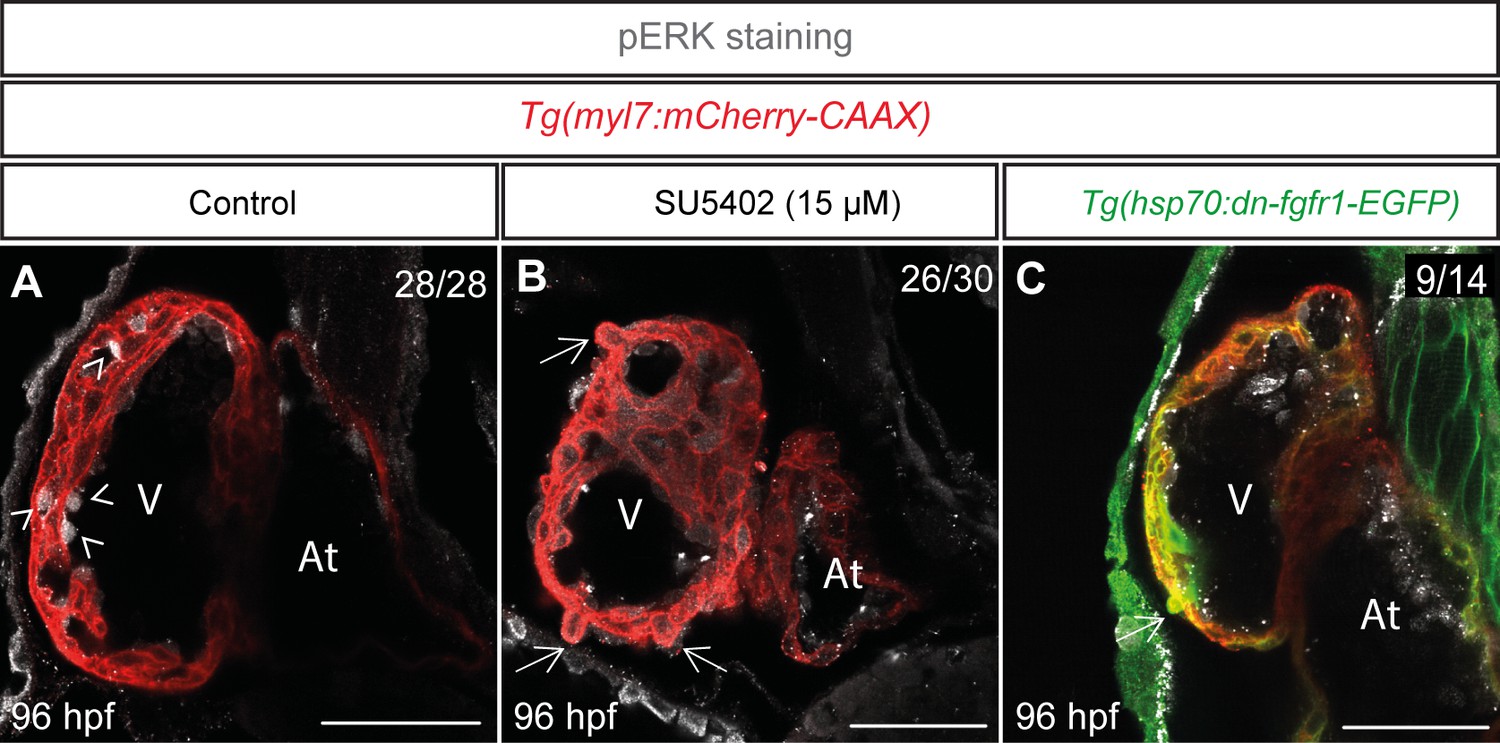
Fgf signaling is required for ERK phosphorylation in endocardial cells.
(A–C) pERK immunostaining of control, SU5402 treated and heat-shockedTg(hsp70:dn-fgfr1-EGFP) hearts. Arrows and arrowheads point to extruding cardiomyocytes and pERK-positive endocardial cells, respectively; V: ventricle, At: atrium; scale bars, 50 µm.
Figure 6—figure supplement 8
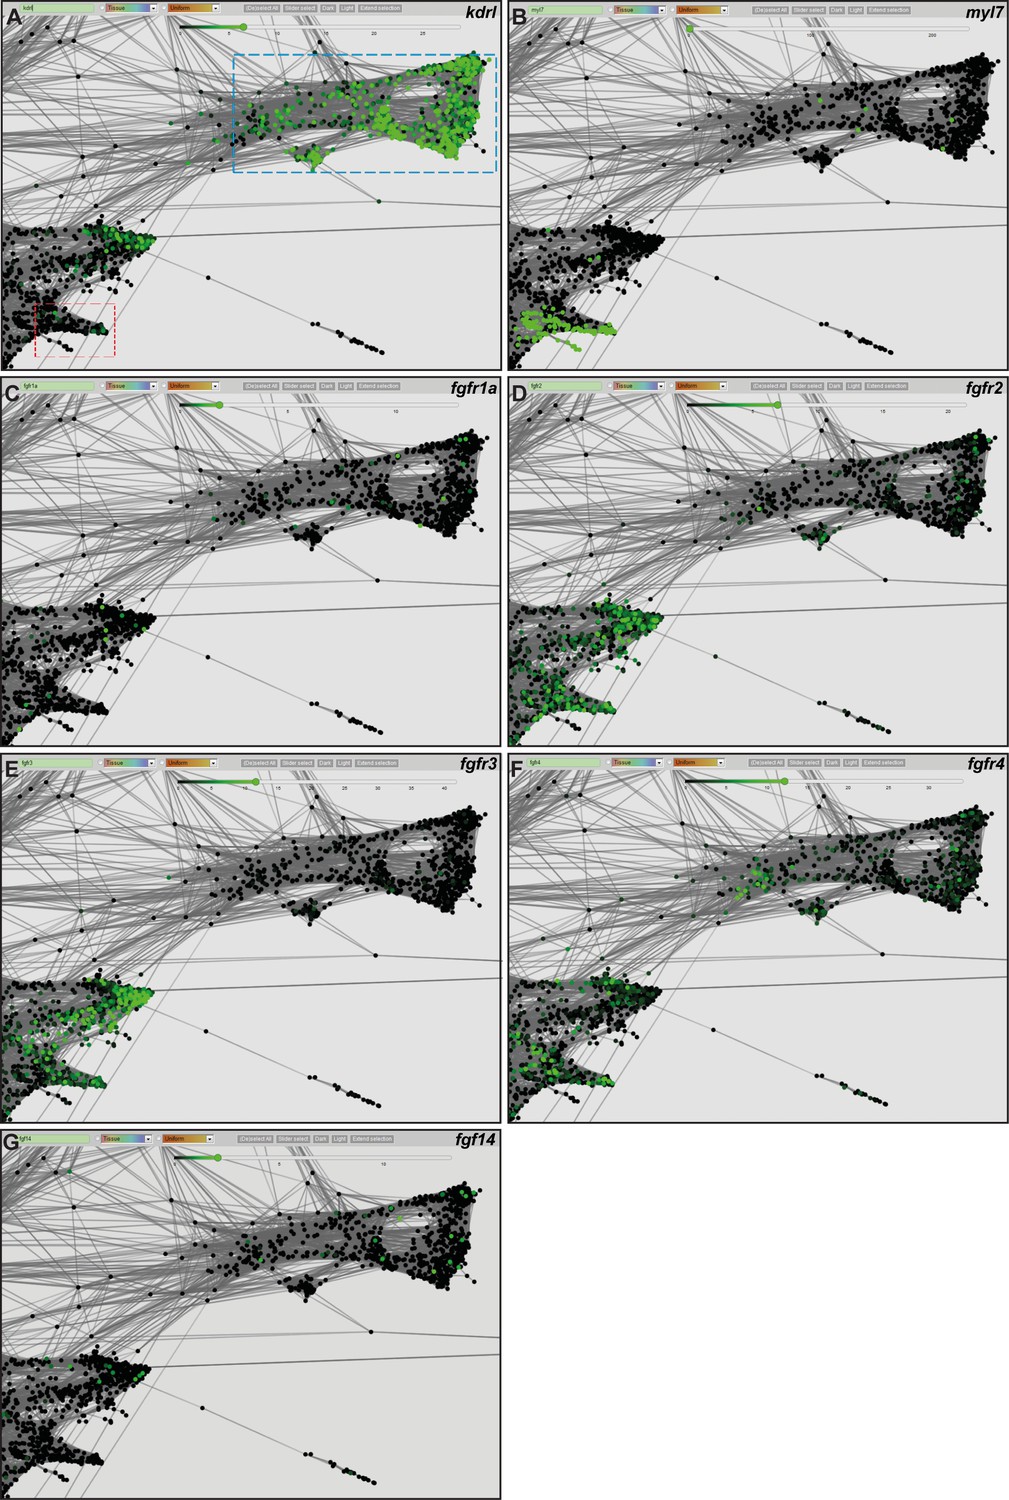
Single cell graphs of fgf receptor and ligand genes expressed in zebrafish embryonic endothelium and heart.
(A–F) Single cell graphs of kdrl (A), myl7 (B), fgfr1a (C), fgfr2 (D), fgfr3 (E), fgfr4 (F), and fgf14 (G) genes; blue and red boxes outline endothelium and heart, respectively.
Figure 6—figure supplement 9
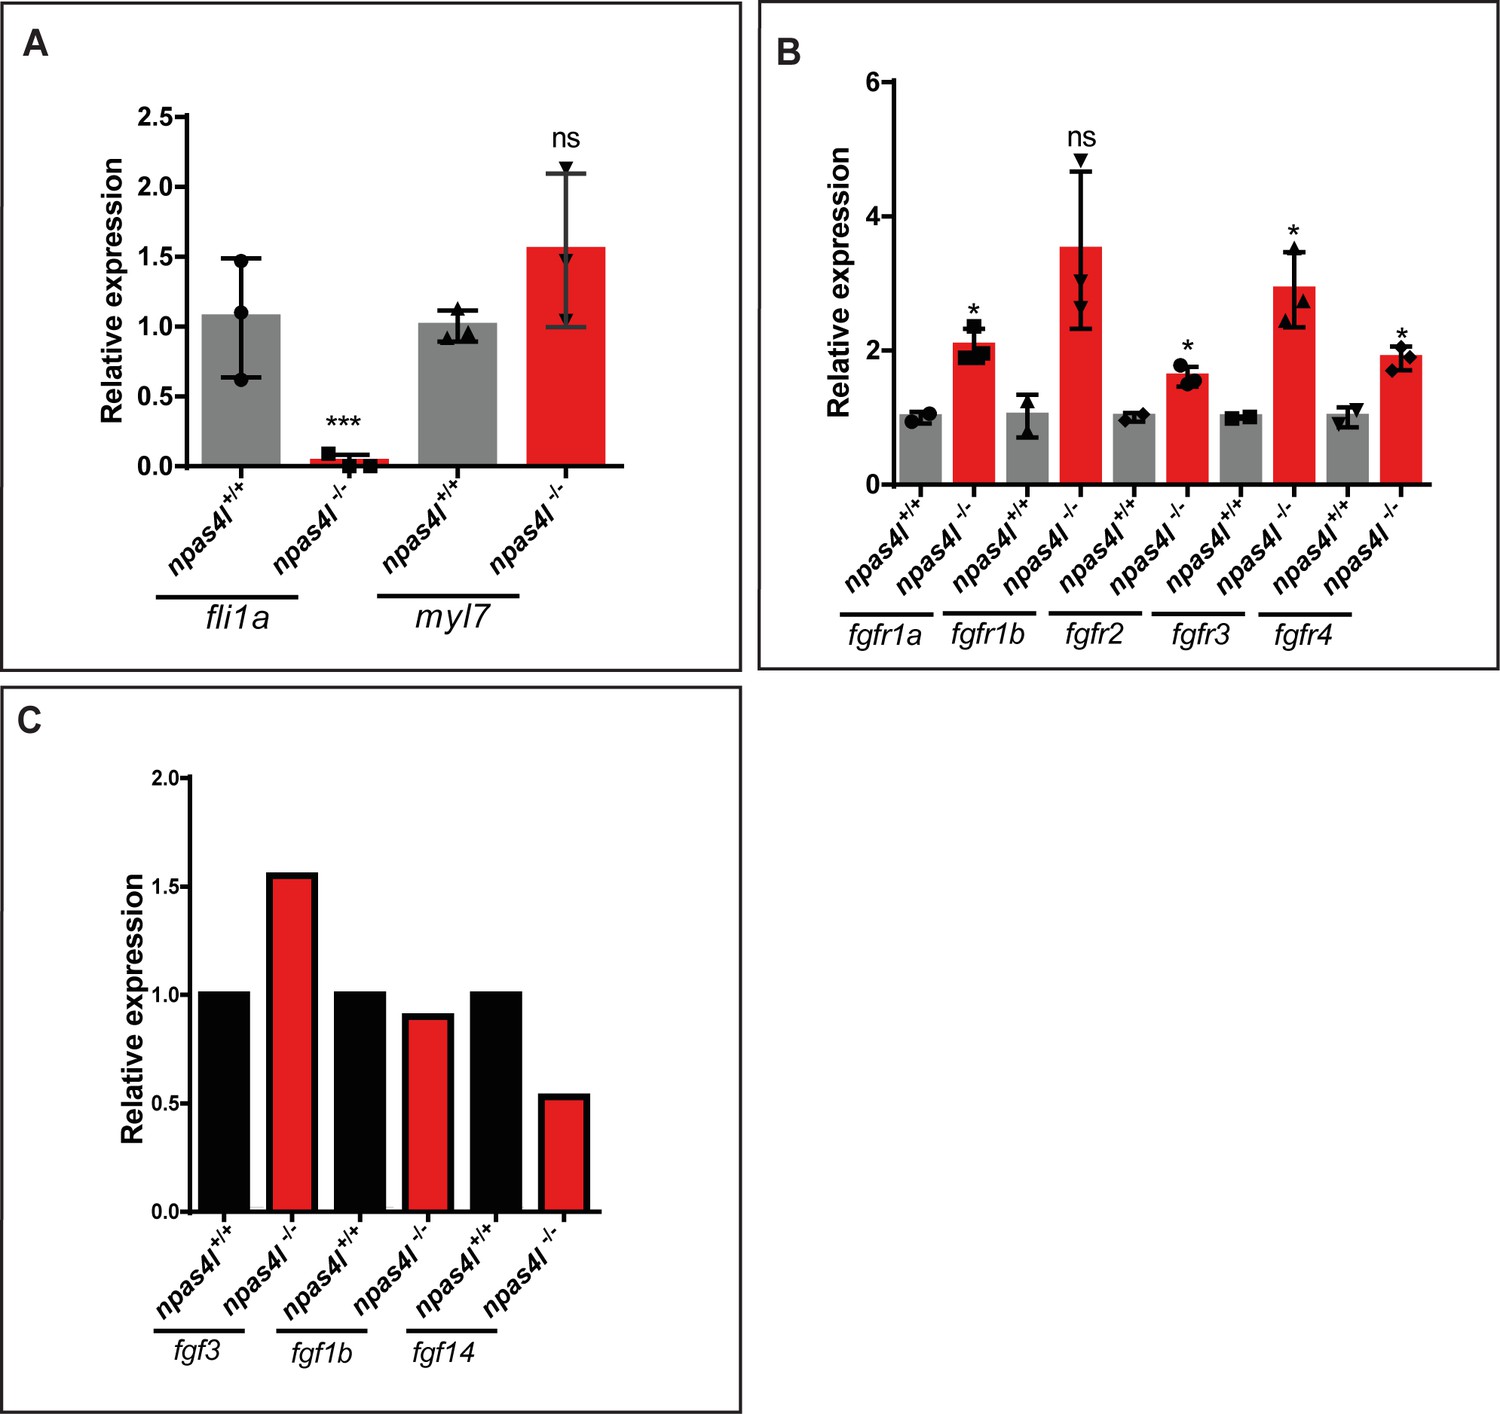
mRNA levels of fgf ligand and receptor genes in WT and npas4l mutant hearts.
(A–C) qPCR analysis of fli1a and myl7 (A), fgfr1a, fgfr1b, fgfr2, fgfr3 and fgfr4 (B), fgf 3, fgf1b and fgf14 (C) mRNA levels in 75 hpf npas4l WT and mutant hearts; n = 3 biological replicates; values represent means ±s.e.m.; *p≤0.05, ***, p≤0.001, ns (not significant), by Student’s t-test in (A) and (B); 75 embryos were pooled for each sample in (C). Ct and dCt values are listed in Supplementary file 3. V: ventricle, At: atrium; scale bars: 0.5 mm (A–F), 50 µm (G–O).
Tables
Key resources table
| Reagent type (species) or resource | Designation | Source or reference | Identifiers | Additional information |
|---|---|---|---|---|
| Genetic reagent (Danio rerio) | klf2abns11 | (Kwon et al., 2016) | ||
| Genetic reagent (Danio rerio) | klf2bbns12 | (Kwon et al., 2016) | ||
| Genetic reagent (Danio rerio) | Tg(myl7: LIFEACT- GFP)s974 | (Reischauer et al., 2014) | ZFIN ID: ZDB-ALT-150203–1 | |
| Genetic reagent (Danio rerio) | Tg(myl7: mCherry- CAAX)bns7 | (Uribe et al., 2018) | ZFIN ID: ZDB-ALT-181102–5 | |
| Genetic reagent (Danio rerio) | Tg(myl7- MKATE- CAAX)sd11 | (Lin et al., 2012) | ZFIN ID: ZDB-ALT-120320–1 | |
| Genetic reagent (Danio rerio) | Tg(myl7:EGFP- Hsa.HRAS)s883 | (D'Amico et al., 2007) | ZFIN ID: ZDB-ALT-070309–1 | |
| Genetic reagent (Danio rerio) | TgBAC (etv2-EGFP) ci1 | (Proulx et al., 2010) | ZFIN ID: ZDB-ALT-110131–53 | |
| Genetic reagent (Danio rerio) | Tg(−0.8myl7: nlsDsRed Express)hsc4 | (Takeuchi et al., 2011) | ZFIN ID: ZDB-ALT-110222–3 | |
| Genetic reagent (Danio rerio) | Tg(myl7: mVenus- gmnn)ncv43 | (Jiménez-Amilburu et al., 2016) | ZFIN ID: ZDB-ALT-170131–3 | |
| Genetic reagent (Danio rerio) | TgBAC(cdh2:cdh2- EGFP,crybb1: ECFP)zf517 | (Revenu et al., 2014) | ZFIN ID: ZDB-ALT-141218–5 | |
| Genetic reagent (Danio rerio) | Tg(hsp70:dn- fgfr1-EGFP)pd1 | (Lee et al., 2005) | ||
| Genetic reagent (Danio rerio) | Tg(fli1a:klf2b- p2a-td Tomato)bns235 | This paper | Details in Materials and methods | |
| Genetic reagent (Danio rerio) | Tg(myl7:klf2a- p2a-td Tomato)bns200 | This paper | Details in Materials and methods | |
| Genetic reagent (Danio rerio) | Tg(myl7:klf2b- p2a-td Tomato)bns234 | This paper | Details in Materials and methods | |
| Genetic reagent (Danio rerio) | Tg(−0.2myl7: tdTomato- podxl)bns197 | This paper | Details in Materials and methods | |
| Genetic reagent (Danio rerio) | TgBAC(tcf21: NLS-EGFP)pd41 | (Wang et al., 2015) | ZFIN ID: ZDB-ALT-110914–2 | |
| Genetic reagent (Danio rerio) | TgBAC(tcf21: mCherry- NTR) pd108 | (Wang et al., 2015) | ZFIN ID: ZDB-ALT-150904–1 | |
| Sequence-based reagent | tnnt2a morpholino | (Sehnert et al., 2002) | ZFIN ID: ZDB- MRPHLNO-060317–4 | |
| Sequence-based reagent | amhc morpholino | (Berdougo et al., 2003) | ZFIN ID: ZDB- MRPHLNO-061110–1 | |
| Sequence-based reagent | cdh2 morpholino | (Lele et al., 2002) | ZFIN ID: ZDB- MRPHLNO-060815–1 | |
| Commercial assay or kit | RNA Clean and Concentrator kit | Zymo Research | ||
| Software | ZEN Blue 2012 | Zeiss, Germany | ||
| Software | ZEN Black 2012 | Zeiss, Germany |
Author response table 1
| Transcript ID | Gene | klf2 WT | klf2 Mut | klf2 Mut/WT ratio |
| ENSDART00000124346 | fn1a | 3717 | 4062 | 1,09 |
| ENSDART00000010521 | fn1a | 3905 | 4104 | 1,05 |
| ENSDART00000023692 | fn1b | 2666 | 2493 | 0,93 |
| ENSDART00000103755 | fn1b | 2689 | 2393 | 0,88 |
| ENSDART00000099132 | vcana | 452 | 1053 | 2,32 |
| ENSDART00000144973 | vcana | 906 | 2080 | 2,29 |
| ENSDART00000134304 | vcanb | 401 | 343 | 0,85 |
| ENSDART00000012522 | vcanb | 342 | 210 | 0,61 |
Additional files
-
Supplementary file 1
List of qPCR primers.
- https://doi.org/10.7554/eLife.38889.033
-
Supplementary file 2
Downregulated pathways in klf2 mutants.
- https://doi.org/10.7554/eLife.38889.034
-
Supplementary file 3
Ct and dCt values of qPCR data.
- https://doi.org/10.7554/eLife.38889.035
-
Transparent reporting form
- https://doi.org/10.7554/eLife.38889.036
Download links
A two-part list of links to download the article, or parts of the article, in various formats.
Downloads (link to download the article as PDF)
Open citations (links to open the citations from this article in various online reference manager services)
Cite this article (links to download the citations from this article in formats compatible with various reference manager tools)
The flow responsive transcription factor Klf2 is required for myocardial wall integrity by modulating Fgf signaling
eLife 7:e38889.
https://doi.org/10.7554/eLife.38889


