Yeast Ded1 promotes 48S translation pre-initiation complex assembly in an mRNA-specific and eIF4F-dependent manner
- National Institutes of Health, United States
Figures
Figure 1 with 1 supplement
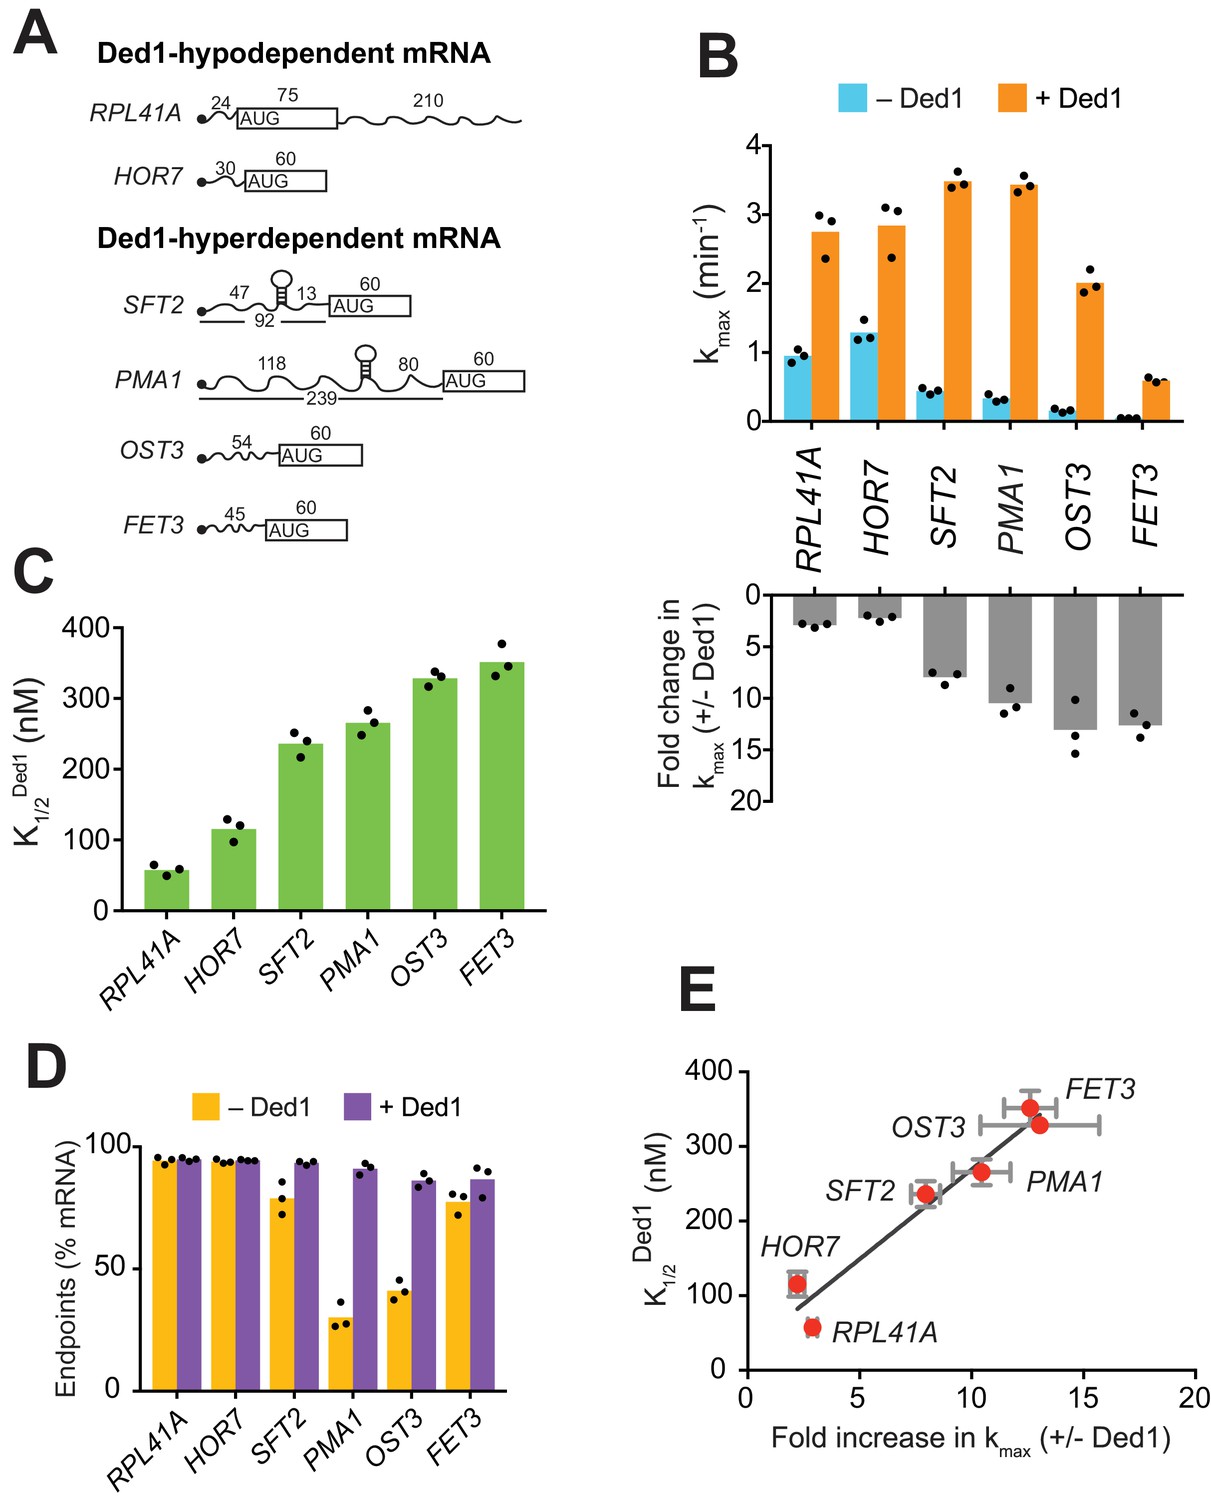
Ded1 confers relatively greater acceleration of 48S PIC assembly in vitro for native mRNAs hyperdependent on Ded1 in vivo.
(A) Schematics of native RPL41A mRNA, and mRNA reporters for other native yeast mRNAs comprised of the 5'-UTR and first 60 nt of the ORF. ORFs are depicted as boxes with an AUG start codon; wavy lines depict 5'- and 3'-UTRs of the indicated nucleotide lengths; black balls depict m7Gppp caps; SLs in the 5'-UTRs of SFT2 and PMA1 identified in vivo are shown as hairpins, whose folding free energies are given in Figure 2—figure supplement 1A. (B) Upper: Maximum rates of recruitment (kmax) in the absence (blue) and presence (orange) of saturating Ded1 for mRNAs in (A). Lower: Fold-changes in kmax with or without Ded1 calculated from data in upper plot. (C) Concentrations of Ded1 resulting in half-maximal rates . (D) Endpoints of mRNA recruitment as percentages of total mRNA (15 nM) bound to 48S PICs (30 nM) in absence (gold) or presence (purple) of saturating Ded1. (E) Plot of from (C) versus fold-change in from (B, lower) for each mRNA. Red points and error bars indicate mean values and one standard deviation, respectively, for each parameter. Line generated by linear regression analysis (Y = 24.02*X + 28.98, R2 = 0.944, p-value=0.001). (B–D) Bars indicate mean values calculated from the three independent experiments represented by the black data points. See Figure 1—figure supplement 1 and Figure 1 —source data 1.
-
Figure 1—source data 1
(Source data file for Figure 1).
- https://doi.org/10.7554/eLife.38892.005
Figure 1—figure supplement 1
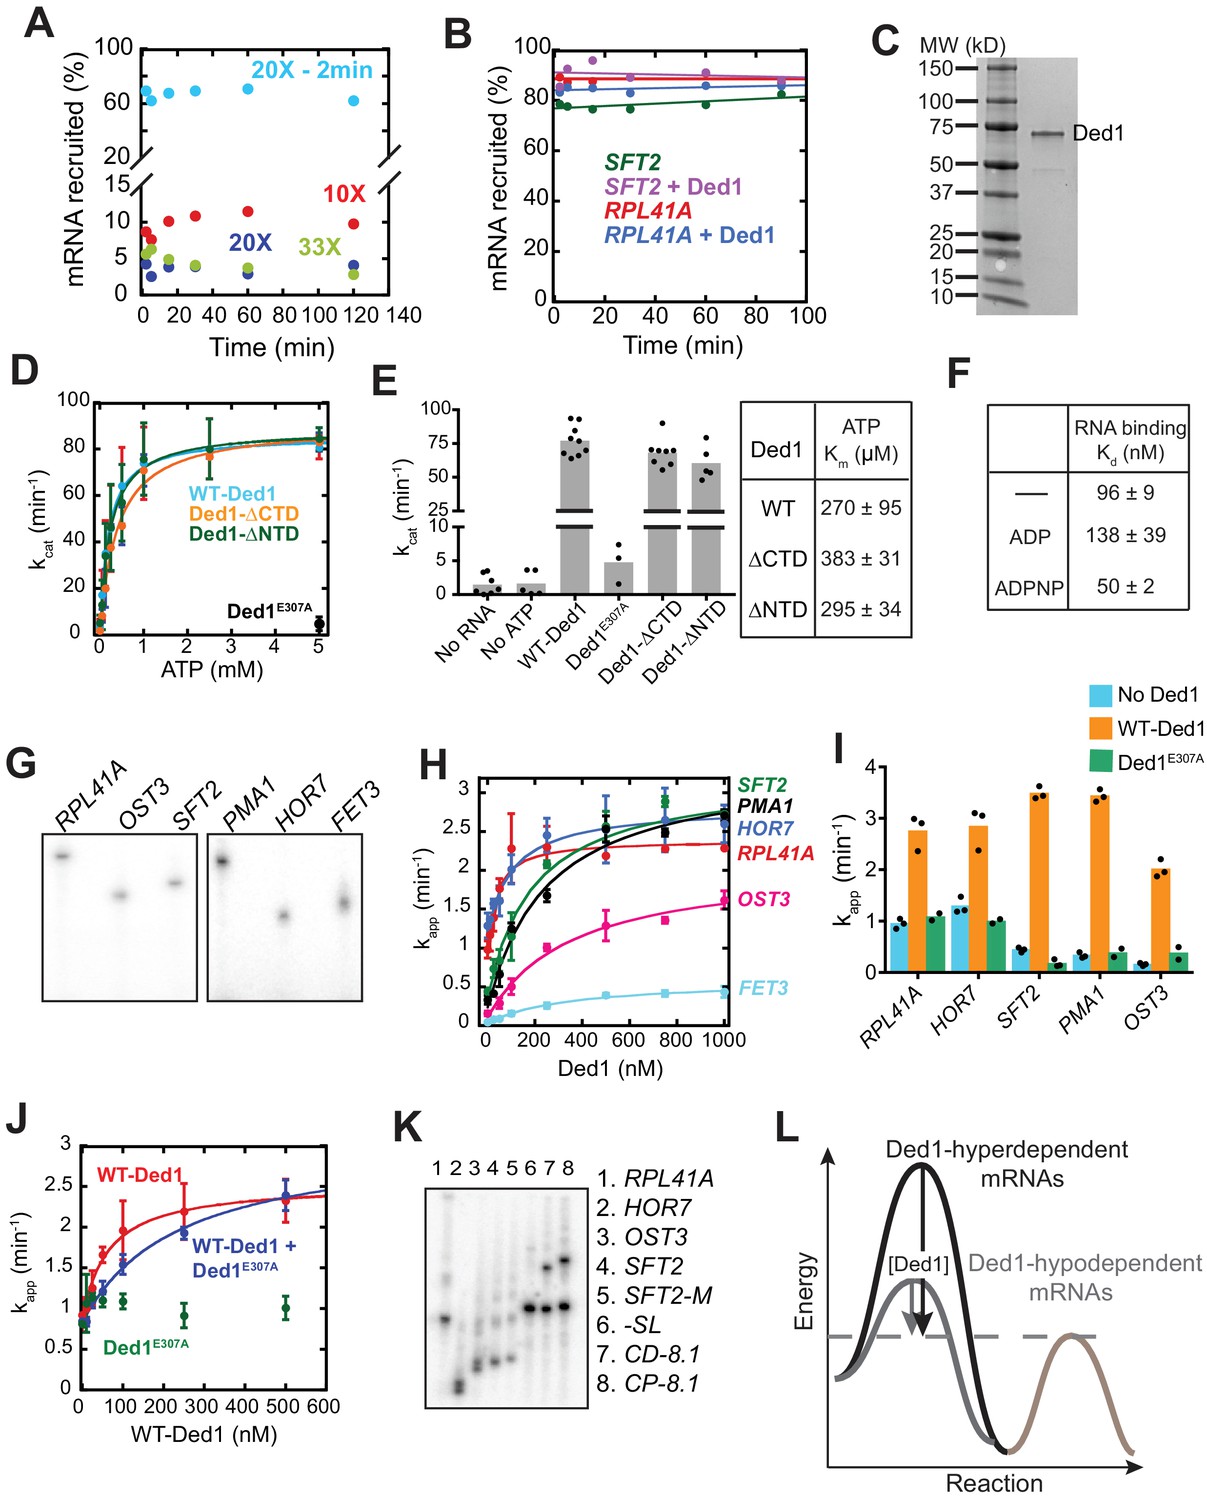
Catalytically active Ded1 stimulates 48S PIC assembly on native mRNAs.
(A) Addition of excess unlabeled capped RPL41A mRNA effectively stops recruitment of 32P labeled RPL41A mRNA. Unlabeled capped RPL41A was added along with 32P-labeled capped RPL41A mRNA (and ATP) at 10X (red), 20X (blue) or 33X (green) the amounts of labeled mRNA. The 20X addition completely inhibited detectable 48S PIC assembly on 32P-labeled mRNA, and a higher concentration of unlabeled RPL41A (~33X) did not confer further inhibition. The results for ‘20X – 2 min’ (cyan) show that addition of 20X unlabeled RPL41A after 2 min of incubation with 32P-capped RPL41A to form 48S PICs containing 32P-mRNA did not result in loss of signal from the complex on the timescale of the kinetic assays employed in this study indicating that the 48S PIC is stable to the chase once formed. Note the discontinuity in the Y-axis. (B) Dissociation of 48S PICs assembled on RPL41A and SFT2 mRNAs after addition of excess cold (non-radiolabeled) capped mRNA as a ‘pulse-quench’ was monitored over time. 48S PICs were assembled for 15 min with or without Ded1 and chased with an ~20 fold molar excess of the corresponding cold-capped mRNAs. The percentage of labeled mRNA remaining bound to 48S PICs was quantified after the indicated times of ‘pulse-quench’. No detectable dissociation was observed over the indicated time-course for these two mRNAs, or for any other mRNAs depicted in Figure 1A (data not shown), indicating that 48S PICs assembled on RPL41A and SFT2 mRNAs are highly stable and that cold-capped mRNAs only sequester unbound PICs. (C) Purified His6-Ded1 and size markers (lane 1) were resolved by SDS-PAGE on a 4 – 15% gel and stained with SimplyBlue Safestain. (D) Observed rates of RNA-dependent ATP hydrolysis at different ATP concentrations in the presence of saturating (2 μM) uncapped RPL41A mRNA for WT and mutant Ded1 proteins, the latter harboring the alanine substitution of Glu-307 (E307A) in the DEAD motif (Ded1E307A); or truncations of the NTD or CTD domain, as indicated in Figure 4—figure supplement 1A. Data from two independent experiments are shown, plotting mean values ± 1 SD. Data was fitted with the Michaelis-Menten equation. (E) kcat values (at saturating ATP concentration of 5 mM) and were determined from the experiments described in (D). WT Ded1, Ded1-ΔCTD, and Ded1-ΔNTD have similar kcat and ’ values, whereas reaction kinetics with Ded1E307A are comparable to ‘No mRNA’ and ‘No ATP’ controls conducted with WT Ded1. The ATPase activity of WT Ded1 is similar to previously published values, ranging from kcat = 30 – 680 min-1 depending on the RNA substrate used, and Km values for ATP of 280 – 340 μM (Iost et al., 1999; Senissar et al., 2014). Note the discontinuity in the Y-axis. Bars represent the mean with dots as individual experimental values (n≥ 3). is expressed as mean values ± 1 SD. (F) Binding affinity of WT Ded1 for single-stranded RNA was determined in the presence or absence of the indicated nucleotides (5 mM) by measuring changes in fluorescence anisotropy of a single-stranded RNA labeled with 3'- 6-Fluorescein over Ded1 concentrations ranging from 0 to 750 nM. The determined Kd values are similar to previously reported measurements: Kd = 180 – 230 nM (no nucleotide); 210 – 290 nM (ADP); and 35 – 40 nM (ADPNP) (Banroques et al., 2008; Iost et al., 1999). Addition of buffer in the absence of Ded1 produced no change in fluorescence anisotropy of the RNA. Mean values ± 1 SD are reported (n = 2). (G) [α32P]-capped mRNAs used in mRNA recruitment assays in Figure 1A resolved by electrophoresis on a 6% denaturing urea-TBE gel. (H) The apparent rates (kapp) of 48S PIC assembly measured as a function of Ded1 concentration for the indicated mRNAs. Data were fitted to a hyperbolic curve with an offset to account for the rates observed in the absence of Ded1, allowing calculation of kmax and values reported in Figure 1B–C, respectively. Data points are mean values with error bars (1 SD) at different Ded1 concentrations (n = 3). (I) Ded1 stimulation of mRNA recruitment is dependent on the ATPase activity of Ded1. Mean observed rates of 48S assembly (n = 3) with no Ded1 (blue bars), saturating Ded1 (orange bars, determined as in Figure 1B), and ATPase deficient mutant Ded1E307A (green bars). (J) Interference by Ded1E307A with WT Ded1 stimulation of RPL41A recruitment. Ded1E307A was added at 500 nM to reactions containing the indicated concentrations of WT Ded1 (blue curve) and the kinetics of mRNA recruitment were measured and compared to those obtained with WT Ded1 (red curve) or Ded1E307A (green points) alone. Mixing Ded1E307A with WT Ded1 increased the to 253 ± 27 nM from 60 ± 7 nM observed for WT Ded1 alone, but did not diminish kmax, consistent with the mutant functioning as a competitive inhibitor. (K) [α32P]-capped mRNAs resolved by electrophoresis on a 4% non-denaturing gel. mRNAs exhibit isoforms of different mobility (mRNA only lanes). (L) Ded1-hyperdendent mRNAs have a higher energy barrier (dark grey) as compared to Ded1-hypodependent mRNAs (light grey) and require higher Ded1 concentrations to lower the activation energy for the Ded1-accelerated rate-limiting step until the energy barrier for a non-Ded1 dependent step (blue) becomes rate-limiting. For OST3 and FET3 mRNAs, Ded1 can only partially lower the energy barrier (red dotted line). See Figure 1—figure supplement 1 —source data 1.
-
Figure 1—figure supplement 1—source data 1
(Source data file for Figure 1—figure supplement 1).
- https://doi.org/10.7554/eLife.38892.004
Figure 2 with 1 supplement
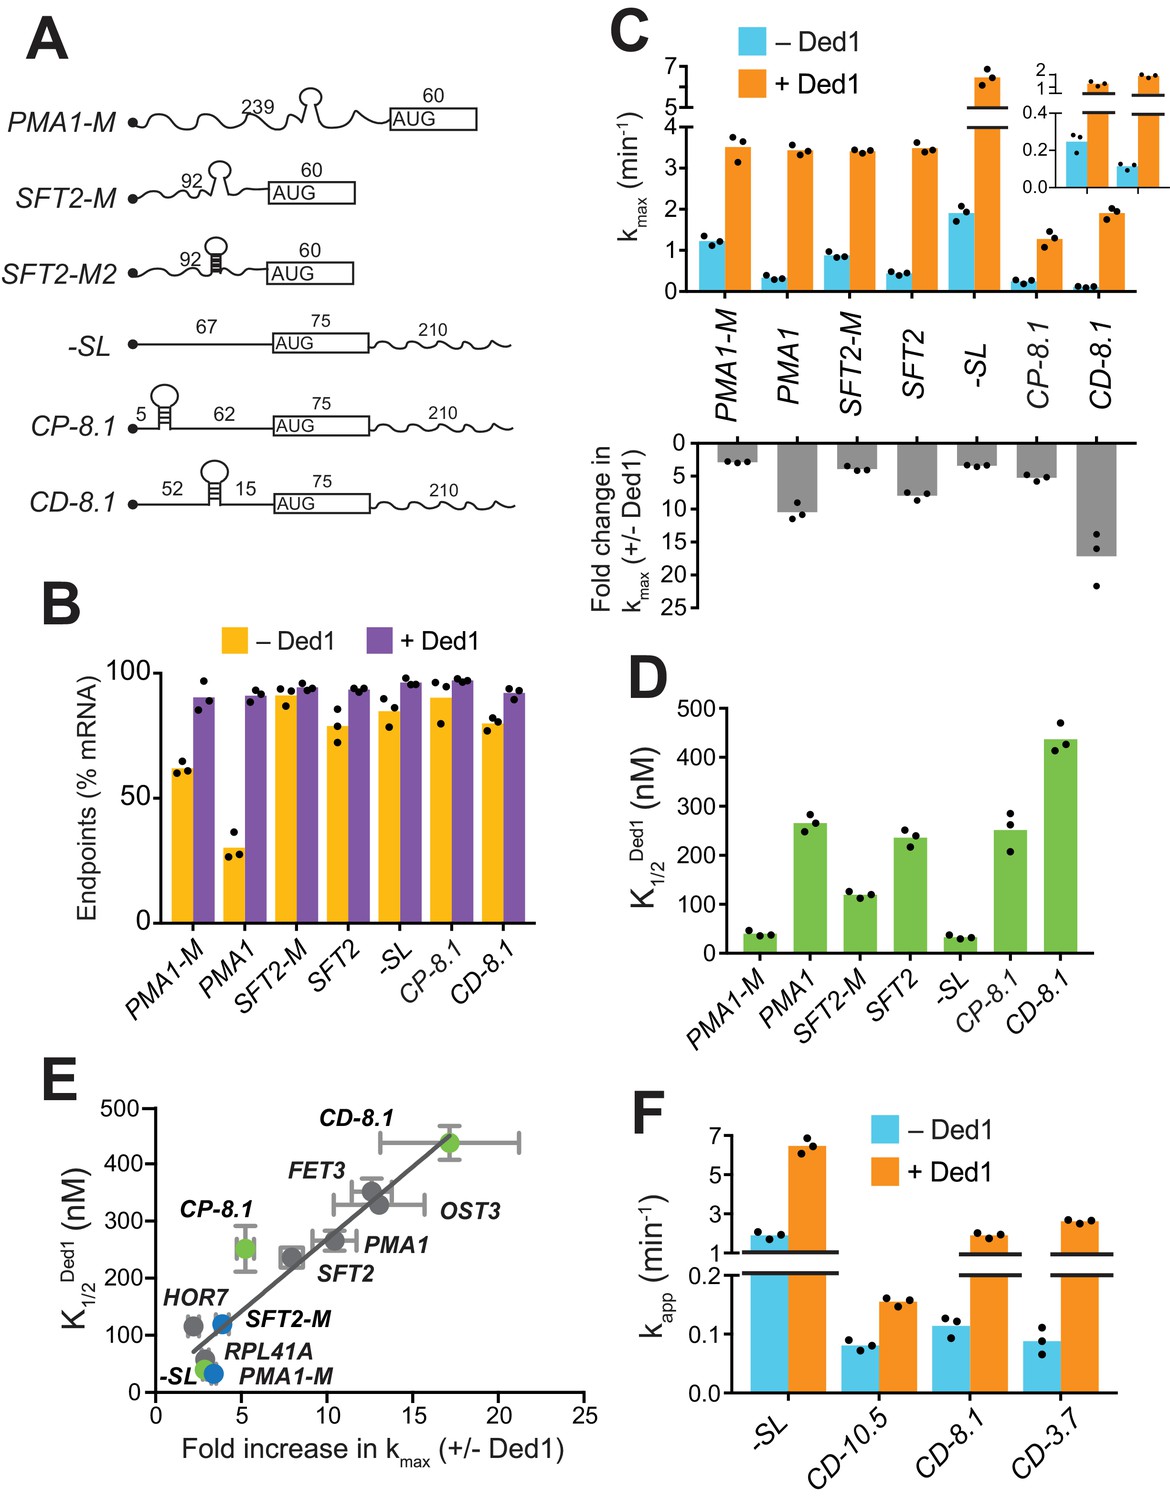
Secondary structures in 5'-UTRs confer Ded1-hyperdependence in accelerating 48S PIC assembly in vitro.
(A) Schematics of derivatives of natural mRNAs from Figure 1A mutated to decrease (SFT2-M and PMA1-M) or increase (SFT2-M2) the stability of 5'-UTR SLs; and synthetic mRNAs depicted as in Figure 1A. The sequences of SLs and mutations are in Figure 2—figure supplement 1A. (B) Endpoints of 48S PIC assembly reactions, determined as in Figure 1D. (C) kmax values (upper) and fold-change in kmax (lower) in the presence versus absence of Ded1, determined as in Figure 1B. The inset in the upper panel scales the y-axis to display the low kmax values for CD-8.1 and CP-8.1 mRNAs without Ded1. Note that Y-axis is discontinuous. (D) values determined as in Figure 1C. (E) Plot of from (D) versus fold-change in from (C, lower) for the indicated mRNAs. Gray, blue, and green points indicate natural, mutated, and synthetic mRNAs, respectively, with error bars indicating 1 SD; line produced by linear regression analysis (Y = 25.29*X + 15.28, R2 = 0.89, p-value<0.001). (F) Apparent rate of mRNA recruitment of synthetic mRNAs with different strengths SLs in the cap-distal region in the absence (blue) and presence of Ded1 (orange). G°: CD-10.5 = −10.5 kcal/mol, CD-8.1 = −8.1 kcal/mol, and CD-3.7 = −3.7 kcal/mol. Note that Y-axis is discontinuous. (B–D, F) Bars indicate mean values calculated from the three independent experiments represented by the data points. (B–D) WT PMA1 amd WT SFT2 data is added from Figure 1 for comparison. See Figure 2—figure supplement 1 and Figure 2—source data 1.
-
Figure 2—source data 1
(Source data file for Figure 2).
- https://doi.org/10.7554/eLife.38892.008
Figure 2—figure supplement 1
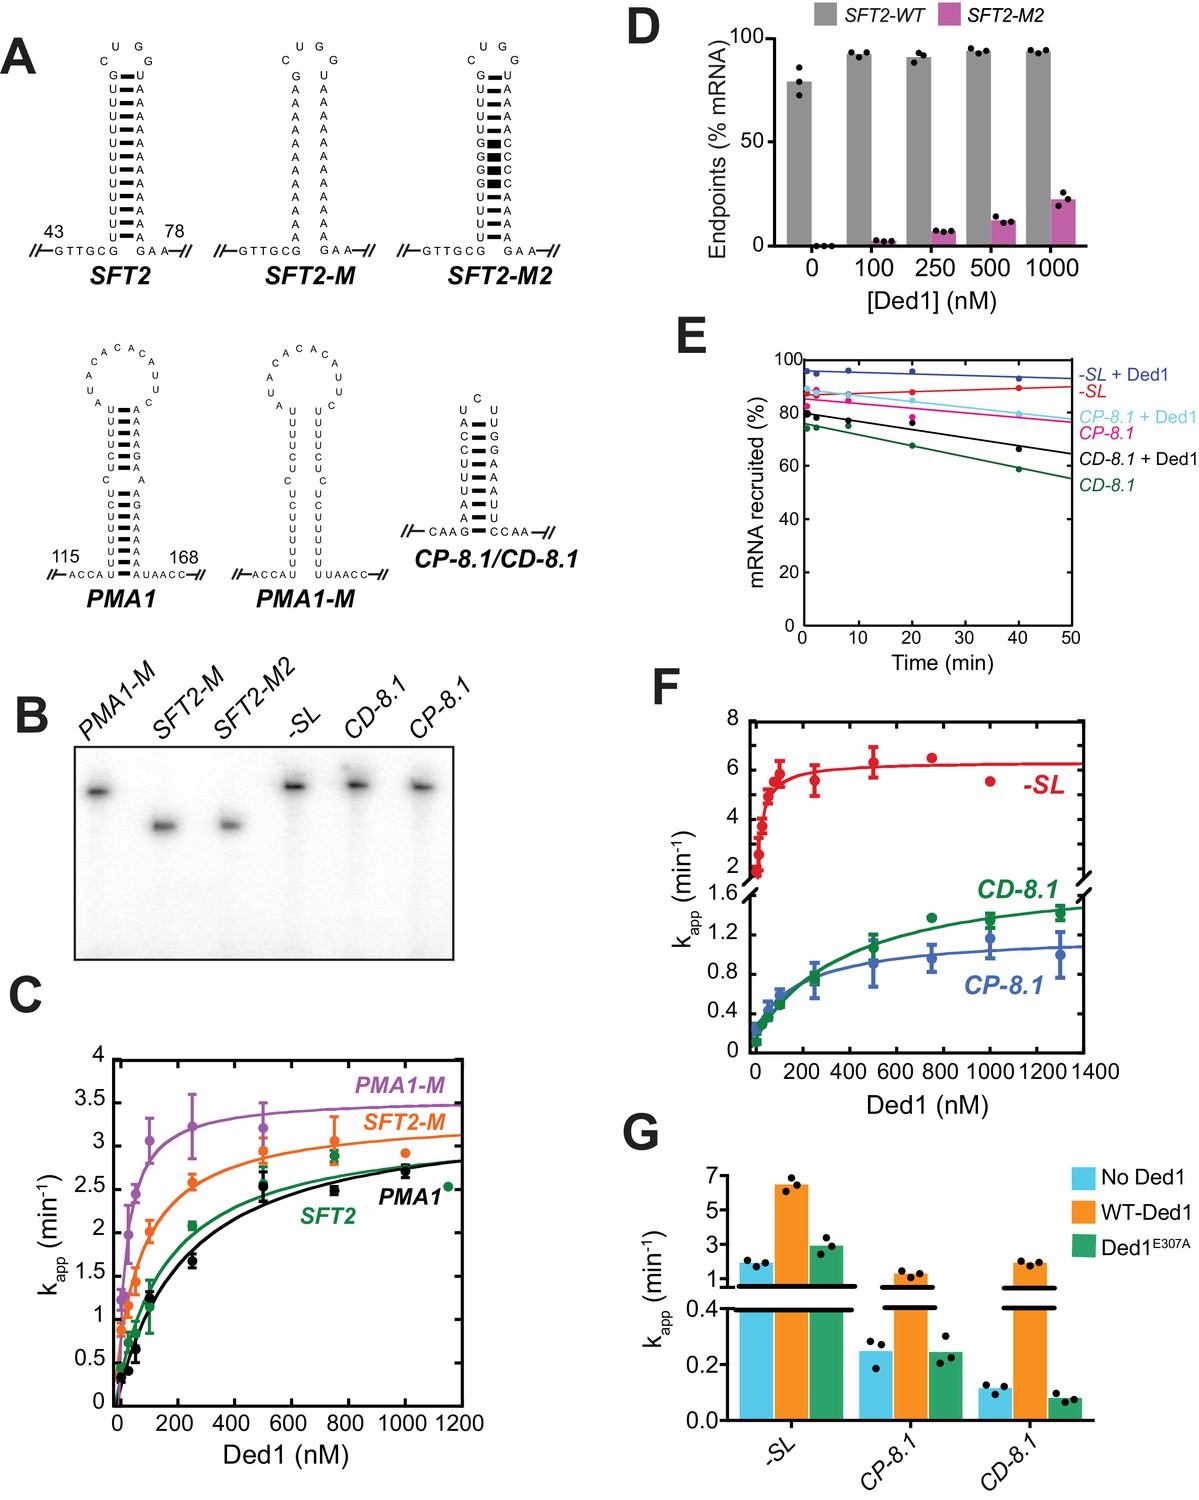
Ded1 enhances the recruitment of mRNAs with SLs in the 5'-UTRs.
(A) Sequence and structures of SLs in the 5'-UTRs of mRNAs examined in this study (Figures 1A and 2A) of predictedGºs: SFT2 = −9.4 kcal/mol, SFT2-M2 = −19.7 kcal/mol, PMA1 = −8.2 kcal/mol, CP-8.1/CD-8.1=−8.1 kcal/mol. The distance from the 5'-end is indicated for SFT2 and PMA1. (B) [α32P]-capped mRNAs used in 48S PIC assembly assays, depicted in Figure 2A, resolved by electrophoresis on a 6% denaturing urea-TBE gel. (C) The kapp for mRNA recruitment measured as a function of Ded1 concentrations for PMA1 (black), PMA1-M (purple), SFT2 (green), and SFT2-M (orange) mRNAs. Data were fitted with a hyperbolic curve with an offset to account for the rate observed with no Ded1, allowing calculation of kmax and values reported in Figure 2C and D, respectively. Plotted points are mean values with error bars indicating 1 SD (n = 3). (D) Endpoints of 48S PIC assembly at different Ded1 concentrations for SFT2 and SFT2-M2 mRNAs. The endpoints for SFT2-M2 represent lower limits because Ded1 concentrations above 1 µM were unattainable. (E) -SL, CP-8.1, and CD-8.1 mRNAs assembled in 48S PICs (+/-Ded1) remain stably bound for 40 min after addition of ~20 fold cold-capped (non-radiolabeled) mRNA to stop the reactions, conducted as described in Figure 1—figure supplement 1B. Modest dissociation was observed for CP-8.1 and CD-8.1 mRNAs; but none for -SL mRNA. (F) The kapp for mRNA recruitment measured as a function of Ded1 concentration for -SL (red), CP-8.1 (blue), and CD-8.1 (green) mRNAs. The data were fitted with a hyperbolic curve with an offset to account for the rate observed with no Ded1, allowing calculation of kmax and values reported in Figure 2C and D, respectively. Plotted points are the mean values with error bars of 1 SD (n = 3). Note the y-axis is discontinuous. (G) Ded1 stimulation of mRNA recruitment is dependent on the ATPase activity of Ded1. Mean observed rates of 48S assembly (n = 3) with no Ded1 (blue bars), saturating Ded1 (orange bars), and ATPase deficient mutant Ded1E307A (green bars). Note the y-axis is discontinuous. See Figure 2—figure supplement 1—source data 1.
-
Figure 2—figure supplement 1—source data 1
(Source data file for Figure 2—figure supplement 1).
- https://doi.org/10.7554/eLife.38892.009
Figure 3 with 1 supplement
Ded1 acceleration of 48S PIC assembly is completely dependent on eIF4E·eIF4G for a subset of mRNAs.
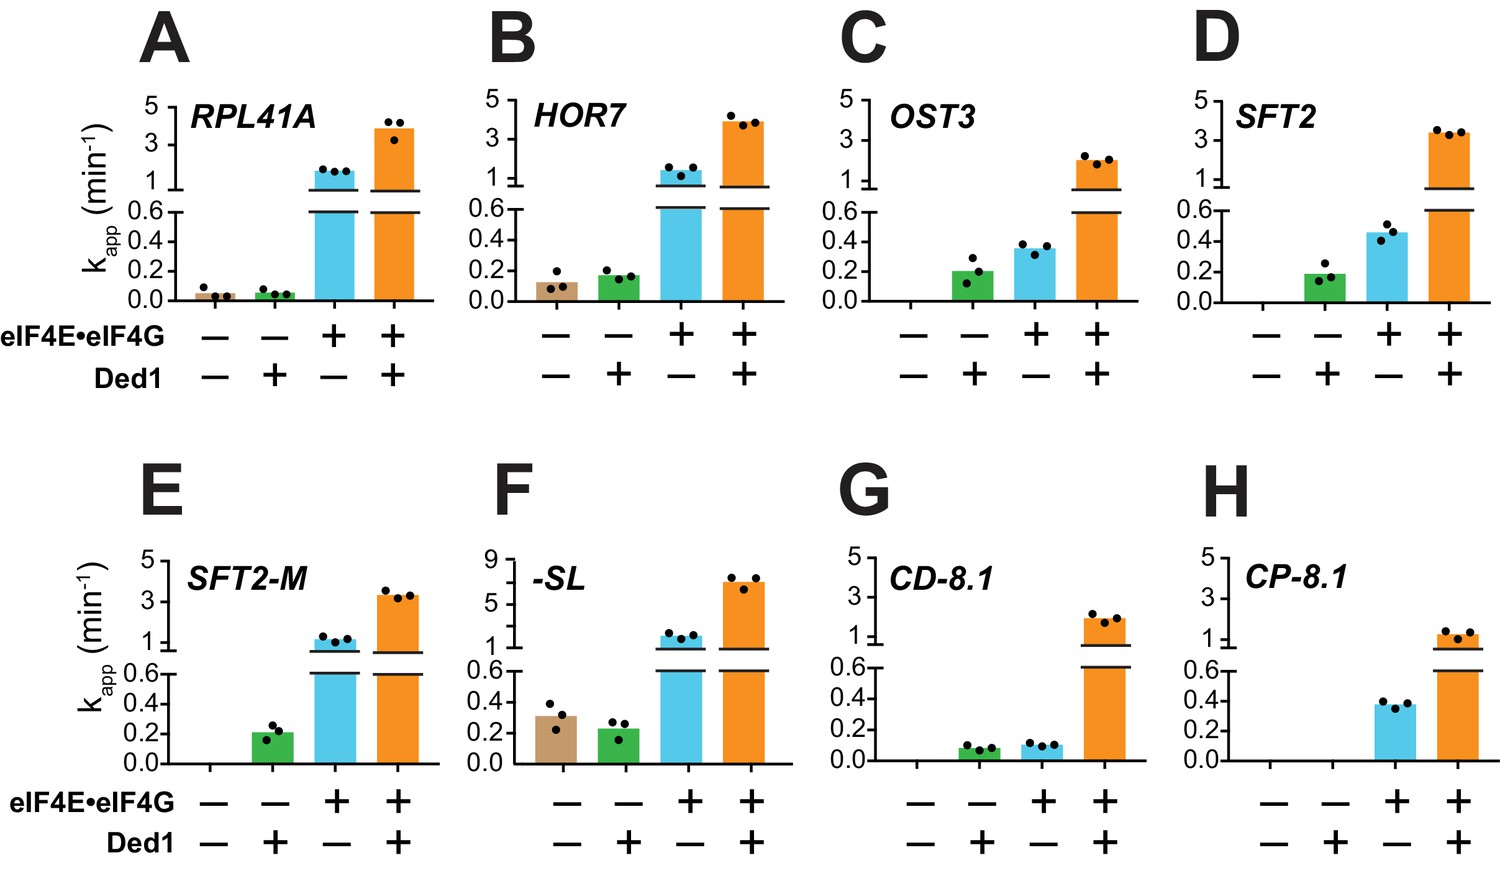
(A–H) Apparent rates (kapp) of 48S PIC assembly for the indicated mRNAs observed without eIF4E·eIF4G and Ded1 (tan bars), with Ded1 but no eIF4E·eIF4G (green bars), with eIF4E·eIF4G but no Ded1 (blue bars), or with both Ded1 and eIF4E·eIF4G (orange bars). Note the different Y-axis scale for -SL (F). See Figure 3—figure supplement 1 and Figure 3—source data 1.
-
Figure 3—source data 1
(Source data file for Figure 3).
- https://doi.org/10.7554/eLife.38892.012
Figure 3—figure supplement 1
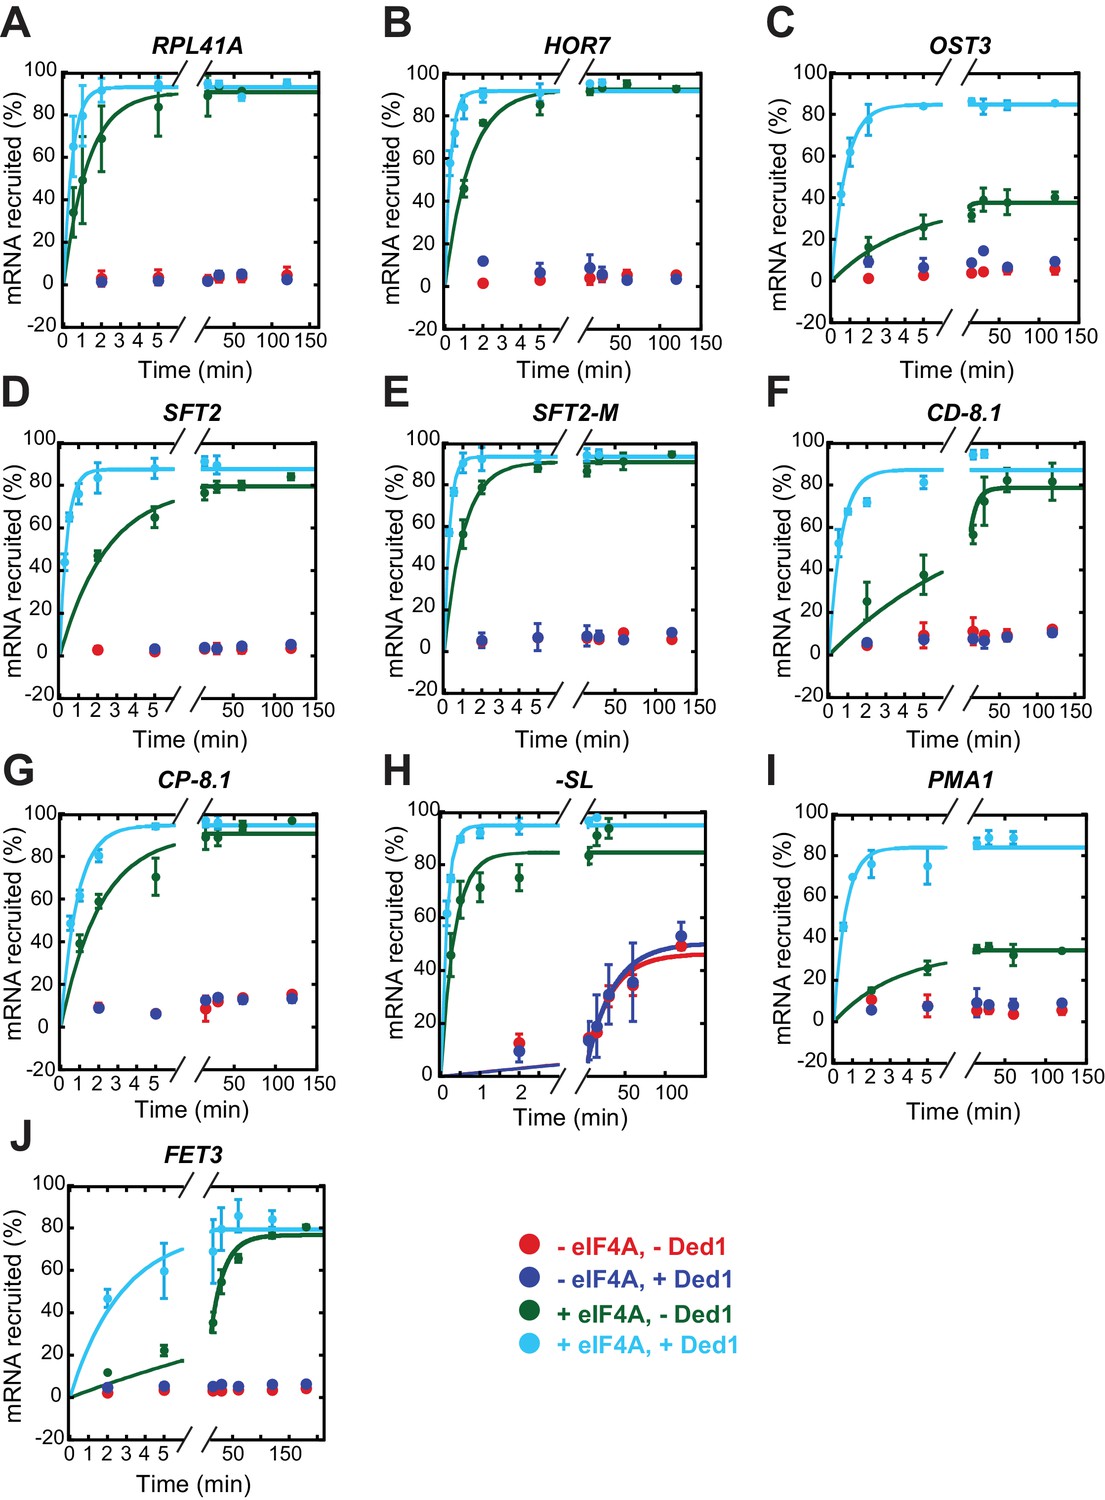
eIF4A is required for appreciable recruitment of all mRNAs tested (except -SL) in the presence or absence of saturating Ded1.
Recruitment of mRNAs without eIF4A in the absence (red) or presence of Ded1 (blue), and with eIF4A in the absence (green) or presence of Ded1 (cyan). The data were fitted with a single exponential equation for the reactions including eIF4A in the absence (green) and presence of Ded1 (cyan); and for all four conditions for -SL mRNA (H). Each point represents the mean value (n ≥ 2) and error bars are 1 SD from the mean. Note the x-axis is discontinuous. See Figure 3—figure supplement 1—source data 1.
-
Figure 3—figure supplement 1—source data 1
(Source data file for Figure 3—figure supplement 1).
- https://doi.org/10.7554/eLife.38892.013
Figure 4 with 2 supplements
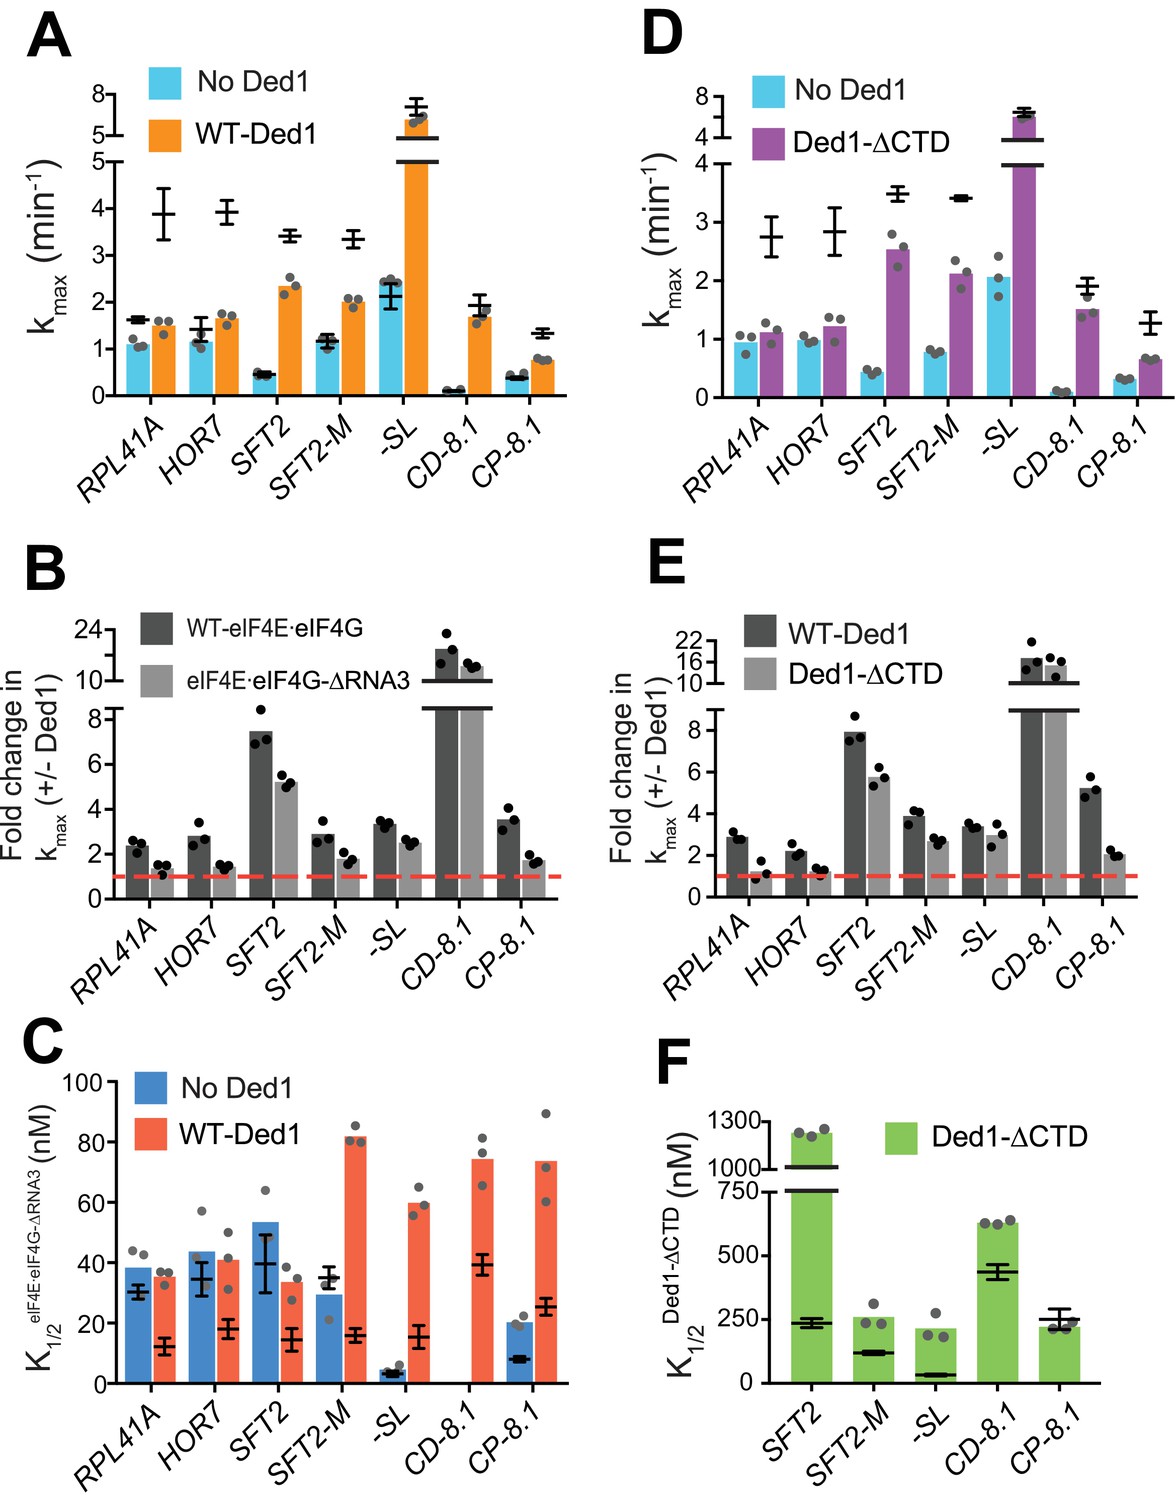
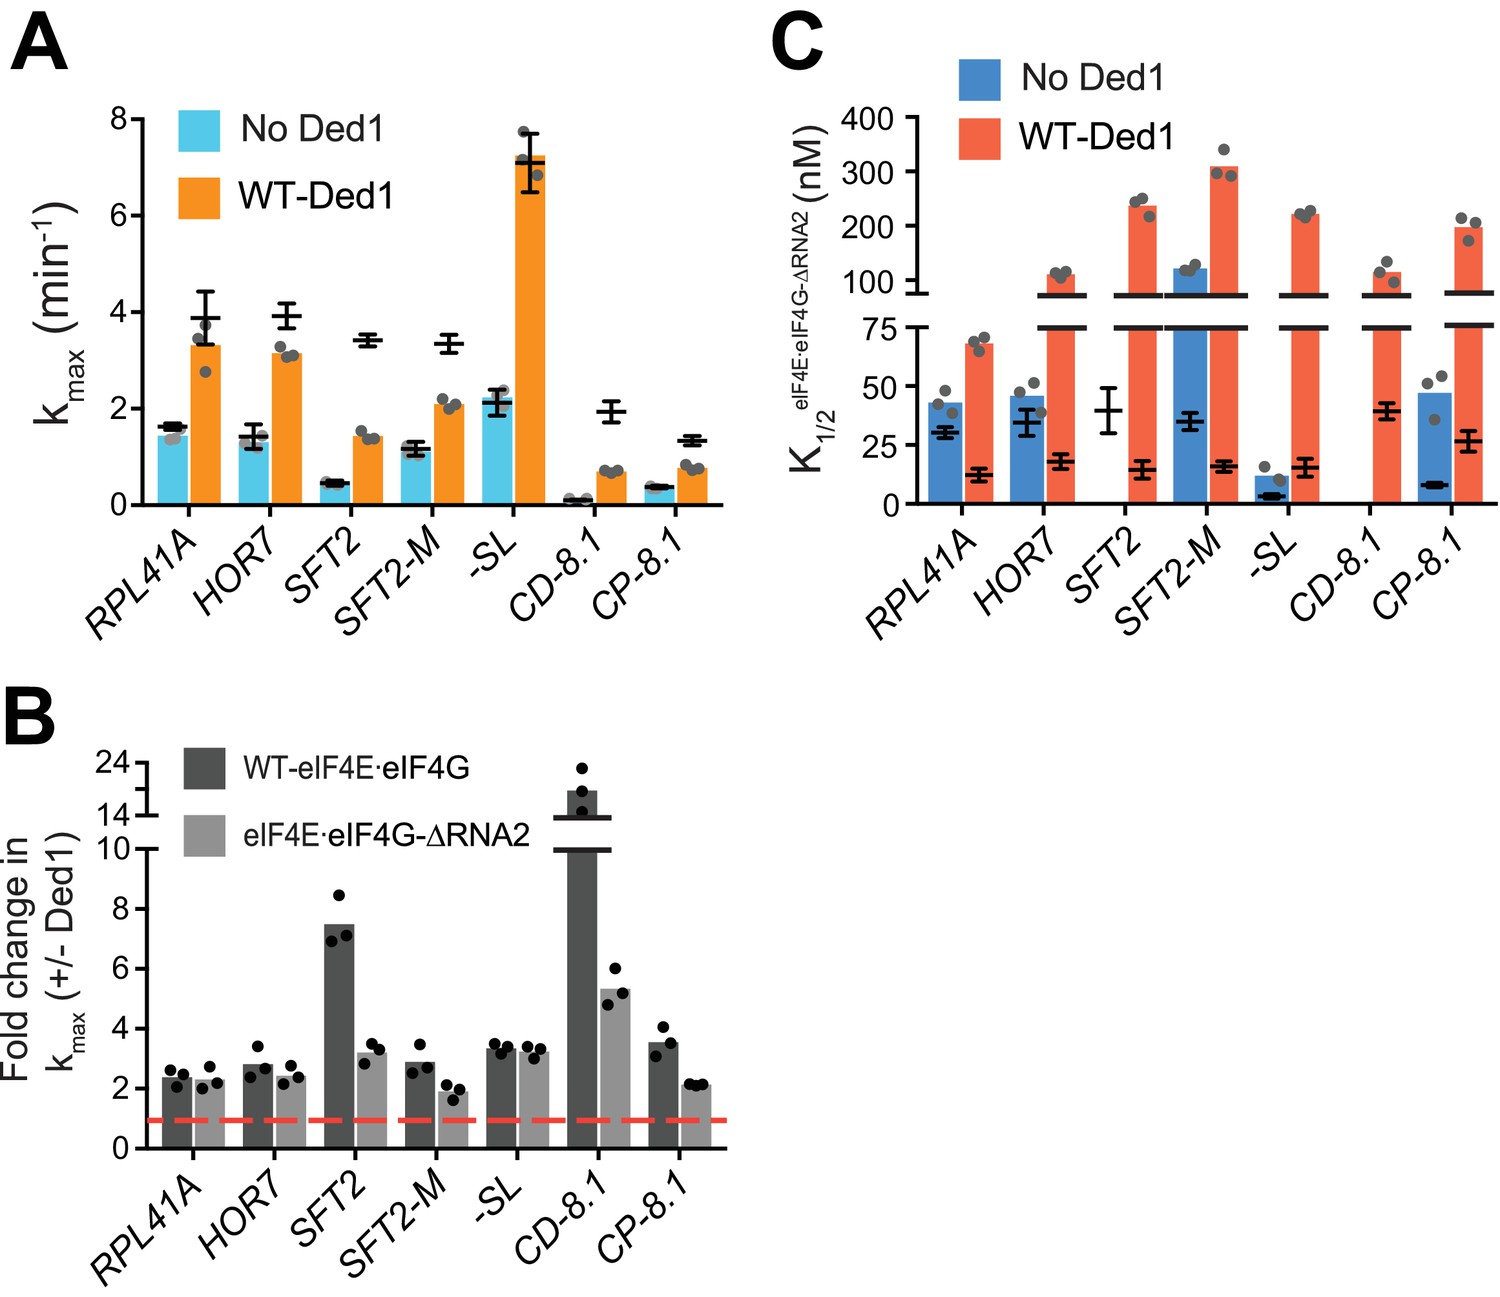
eIF4G-RNA3 and Ded1-CTD enhance kmax for the same subset of mRNAs while reducing K1/2 for nearly all mRNAs.
(A) kmax values in absence (blue) and presence of saturating Ded1 (orange) with eIF4EeIF4G-RNA3. (B) The average fold-change in the kmax observed in the presence and absence of Ded1 with WT eIF4EeIF4G (dark grey) and eIF4EeIF4G-RNA3 (light grey). Red line indicates no change in the rate on Ded1 addition. (C) K1/2 of eIF4EeIF4G-RNA3 in absence of Ded1 (dark blue) and presence of saturating Ded1 (red). (D) kmax observed in absence (blue) and presence of saturating Ded1-CTD (purple). (E) The average fold change in the kmax observed in presence and absence of WT Ded1 (dark grey) and Ded1-CTD (light grey). Red line indicates rates in absence of Ded1. (F) The K1/2 of Ded1-CTD value shown as green bars. (A–F) Bars indicate mean values calculated from the 3 independent experiments represented by the data points. The superimposed horizontal line (black) indicate the mean maximal rates (A, D) or K1/2 (C, F) observed with WT eIF4E·eIF4G (A, C, from Figure 3 and Figure 4—figure supplement 2A) or WT Ded1 (D, F from Figures 1 and 2), and error bars represent 1 SD from the mean (this representation will be referred to as line/whisker plot). See Figure 4—figure supplements 1 and 2 and Figure 4—source data 1.
-
Figure 4—source data 1
(Source data file for Figure 4).
- https://doi.org/10.7554/eLife.38892.017
Figure 4—figure supplement 1
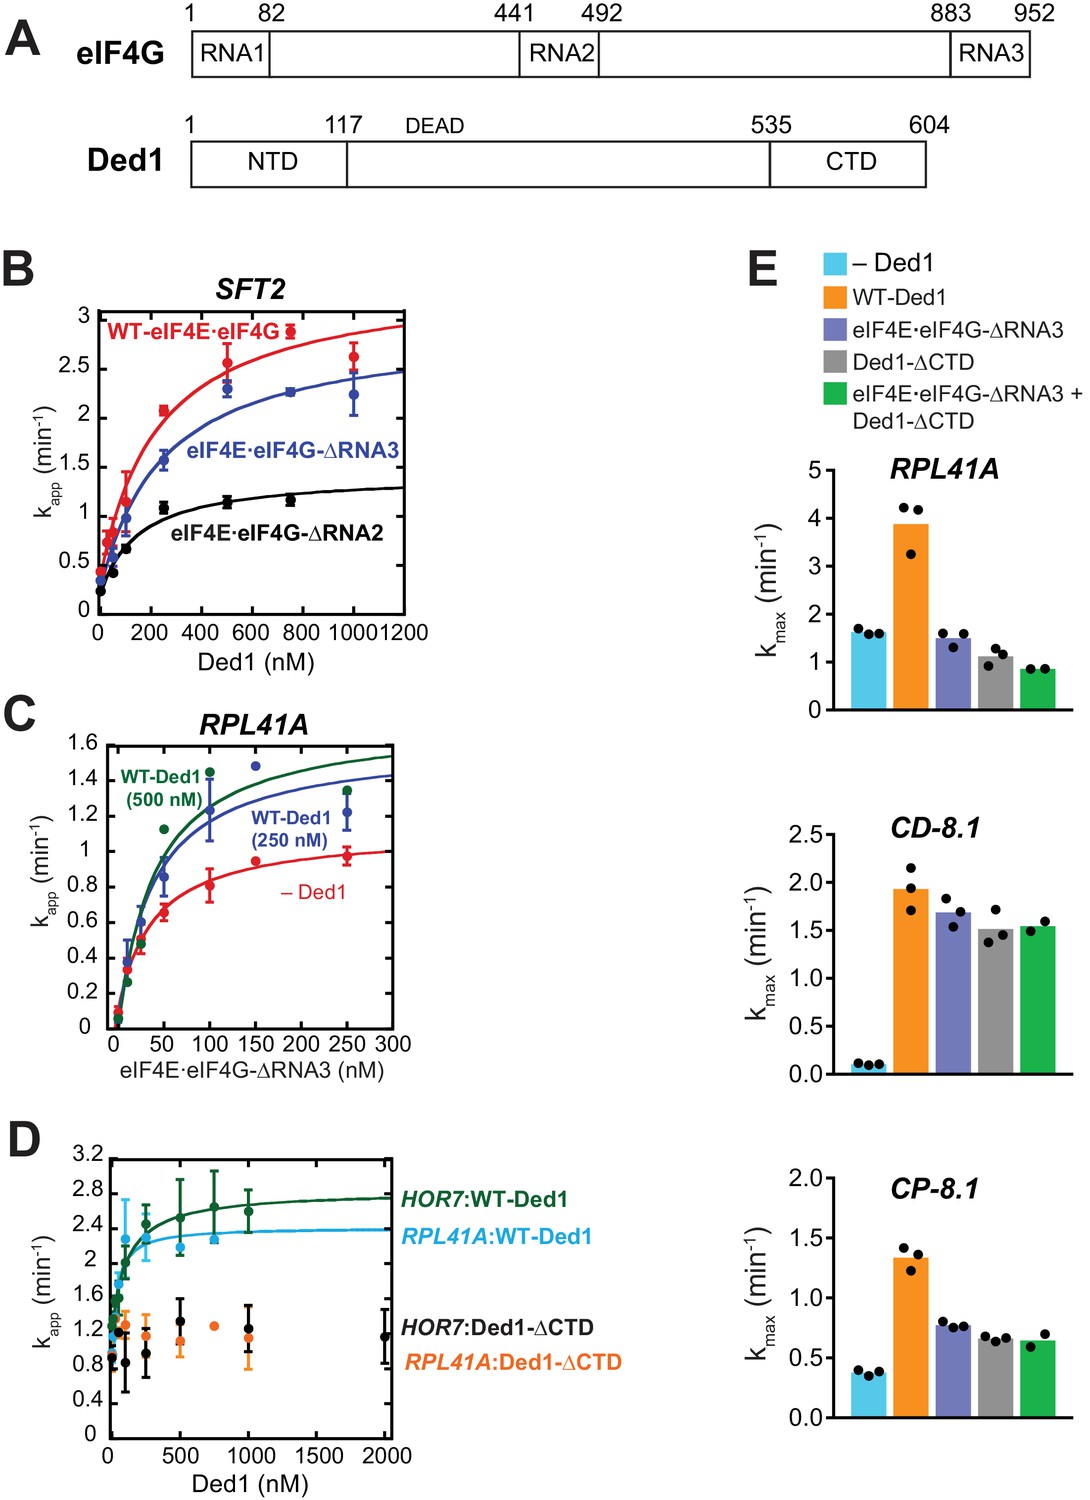
Selected effects of the eIF4G-RNA3 and Ded1-CTD truncations on recruitment of native mRNAs.
(A) Schematics of eIF4G showing RNA binding domains-RNA1, RNA2, and RNA3 and Ded1 showing N-terminal and C-terminal domains, indicating the amino acid coordinates at domain junctions. (B) The apparent rate of SFT2 mRNA recruitment measured as a function of Ded1 concentration with WT eIF4E·eIF4G (75 nM), eIF4E·eIF4G-RNA3 (150 nM) and eIF4E·eIF4G-RNA2 (400 nM). Data fitted with a hyperbolic curve. Plotted points are mean values with error bars of 1 SD (n = 3). The determined values are 236 ± 18 nM, 251 ± 34 nM, 148 ± 17 nM, with WT eIF4E·eIF4G, eIF4E·eIF4G-RNA3, and eIF4E·eIF4G-RNA2, respectively; indicating that the Ded1 concentrations used in Figures 4 and 5 were saturating for SFT2 mRNA. Similar experiments were also conducted for the other mRNAs examined in Figures 4 and 5 using a range of Ded1 concentrations up to 1M, which corresponds to 2X-4X of the obtained with WT eIF4E·eIF4G in Figures 1C and 2D. The results (data not shown) ensured that Ded1 was present at saturating levels in the reactions for these mRNAs containing the two eIF4G mutants. (C) Recruitment of RPL41A as a function of eIF4E·eIF4G-ΔRNA3 concentration with no Ded1 (red), 250 nM Ded1 (blue) and 500 nM Ded1 (green). The results indicate that doubling the Ded1 concentration from that employed in Figure 4C did not increase the rate or change the of 48S PIC assembly. (D) The apparent rates of RPL41A and HOR7 recruitment observed at different concentrations of WT Ded1 and Ded1-CTD. Data obtained with WT Ded1 were fitted with a hyperbolic curve. The results indicate a negligible change in rate using Ded1-CTD. (E) The maximal rates of recruitment of RPL41A, CD-8.1, and CP-8.1 in the presence of both the eIF4E·eIF4G-RNA3 and Ded1-CTD mutants (green bars), WT eIF4E·eIF4G and no Ded1 (blue bars), WT eIF4E·eIF4G and WT Ded1 (orange bars), eIF4E·eIF4G-RNA3 and WT Ded1 (purple bars), and WT eIF4E·eIF4G and Ded1-CTD (gray bars). See Figure 4—figure supplement 1—source data 1.
-
Figure 4—figure supplement 1—source data 1
(Source data file for Figure 4—figure supplement 1).
- https://doi.org/10.7554/eLife.38892.018
Figure 4—figure supplement 2
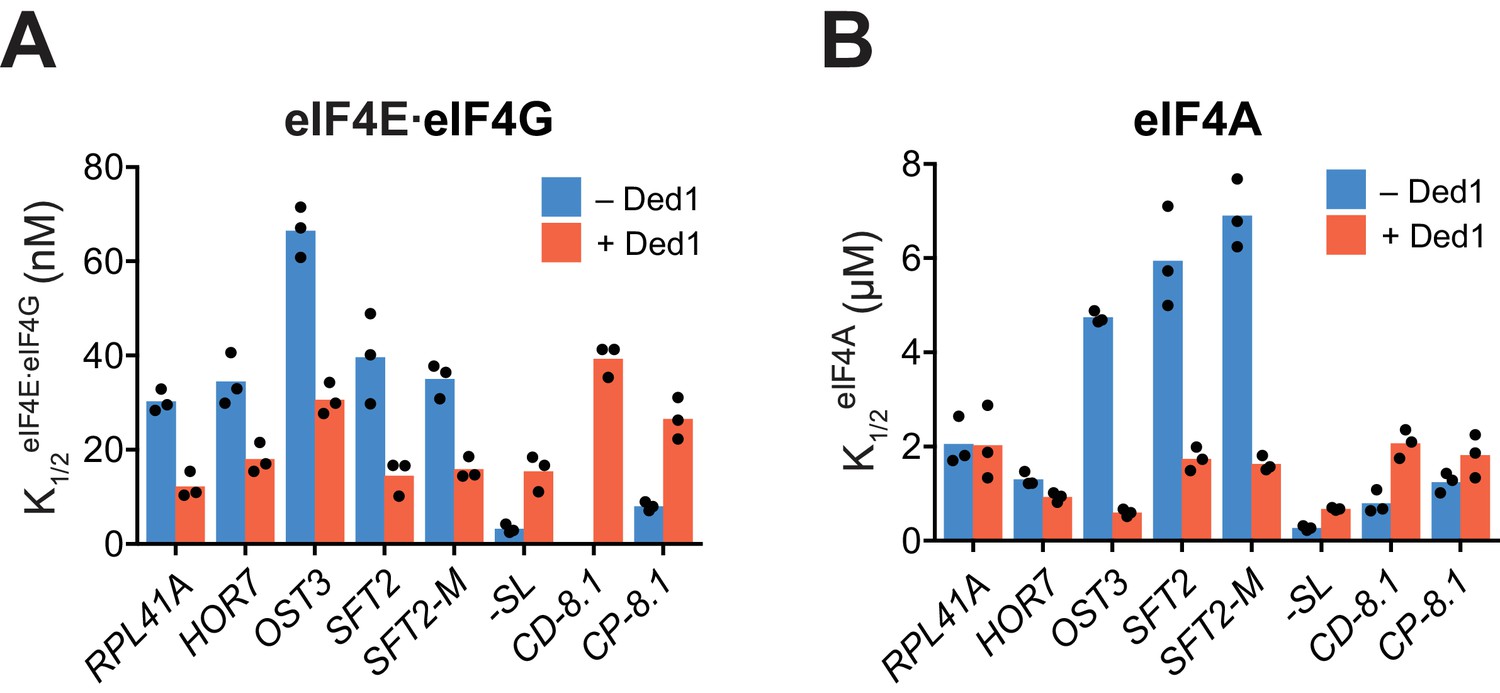
(A, B) K1/2 values of eIF4E·eIF4G (A) and eIF4A (B) in the absence of Ded1 (dark blue) and presence of saturating Ded1 (red).
Bars indicate mean values calculated from 3 independent experiments represented by the data points. We probed functional interactions between Ded1 and eIF4G by measuring the apparent recruitment rates at varying concentrations of eIF4E·eIF4G in the presence and absence of Ded1. In the absence of Ded1, the for mRNAs RPL41A, HOR7, OST3, SFT2, and SFT2-M ranged from 30 to 75 nM (panel A, cols. 1 – 5, blue); whereas the presence of saturating Ded1 decreased the by factors of ~2 to 2.5 for each of these five mRNAs (red vs. blue). The reductions in conferred by Ded1 are consistent with the idea that Ded1 interacts productively with eIF4G for all five of these mRNAs. Similarly, the presence of saturating Ded1 lowered the concentration of eIF4A required to achieve the half-maximal rate of recruitment by 3–7-fold for OST3, SFT2, and SFT2-M (panel B, cols. 3 – 5, red vs. blue), consistent with a productive interaction between Ded1 and eIF4A during 48S formation on these mRNAs. This interaction could be direct, through eIF4G, or due to Ded1 altering the conformation of the mRNA or another component of the system, making it easier for eIF4A to bind or act on it. The native mRNAs RPL41A and HOR7, has the same with and without Ded1 (panel B, cols. 1 – 2, red vs. blue). As the for RPL41A and HOR7 in the absence of Ded1 were lower than those for OST3, SFT2, and SFT2-M (panel B, blue), and were actually at the level reached for SFT2 and SFT2-M in the presence of Ded1 (panel B, red), perhaps RPL41A and HOR7 are naturally more receptive to the effects of eIF4A without assistance from Ded1, possibly because of their short 5'-UTR. The synthetic mRNAs produced distinctly different functional interactions between Ded1 and eIF4E·eIF4G or eIF4A. In the absence of Ded1, -SL and CP-8.1 had lower values of 3 to 8 nM compared to 30 – 75 nM for the five natural mRNAs (panel A, blue bars). (The for CD-8.1 without Ded1 could not be determined accurately because of its endpoint defects at lower eIF4G concentrations.) Contrary to the natural mRNAs, addition of Ded1 increased the of -SL and CP-8.1 mRNAs by 3 – 5-fold, reaching values similar to those observed for the natural mRNAs in the presence of Ded1 (panel A, red bars). The synthetic mRNAs also exhibited values in the absence of Ded1 that were generally lower than the corresponding values for the native mRNAs (panel B, blue bars). Moreover, addition of Ded1 increased the values of the two synthetic mRNAs, in contrast to the decreased values evoked by Ded1 for three of the five native mRNAs (panel A, red). These results indicate that the maximum stimulation of recruitment of the synthetic mRNAs by eIF4E·eIF4G and eIF4A in the absence of Ded1 can be achieved at relatively low concentrations of both factors, but that higher concentrations of eIF4E·eIF4G and eIF4A are required to support the additional stimulation of recruitment conferred by Ded1, which are comparable in magnitude to the concentrations of eIF4E·eIF4G and eIF4A required for maximal Ded1-stimulation of the native mRNAs. In summary, the requirements for eIF4E·eIF4G and eIF4A, as well as the effect of Ded1 on these requirements, differ among different native mRNAs and vary dramatically between native and synthetic mRNAs. These results suggest the existence of different functional modalities of the eIF4F complex (in the absence of Ded1) and of the eIF4E·eIF4G·eIF4A·Ded1 complex (with Ded1) that may be required to overcome the range of RNA structures in different mRNAs that vary in stability, distance from the 5'-cap, or orientation in three-dimensional space to accelerate mRNA attachment and subsequent scanning to the AUG codon. (See Discussion for additional comments.). See Figure 4—figure supplement 2—source data 1.
-
Figure 4—figure supplement 2—source data 1
(Source data file for Figure 4—figure supplement 2).
- https://doi.org/10.7554/eLife.38892.019
Figure 5
RNA2 domain of eIF4G is crucial for Ded1-dependent stimulation of mRNA recruitment.
(A) kmax in the absence (blue) and presence of saturating Ded1 (orange) with eIF4E·eIF4G-RNA2. (B) The average fold-change in the maximal rate observed in the presence and absence of Ded1 with WT eIF4E·eIF4G (dark grey) and eIF4E·eIF4G-RNA2 (light grey). Red line indicates no change in the rate on Ded1 addition. (C) The K1/2 of eIF4E·eIF4G-RNA2 in the absence of Ded1 (dark blue) and presence of saturating Ded1 (red). (A–C) Bars represent mean values (n = 3) and points on each bar show the individual experimental values. The line and whisker plot indicate the mean maximal rates (A) or K1/2 (C) observed with WT eIF4E·eIF4G, and error bars represent 1 SD, as depicted in Figure 4. See Figure 4—figure supplements 1 and 2 and Figure 5—source data 1.
-
Figure 5—source data 1
(Source data file for Figure 5).
- https://doi.org/10.7554/eLife.38892.021
Figure 6

Ded1-NTD enhances mRNA recruitment.
(A) kmax values observed in the absence (blue) and presence of saturating Ded1-NTD (purple). (B) The average fold change in the maximal rate observed in the presence and absence of WT Ded1 (dark grey) and Ded1- NTD (light grey). Red line indicates no change in the rate with Ded1. (C) K1/2 of Ded1-NTD value shown as green bars. (A–C) Bars represent the mean values (n = 3) and points on each bar show the individual experimental values. The line and whisker plot indicate the mean maximal rates (A) or K1/2 (C) observed with WT Ded1, and error bars represent 1 SD. See Figure 4—figure supplements 1 and 2 and Figure 6—source data 1.
-
Figure 6—source data 1
(Source data file for Figure 6).
- https://doi.org/10.7554/eLife.38892.023
Figure 7
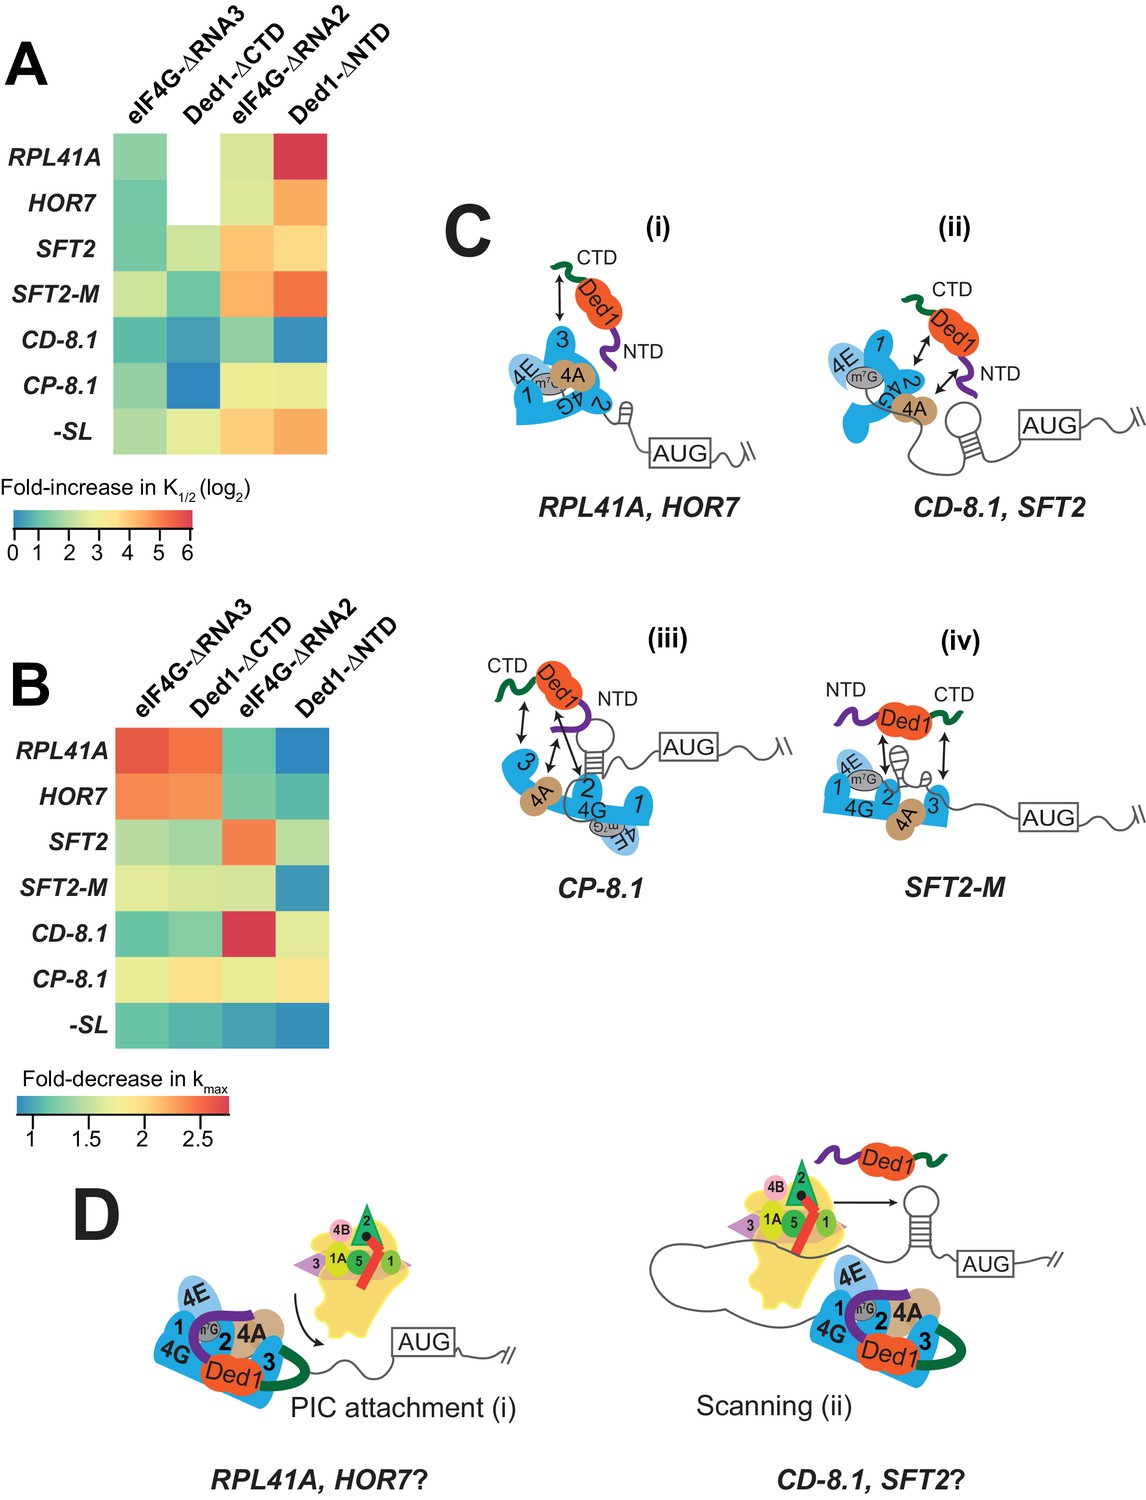
Models for mRNA-specific eIF4F-Ded1 interactions.
(A) Heatmap representation of log2 fold-increases in K1/2 values of eIF4E·eIF4G-RNA3 or eIF4E·eIF4G-RNA2 versus WT eIF4E·eIF4G; and of Ded1-CTD or Ded1-NTD versus WT Ded1, calculated from data in Figure 4C and 5C (red bars vs. line/whiskers) or Figure 4F and 6C (green bars vs. line/whiskers). (B) Heatmap depicting the fold-changes in kmax values of the indicated eIF4E·eIF4G or Ded1 truncations calculated from Figures 4A, D, 5A and 6A (orange or purple bars vs line/whiskers). (C) 'mRNA geometry’ model depicting how different mRNAs exhibiting distinct configurations of the occurrence and location of RNA structures (shown as hairpins or stem-loops) could influence the relative importance of different domain interactions linking Ded1 to eIF4G or eIF4A within the eIF4G·eIF4E·eIF4A·Ded1 tetrameric complex. (D) ‘Kinetic’ model depicting how different mRNAs might differ in the extent to which PIC attachment or scanning are the rate-limiting steps in 48S PIC assembly. Depending on which step is rate-limiting, the requirements for Ded1, either acting alone or within the eIF4G·eIF4E·eIF4A·Ded1 complex, could be different on different mRNAs.
Additional files
-
Transparent reporting form
- https://doi.org/10.7554/eLife.38892.025
Download links
A two-part list of links to download the article, or parts of the article, in various formats.
Downloads (link to download the article as PDF)
Open citations (links to open the citations from this article in various online reference manager services)
Cite this article (links to download the citations from this article in formats compatible with various reference manager tools)
Yeast Ded1 promotes 48S translation pre-initiation complex assembly in an mRNA-specific and eIF4F-dependent manner
eLife 7:e38892.
https://doi.org/10.7554/eLife.38892


