New insights into the cellular temporal response to proteostatic stress
- New York University, United States
- Max Delbrück Center for Molecular Medicine, Germany
- Institute of Biology, Humboldt University, Germany
- Illumina Inc, United States
- National University of Singapore, Singapore
- Agency for Science, Technology and Research, Singapore
Figures
Figure 1 with 1 supplement
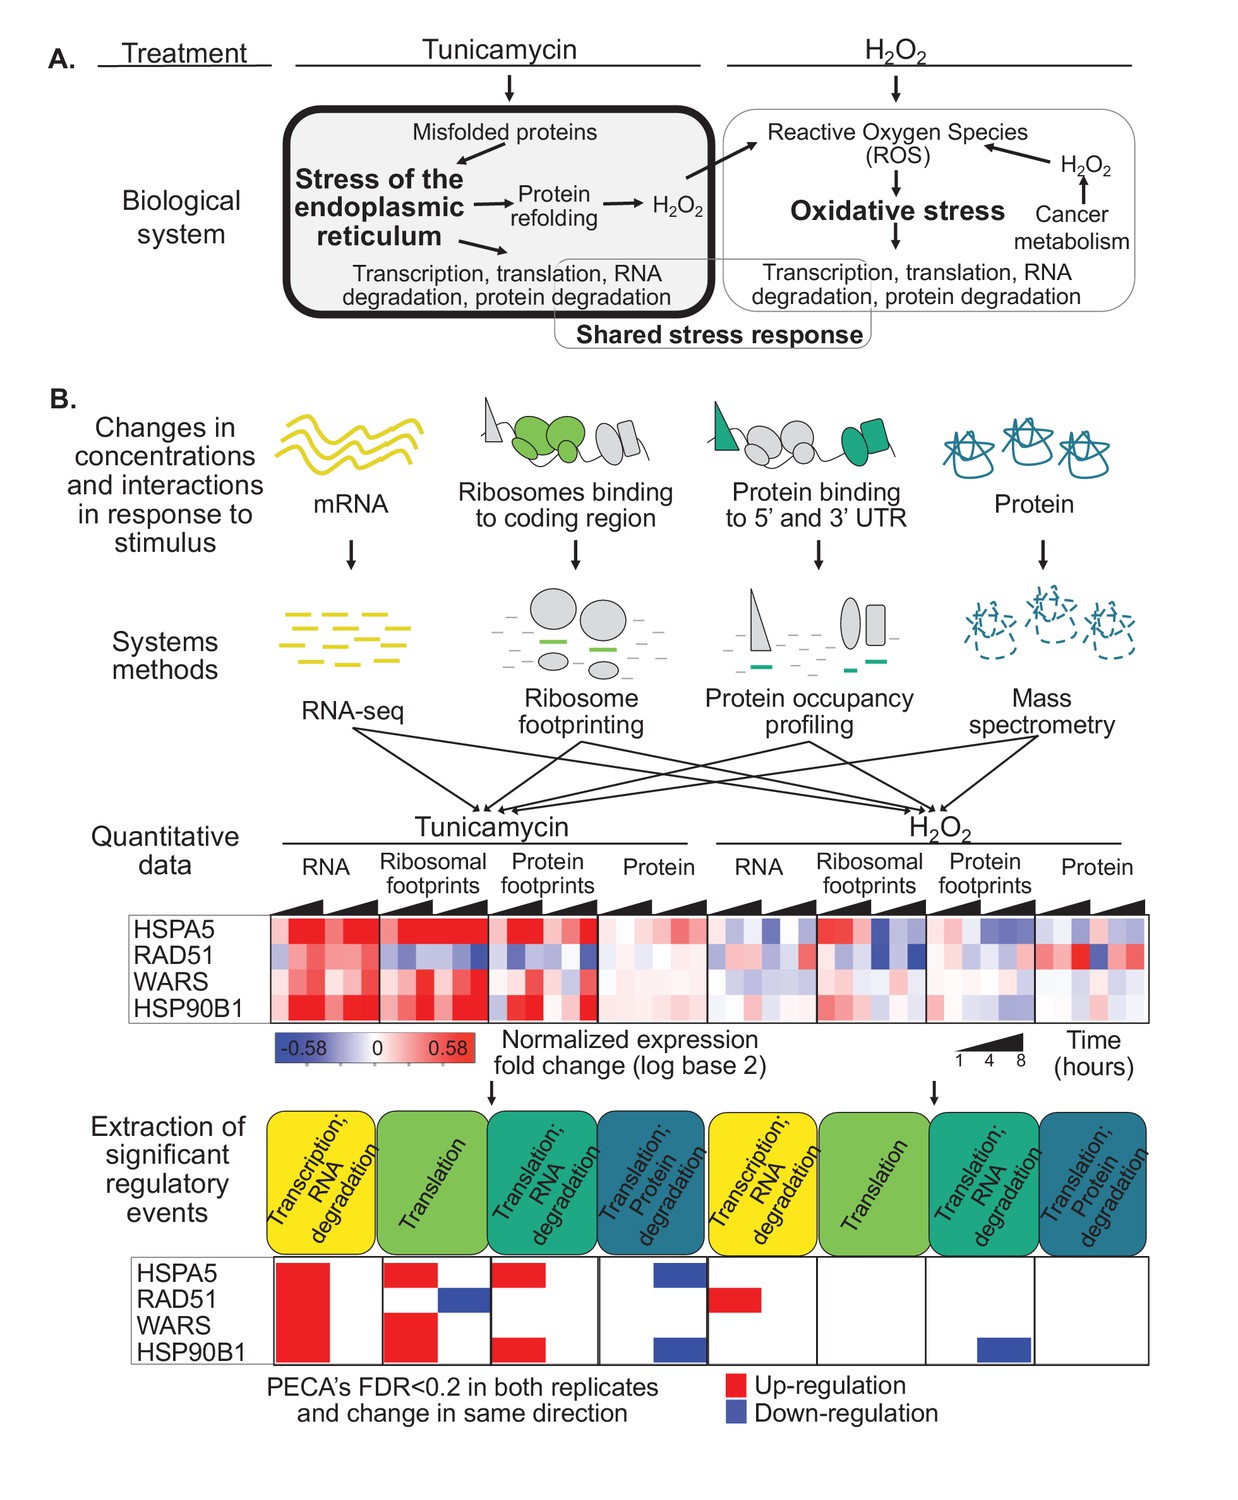
Protein misfolding stress involves multiple processes.
(A) We investigate the multi-layered regulation during the response to protein misfolding stress. The schematic illustrates the simplified relationship between protein misfolding, stress of the endoplasmic reticulum (ER), and oxidative stress. Tunicamycin elicits ER stress, which triggers various downstream effects including transcription, translation, and RNA and protein degradation. Attempts to refold proteins increases production of hydrogen peroxide in the cell. Hydrogen peroxide, in turn, elicits oxidative stress through an imbalance of reactive oxygen species (ROS). In cancer cells, basal ROS levels can be heightened due to altered metabolism. (B) Our experiment extracts significant regulatory events for >7,000 genes in response to either tunicamycin or hydrogen peroxide treatment. The experimental design maps multiple layers of regulation in response to stress, with an emphasis on post-transcriptional regulation. RNA and protein abundances were measured using RNA-seq and mass spectrometry, respectively. Ribosome footprinting and protein occupancy profiling were used to map the binding of ribosomes and non-ribosomal proteins along mRNAs, respectively. Time points and genes with significant regulation were extracted from each data type with the PECA tool (Teo et al., 2018; Teo et al., 2014). The heatmap and PECA results show example genes: the stress response genes HSPA5 (GRP78, BiP) and HSP90B1, the DNA repair gene RAD51, and the aminoacyl-tRNA synthetase WARS. FDR - false discovery rate.
Figure 1—figure supplement 1
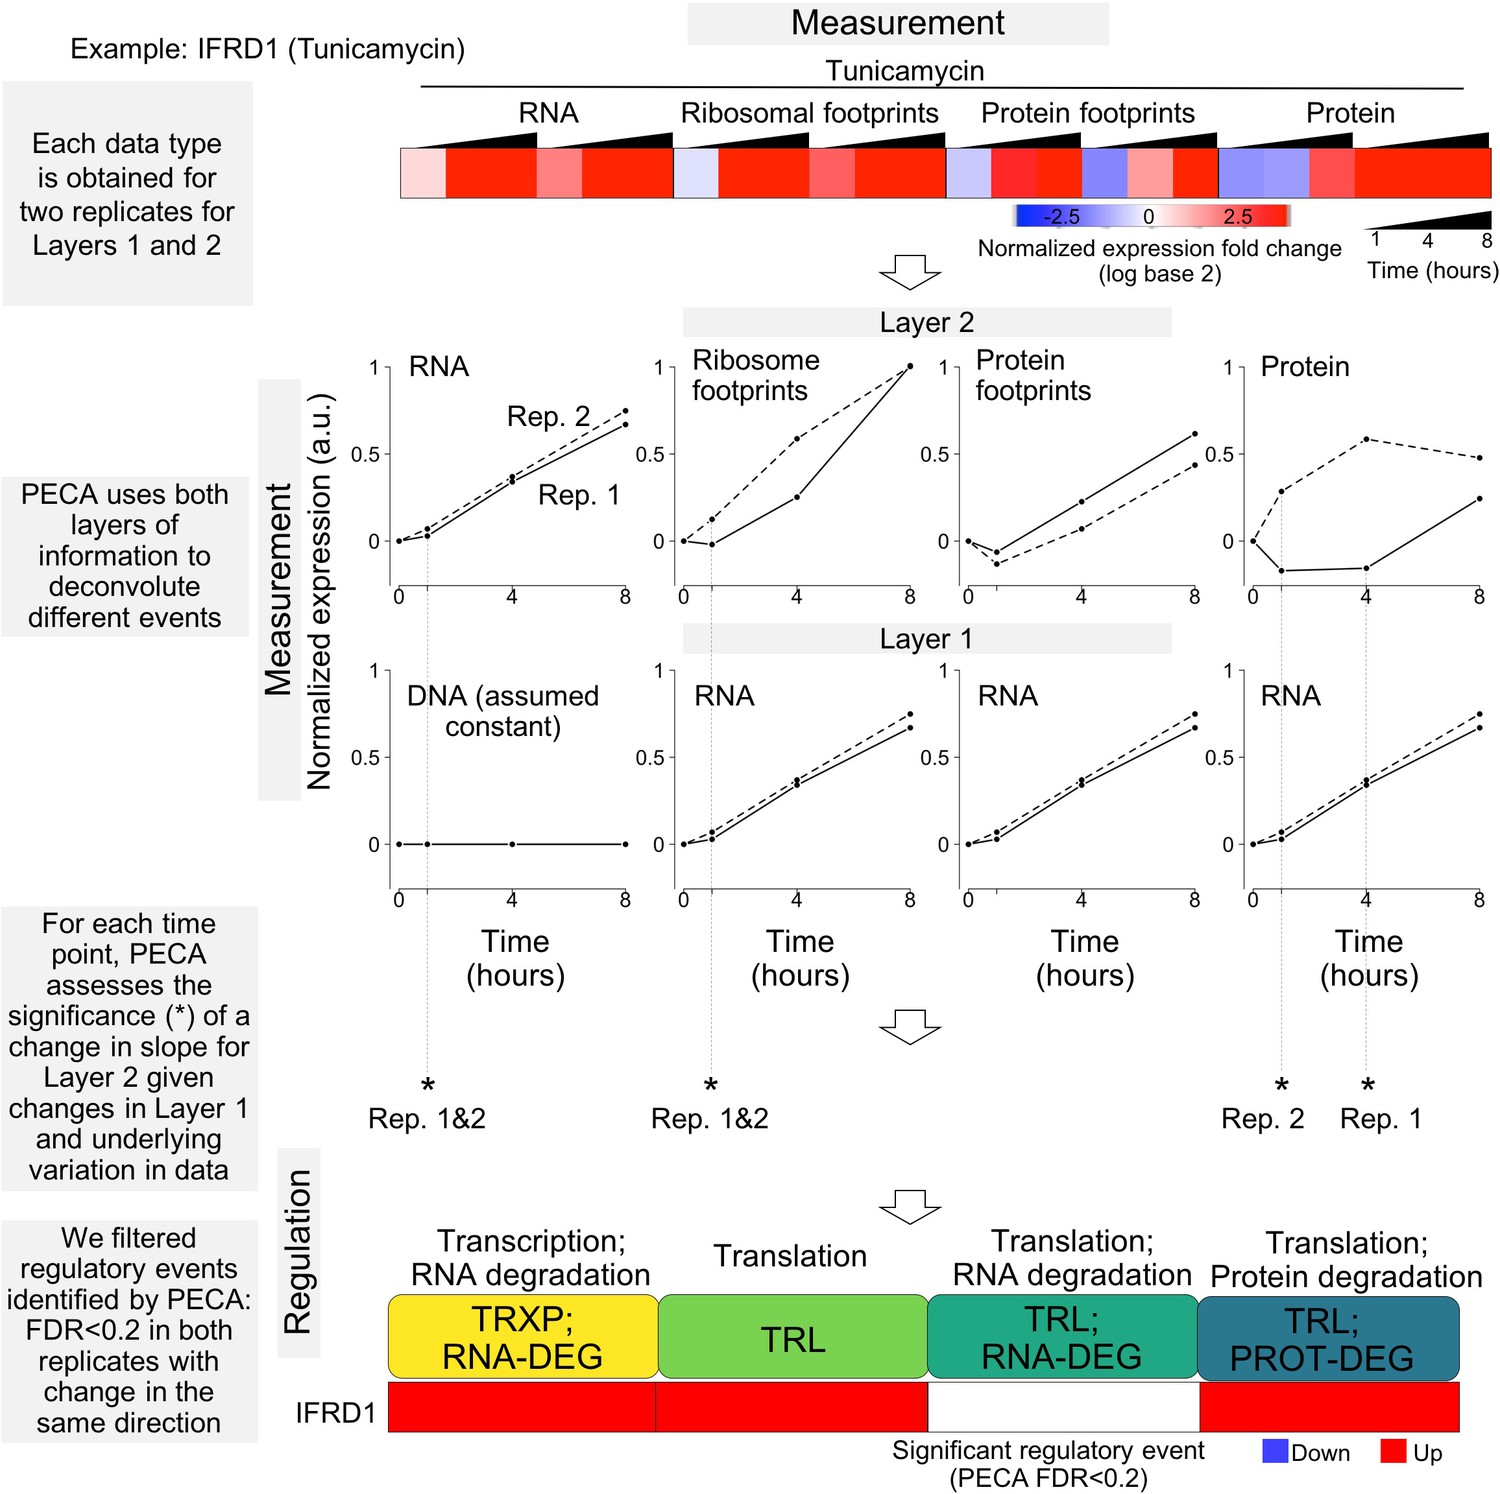
Overview of the statistical workflow for data analysis (PECA).
The schematic illustrates the experimental design that maps multiple layers of regulation in response to stress. RNA and protein abundances were measured using RNA-seq and mass spectrometry, respectively. Ribosome footprinting and protein occupancy profiling were used to map the binding of ribosomes and non-ribosomal proteins along mRNAs, respectively. Time points and genes with significant regulation were extracted from each data type with Protein Expression Control Analysis (PECA)(Teo et al., 2018; Teo et al., 2014). For changes in RNA concentration, assuming DNA concentration remains constant, PECA reports on transcription and RNA degradation regulation. After factoring out changes that occur in RNA concentrations, the ribosome footprinting, protein occupancy profiling, and mass spectrometry datasets inform on translation, binding of post-transcriptional regulators, and translation/protein degradation changes, respectively. The figure shows the expression patterns for the ER stress response gene IFRD1 as an example of significant regulatory events identified by PECA; layer one represents the changes in molecular abundance on which layer two levels partially depend (false discovery rate <0.2 in both biological replicates). Solid lines - replicate 1, dashed lines replicate 2. TRXP - transcription; TRL - translation; RNA-DEG - RNA degradation; PROT-DEG - protein degradation.
Figure 2 with 5 supplements
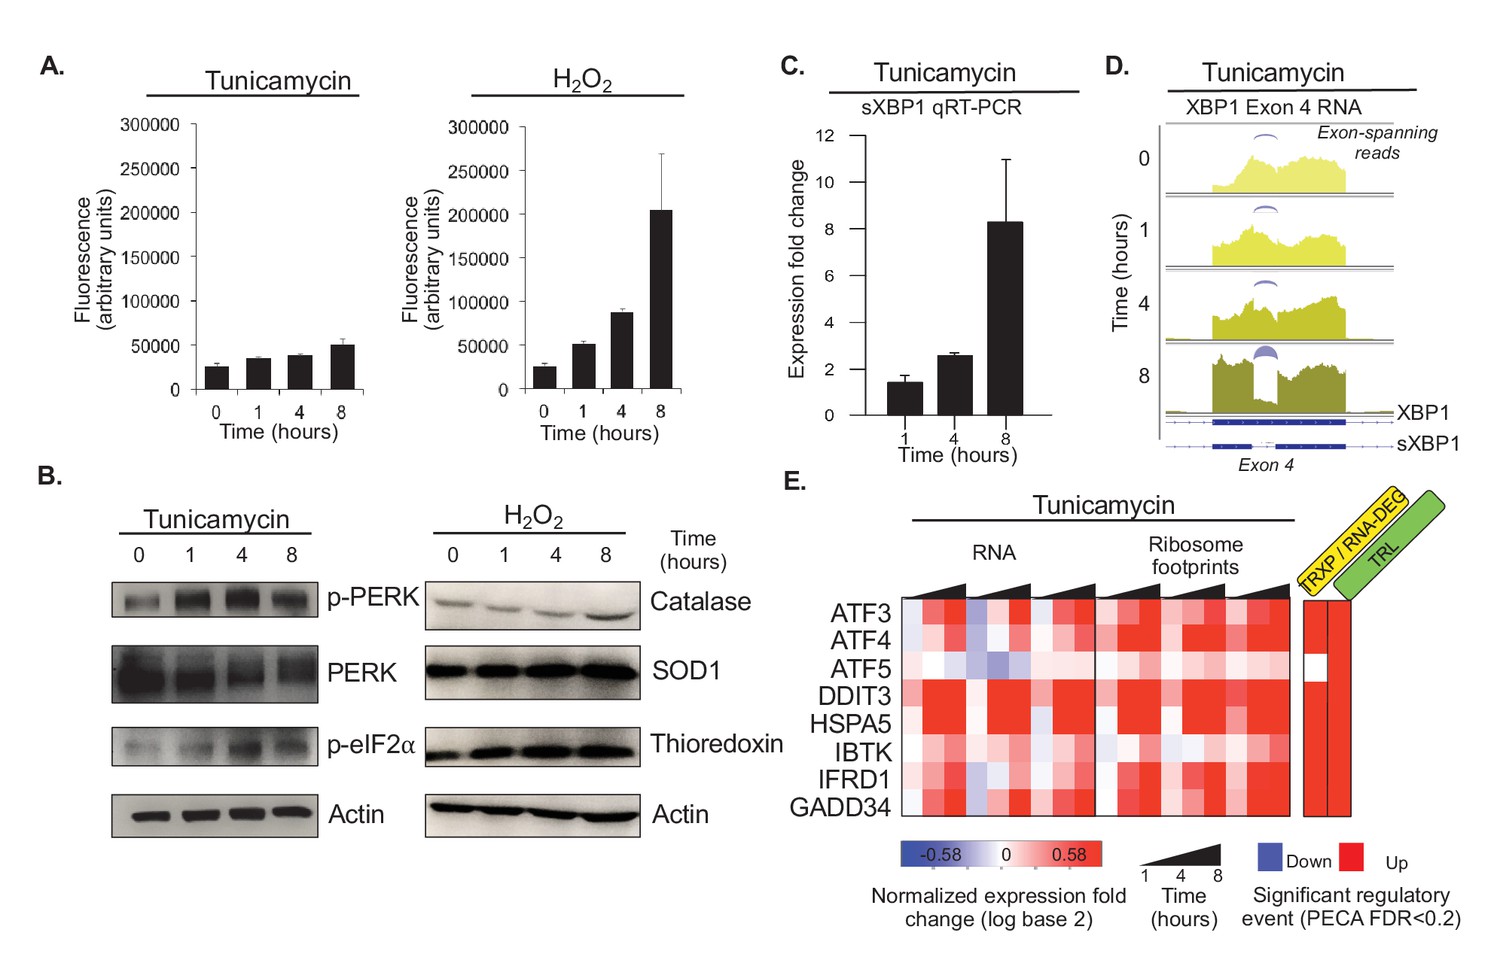
Tunicamycin elicits stress of the endoplasmic reticulum.
(A) Reactive oxygen species (ROS) change in HeLa cells after tunicamycin and hydrogen peroxide (left and right, respectively) treatment, as measured for indicated time points. The cells show basal levels of ROS with minimal increase upon tunicamycin treatment, and substantial increase when treated with hydrogen peroxide, consistent with the relationships shown in Figure 1A. (B) The panels show phosphorylation levels of ER stress markers PERK and eIF2α increase after treatment with tunicamycin (left). Protein abundance increases for common markers of oxidative stress in hydrogen peroxide treated cells (right). (C) Splicing of XBP1 (sXBP1) in tunicamycin treated cells increases, represented as mean fold change and standard error of the mean compared to the 0 hr time point. (D) Reads mapping to exon 4 of XBP1 in the RNA-seq data indicate an increase in the spliced isoform in response to tunicamycin. Spliced reads spanning the 26 nucleotide intron and corresponding to sXBP1 are designated at each time point. Darker colors indicate later time points. (E) The heatmap shows normalized fold changes for all three replicates for RNA and ribosome footprints measurements of eight ER stress response genes regulated via upstream open reading frames. As the significance analysis indicates, the genes are indeed translationally upregulated. FDR - false discovery rate; p-PERK - phosphorylated PERK; p-eIF2α - phosphorylated eIF2α; TRXP - transcription; TRL - translation; RNA-DEG - RNA degradation; PROT-DEG - protein degradation.
Figure 2—figure supplement 1
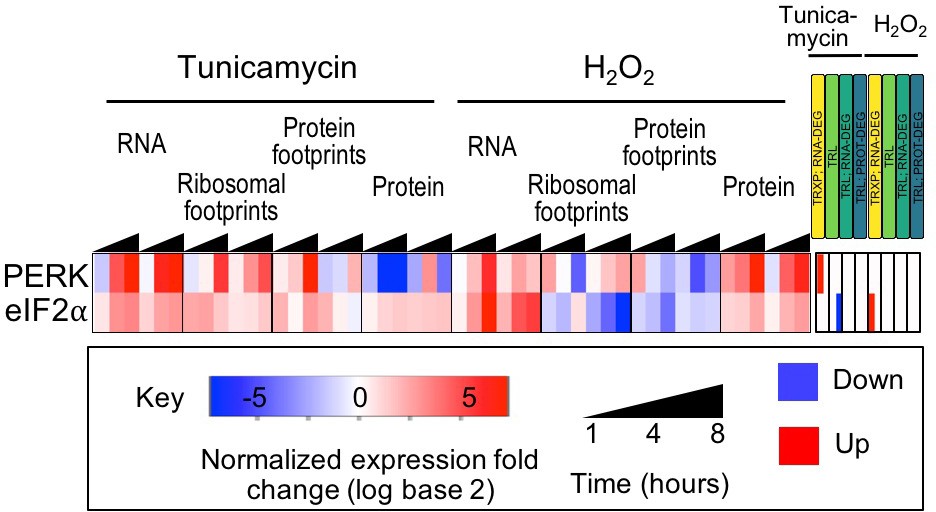
Expression of PERK and eIF2α are largely unchanged.
As expected, expression of these stress markers changes very little, while their phosphorylation increases, as discussed in the main text (Figure 2B).
Figure 2—figure supplement 2
UPR genes are upregulated during ER stress.
We compiled a list of 143 genes known to be regulated by the Unfolded Protein Response (UPR). The large majority of these genes are induced in either transcription or translation or both during tunicamycin stress.
Figure 2—figure supplement 3
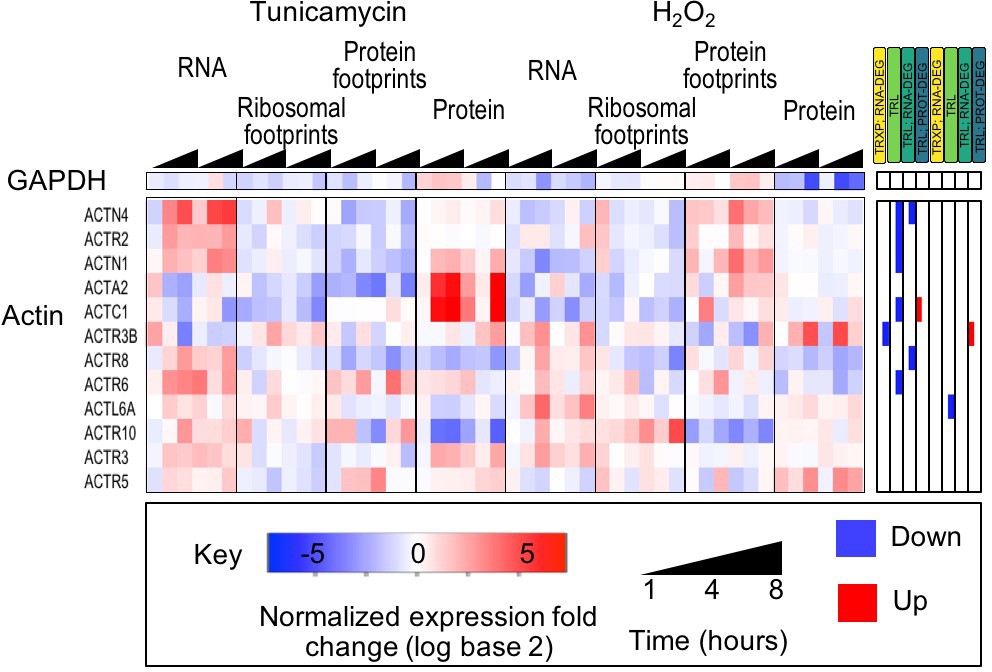
Housekeeping genes are largely unchanged.
The heatmap shows the expression data for GAPDH and actin genes. With few exceptions, gene expression is largely unchanged indicating that despite the stress response cells were viable and not undergoing apoptosis.
Figure 2—figure supplement 4
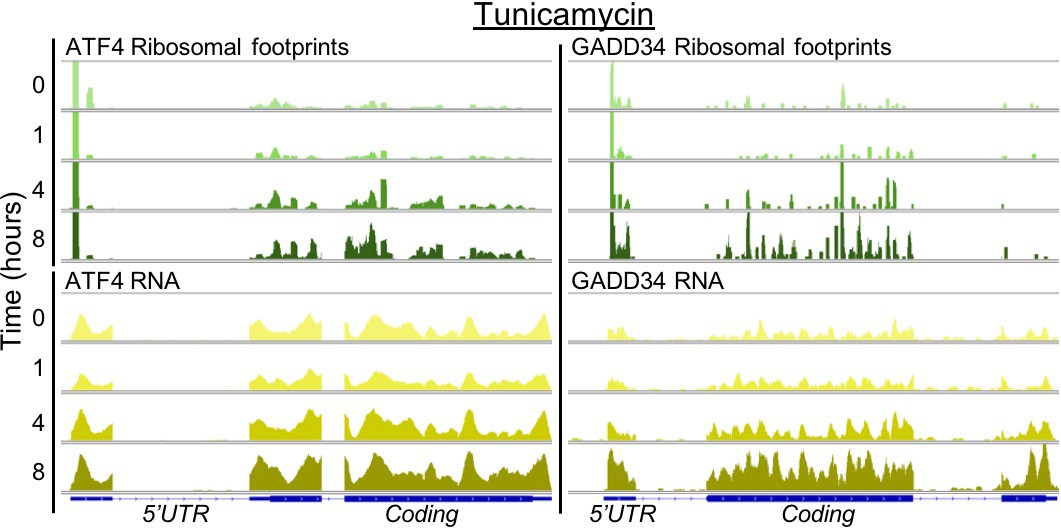
Stress response genes are upregulated in transcription and translation.
The profiles show ribosome footprints (top) and RNA coverage (bottom) for two ER stress response genes, ATF4 and GADD34, that are induced in their translation. The panels show data for one replicate after 0, 1, 4, or 8 hr of tunicamycin treatment.
Figure 2—figure supplement 5

Many uORF and IRES containing genes are translationally regulated.
The table/heatmap shows mammalian genes with known translation regulation via upstream open reading frames (uORFs) or internal ribosome entry sites (IRES). The change in expression data is shown for the RNA and ribosome footprinting data for three replicates for ER stress. Eight genes have significant translation upregulation and are shown in the main text. The FDR is listed as the median value across the three replicates (if it is significant it is so in at least two replicates) and converted to a signed value, that is positive if translation regulation is positive and negative if negative. Therefore, values > 0.80 denote an FDR < 0.2 for significant upregulation and values < −0.80 denote significant negative regulation. Figure 2E shows the subset of genes with uORFs and known roles under ER stress. sFDR - signed false discovery rate.
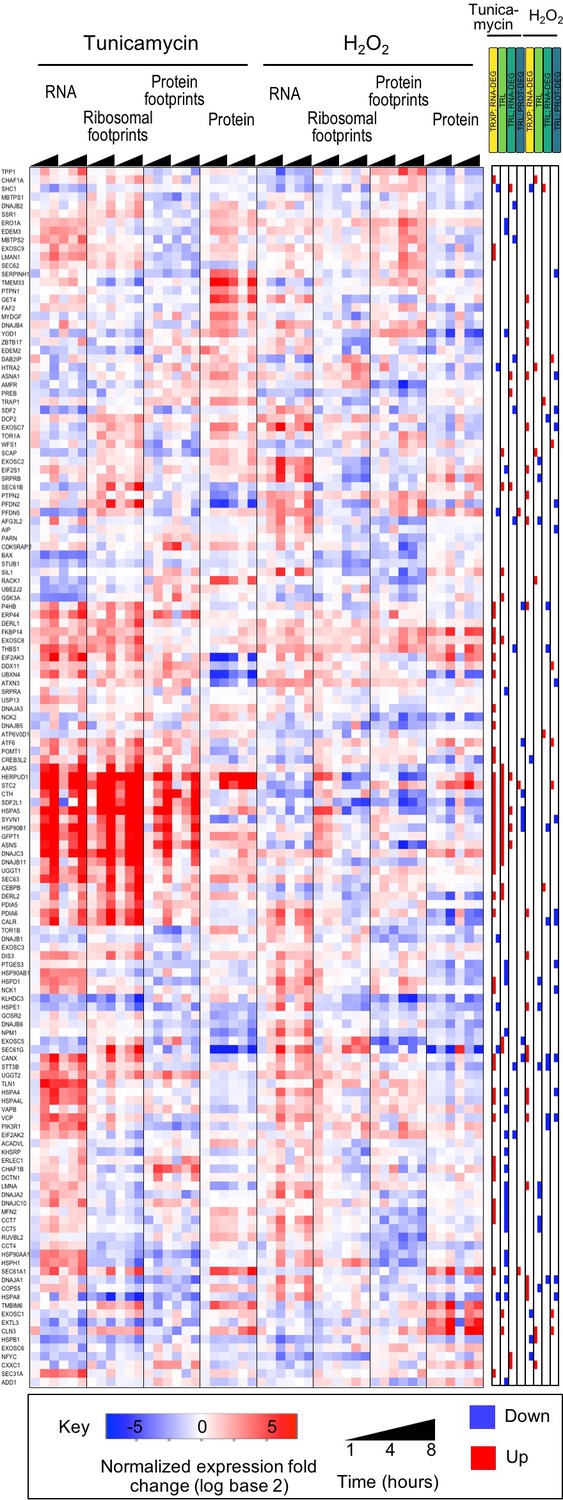
Figure 3 with 7 supplements

Integrated data reveal global and gene-specific regulation in response to misfolding stress.
(A) The heatmap shows relative changes in RNA abundance, ribosome and non-ribosomal protein footprints, and protein abundance for 7,011 genes (rows) in duplicate after 1, 4 and 8 hr of tunicamycin or hydrogen peroxide treatment. Rows are sorted using complete-linkage hierarchical clustering and labeled according to their cluster number. We chose 20 clusters based on the ‘elbow method’ (Figure 3—figure supplement 3). (B) The heatmap indicates significant regulatory events for the genes at each regulatory level displayed along the top (false discovery rate <0.2 for both replicates). (C) The heatmap shows function pathways that are significantly enriched in the gene clusters (p-value<0.01). The order of the genes is the same across all three panels. FDR - false discovery rate; TRXP - transcription; TRL - translation; RNA-DEG - RNA degradation; PROT-DEG - protein degradation.
Figure 3—figure supplement 1
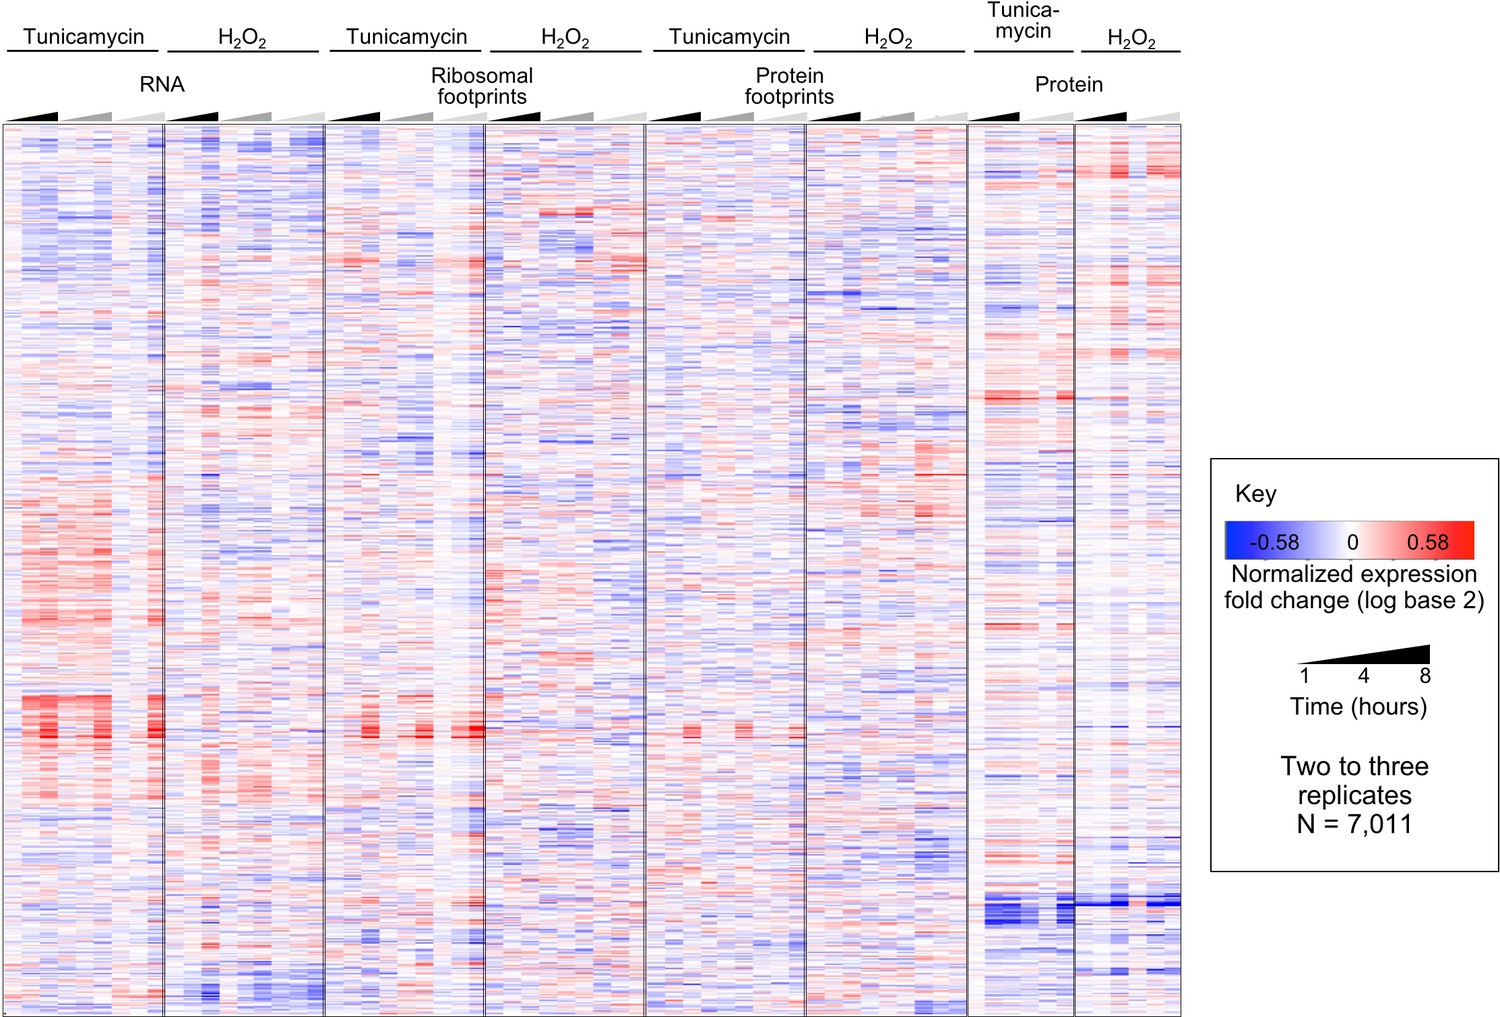
Replicates are consistent even prior to principal component analysis.
The heatmap shows integrated data for the log base two transformed Z-scores calculated for each time series experiment, prior to removing one of the three replicates and processing by Principal Component Analysis. The total number of genes is 7,011, corresponding to the data shown in Figure 3, main text. For visualization purposes, the replicates are indicated in different shades of black/grey in the time triangles. Replicates are highly consistent with each other.
Figure 3—figure supplement 2

The results are robust to different significance thresholds.
The figure shows for all 7,011 genes from the core dataset (left) and 143 known UPR genes (right) the distribution of significant regulatory events as determined by PECA using different significance thresholds (false discovery rate, FDR, 0.05, 0.1, 0.2; top to bottom). The main text focuses on results with FDR < 0.2. In each case, we required both replicates to show a regulatory event at the given threshold at any time point. The results are similar across different thresholds and for the UPR subset.
Figure 3—figure supplement 3
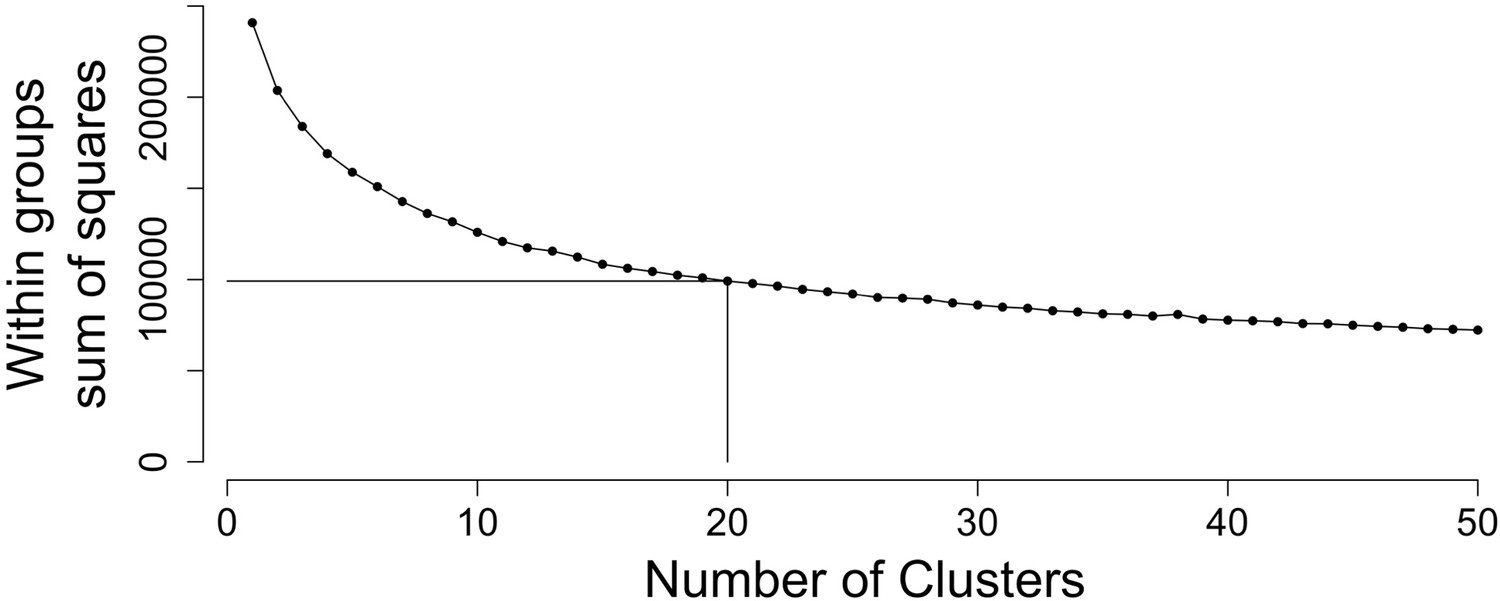
Twenty clusters capture majority of biological variation.
The sum of squares within groups (WSS) was calculated to identify the optimal number of clusters using the ‘elbow method’. Based on this, we chose the number of clusters in Figure 3 to equal twenty where the addition of further clusters does not markedly reduce WSS.
Figure 3—figure supplement 4
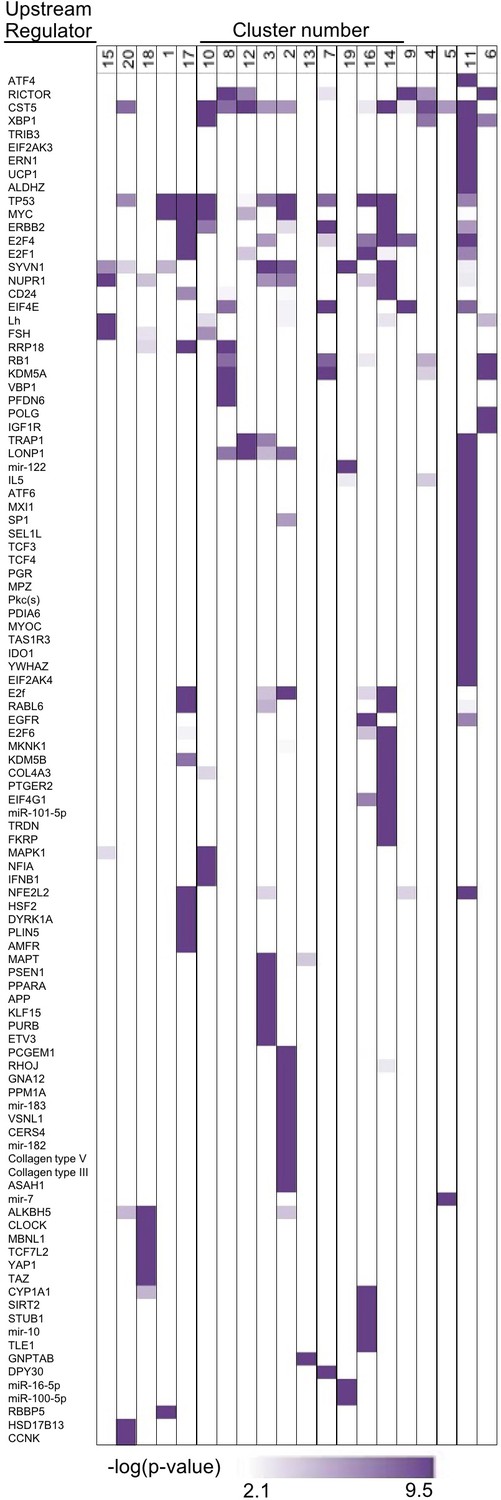
ATF4 and other upstream regulators target specific groups of genes.
We used IPA to screen for significantly enriched (p-value<0.001, purple) upstream regulators in each respective cluster, based on prior knowledge of transcriptional regulators and their targets. Indeed, ATF4 and other stress-related transcription factors are strongly enriched in the UPR cluster (cluster 11, Figure 3C).
Figure 3—figure supplement 5
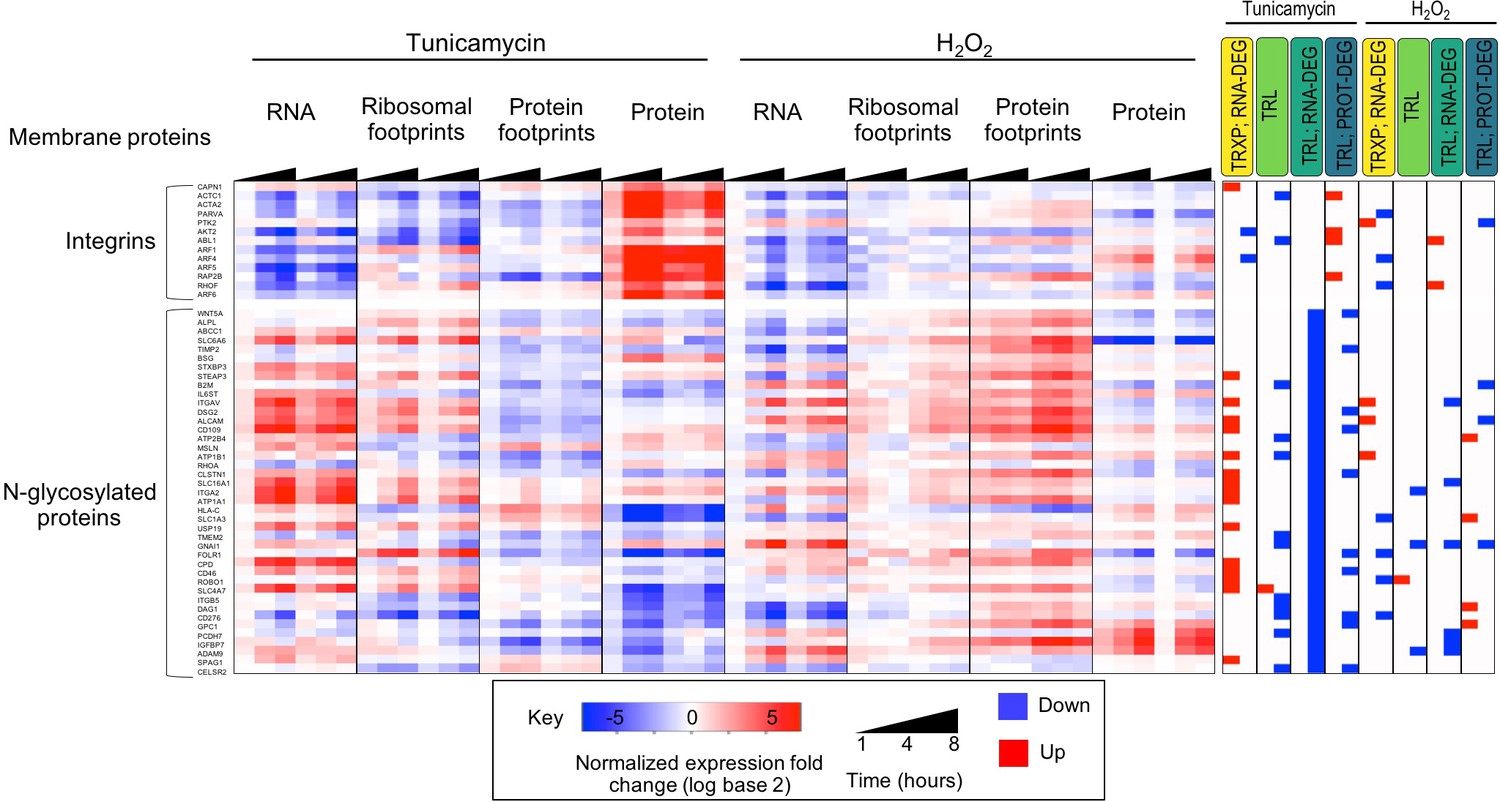
Transmembrane proteins are often regulated at post-transcriptional levels.
The subset of integrin related proteins display a negative trend in their transcript abundance during ER stress, however they are often upregulated at the protein level. A lack of translation induction for these genes suggests protein stabilization and decreased protein degradation. Alternatively, N-linked glycosylated proteins display decreasing ribosomal footprints, as well as significantly reduced protein occupancy in their 3’ UTR upon tunicamycin treatment. While many of these genes show significant increases in transcript levels, they display relatively stable protein abundance.
Figure 3—figure supplement 6
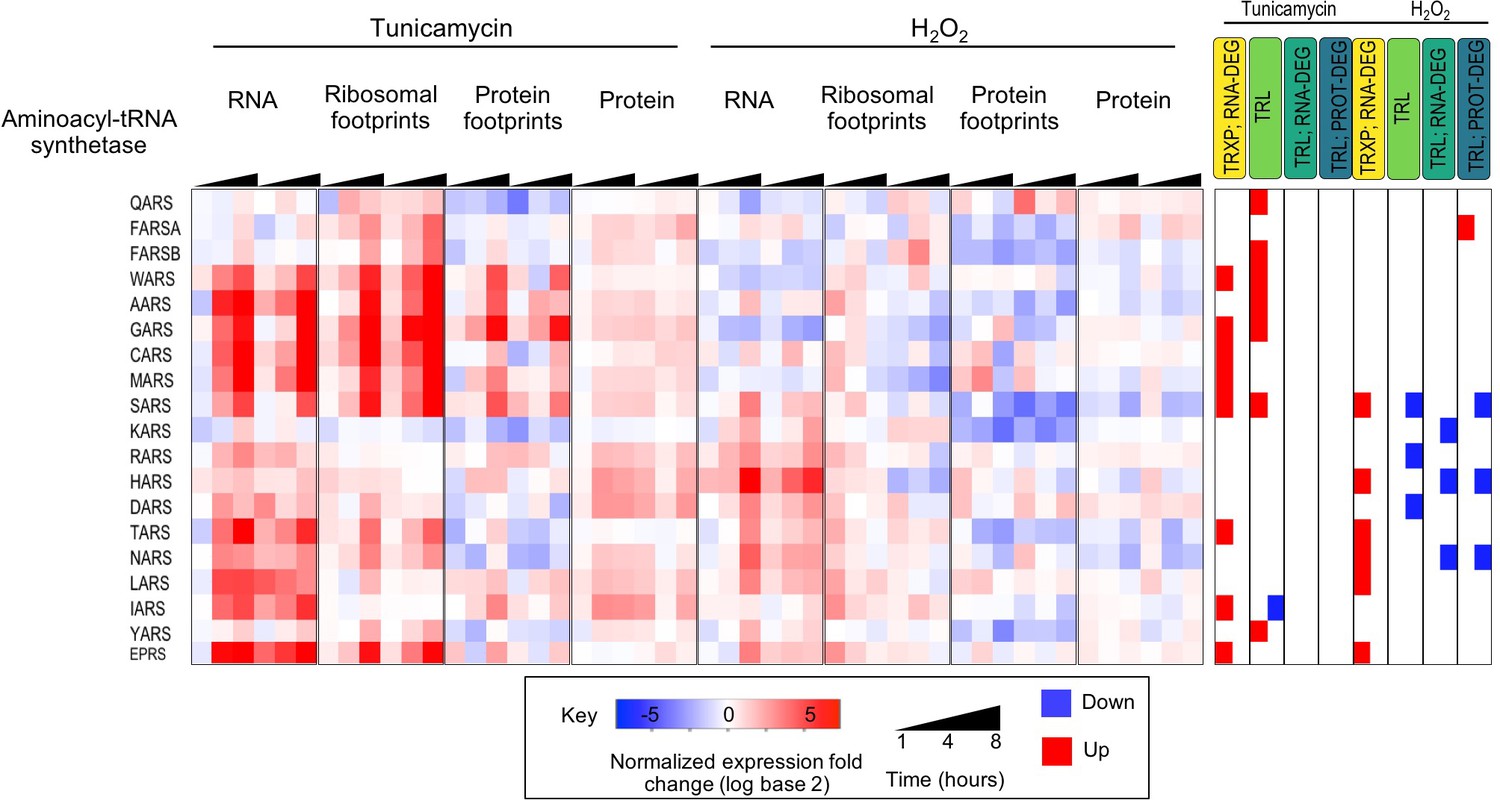
Many cytosolic aminoacyl-tRNA synthetases increase in transcription and translation during ER stress.
The heatmap shows the expression data for the cytosolic aminoacyl-tRNA synthetases found in our dataset. Many of the enzymes change significantly in expression at different levels, particularly in transcription and translation during ER stress.
Figure 3—figure supplement 7
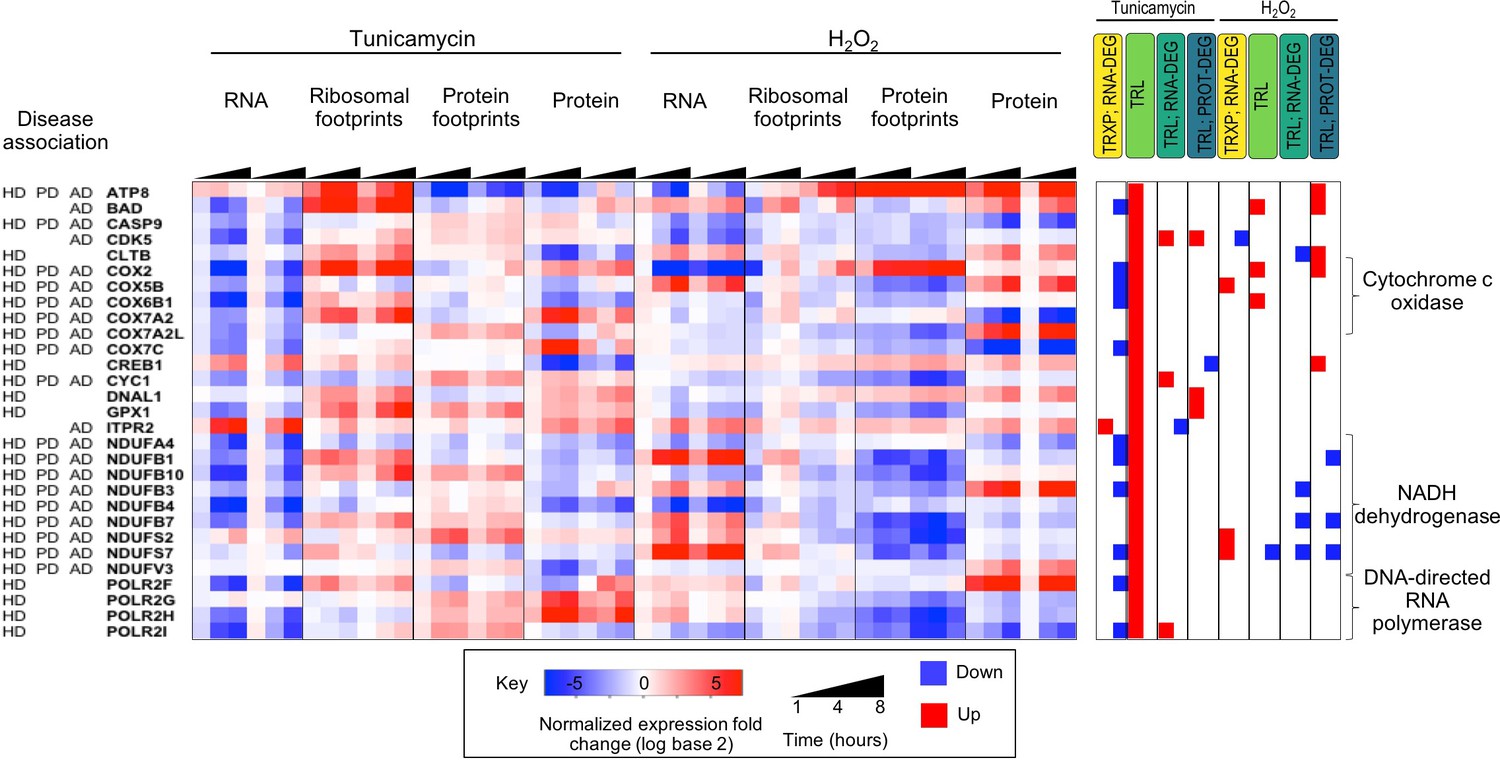
Genes that are translationally up-regulated under ER stress often function in neurodegenerative diseases.
The heatmap shows 29 proteins localized to mitochondria and which are significantly translationally induced. They are largely components of cytochrome c oxidase, NADH dehydrogenase, and DNA-directed RNA polymerase and are involved in a variety of neurodegenerative diseases. HD - Huntington’s disease; PD - Parkinson’s disease; AD - Alzheimer’s. disease.
Figure 4 with 1 supplement
Gene expression is differentially regulated across processes, time, and stress types.
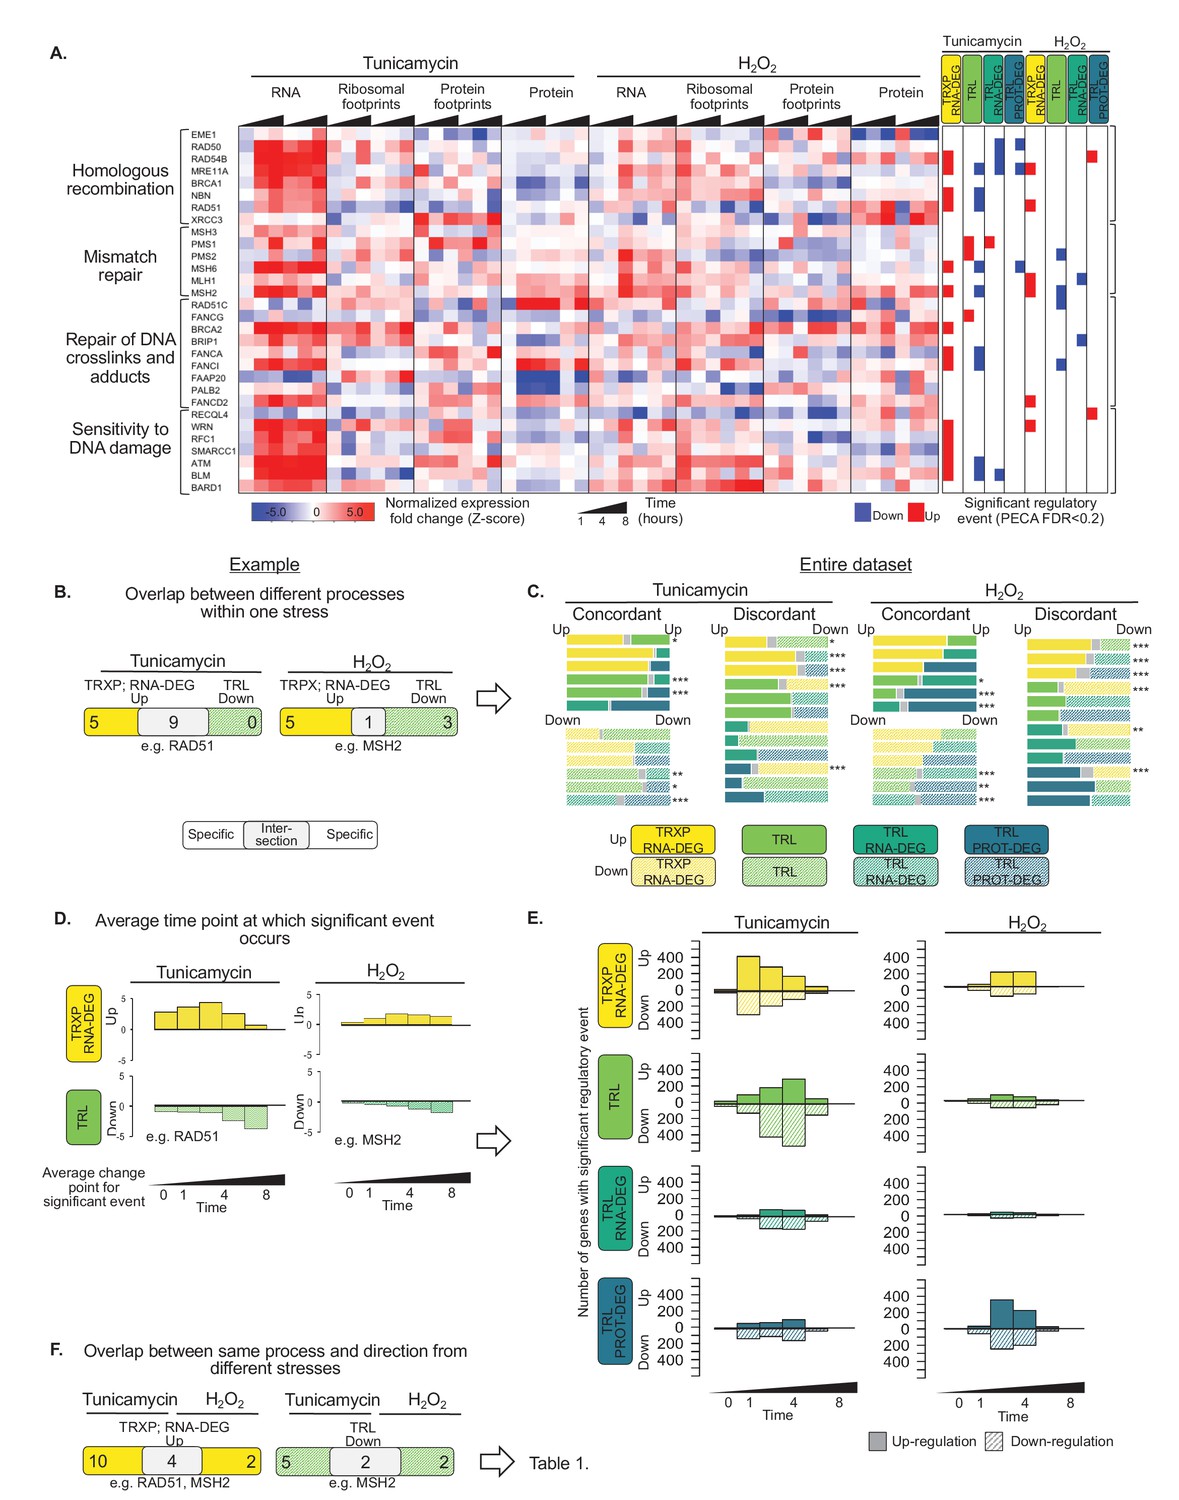
(A) RNA abundance, ribosome and non-ribosomal protein footprints, and protein abundance for genes involved in selected DNA repair pathways change in distinct ways, with significant regulation at each regulatory level as determined by PECA (false discovery rate <0.2 in both replicates). Figure 4—figure supplement 1 shows the data for all DNA repair genes. (B) The Venn diagrams illustrate the overlap (intersection) between genes regulated at different levels at the example of the 30 DNA repair genes shown in (A). Concordant or discordant regulation can be extracted through comparison of the number of genes with significant regulatory events affecting gene expression in the same or different directions, respectively. These genes are in the intersection displayed in grey. RAD51 and MSH2 are two examples for such discordantly regulated genes in which transcription/RNA degradation is significantly upregulated, but translation is significantly downregulated. (C) Venn diagrams show concordant and discordant regulation for the entire dataset of 7,011 genes. Bar sizes represent relative gene numbers within each group, and the intersection in grey. The intersection/overlap contains the genes with concordant or discordant regulation: the genes show significant regulation for two processes. We used the hypergeometric test to determine if a significant number of genes was regulated by two processes and placed in the intersection (*p-value<0.1,**p-value<1×10^−3,***p-value<1×10^−6). For example, both tunicamycin and hydrogen peroxide treatment show a significant number of genes with discordant regulation in which transcription is upregulated, but translation decreases. These genes are enriched in DNA repair genes which are discussed in the text and shown panel (A) and (B, D) We deconvoluted the regulatory events identified for DNA repair genes with respect to time: graphs indicate when the event occurred during the 8 hr experiment, as averaged over two replicates. A positive y-axis shows upregulated genes (transcription), while negative y-axis represents downregulated genes (translation). (E) The panels show the time-dependent occurrence of significant events for the entire dataset shown in Figure 3. The panels show from top to bottom: TRXP/RNA-DEG; TRL; TRL/RNA-DEG; TRL/PROT-DEG. (F) The Venn diagrams illustrate at the example of the DNA repair genes the analysis of the relationship between the two stresses. RAD51 and MSH2 are both transcriptionally upregulated in response to either treatments, while MSH2 is decreases in translation in both treatments. The results for the entire data are discussed in Table 1. FDR - false discovery rate; TRXP - transcription; TRL - translation; RNA-DEG - RNA degradation; PROT-DEG - protein degradation.
Figure 4—figure supplement 1
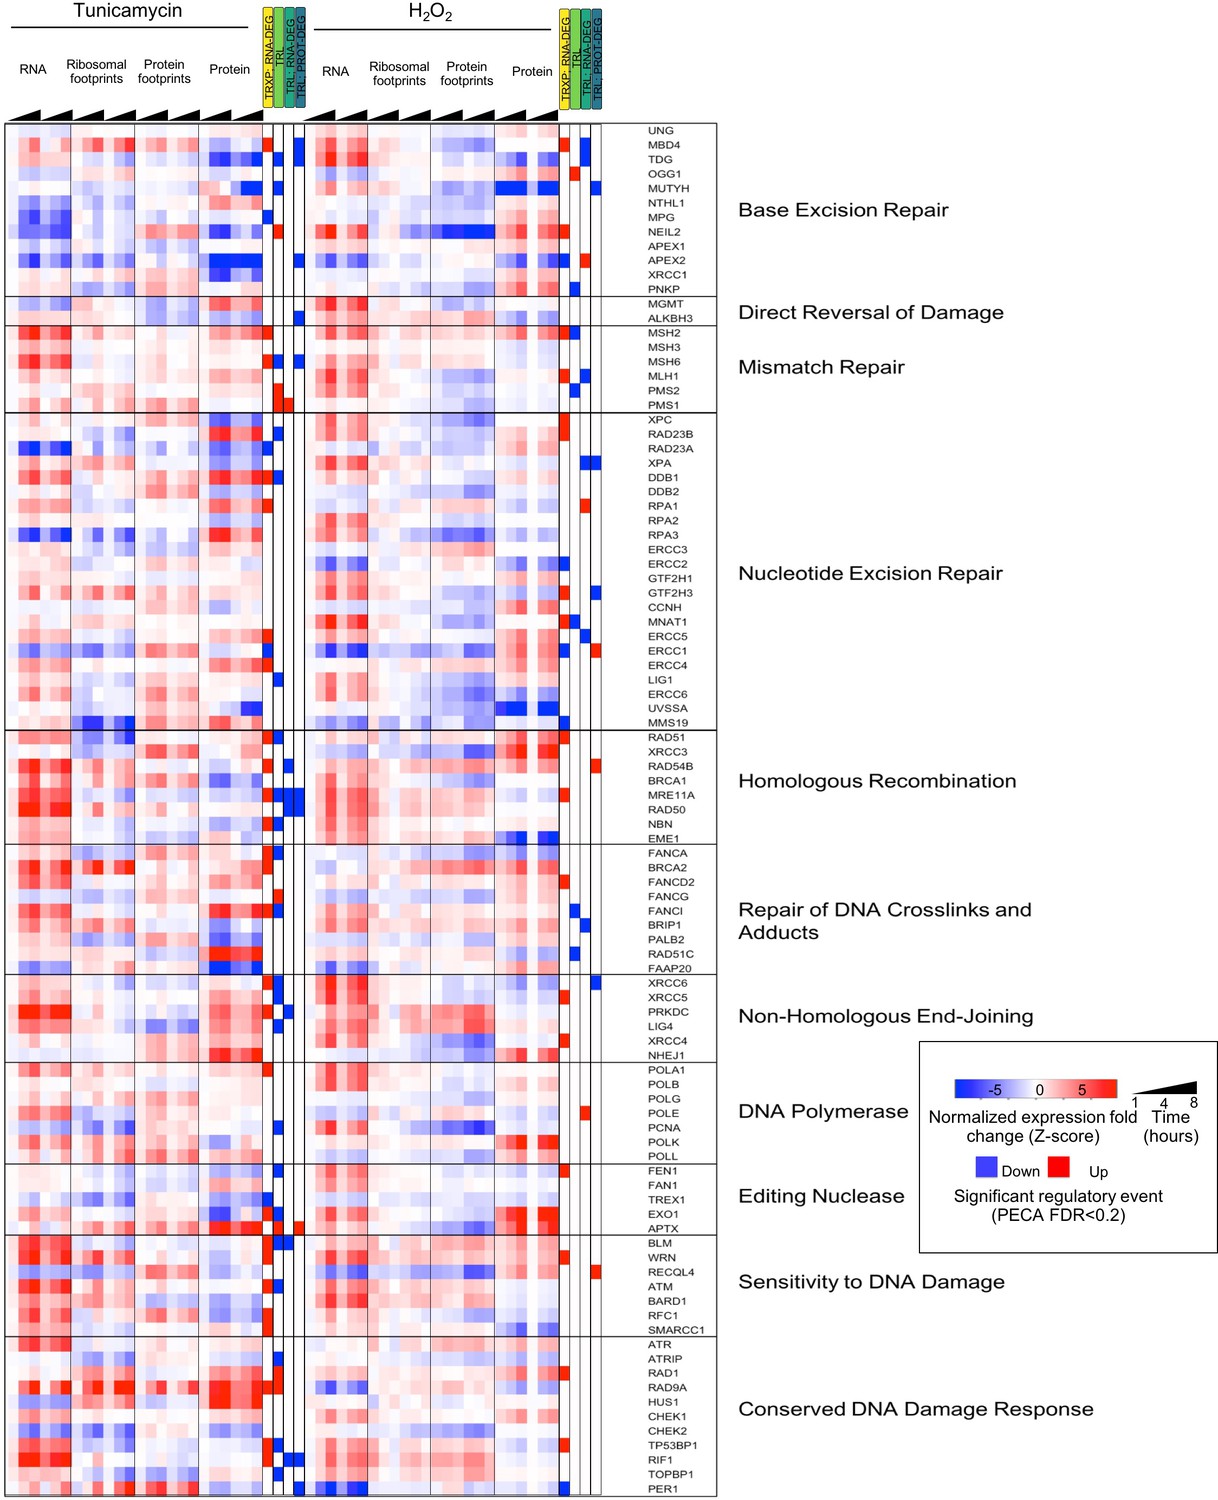
DNA repair pathways and their regulation during stress.
The heatmap shows the extended data for DNA repair enzymes discussed in Figure 4A.
Figure 5 with 1 supplement
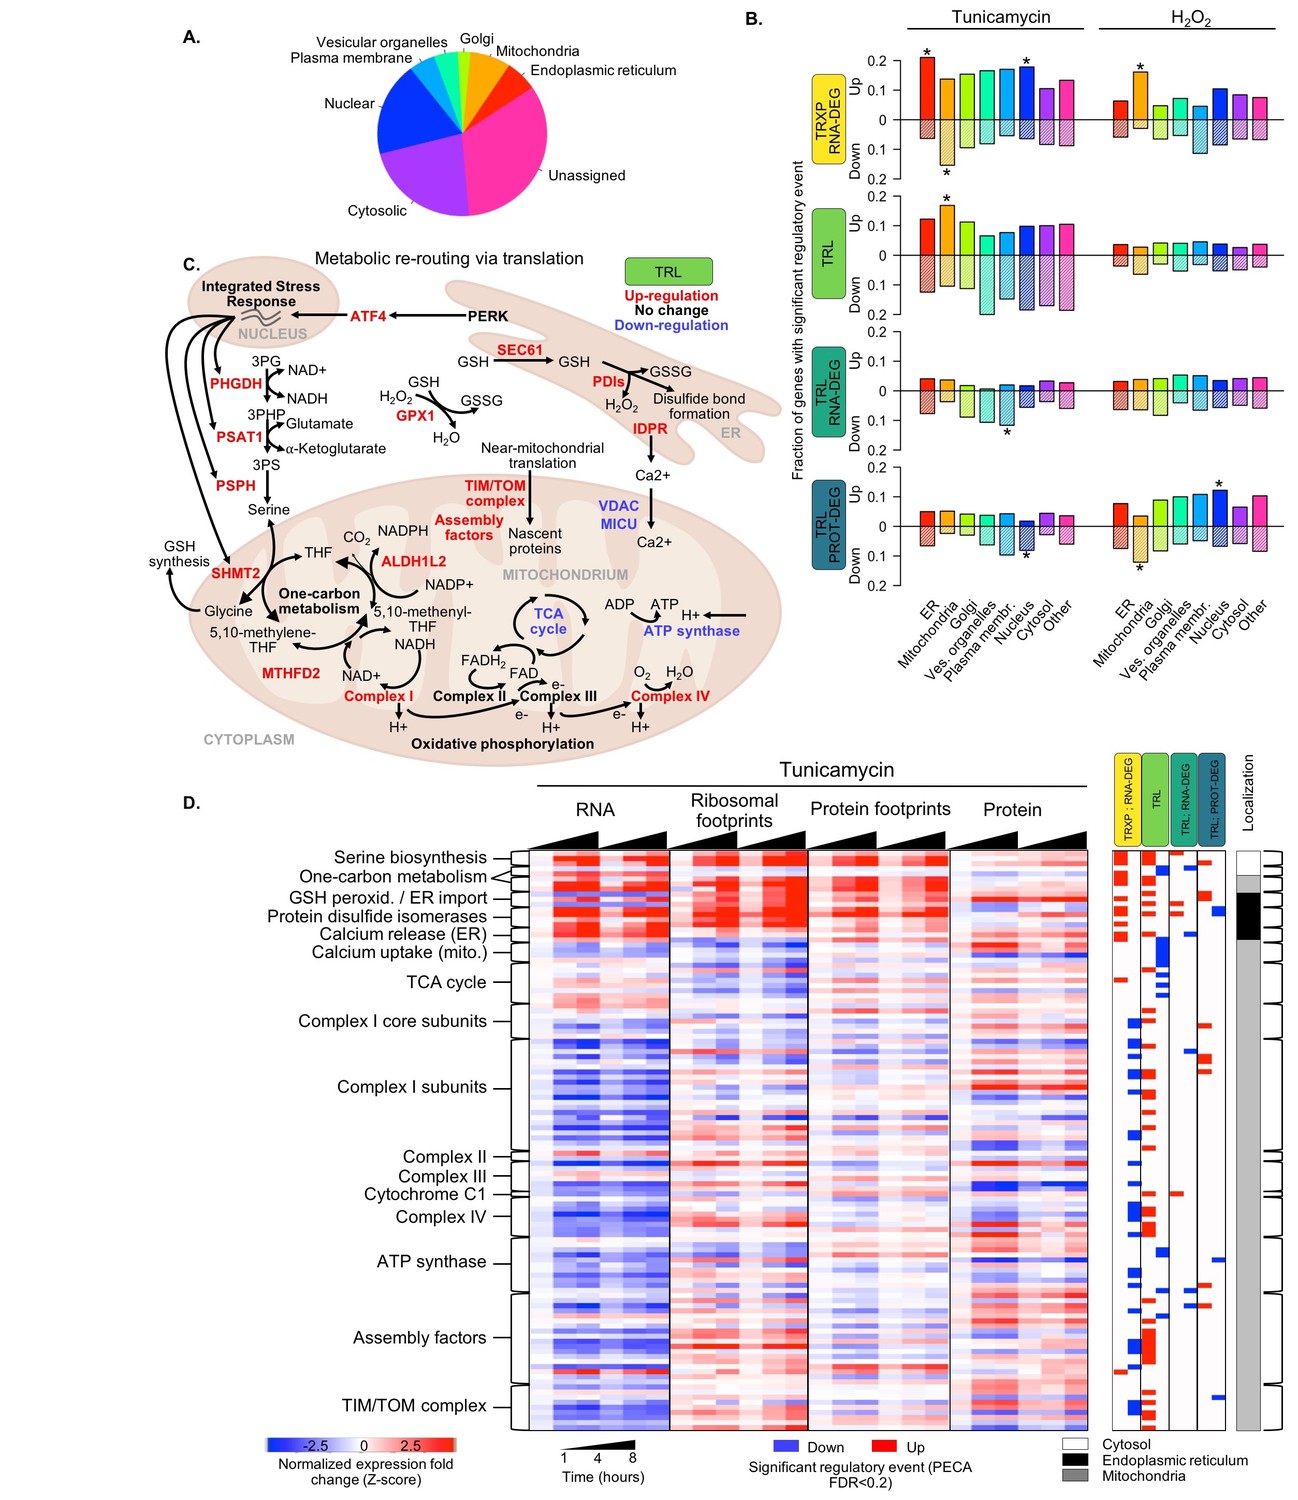
Translation regulation supports re-routing in energy metabolism.
(A) The 7,011 proteins in the core dataset map to different subcellular localizations (Itzhak et al., 2016). (B) Panels indicate the fraction of organelle-specific genes that are regulated within the different processes responding to the two types of stress. A positive y-axis represents upregulated genes, while negative y-axis represents downregulated genes. Fisher’s exact tests were used to assess whether up- or down-regulated genes were independent of each organelle. Significant differences in the distributions compared to all genes are indicated by * (adjusted p-value<0.05). (C) Significant changes in translation of different pathways suggests rerouting of energy production to involve one-carbon metabolism. The diagram illustrates the simplified relationships between genes in panel (D). Translation up- or down-regulation of genes and pathways is indicated by color. (D) The heatmap shows the data collected for mitochondrial and related genes discussed in panel (C), responding to ER stress. Figure 5—figure supplement 1 summarizes the translation changes for genes from oxidative phosphorylation, the ATP synthase complex, and the tricarboxylic acid cycle. FDR - false discovery rate; TCA - tricarboxylic acid; TRXP - transcription; TRL - translation; RNA-DEG - RNA degradation; PROT-DEG - protein degradation.
Figure 5—figure supplement 1
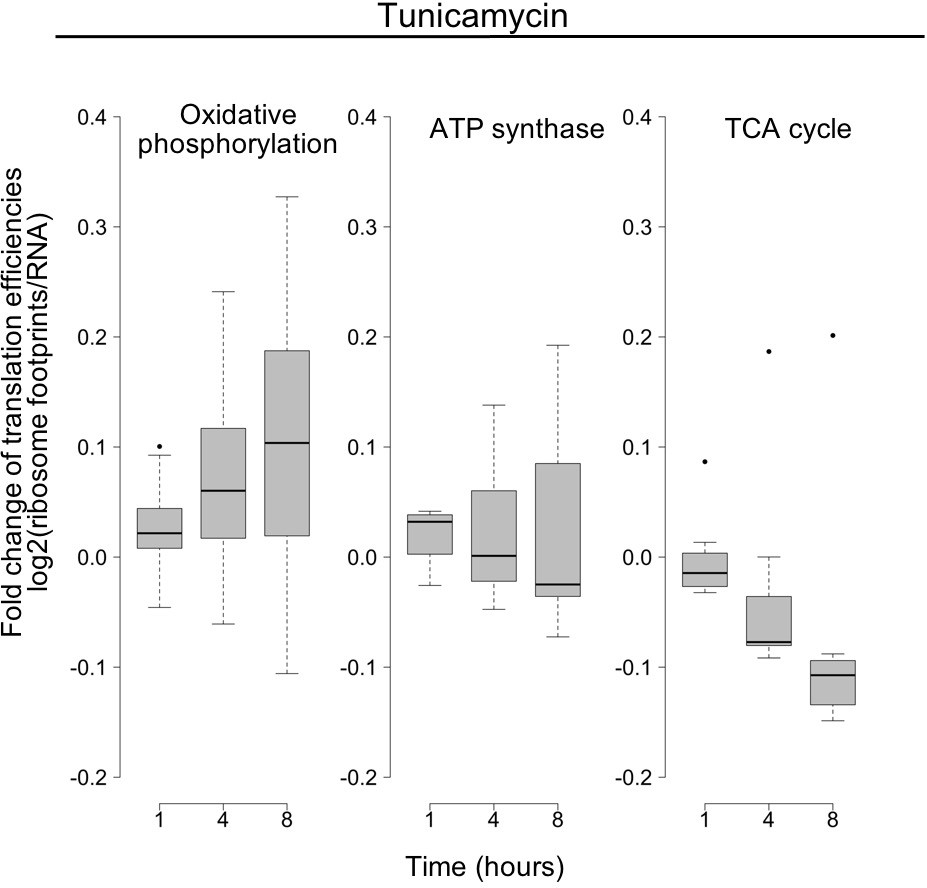
Translation changes of oxidative phosphorylation and related genes.
The panels show the time-dependent changes in translation efficiency for specified gene families responding to tunicamycin treatment, as a summary of what is shown in Figure 5C,D in the main text. Changes in the log base 2 ratio of ribosome footprints by RNA abundance as a proxy of translation efficiency, averaged over all genes within a given group and replicates. Oxidative phosphorylation N = 46; ATP synthase N = 10; TCA cycle N = 7.
Figure 6 with 2 supplements
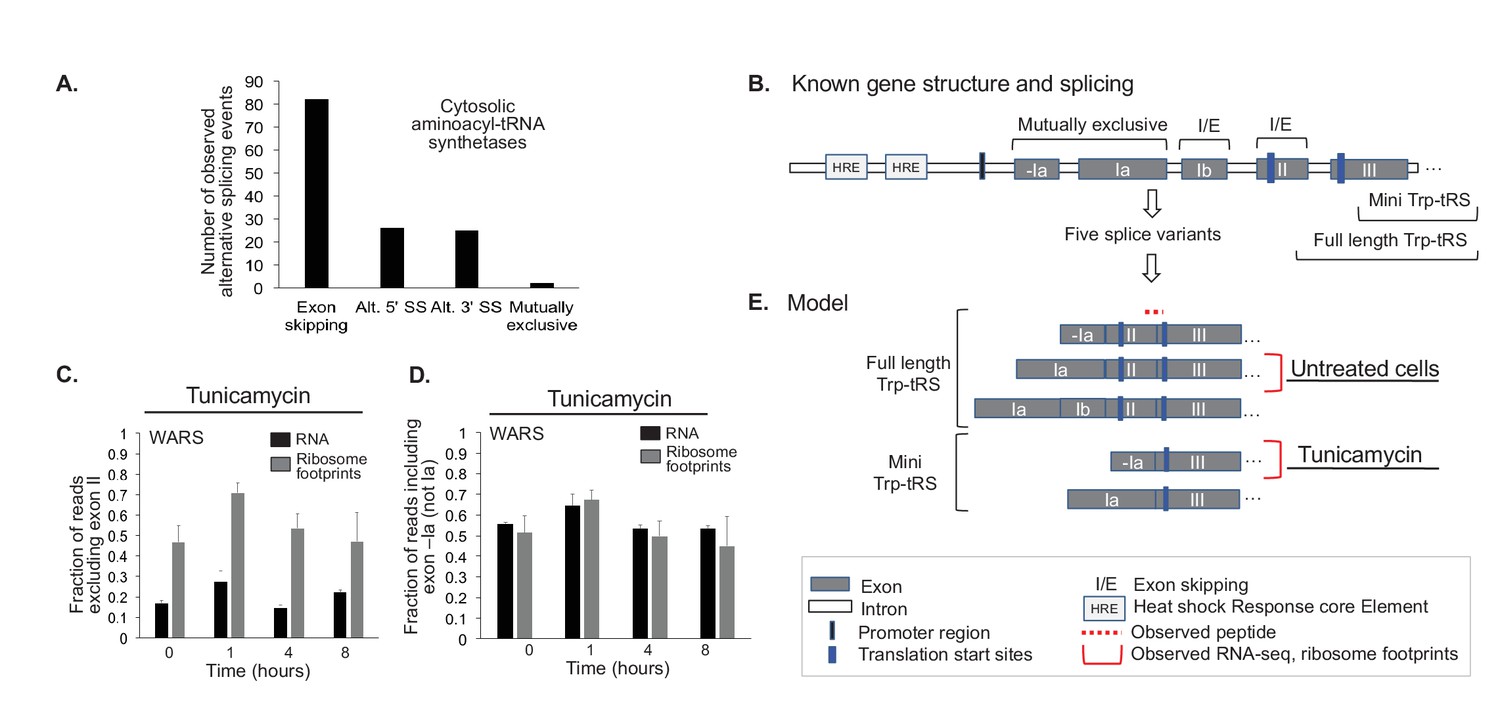
Aminoacyl-tRNA synthetases show evidence for alternative splicing under stress.
(A) Aminoacyl-tRNA synthetase genes are extensively spliced. We detected a total of 82 exon skipping events, 26 alternative 5’ splice sites (Alt. 5’ SS), 25 alternative 3’ splice sites (Alt. 3’ SS), and two mutually exclusive exons amongst cytosolic aminoacyl-tRNA synthetases. (B) Alternative splicing for some genes correlates with the stress response, as illustrated for tryptophanyl-tRNA-synthetase responding to ER stress (Trp-tRS, WARS). The diagram is not drawn to scale. The long and short protein isoforms of Trp-tRS are known to be encoded by five transcript variants, each with a different 5’UTR that arises through alternative splicing. When exon II is spliced in, translation starts on exon II, leading to a full-length protein isoform. When exon II is skipped, translation starts on exon III, resulting in the truncated mini-TrpRS isoform. (C) Skipping of Trp-tRS’ exon II, which results in the mini-TrpRS isoform, increases after one hour of tunicamycin treatment in both the RNA and ribosome footprinting data. Expression of exon II decreases again after the first hour.(D) WARS’ exons -Ia and Ia are mutually exclusive. The fraction of reads including exon -Ia increases at one hour after tunicamycin treatment similar to the skipping of exon II shown in panel (C). The exon II skipping event is significantly more likely to occur when transcription starts on exon -Ia (p-value<0.01, Figure 6—figure supplement 2). (E) Our data suggests two interdependent splicing events that promote production of the short isoform mini-Trp-tRS in response to tunicamycin treatment. The peptide AGNASKDEIDSAVK spans the exon II/III junction and is only present in the full-length isoform,its expression is shown in Figure 6—figure supplement 2.
Figure 6—figure supplement 1
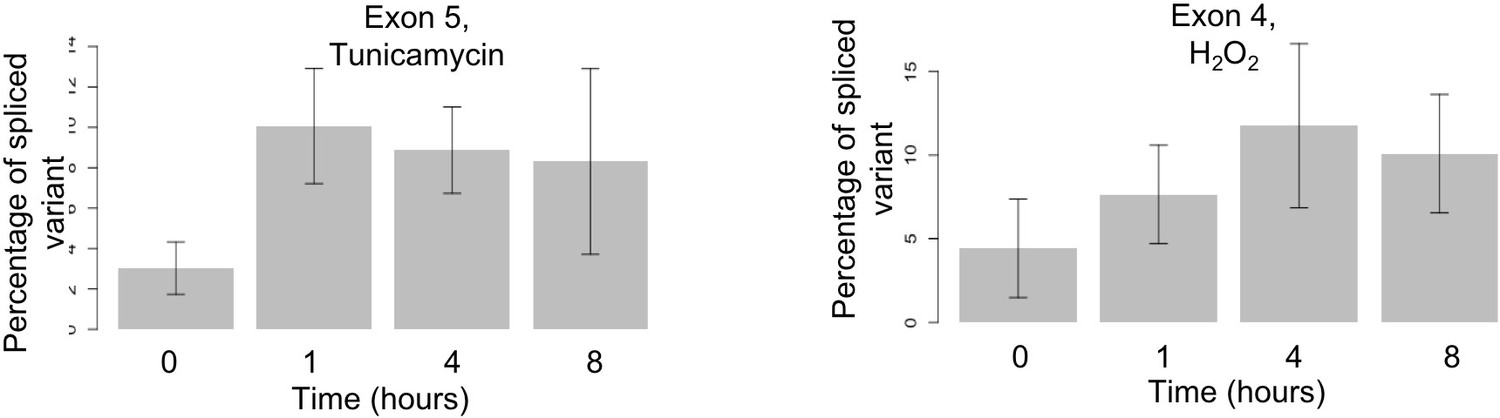
Alternative splicing for leucyl-tRNA synthetase (LARS).
LARS represents another example for time dependent alternative splicing under stress. Using the same method as described for WARS, we find expression of a minor variant excluding exon four at four hours after hydrogen peroxide treatment (right) and of a minor variant excluding exon five at one hour after tunicamycin treatment (left). The difference between 0 and 1 hr is significant (p-value<0.001). Supplementary file 6 shows further examples.
Figure 6—figure supplement 2
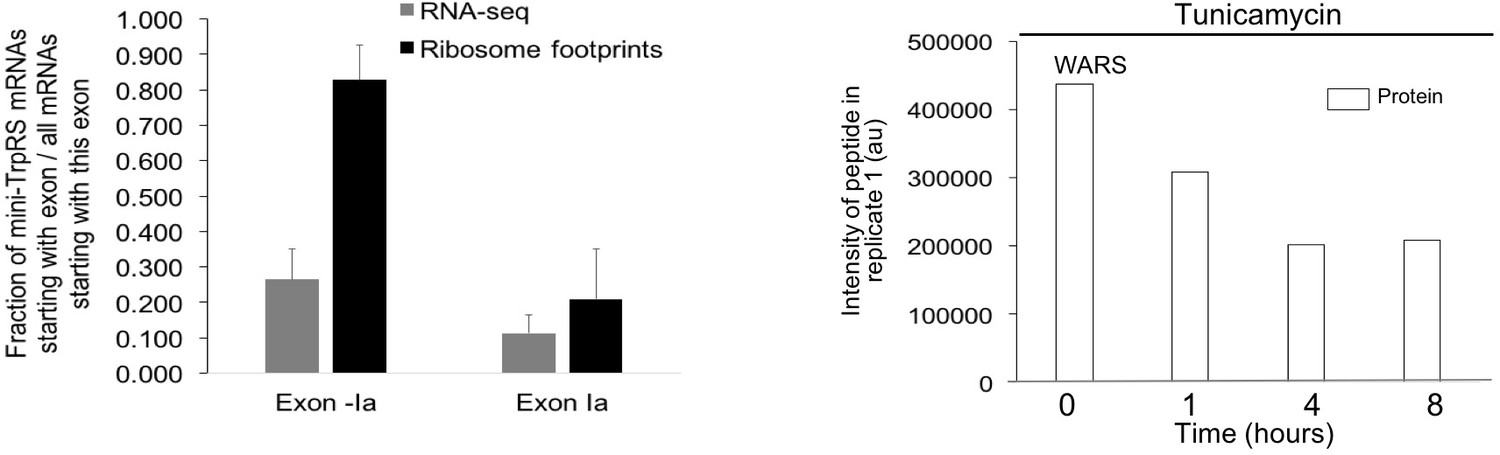
Extended analysis for splicing events in tryptophanyl-tRNA synthetase (WARS).
The two protein isoforms of tryptophanyl-tRNA-synthetase (TrpRS, WARS) are encoded by five different transcript variants, each with a different 5’UTR that arises through alternative splicing. When exon II is spliced in, translation starts on exon II, leading to a full-length protein isoform. When exon II is skipped, translation starts on exon III, resulting in the truncated mini-TrpRS isoform. For the RNA data, 26.4% of the reads start at WARS exon -Ia skipping exon II, leading to the truncated mini-TrpRS isoform. In comparison, 11.3% of reads starting at exon Ia. For ribosome footprints, 82.8% of reads starting at WARS exon -Ia skip exon II, compared to 20.9% for reads starting at exon Ia. The exon II skipping event is significantly more likely to occur when transcription starts on exon -Ia (p-value<0.0001). The peptide AGNASKDEIDSAVK spans the exon II/III junction and is only present in the full-length isoform. Abundance of the peptide defining the full-length TrpRS isoform decreases with tunicamycin stress.
Figure 7 with 3 supplements
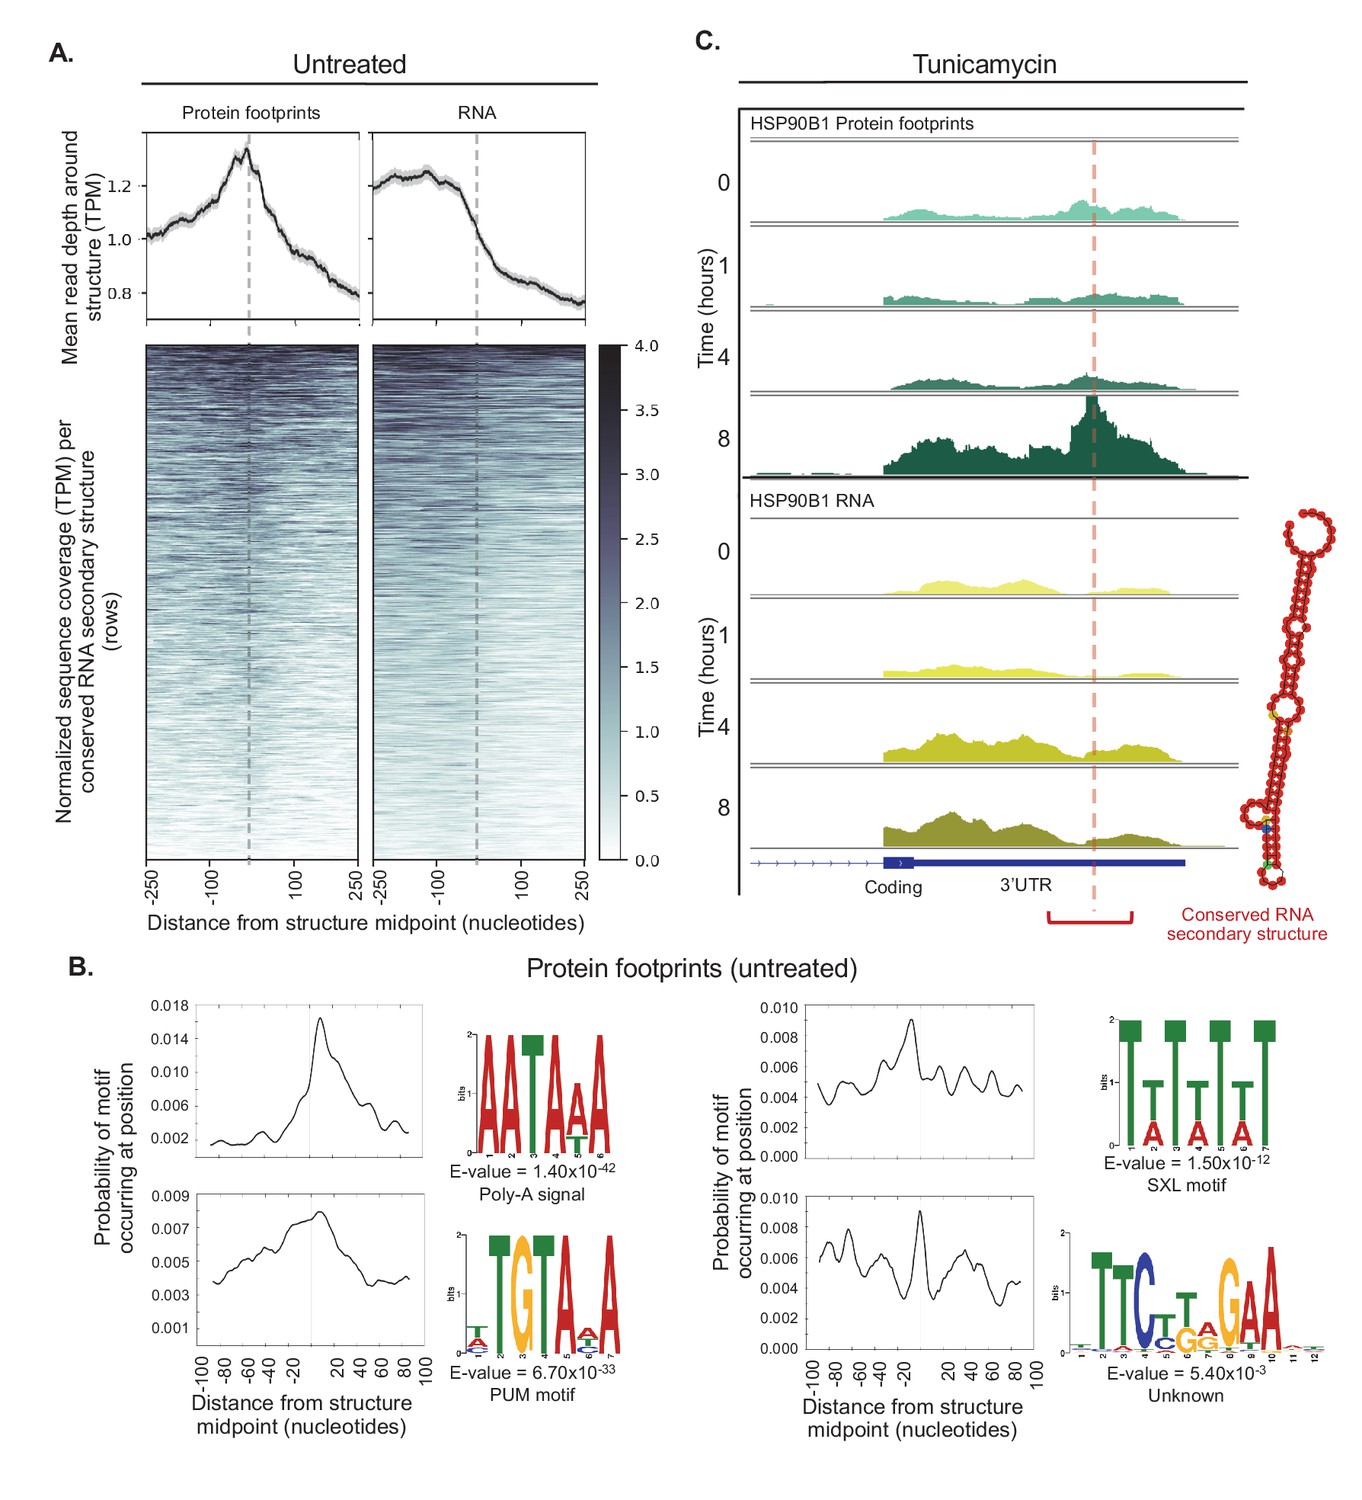
Conserved RNA secondary structures are enriched in protein footprints.
(A) Top panels show mean read depth (transcripts per million) of conserved RNA secondary structures in the 3’ UTR in a window ±250 nucleotides for protein footprints and RNA, respectively. Data was collected from untreated cells. Bottom panels show coverage for individual secondary structures over the 500 nucleotide window: each row corresponds to one secondary structure. Dashed lines indicate the midpoint of each secondary structure. (B) The sequence logos illustrate motifs enriched in sequences corresponding protein-bound RNA secondary structures. Probabilities describe change of the motif occuring in a ± 100 nucleotide window around the structure midpoints. PUM (Pumilio) is known to bind to single stranded RNA. SXL (Sex-lethal) does not have an ortholog in human, but the human RNA-binding protein ELAVL1 (HuR) has a similar binding motif. (C) The profiles show protein footprints (top) and RNA read coverage (bottom) for the 3’ UTR of the HSP90B1 chaperone, for one replicate after 0, 1, 4, or 8 hr of tunicamycin treatment. Dashed lines indicates the midpoint of the predicted RNA secondary structure; the structure location is indicated by the red bracket. The predicted RNA secondary structure on the right was generated using minimal free energy while incorporating structural reactivities acquired from publically available probing-based experimental data.
Figure 7—figure supplement 1
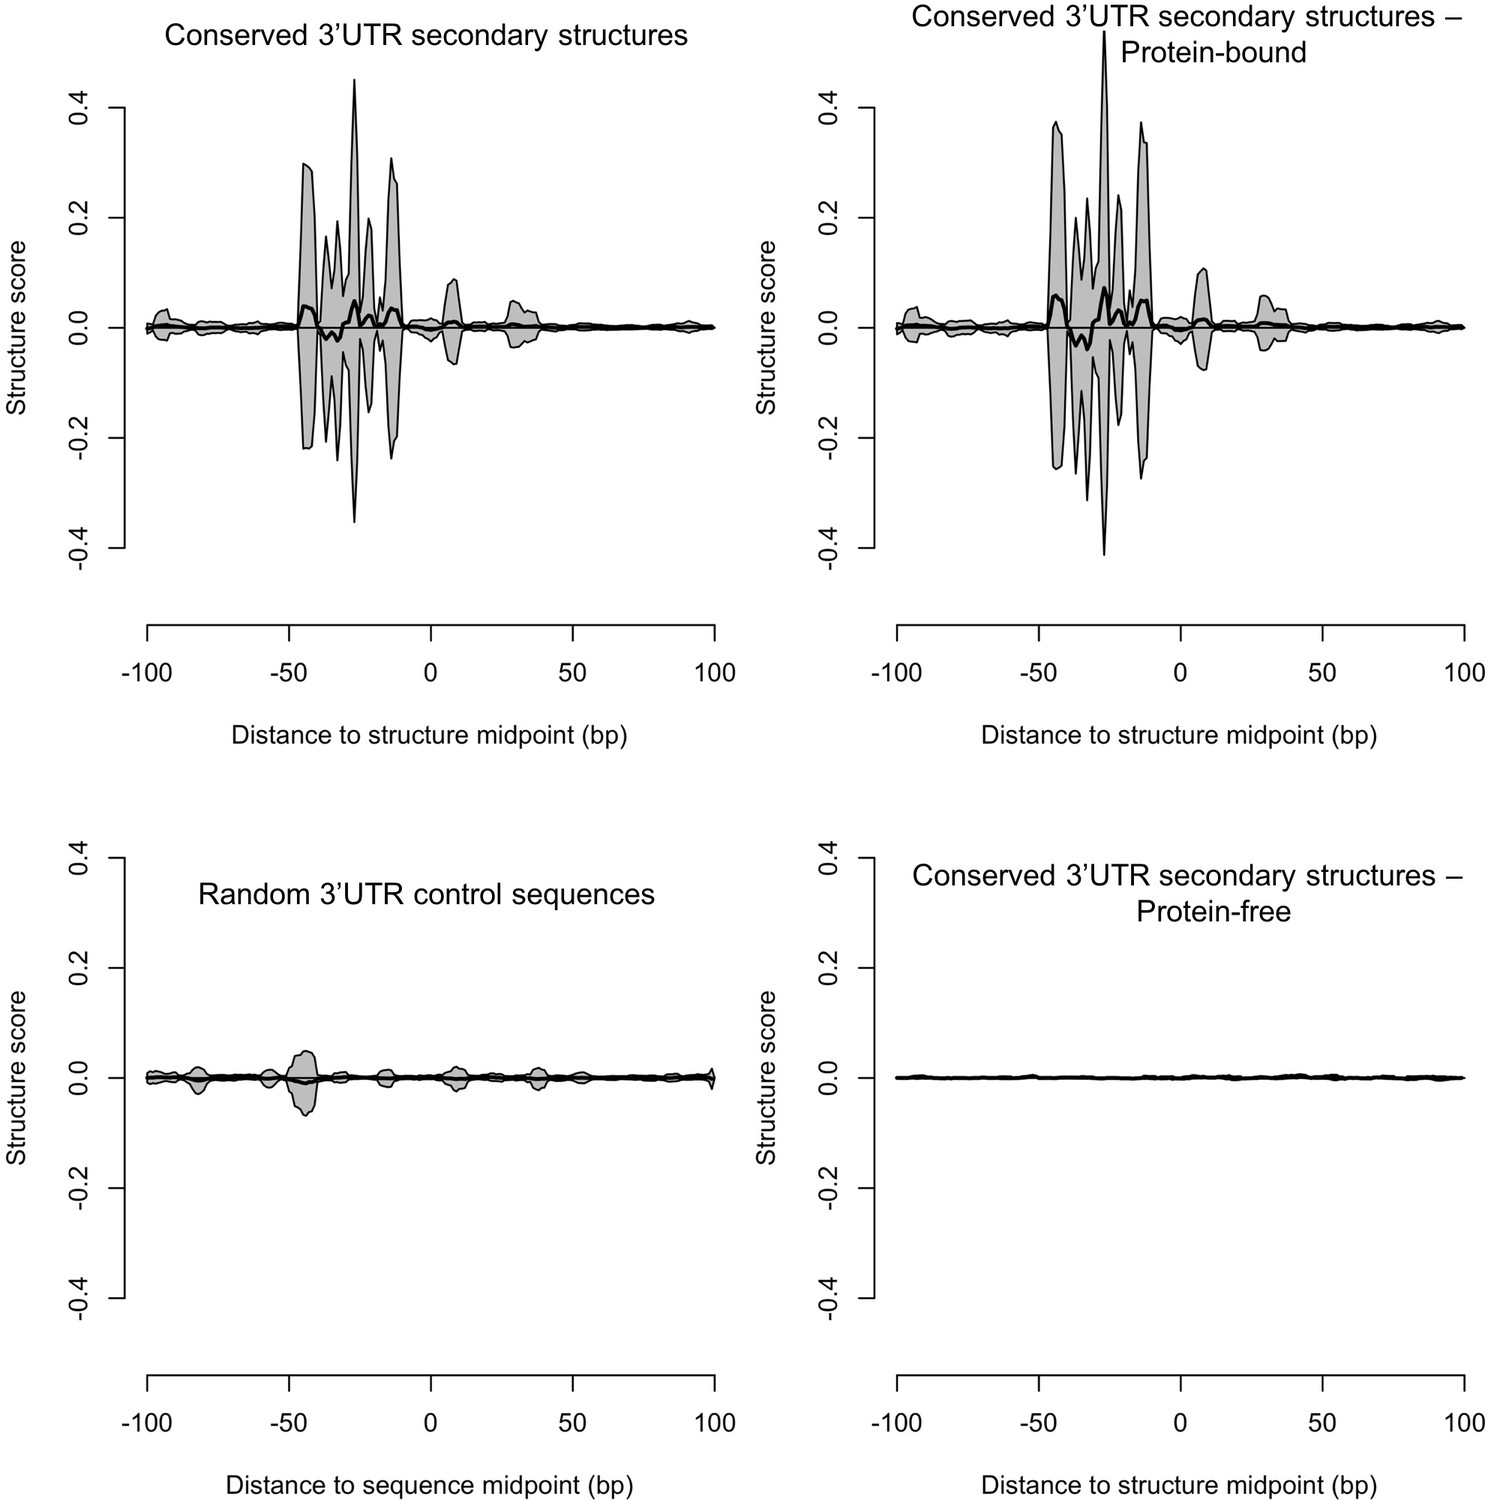
Predicted conserved RNA secondary structures in the 3’UTR have a higher structure score than random 3’UTR control sequences.
Using the Structure Surfer database (Berkowitz et al., 2016), we calculated structure scores based on the Parallel Analysis of RNA Structure (PARS). Mean aggregate scores (black lines)±one standard deviation (gray area) were calculated for 200 base pair regions surrounding the midpoint of 5504 predicted conserved secondary structures within 3’UTR regions used in our analysis (top left) (Figure 7, Table 2) and compared with 5504 randomly selected 3’UTR control sequences (bottom left). PARS scores reflect the accessibility of paired and unpaired regions to ribonucleases, with positive scores corresponding to double-stranded RNA and relies on experimental information (Wan et al., 2014). We separated the 5504 predicted conserved secondary structures into those with observed protein binding (top right) (>10 reads in our protein occupancy profiling data) and those without (bottom right). Predicted 3’UTR regions that also showed footprints in our protein occupancy data were enriched for PARS structures, further confirming the validity of the predicted conserved structures.
Figure 7—figure supplement 2
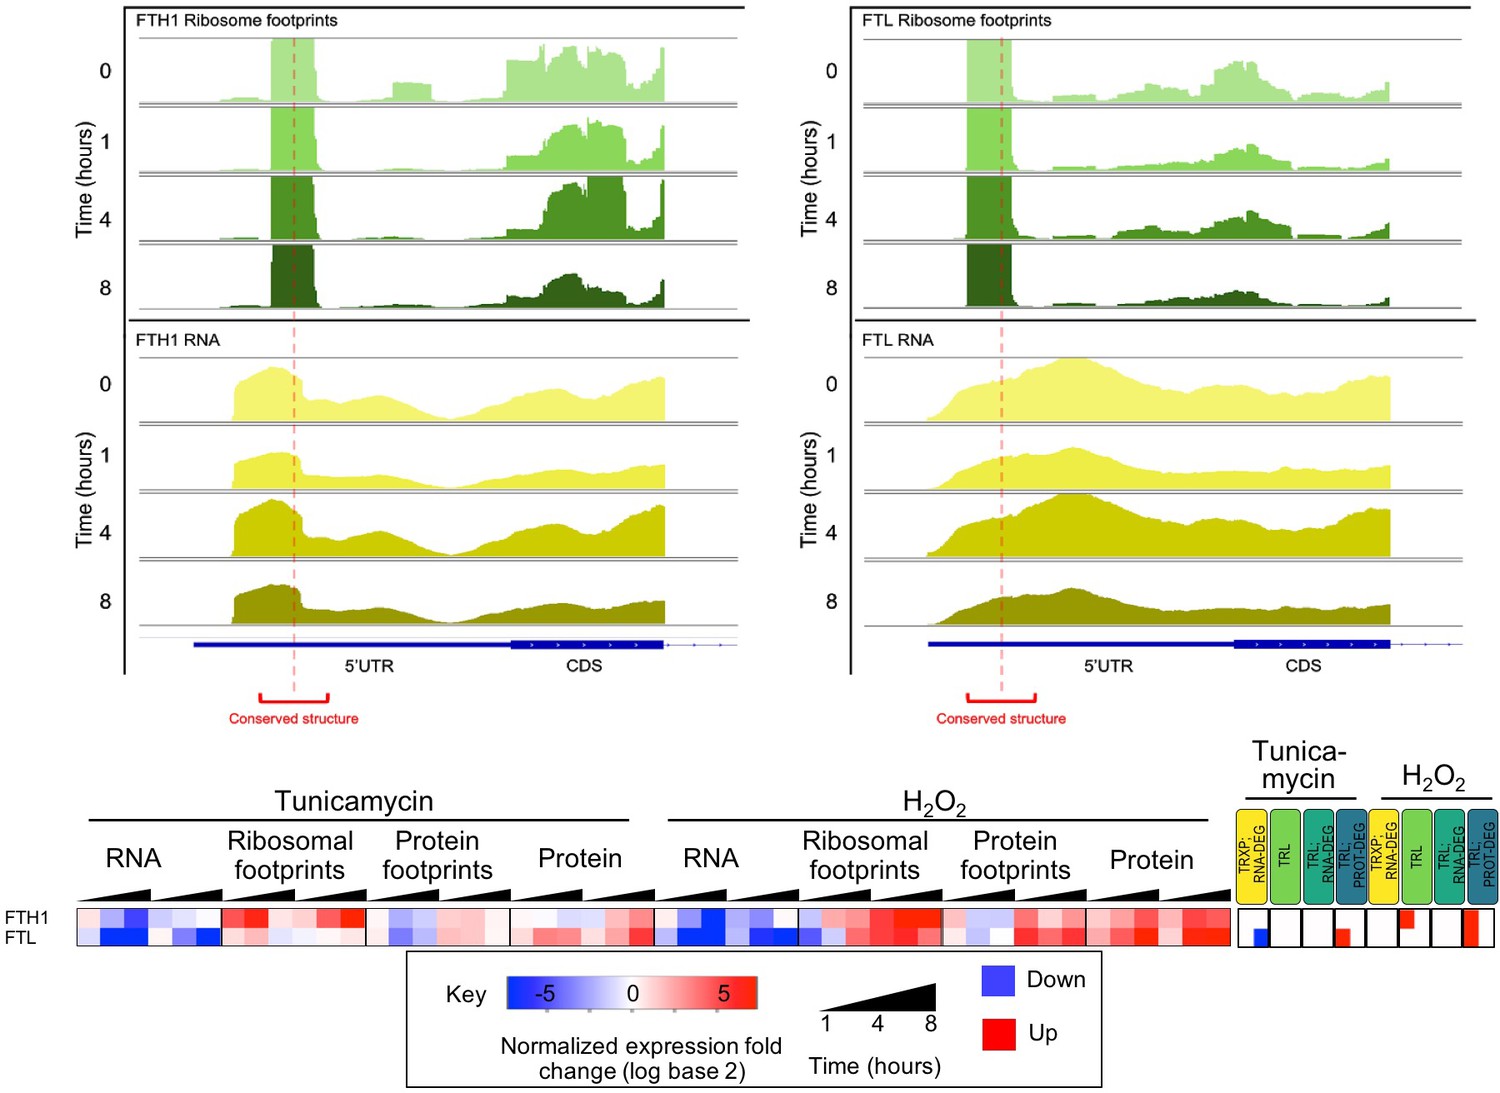
Predicted conserved secondary structures in the 5’UTR of ferritin heavy and light chain mRNA (FTH1 and FTL) display ribosomal occupancy surrounding structure midpoints.
Time-dependent read profiles for RNA (bottom, yellow) and ribosome footprints (top, green). Red dotted lines and brackets indicate the position of the conserved RNA secondary structure. Expression changes for these two genes are provided in the heatmap below.
Figure 7—figure supplement 3
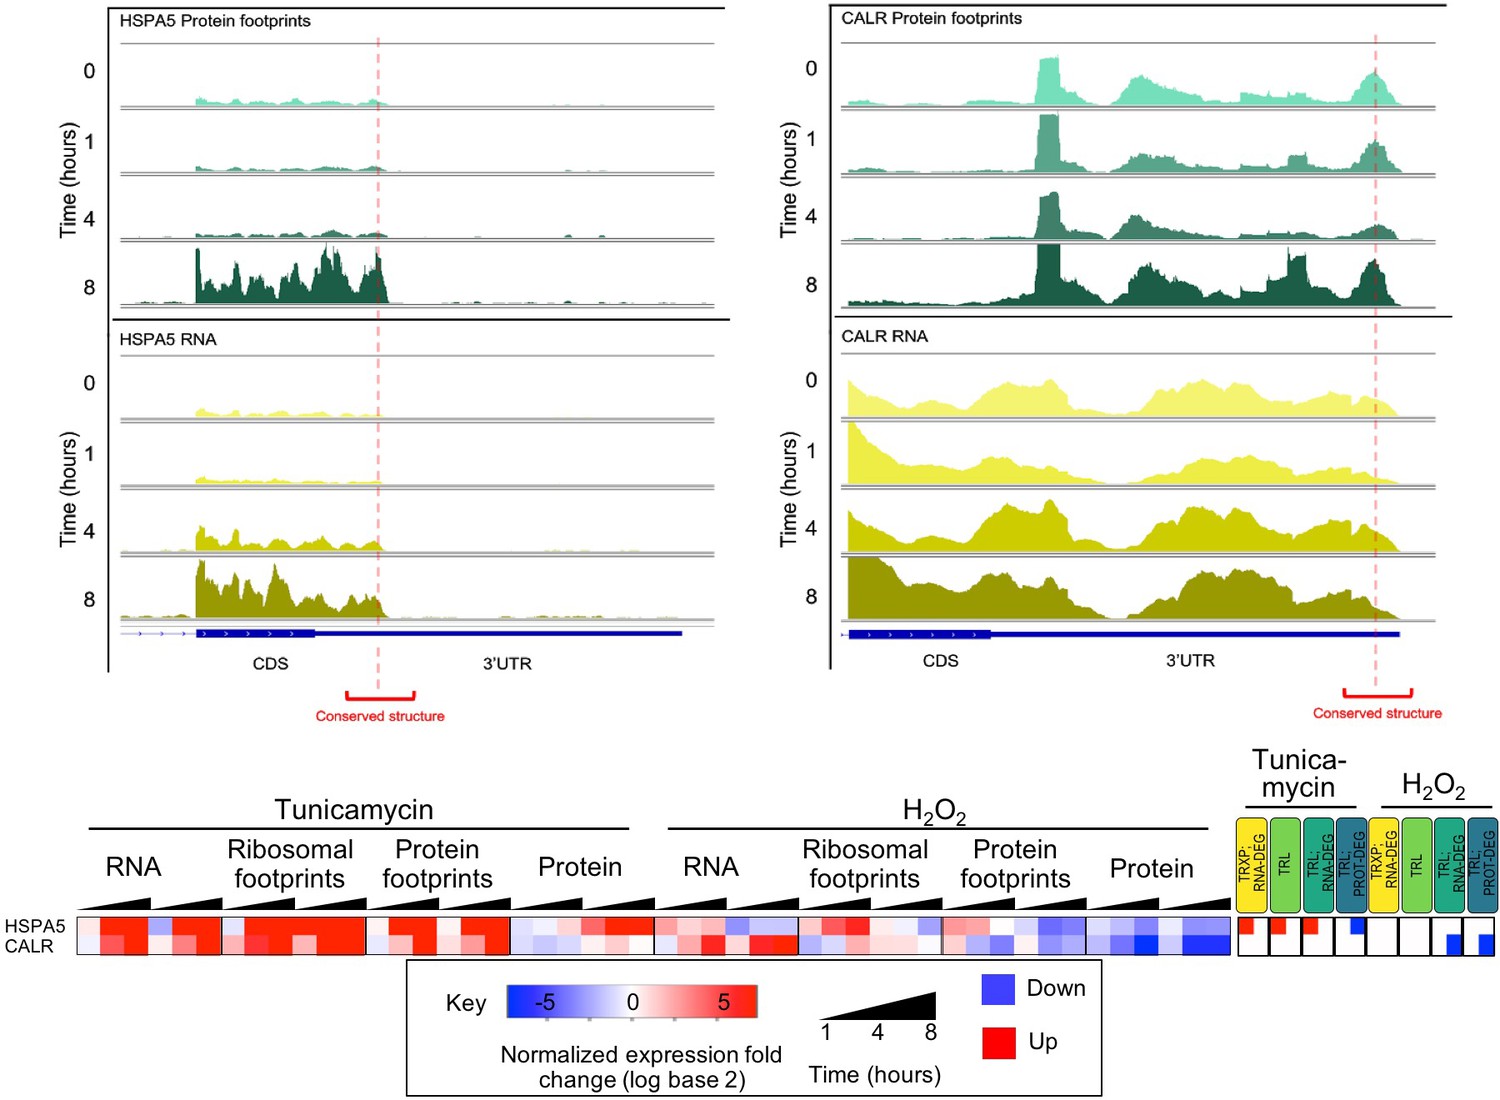
Predicted conserved secondary structures in the 3’UTR of ER stress response mRNAs (HSPA5 and CALR) show stress dependent protein occupancy.
Protein occupancy of conserved RNA secondary structures in the 3’UTR of ER stress response genes HSPA5 and CALR, (RNA - bottom, yellow; protein occupancy - top, teal). Expression changes for these two genes are provided in the heatmap below.
Tables
Table 1
Many genes are regulated at different levels during stress.
The table summarizes the numbers of genes with significant regulatory events as defined by the PECA analysis. The events are split into stress-specific and shared events as discussed in Figure 1. Some shared events show significant function enrichment (false discovery rate <0.01, NCBI DAVID function annotation tool). * - Overlap significant with p-value<0.01 (hypergeometric test) TRXP - transcription; TRL - translation; RNA-DEG - RNA degradation; PROT-DEG - protein degradation
| Data type (Layer 2) | Data type (Regulation) | Specific to ER stress (tunicamycin) | Specific to H2O2 treatment | Shared response | Function enrichment amongst shared genes | |
|---|---|---|---|---|---|---|
| RNA | Transcription; RNA degradation (TRXP; RNA-DEG) | Up | 889 | 481 | 123* | DNA repair |
| Down | 529 | 417 | 61* | - | ||
| Ribosome footprints | Translation (TRL) | Up | 706 | 204 | 40* | - |
| Down | 1,116 | 249 | 73* | Cytoplasmic chaperones | ||
| Protein footprints | Translation; RNA degradation (TRL; RNA-DEG) | Up | 171 | 274 | 16* | - |
| Down | 371 | 359 | 40* | Cell adhesion | ||
| Protein | Translation; protein degradation (TRL; PROT-DEG) | Up | 235 | 614 | 24 | - |
| Down | 358 | 492 | 32 | - | ||
Table 2
Conserved RNA secondary structures accumulate ribosome and non-ribosomal protein footprints.
The table summarizes the combined analysis of conserved RNA secondary structures as predicted by reference (Parker et al., 2011) and the expression data. As expected, ribosome footprints accumulate around secondary structures in the 5’UTR of the genes more than in the 3’UTR, while this is the opposite for protein footprints. Listed numbers show data for all structures across the extended dataset (Supplementary file 1–3); the number of unique genes with predicted structures are indicated in parentheses.
| 5’ Untranslated region | 3’ Untranslated region | |
|---|---|---|
| Conserved RNA secondary structures predicted in human genes | 760 (626) | 5,504 (2,789) |
| Conserved RNA secondary structures with RNA expression | 302 (277) | 2,697 (1,633) |
| Conserved RNA secondary structures with ribosome footprints | 190 (183) | 154 (151) |
| Conserved RNA secondary structures with protein footprints | 89 (81) | 1,808 (1,166) |
Key resources table
| Reagent type (species) or resource | Designation | Source or reference | Identifiers | Additional information |
|---|---|---|---|---|
| Cell line (H. sapiens) | CCL2 | ATCC Cat# CCL-2, RRID:CVCL_0030 | Authentication through Genetica Cell Line Testing | Authenticated by STR profiling |
| Antibody | Anti PERK | Cell Signaling technology | CST C33E10, RRID:AB_2095847 | (1:2000) |
| Antibody | anti-Phospho- PERK | Cell Signaling Technology | CST 3179S, RRID:AB_2095853 | (1:2000) |
| Antibody | anti-P-eIF2alpha | Cell Signaling Technology | CST 9721S, RRID:AB_330951 | (1:2000) |
| Antibody | Anti- β- Actin | Cell Signaling Technology | CST 4967S, RRID:AB_330288 | (1:5000) |
| Antibody | anti Oxidative Stress Markers | Abcam | Ab179843, RRID:AB_2716714 | (1:1000) |
| Other | CM-H2DCFDA | Thermo Fisher S cientific | C6827 | 10 μM |
| Sequence-based reagent | RPL19_ F 5'-ATGTATCACAGCCTGTACCTG-3'; RPL19_ R 5'- TTCTTGGTCTCTTCCTCCTTG-3' | PMID: 19137072 | ||
| Sequence-based reagent | sXBP1 forward 5′ TGCTGAGTCCGCAGCAGGTG-3′; reverse 5’-GCTGGCAGGCTCTGGGGAAG-3’) | PMID: 22038282 | ||
| Commercial assay or kit | Pierce Quantitative Colorimetric Peptide Assay | Thermo Fisher Scientific | 23275 | |
| Commercial assay or kit | SuperScript III First-Strand Synthesis System | Thermo Fisher Scientific | 18080051 | |
| Commercial assay or kit | KAPA SYBR FAST qPCR Master Mix (2X) Kit | Kapa Biosystem | KR0389 – v10.16 | |
| Commercial assay or kit | TMT 10plex | Sigma-Aldrich | 90110 | |
| Commercial assay or kit | Plasmotest | InvivoGen | rep-pt1 | |
| Commercial assay or kit | Universal Mycoplasma Detection Kit ATCC | ATCC | 30–1012K | |
| Chemical compound, drug | Hydrogen Peroxide | Sigma-Aldrich | 216763 | |
| Chemical compound, drug | Tunicamycin | Sigma-Aldrich | T7765 | |
| Chemical compound, drug | 2,2,2-Trifluoroethanol | Sigma-Aldrich | T8132 | |
| Chemical compound, drug | Iodoacetamide | Sigma-Aldrich | I6709 | |
| Software, algorithm | Maxquant (1.5.5.1) | PMID: 19029910 | RRID:SCR_014485 | |
| Software, algorithm | PECAplus | PMID: 24229407, 29263799 | https://github.com/PECAplus |
Additional files
-
Supplementary file 1
Input and output values for PECA analysis of RNA expression data.
Content: Worksheet 1: Description: Notes on columns in other worksheets; Worksheet 2: Total_RNA_Tunicamycin_Rep1: log2 transformed normalized count values for tunicamycin treated replicate 1; Worksheet 3: Total_RNA_Tunicamycin_Rep2: log2 transformed normalized count values for tunicamycin treated replicate 2; Worksheet 4: Total_RNA_Tunicamycin_Rep3: log2 transformed normalized count values for tunicamycin treated replicate 3; Worksheet 5: Total_RNA_H2O2_Rep1: log2 transformed normalized count values for hydrogen peroxide treated replicate 1; Worksheet 6: Total_RNA_H2O2_Rep2: log2 transformed normalized count values for hydrogen peroxide treated replicate 2; Worksheet 7: Total_RNA_H2O2_Rep3: log2 transformed normalized count values for hydrogen peroxide treated replicate 3
- https://doi.org/10.7554/eLife.39054.031
-
Supplementary file 2
Input and output values for PECA analysis of ribosome footprinting data.
Content: Worksheet 1: Description: Notes on columns in other worksheets; Worksheet 2: RPF_Tunicamycin_Rep1: log2 transformed normalized count values for tunicamycin treated replicate 1; Worksheet 3: RPF_Tunicamycin_Rep2: log2 transformed normalized count values for tunicamycin treated replicate 2; Worksheet 4: RPF_Tunicamycin_Rep3: log2 transformed normalized count values for tunicamycin treated replicate 3; Worksheet 5: RPF_H2O2_Rep1: log2 transformed normalized count values for hydrogen peroxide treated replicate 1; Worksheet 6: RPF_H2O2_Rep2: log2 transformed normalized count values for hydrogen peroxide treated replicate 2; Worksheet 7: RPF_H2O2_Rep3: log2 transformed normalized count values for hydrogen peroxide treated replicate 3
- https://doi.org/10.7554/eLife.39054.032
-
Supplementary file 3
Input and output values for PECA analysis of protein occupancy profiling data.
Content: Worksheet 1: Description: Notes on columns in other worksheets; Worksheet 2: POP_Tunicamycin_Rep1: log2 transformed normalized count values for tunicamycin treated replicate 1; Worksheet 3: POP_Tunicamycin_Rep2: log2 transformed normalized count values for tunicamycin treated replicate 2; Worksheet 4: POP_Tunicamycin_Rep3: log2 transformed normalized count values for tunicamycin treated replicate 3; Worksheet 5: POP_H2O2_Rep1: log2 transformed normalized count values for hydrogen peroxide treated replicate 1; Worksheet 6: POP_H2O2_Rep2: log2 transformed normalized count values for hydrogen peroxide treated replicate 2; Worksheet 7: POP_H2O2_Rep3: log2 transformed normalized count values for hydrogen peroxide treated replicate 3
- https://doi.org/10.7554/eLife.39054.033
-
Supplementary file 4
Input and output values for PECA analysis of protein expression data.
Content: Worksheet 1: Description: Notes on columns in other worksheets; Worksheet 2: Protein_Tunicamycin_Rep1: log2 transformed normalized intensity values for tunicamycin treated replicate 1; Worksheet 3: Protein_Tunicamycin_Rep3: log2 transformed normalized intensity values for tunicamycin treated replicate 3; Worksheet 4: Protein_H2O2_Rep1: log2 transformed normalized intensity values for hydrogen peroxide treated replicate 1; Worksheet 5: Protein_H2O2_Rep3: log2 transformed normalized intensity values for hydrogen peroxide treated replicate 3; Worksheet 6: All_identified_Protein_Groups: Maxquant output with detailed information of all the protein groups identified; Worksheet 7: Identified_Protein_Groups_w_rev: Maxquant output with detailed information of all the protein groups identified along with reverse peptide information
- https://doi.org/10.7554/eLife.39054.034
-
Supplementary file 5
Integrated, post-processed core data set (7,011 genes).
Content: Worksheet 1: Description: Notes on columns in other worksheets; Worksheet 2: Processed_core_data: core data set (Z-score); Worksheet 3: Cluster_Analysis_Canonical_Path: list of enriched pathways with P-values corresponding
- https://doi.org/10.7554/eLife.39054.035
-
Supplementary file 6
Extended data for aminoacyl-tRNA synthetase (AAtRS) analysis.
Content: Worksheet 1: Cytosolic_AAtRS: Raw count values for cytosolic AAtRS related to Figure 6; Worksheet 2: Abbreviations: Details of the abbreviations used in Worksheet 1
- https://doi.org/10.7554/eLife.39054.036
-
Supplementary file 7
Extended RNA secondary structures data used in Figure 7.
Content: Worksheet 1: Description: Notes on columns in other worksheets; Worksheet 2: 5’UTR_Structure_RibosomeBound: Includes values for mid point position of predicted structure and Base mean (mean normalized count values) of ribosome footprints; Worksheet 3: 3’UTR_Structure_ProteinBound: Includes values for mid point position of predicted structure and Base mean (mean normalized count values) of protein footprints on RNA
- https://doi.org/10.7554/eLife.39054.037
-
Transparent reporting form
- https://doi.org/10.7554/eLife.39054.038
Download links
A two-part list of links to download the article, or parts of the article, in various formats.
Downloads (link to download the article as PDF)
Open citations (links to open the citations from this article in various online reference manager services)
Cite this article (links to download the citations from this article in formats compatible with various reference manager tools)
New insights into the cellular temporal response to proteostatic stress
eLife 7:e39054.
https://doi.org/10.7554/eLife.39054


