Rif1 inhibits replication fork progression and controls DNA copy number in Drosophila
- Vanderbilt University, United States
- Vanderbilt University School of Medicine, United States
Figures
Figure 1 with 2 supplements
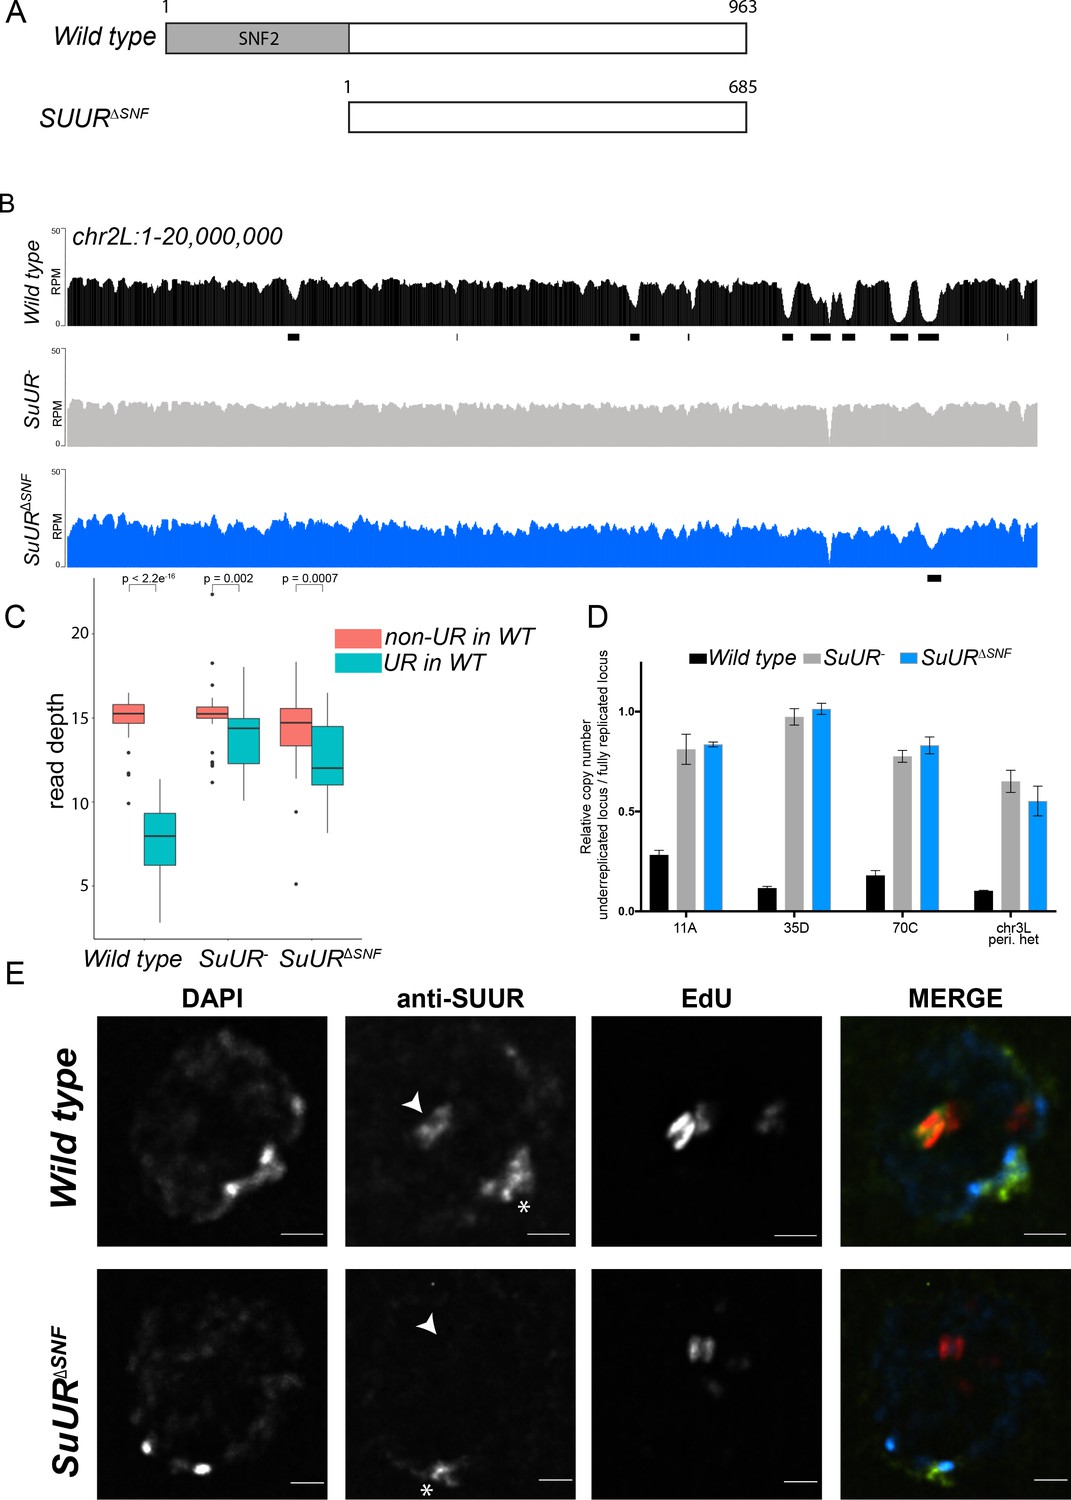
The SNF2 domain is essential for SUUR function and replication fork localization.
(A) Schematic representation of the SUUR and SUURΔSNF proteins. (B) Illumina-based copy number profiles (Reads Per Million; RPM) of chr2L 1 – 20,000,000 from larval salivary glands. Black bars below each profile represent underreplicated regions identified by CNVnator. (C) Average read depth in regions of euchromatic underreplication domains called in wild-type salivary glands vs. the fully replicated regions of the genome. A Welch Two Sample t-test was used to determine p values. (D) Quantitative droplet-digital PCR (ddPCR) copy number assay for multiple underreplicated regions. Each bar is the average enrichment relative to a fully replicated control region for three biological replicates. Error bars are the SEM. (E) Localization of SUUR in wild-type and SuURΔSNF mutant follicle cells. A single representative stage 13 follicle cell nucleus is shown. Arrowheads indicate sites of amplification. Asterisk marks the chromocenter (heterochromatin). Scale bars are 2 μm. DAPI = blue, SUUR = green, EdU = red. The following source data, figure supplements and supplementary files are available for Figure 1: Figure 1—figure supplement 1; Figure 1—figure supplement 2; Supplementary file 1 - Underreplicated regions called by CNVnator; Figure 1—source data 1 – Raw data for 1D; Figure 1—figure supplements 2—source data 1 image intensity data.
-
Figure 1—source data 1
ddPCR data for Figure 1D.
- https://doi.org/10.7554/eLife.39140.006
Figure 1—figure supplement 1
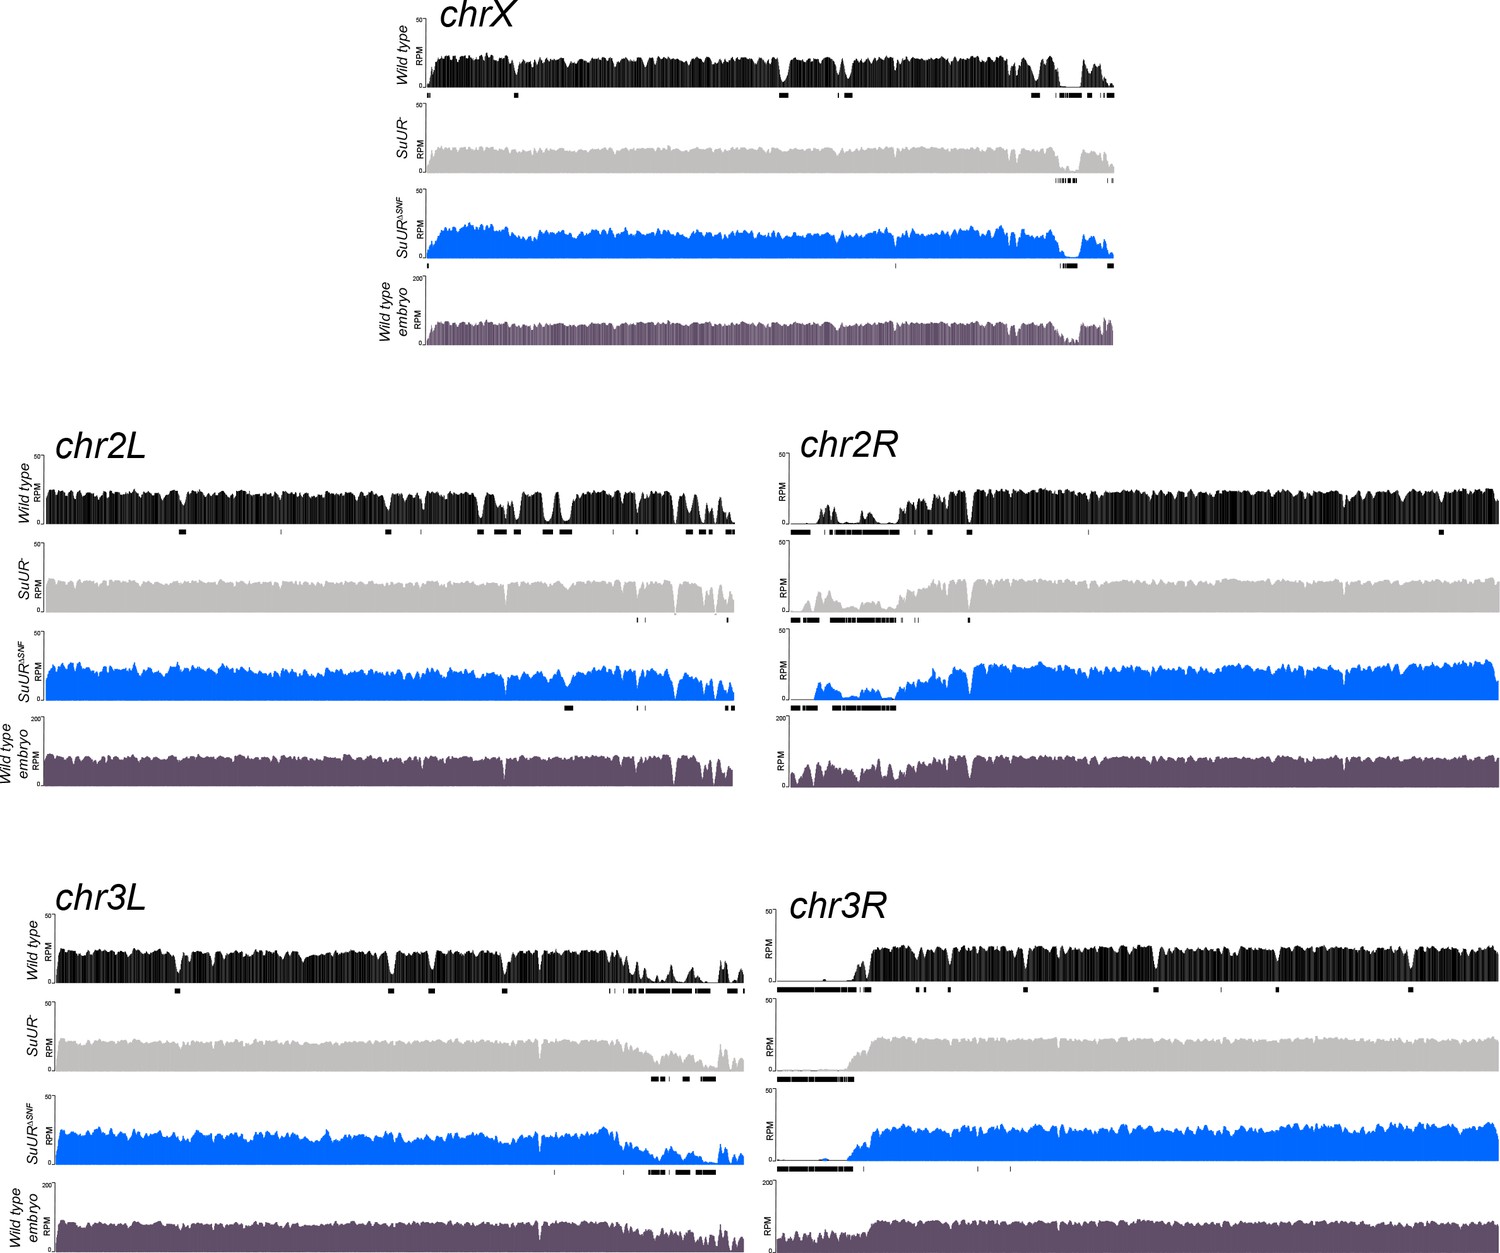
Genome-wide copy number profile of the SuURΔSNF mutant.
Illumina-based copy number profiles of all chromosome arms except the fourth for larval salivary glands of the indicated genotypes and wild type 0 – 2 hr embryos in which DNA is fully replicated. Black bars below each profile represent called underreplicated regions.
Figure 1—figure supplement 2
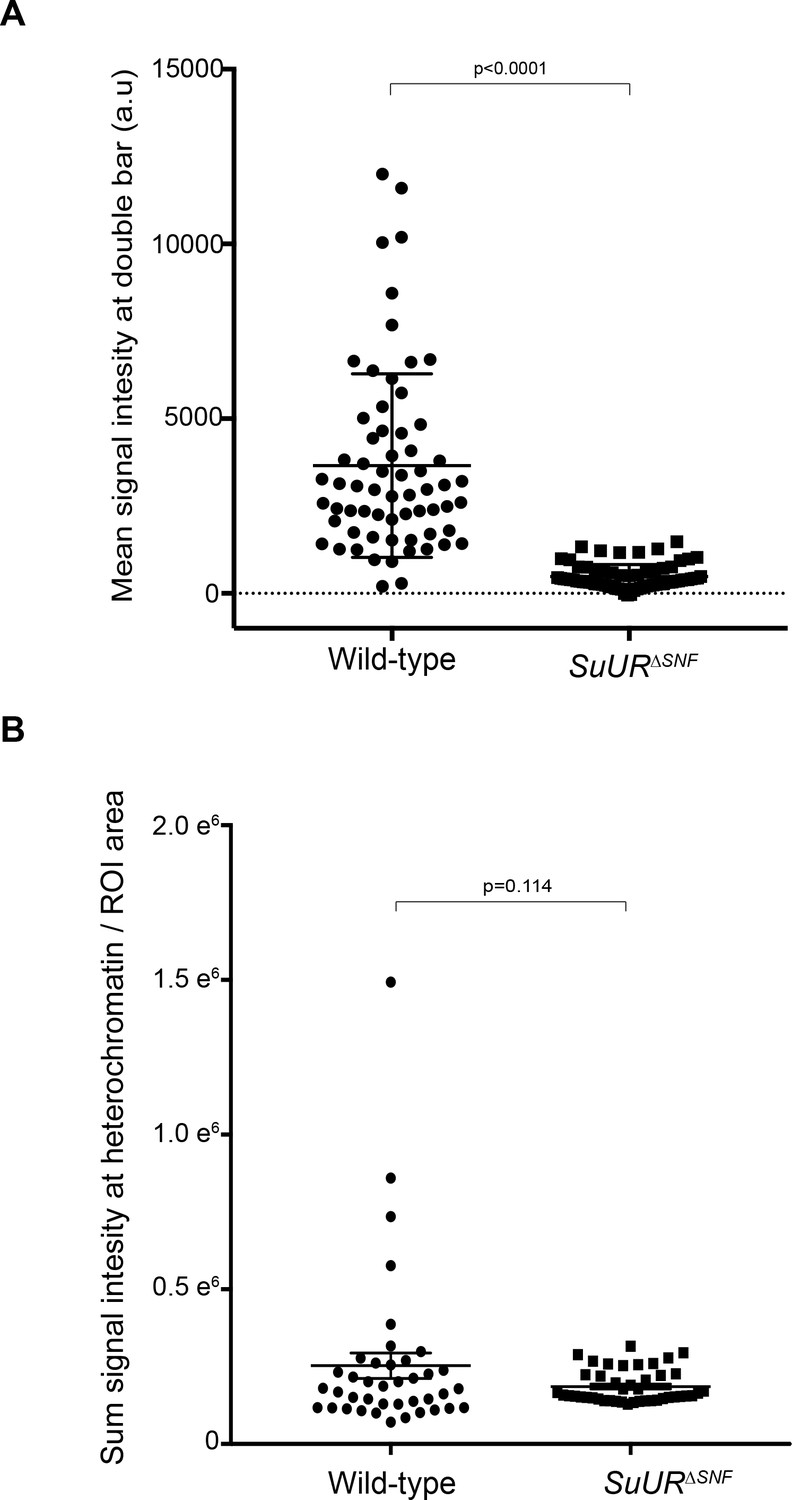
Quantification of SUUR and SUURΔSNF signal intensities at replication forks and heterochromatin.
(A) SUUR and SUURΔSNF mean signal intensities, normalized for background levels, at double bar structures from stage 12 egg chambers. Results are from two biological replicates. A two-tailed Welch’s t test was used to determine significance. n = 64 for wild-type and n = 69 for the SuURΔSNF mutant. (B) SUUR and SUURΔSNF signal intensity, normalized to area, at heterochromatin in stage 12 egg chambers. Results are from two biological replicates. A two-tailed Welch’s t test was used to determine significance. n = 40 for wild-type and n = 44 for the SuURΔSNF mutant. No outliers were excluded.
-
Figure 1—figure supplement 2—source data 1
SUUR signal intensity at double bar structures and heterochromatin - raw data.
- https://doi.org/10.7554/eLife.39140.005
Figure 2 with 2 supplements
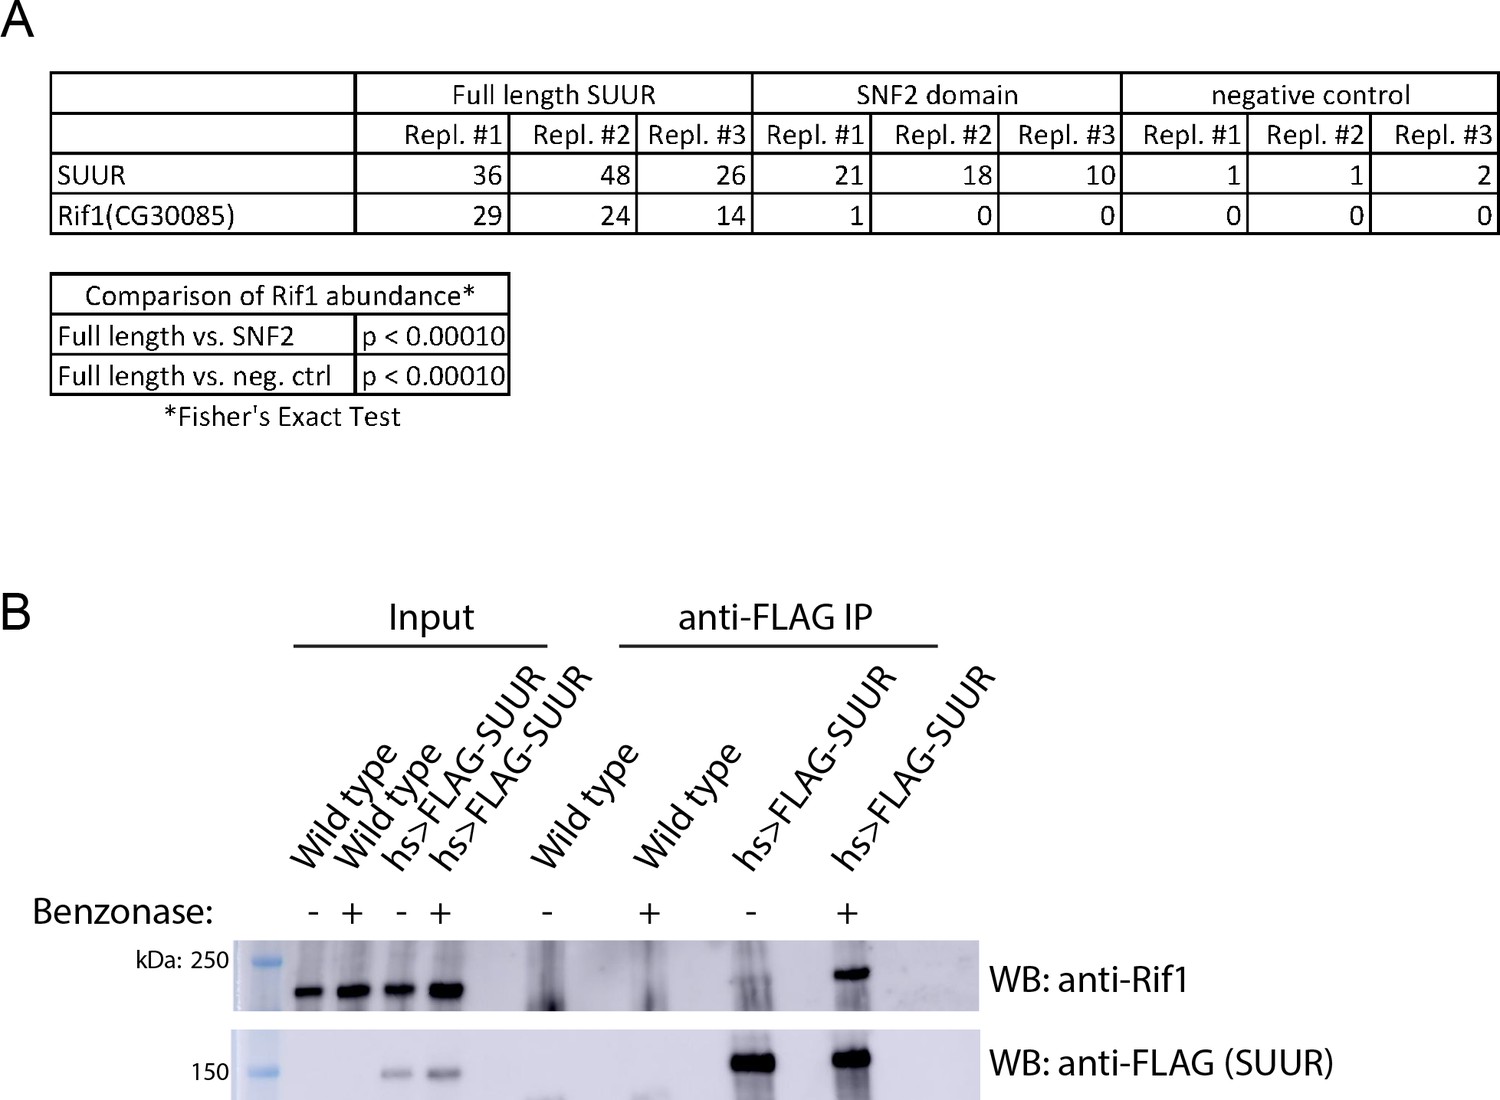
SUUR associates with Rif1.
(A) Total spectrum counts of FLAG-SUUR, FLAG-SNF2 and Oregon R (no FLAG control) for three independent IP-mass spectrometry experiments (biological replicates). A Fisher’s Exact test of spectrum counts was used to determine significance. (B) Immunoprecipitation of FLAG-SUUR and no FLAG control (wild-type) from 0 to 24 hr embryos extracted with NP40 lysis buffer with or without Benzonase treatment. Membranes were probed with anti-Rif1 and anti-FLAG antibodies to monitor Rif1 and SUUR, respectively. The following source data and figure supplement are available for Figure 2: Figure 2—figure supplement 1; Figure 2—figure supplement 2; Figure 2—source data 1 – SUUR mass spectrometry total spectrum counts; Figure 2—figure supplements 2—source data 1 – embryo hatch rata data.
-
Figure 2—source data 1
Results of SUUR IP-mass spec screen.
- https://doi.org/10.7554/eLife.39140.011
Figure 2—figure supplement 1

Western blot analysis of heat-shock inducible SUUR constructs.
(A) Full Western blots of images used in Figure 2B with total protein loading control. (B) Western blot analysis of FLAG-SUUR and FLAG-SNF2 heat-shocked 0 – 24 hr embryos with a total protein loading control.
Figure 2—figure supplement 2
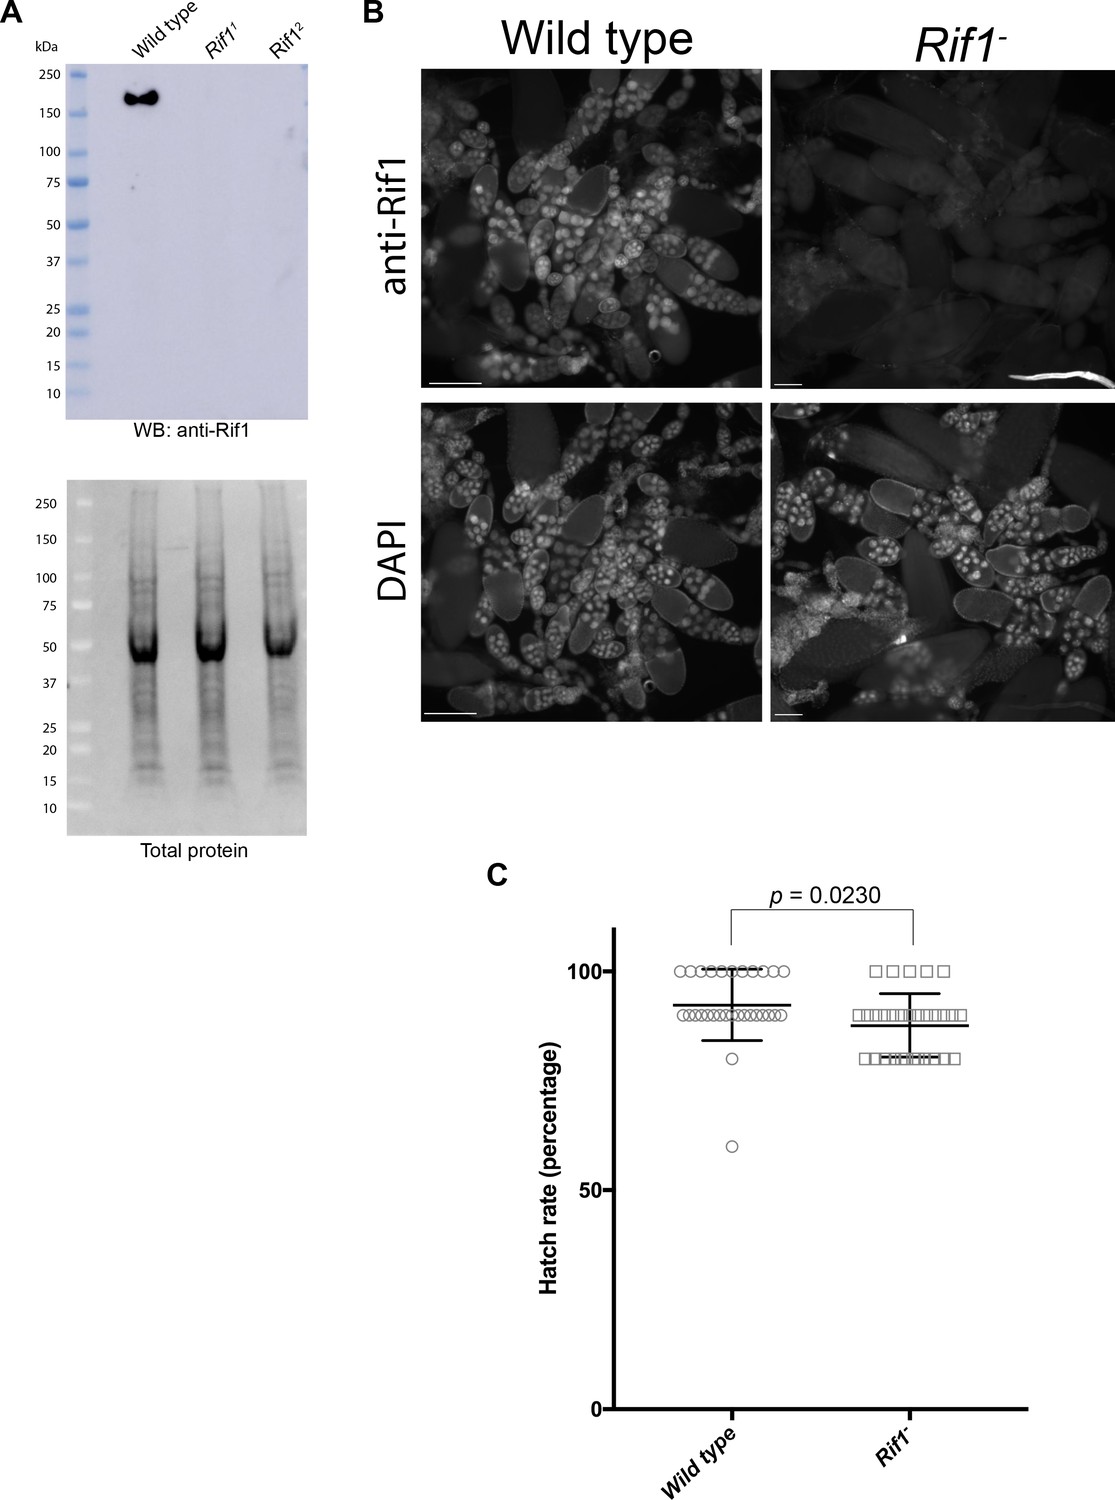
Verification of Rif1 mutants and validation of anti-Rif1 antibody.
(A) Western blot analysis of ovary extracts prepared from the indicated genotypes. Serum produced in guinea pigs was used at 1:1000 dilution. (B) Immunofluorescence of ovaries using affinity purified anti-Rif1 antibody produced in guinea pigs. Exposure times were equal between the two genotypes. (C) Embryo hatch rate assay comparing embryos laid by wild-type or Rif11/Rif12 mutant mothers. n = 300 embryos per genotype. Each data point represents the hatch rate of a group of 10 embryos. An unpaired student t-test was used to generate the p value.
-
Figure 2—figure supplement 2—source data 1
Raw data for hatch rate assay.
- https://doi.org/10.7554/eLife.39140.010
Figure 3 with 3 supplements
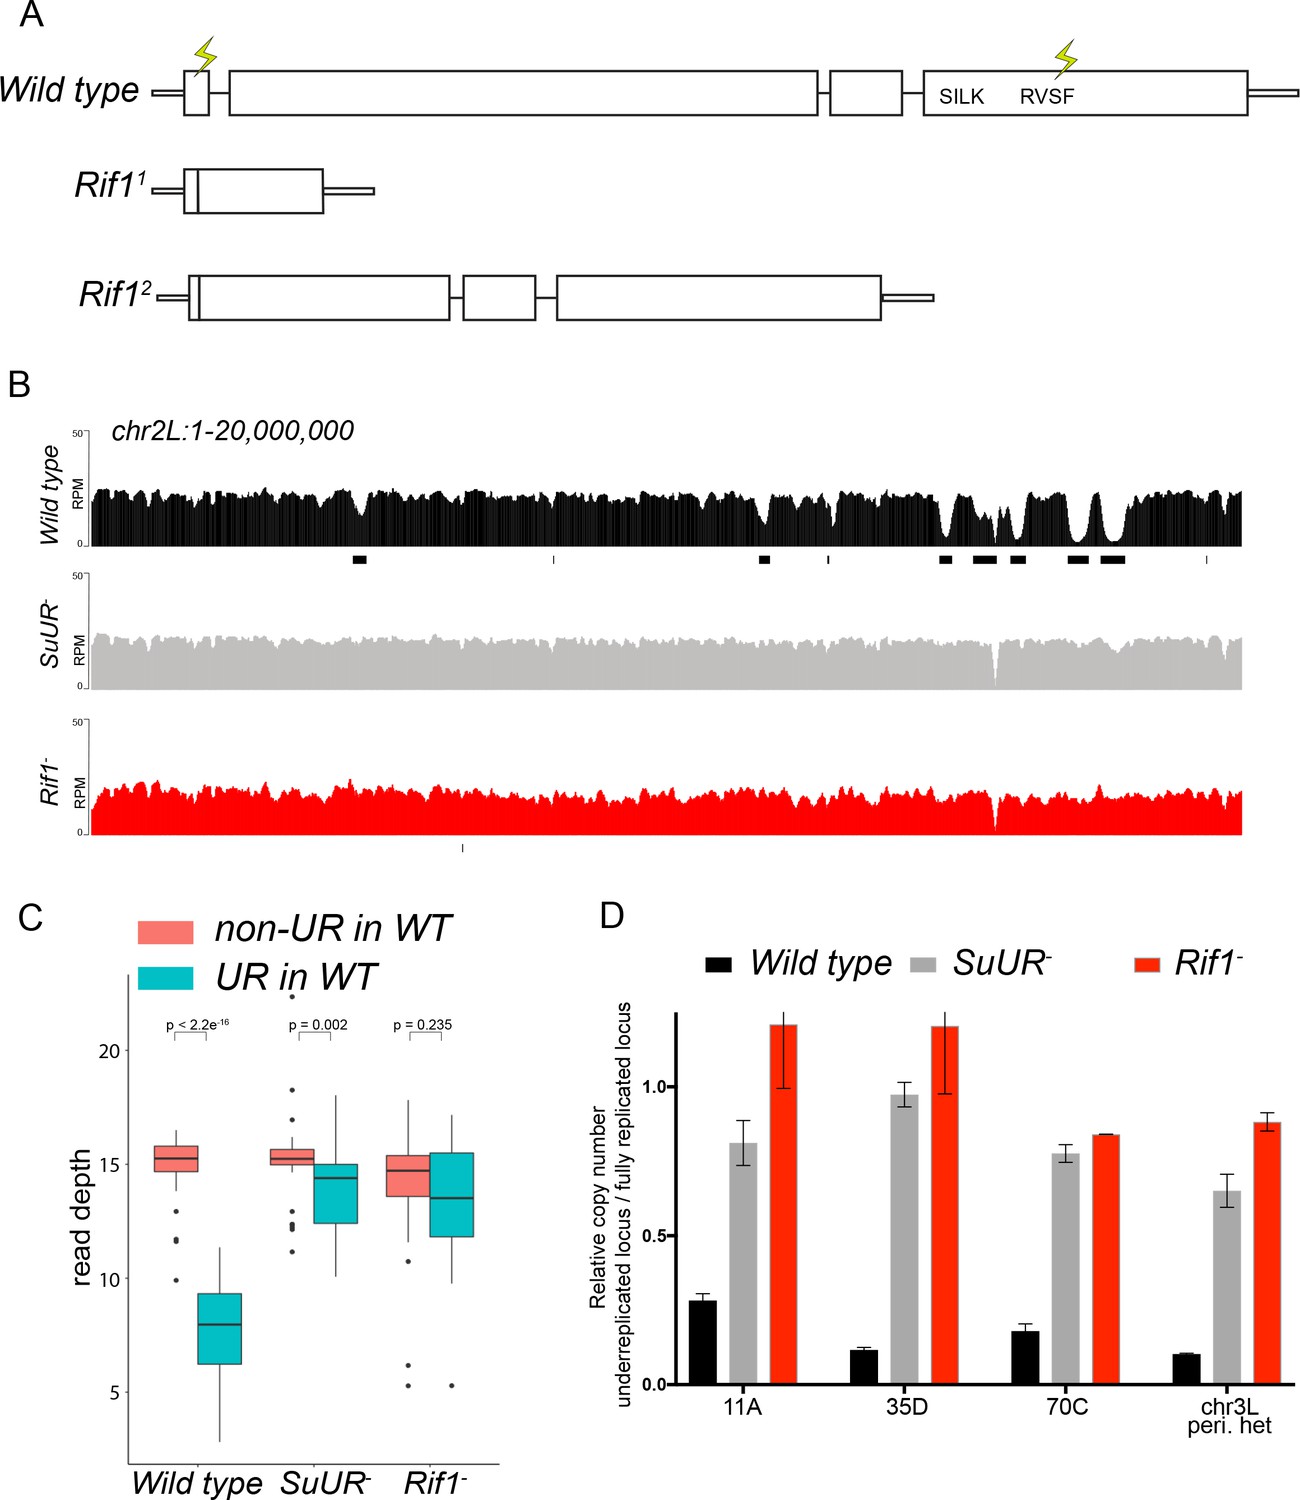
Rif1 is required for underreplication.
(A) Schematic representation of the Rif1 gene and CRISPR-induced Rif1 mutants. Lightning bolts represent the 5’ and 3’ gRNA positions. (B) Illumina-based copy number profiles of the chr2L from larval salivary glands. Black bars below each profile represent underreplicated regions identified by CNVnator. The wild-type and SuUR profiles are the same as in Figure 1b. (C) Average read depth in regions of euchromatic underreplication domains called in wild-type salivary glands vs. the fully replicated regions of the genome. A Welch Two Sample t-test was used to determine p values. (D) Quantitative droplet-digital PCR (ddPCR) copy number assay for multiple underreplicated regions. Each bar is the average enrichment relative to a fully replicated control region for three biological replicates. Error bars are the SEM. The following source data and figure supplement are available for Figure 3: Figure 3—figure supplement 1; Figure 3—figure supplement 2; Figure 3—figure supplement 2; Figure 3—source data 1; Figure 3—figure supplement 2—source data 1 - Raw data for 2B.
-
Figure 3—source data 1
ddPCR data for Figure 3D.
- https://doi.org/10.7554/eLife.39140.017
Figure 3—figure supplement 1

Genome-wide copy number profile of the Rif1 mutant.
(A) Illumina-based copy number profiles of all chromosome arms except the fourth for larval salivary glands of the indicated genotypes. Black bars below each profile represent called underreplicated regions. (B) Box plot represents read depth in 10 kb bins in the pericentric chromatin regions for chr 2L, 2R, 3L and 3R. A Welch Two Sample t-test was used to compare the same regions between SuUR and Rif1 mutants. The same wild-type, SuUR and 0 – 2 hr embryo plots as in Figure 1—figure supplement 1.
Figure 3—figure supplement 2
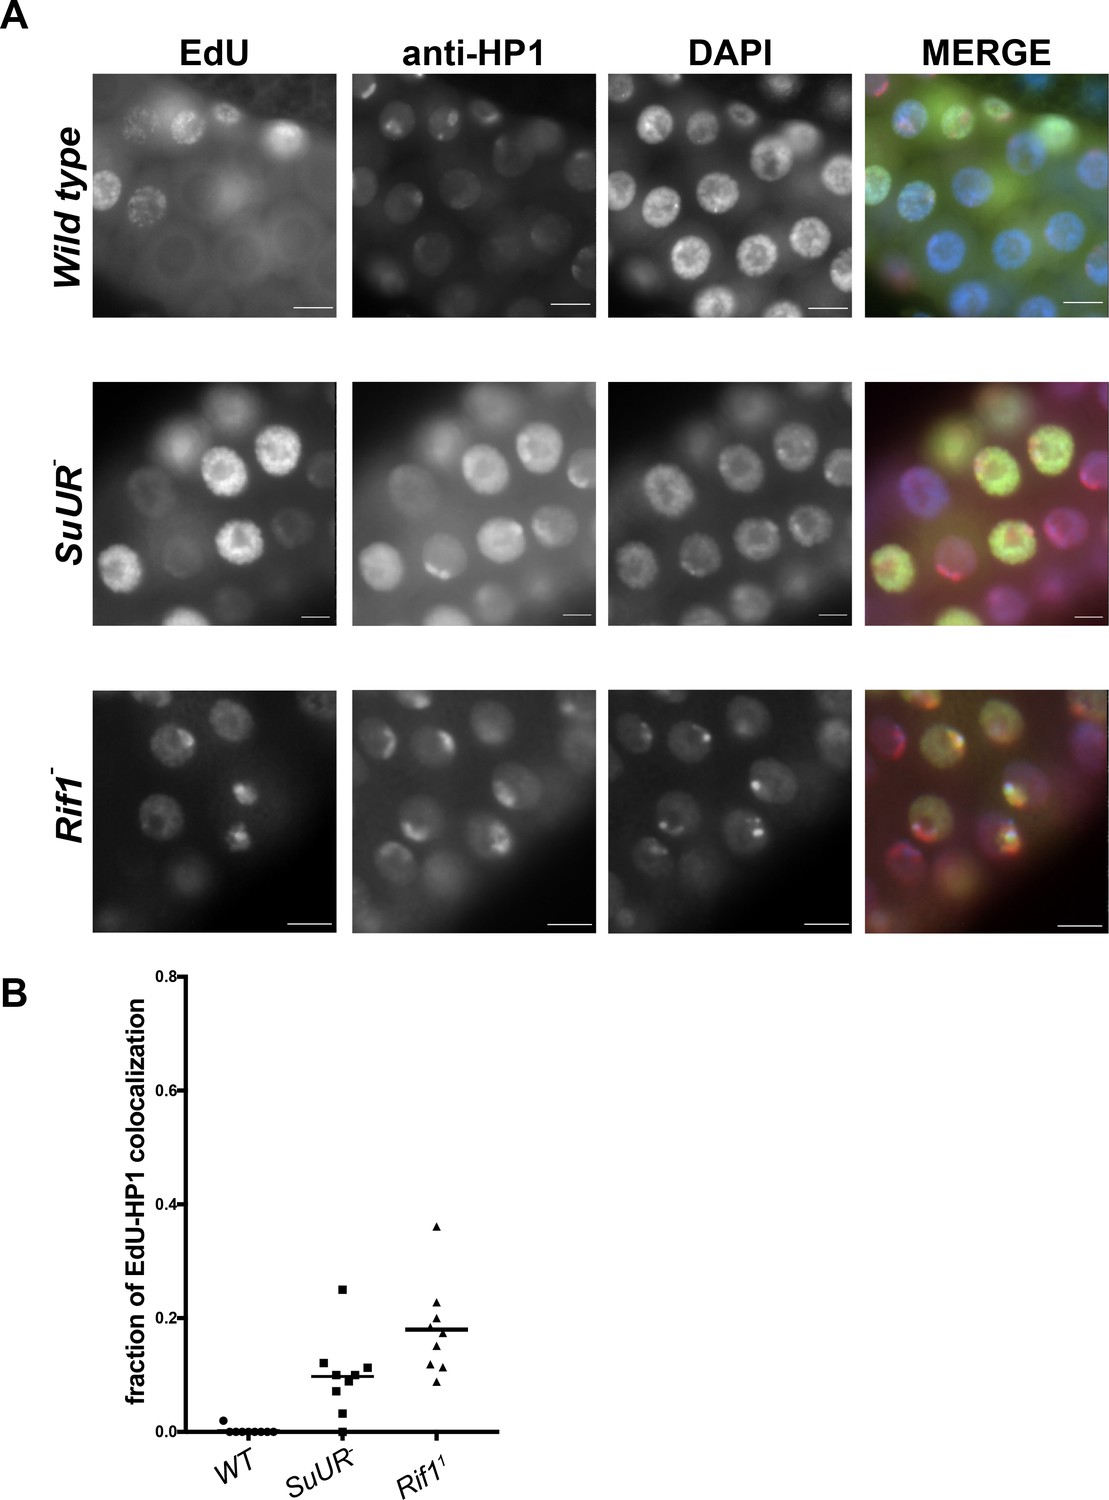
Rif1 mutant salivary gland cells display a pattern of late replication.
(A) Representative immunofluorescent images of 3rd instar salivary glands pulse labeled with EdU and stained with anti-HP1 to mark heterochromatin. Wild-type cells fail to incorporate EdU into regions of heterochromatin due to underreplication, whereas EdU can be detected in the heterochromatic regions of SuUR and Rif1 mutants. DAPI = blue, EdU = green, HP1 = red (B) Quantitation of three biological replicates. Out of the total number of EdU-positive cells, the fraction incorporating EdU predominantly in the heterochromatic (HP1) regions were measured. More than 200 EdU-positive cells were scored for each genotype.
-
Figure 3—figure supplement 2—source data 1
Raw data for Figure 3—figure supplement 2B.
- https://doi.org/10.7554/eLife.39140.015
Figure 3—figure supplement 3
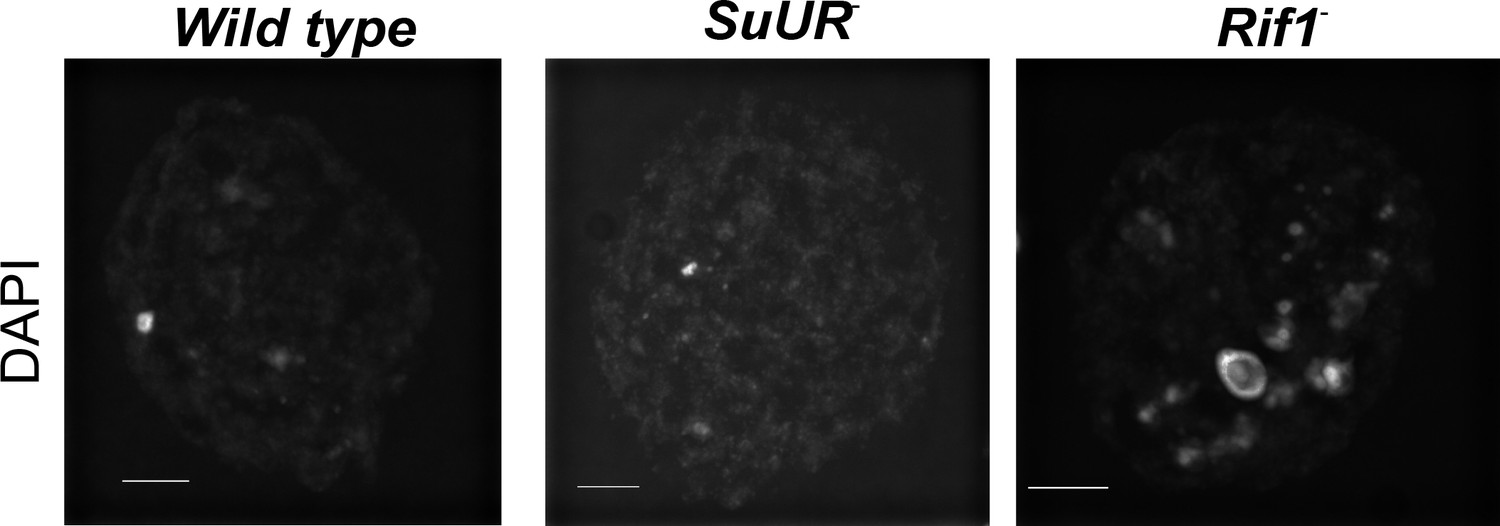
Rif1 mutant endo cycling cells have enlarged chromocenters.
Representative images of single nurse cell nuclei from stage 10 egg chambers. Egg chambers were stained with DAPI. Scale bar is 10 μm. Exposure times and scaling are equal in all images.
Figure 4 with 1 supplement
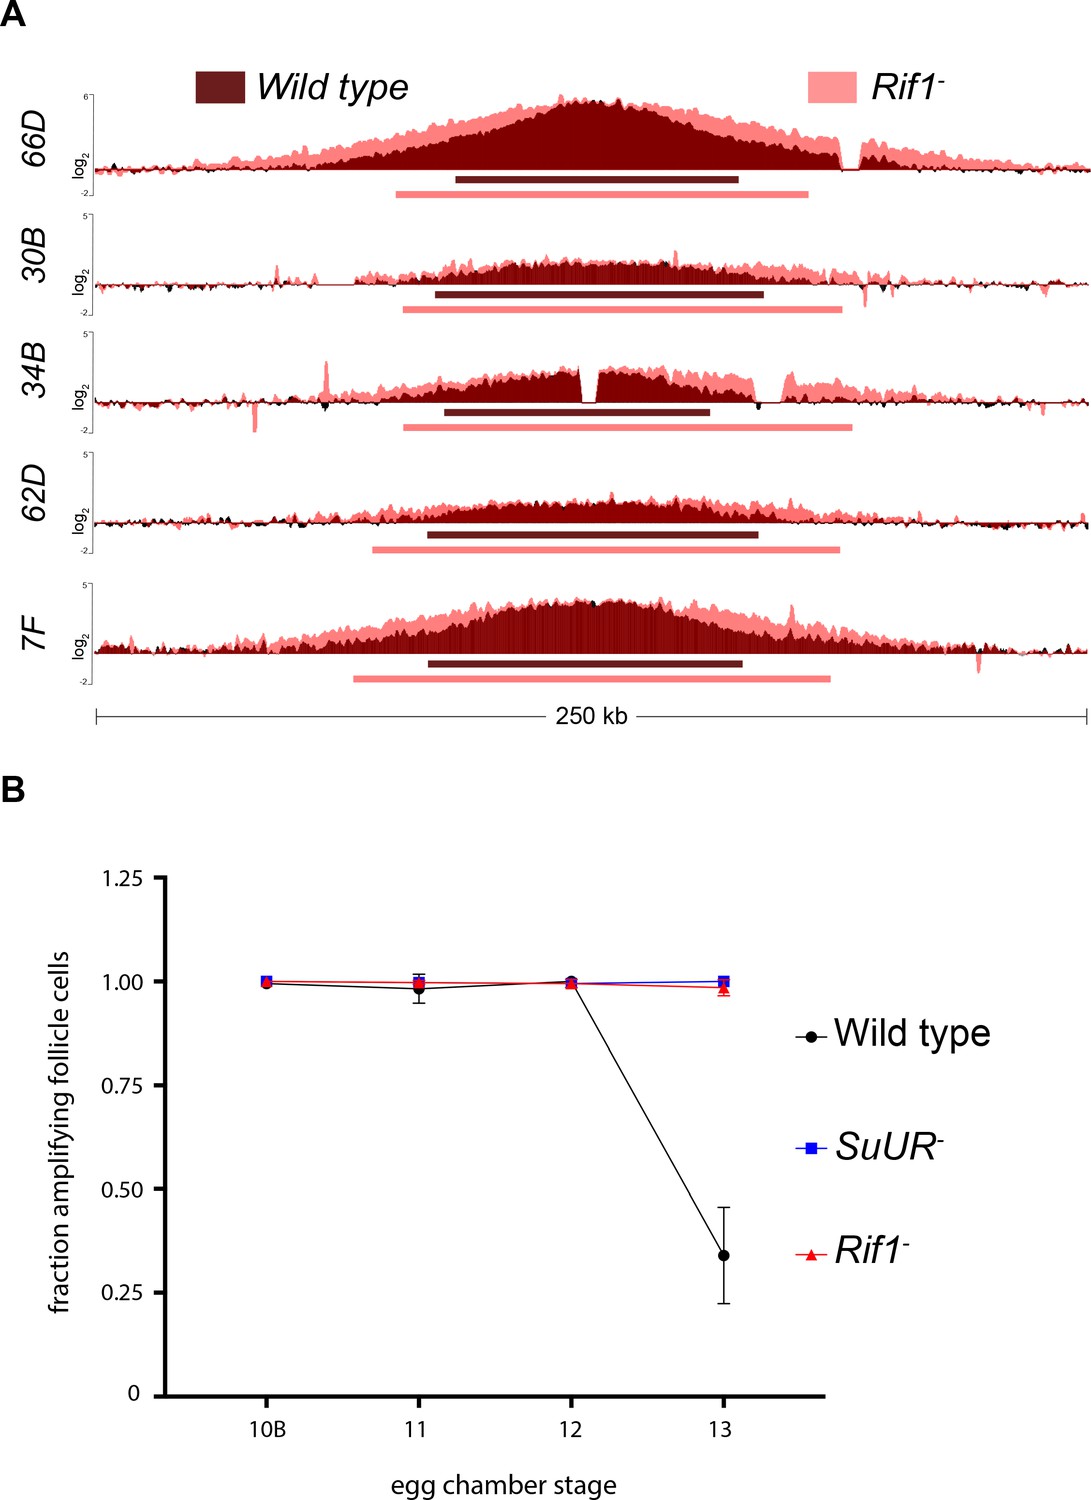
Rif1 regulates replication fork progression.
(A) Illumina-based copy number profile of sites of follicle cell gene amplification. DNA was extracted from wild type and Rif1 mutant stage 13 egg chambers and compared to DNA extracted from 0 to 2 hr embryos. The resulting graphs are the log2-transformed ratios of egg chamber relative to embryonic DNA. Bars below the graphs represent the distance between the half-maximum copy number on each side of the replication origin. (B) Fraction of cells that display visible amplification foci in each stage of gene amplification. Average of two biological replicates in which two egg chambers from each stage were used per biological replicate. 100 – 300 follicle cells were counted per genotype. Error bars are the SEM. The following source data, supplementary file and figure supplement are available for Figure 4: Figure 4—figure supplement 1; Supplementary file 2 – Table of half-max values for all amplicons; Figure 4—source data 1 – raw data for 4B; Figure 4—figure supplements 1—source data 1-combined data for egg chamber distribution of five biological replicates.
-
Figure 4—source data 1
Data for Figure 4B.
- https://doi.org/10.7554/eLife.39140.021
Figure 4—figure supplement 1
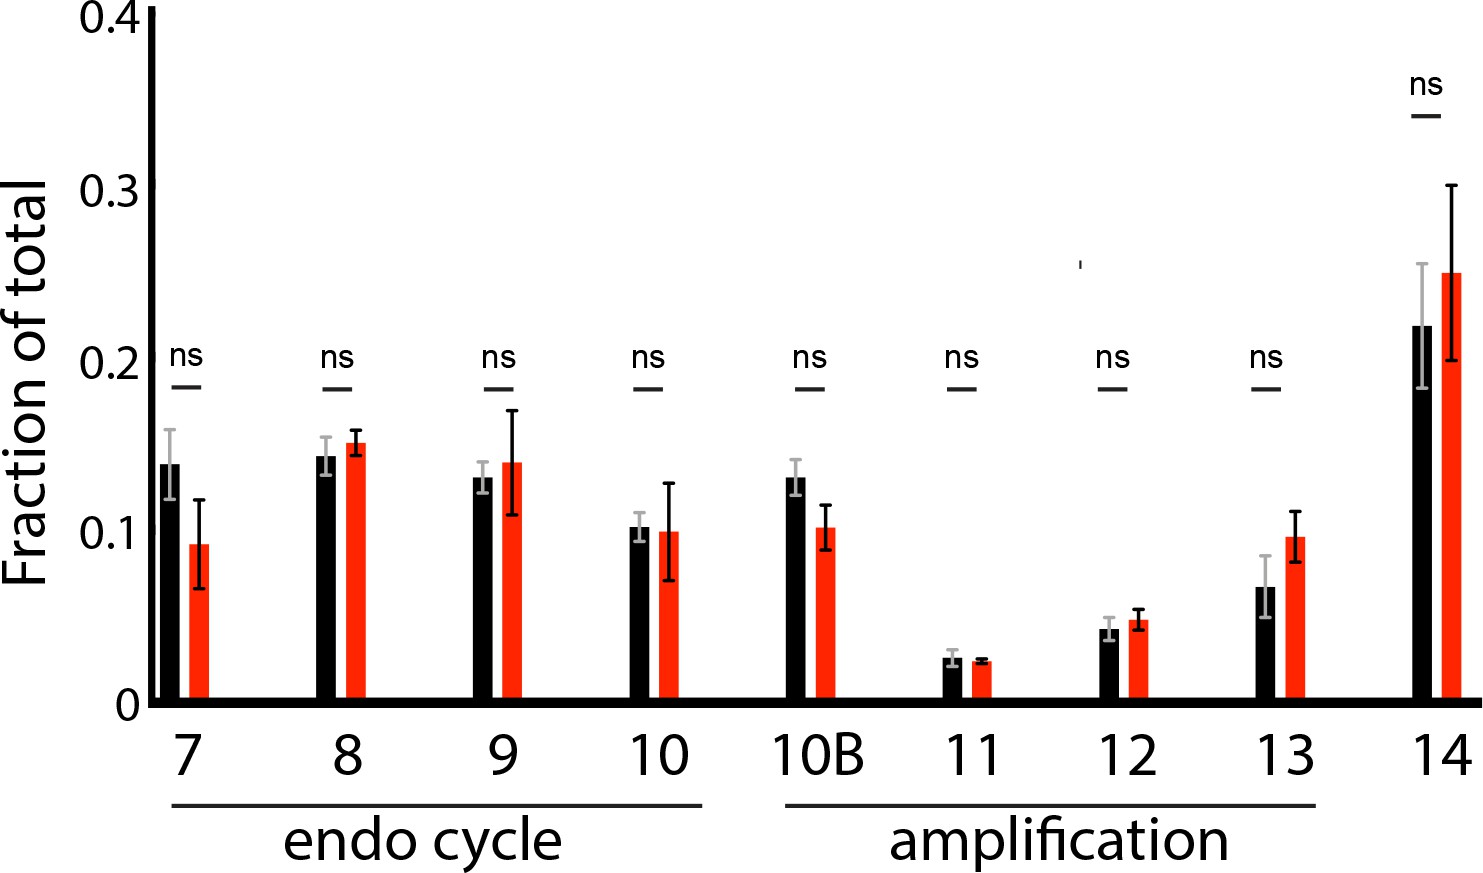
The developmental window of gene amplification is not affected by loss of Rif1 function.
Egg chamber distribution from wild-type and Rif1 mutant ovaries fattened for 2 days on wet yeast. Bars represent the fraction of a given egg chamber stage relative to the total population of counted egg chambers (stages 7 – 17) for five biological replicates. Error bars represent the SEM. A student t test was used to compare the fraction of staged egg chambers for each biological replicate between wild-type and the Rif1 mutant. There was no significant difference for any stage when comparing wild-type and Rif1 mutant ovaries p=0.12 stage 7; p=0.79 stage 8; p=0.77 stage 9; p=0.92 stage 10; p=0.33 stage 10B; p=0.94 stage 11; p=0.86 stage 12; p=0.33 stage 13 and p=0.30 stage 14). Total number of egg chambers counted: 800 for wild-type and 800 for the Rif1 mutant. No outliers were excluded.
-
Figure 4—figure supplement 1—source data 1
Raw data for egg chamber distribution assay.
- https://doi.org/10.7554/eLife.39140.020
Figure 5 with 1 supplement

Rif1 acts downstream of SUUR.
Localization of replication forks (EdU) and SUUR in a wild-type and Rif1 mutant follicle cell nuclei. A single representative stage 13 follicle cell nucleus is shown. Scale bars are 2 μm. Arrowheads indicate sites of amplification. Asterisks marks the chromocenter (heterochromatin). DAPI = blue, SUUR = green, EdU = red. The following source data and figure supplement are available for Figure 5: Figure 5—figure supplement 1; Figure 5—figure supplements 1—source data 1–intensity data.
Figure 5—figure supplement 1
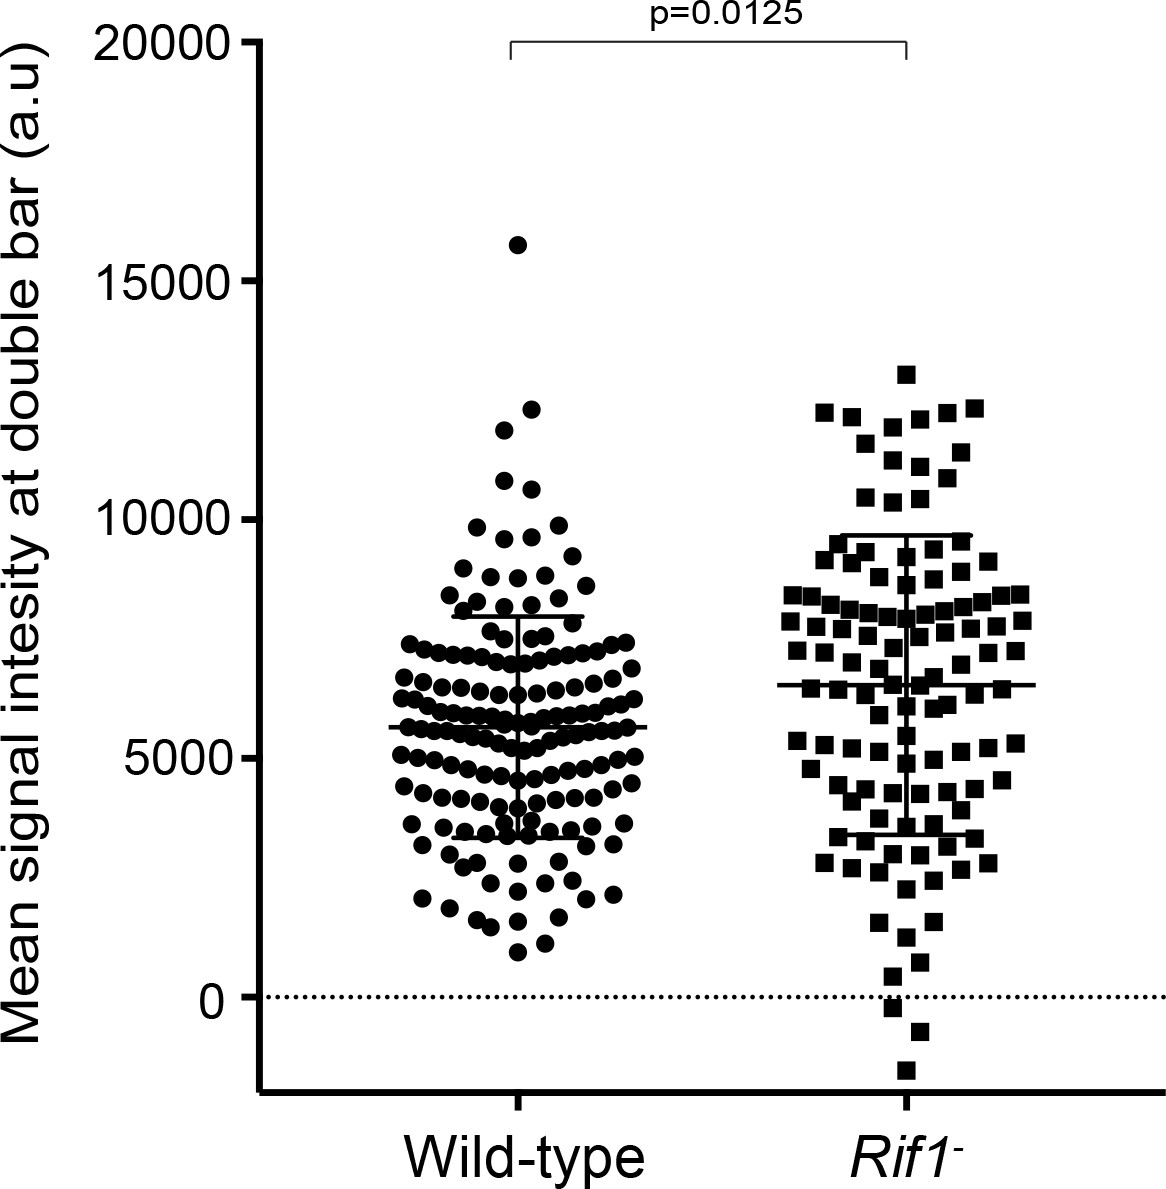
Quantification of SUUR signal intensity at replication forks in the presence and absence of Rif1.
SUUR mean signal intensity at double bar structures, normalized for background levels, from stage 12 egg chambers. Results are from two biological replicates. A two-tailed Welch’s t test was used to determine significance. n = 156 for wild-type and n = 113 for the Rif1 mutant. No outliers were excluded.
-
Figure 5—figure supplement 1—source data 1
SUUR signal intensity at double bar structures - raw data.
- https://doi.org/10.7554/eLife.39140.024
Figure 6 with 2 supplements
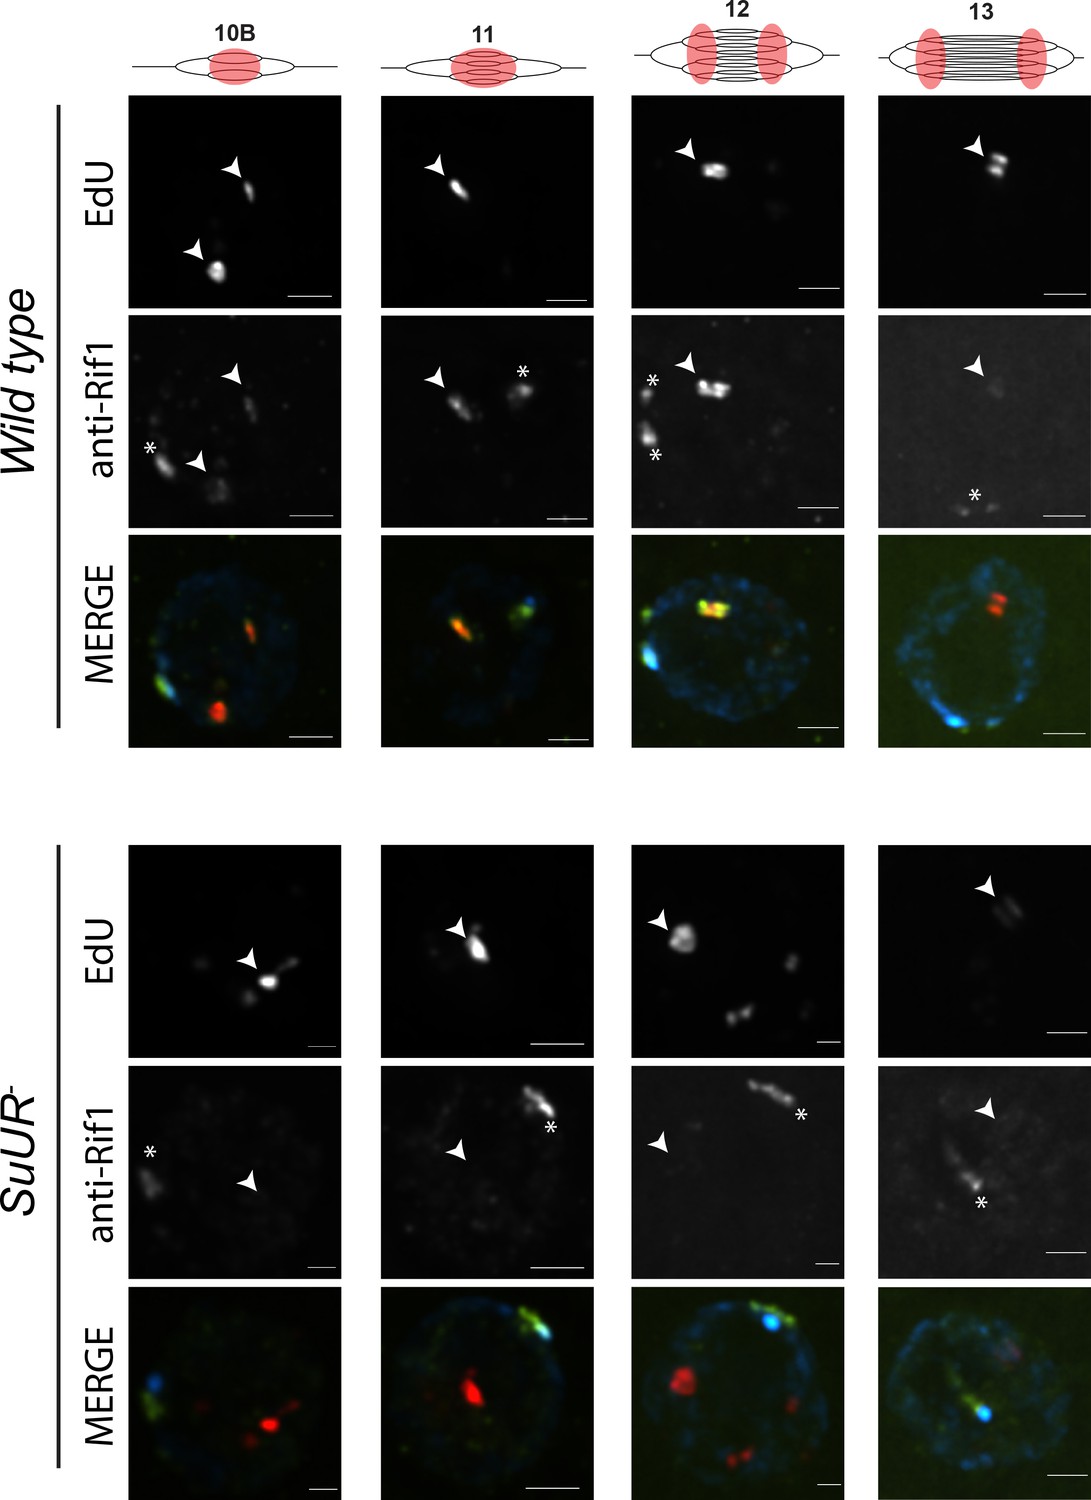
SUUR is necessary to retain Rif1 at replication forks.
Localization of active replication forks (EdU) and Rif1 in a wild-type and SuUR mutant follicle cell nuclei. Single representative follicle cell nuclei are shown for each stage. Scale bars are 2 μm. Arrowheads indicate sites of amplification. Asterisk marks the chromocenter (heterochromatin). The following source data and figure supplement are available for Figure 6: Figure 6—figure supplement 1; Figure 6—figure supplement 2; Figure 6—figure supplements 1—source data 1–intensity data; Figure 6—figure supplement 2 – raw data for 2B.
Figure 6—figure supplement 1
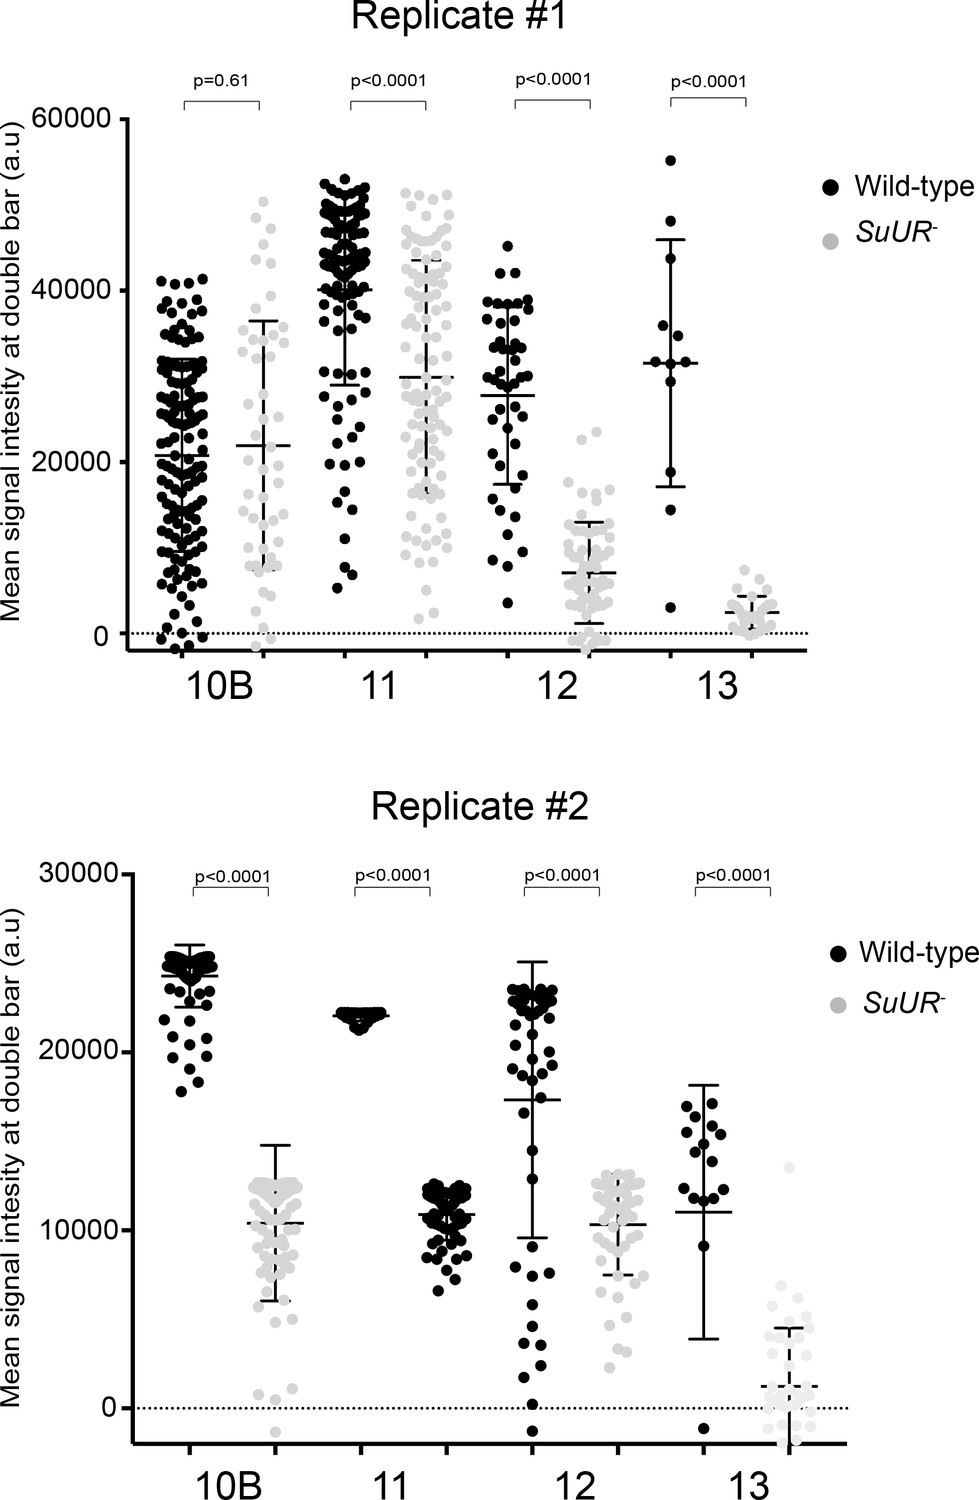
Quantification of Rif1 signal intensity at replication forks in the presence and absence of SUUR.
Rif1 mean signal intensity at double bar structures from stage 10B, 11, 12 and 13 egg chambers. Results from two biological replicates are shown independently. A two-tailed Welch’s t test was used to determine significance between the same stage of different genotypes. No outliers were excluded.
-
Figure 6—figure supplement 1—source data 1
Rif1 signal intensity at amplificaiton loci - stages 10B-13 - raw data.
- https://doi.org/10.7554/eLife.39140.027
Figure 6—figure supplement 2
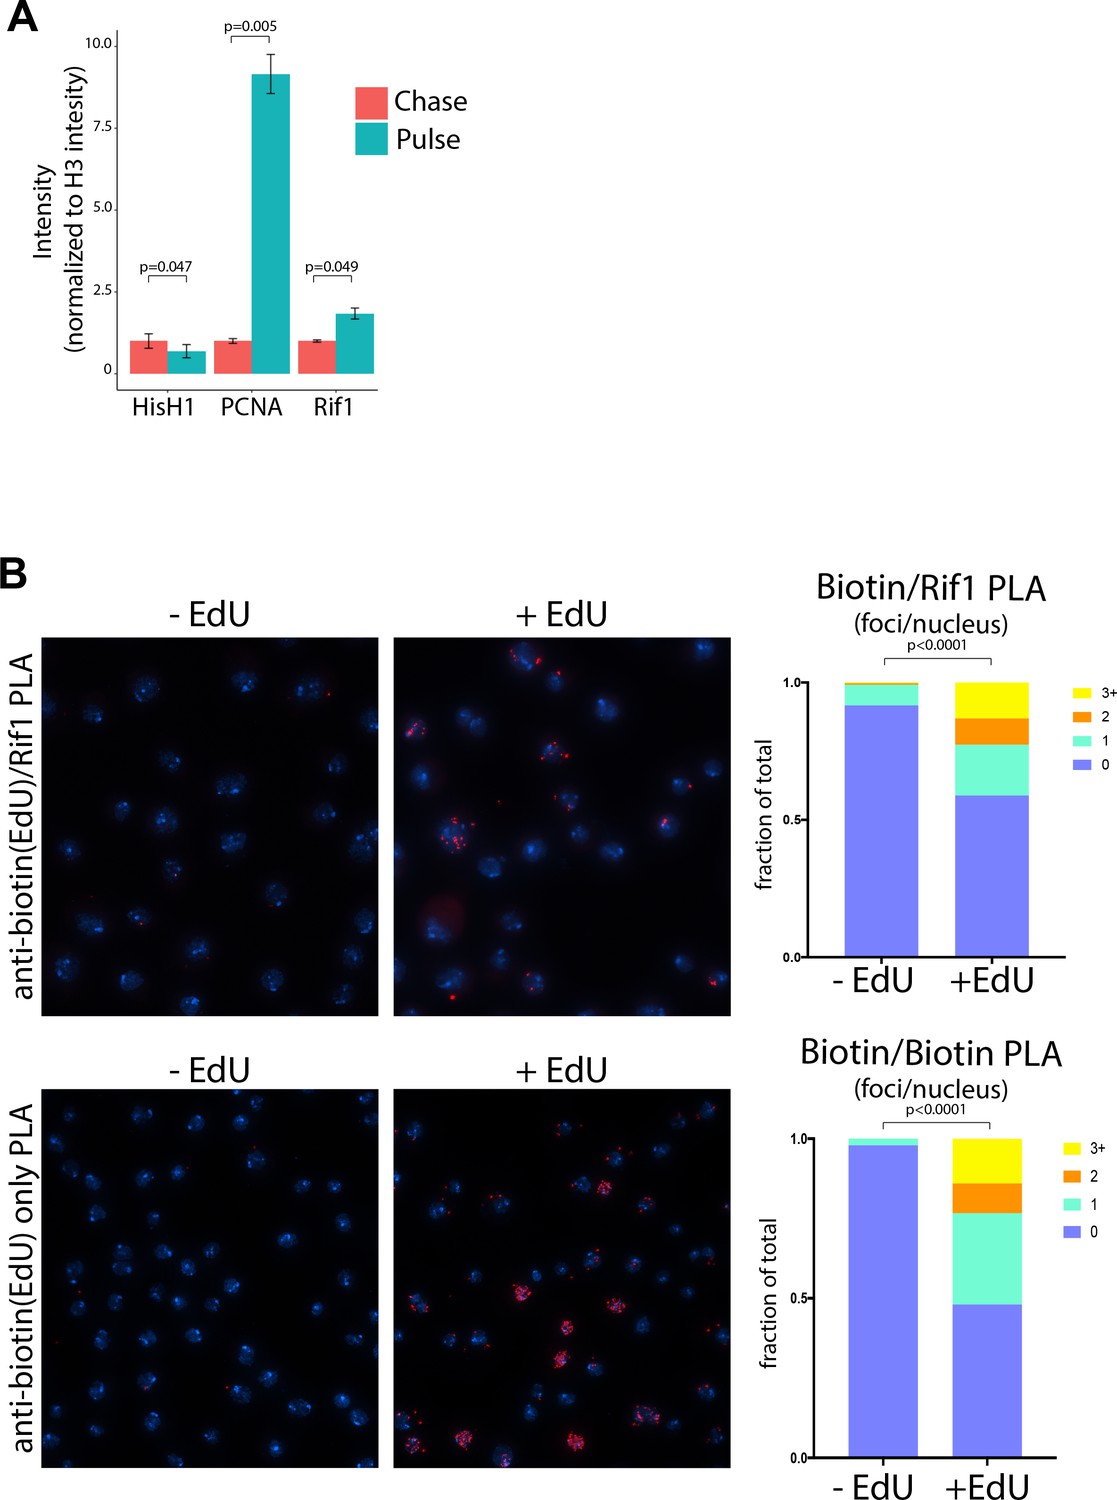
Rif1 localizes to replication forks in cultured cells.
(A) Quantification of protein intensity from iPOND mass spec data in cultured S2 cells. Intensities represent the summed MS1 spectrum for each peptide identified for Histone H1, PCNA or Rif1. Each sample was normalized to the protein intensity for Histone H3 to account for differences in protein abundance between each sample. Bars represent the average of three biological replicates and the error bars are the S.E.M. A paired t test was used to determine significance. (B) Proximity Ligation Assay (PLA) with nascent chromatin in cultured S2 cells reveals a signal between biotinylated EdU (nascent DNA) and Rif1. Representative images from anti-biotin and anti-Rif1 assay in the presence or absence of an EdU pulse. As a positive control, mouse and rabbit anti-biotin antibodies were used together in the presence or absence of an EdU pulse. Number of PLA foci per nucleus in quantified. Quantification of two biological replicates were used per condition. N (total number of nuclei counted)=775 for –EdU and 669 for + EdU (Biotin only). N = 773 for –EdU and 406 for + EdU (Rif1 and Biotin). A two-tailed Welch’s t test was used to determine significance.
-
Figure 6—figure supplement 2—source data 1
Data for Figure 6—figure supplement 2B.
- https://doi.org/10.7554/eLife.39140.029
Figure 7 with 2 supplements
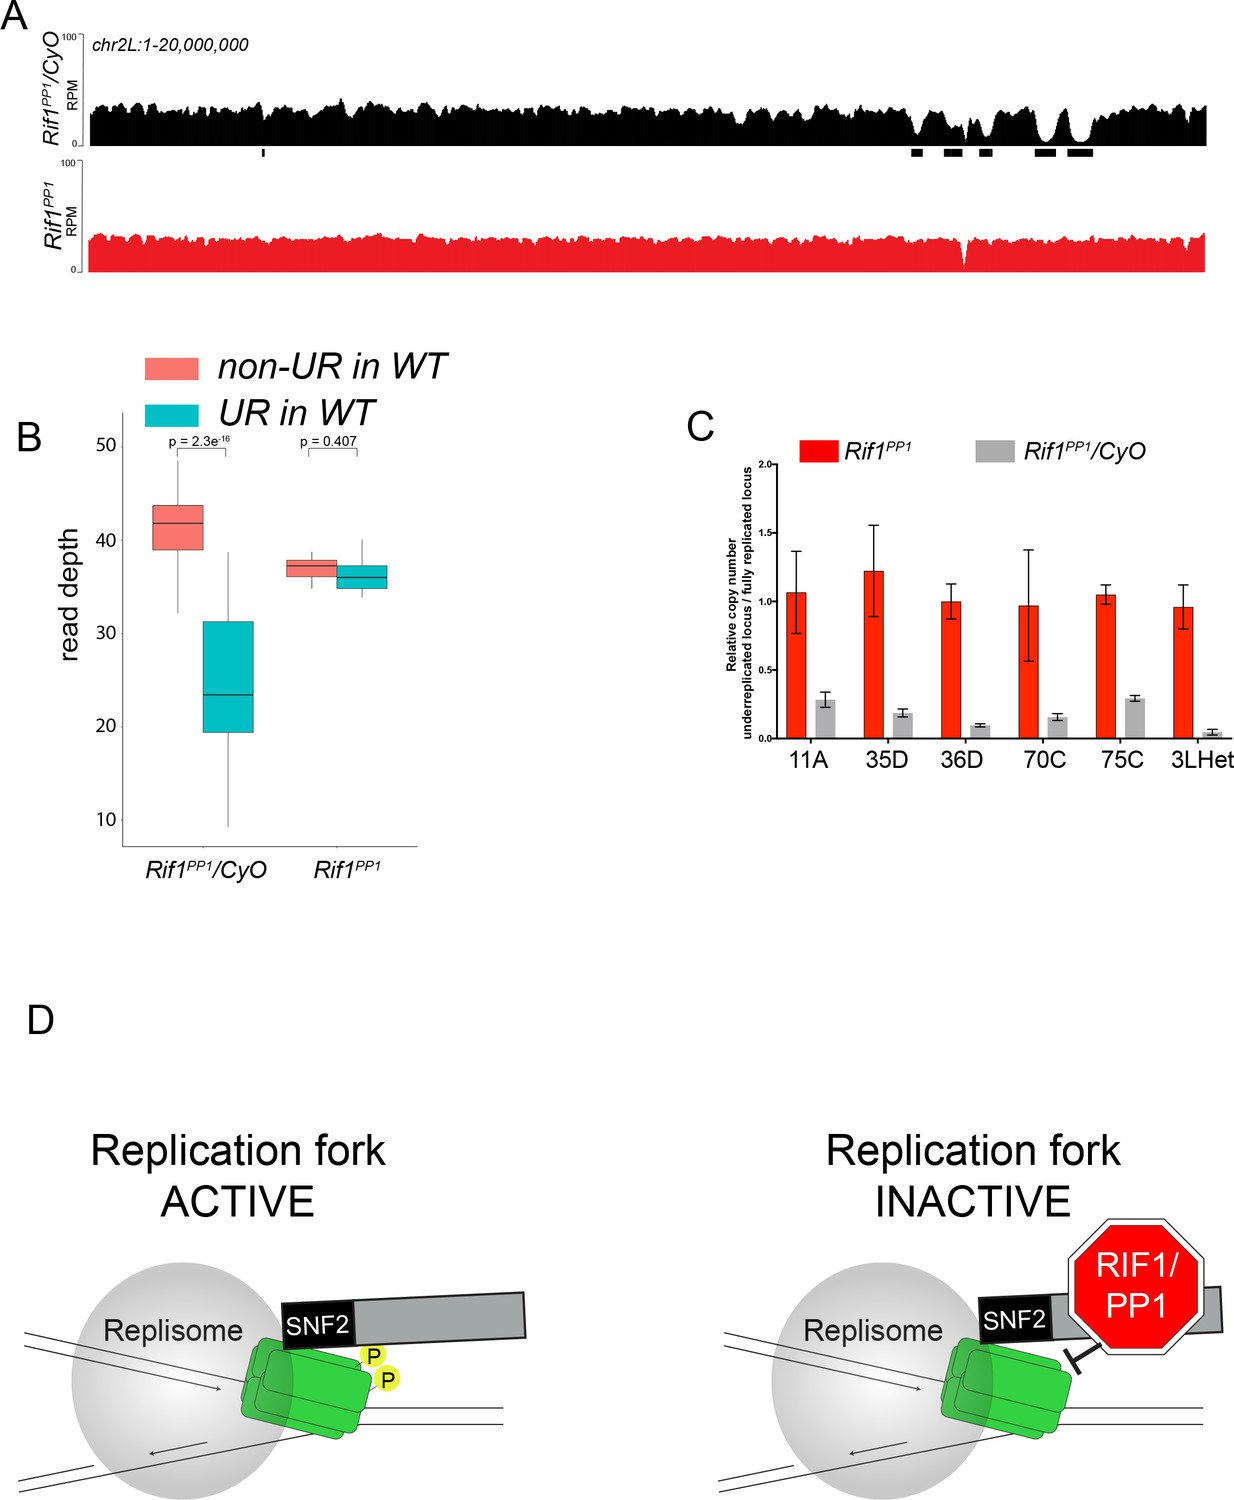
The Rif1 PP1 interaction motif is necessary to promote underreplication.
(A) Illumina-based copy number profiles of chr2L 1 - 20,000,000 from larval salivary glands. Black bars below each profile represent underreplicated regions identified by CNVnator. Rif1PP1/CyO was used as the wild-type control. (B) Average read depth in regions of euchromatic underreplication domains called in wild-type salivary glands vs. the fully replicated regions of the genome. A Welch two-sample t-test was used to determine p values. (C) Quantitative droplet-digital PCR (ddPCR) copy number assay for multiple underreplicated regions. Each bar is the average enrichment relative to a fully replicated control region for three biological replicates. Error bars are the SEM. (D) A new model for SUUR-mediated underreplication. In this model, SUUR serves as a scaffold to recruit a Rif1/PP1 complex to replication forks where Rif1/PP1 inhibits replication fork progression through dephosphorylation of a component of the replisome. The following source data and figure supplement are available for Figure 7: Figure 7—figure supplement 1; Figure 7—figure supplement 2; Figure 7—source data 1 – raw data for 7C.
-
Figure 7—source data 1
ddPCR data for Figure 7C.
- https://doi.org/10.7554/eLife.39140.033
Figure 7—figure supplement 1
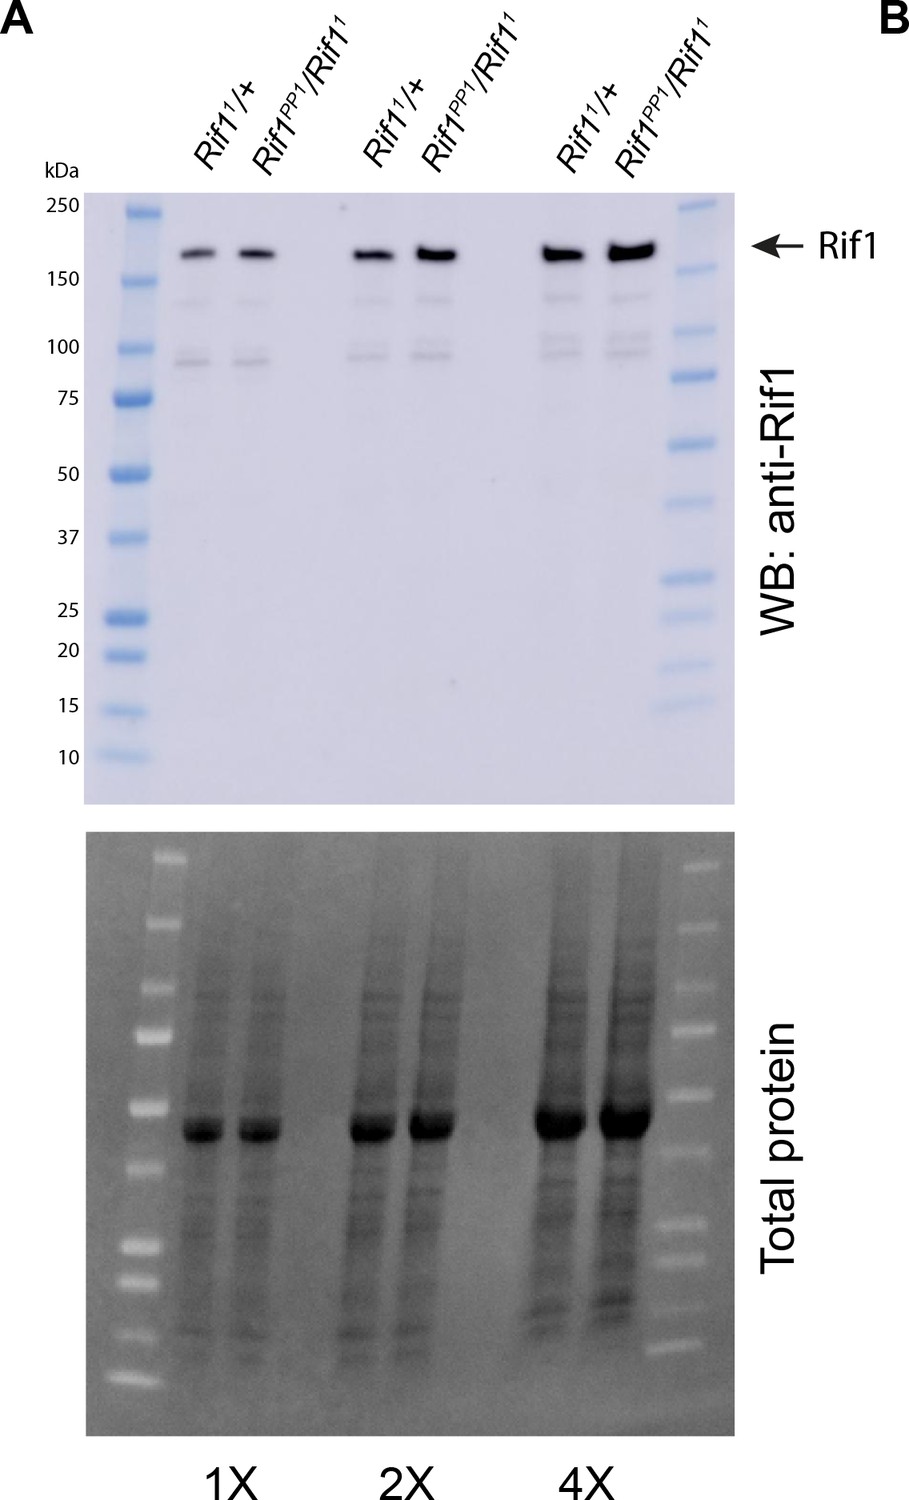
The Rif1PP1 protein expression level is similar to wild-type Rif1.
(A) Western blot analysis of ovary extracts from Rif1PP1/Rif11 and Rif11/+adults. Serum was produced in guinea pigs and used at 1:1000 dilution.
Figure 7—figure supplement 2
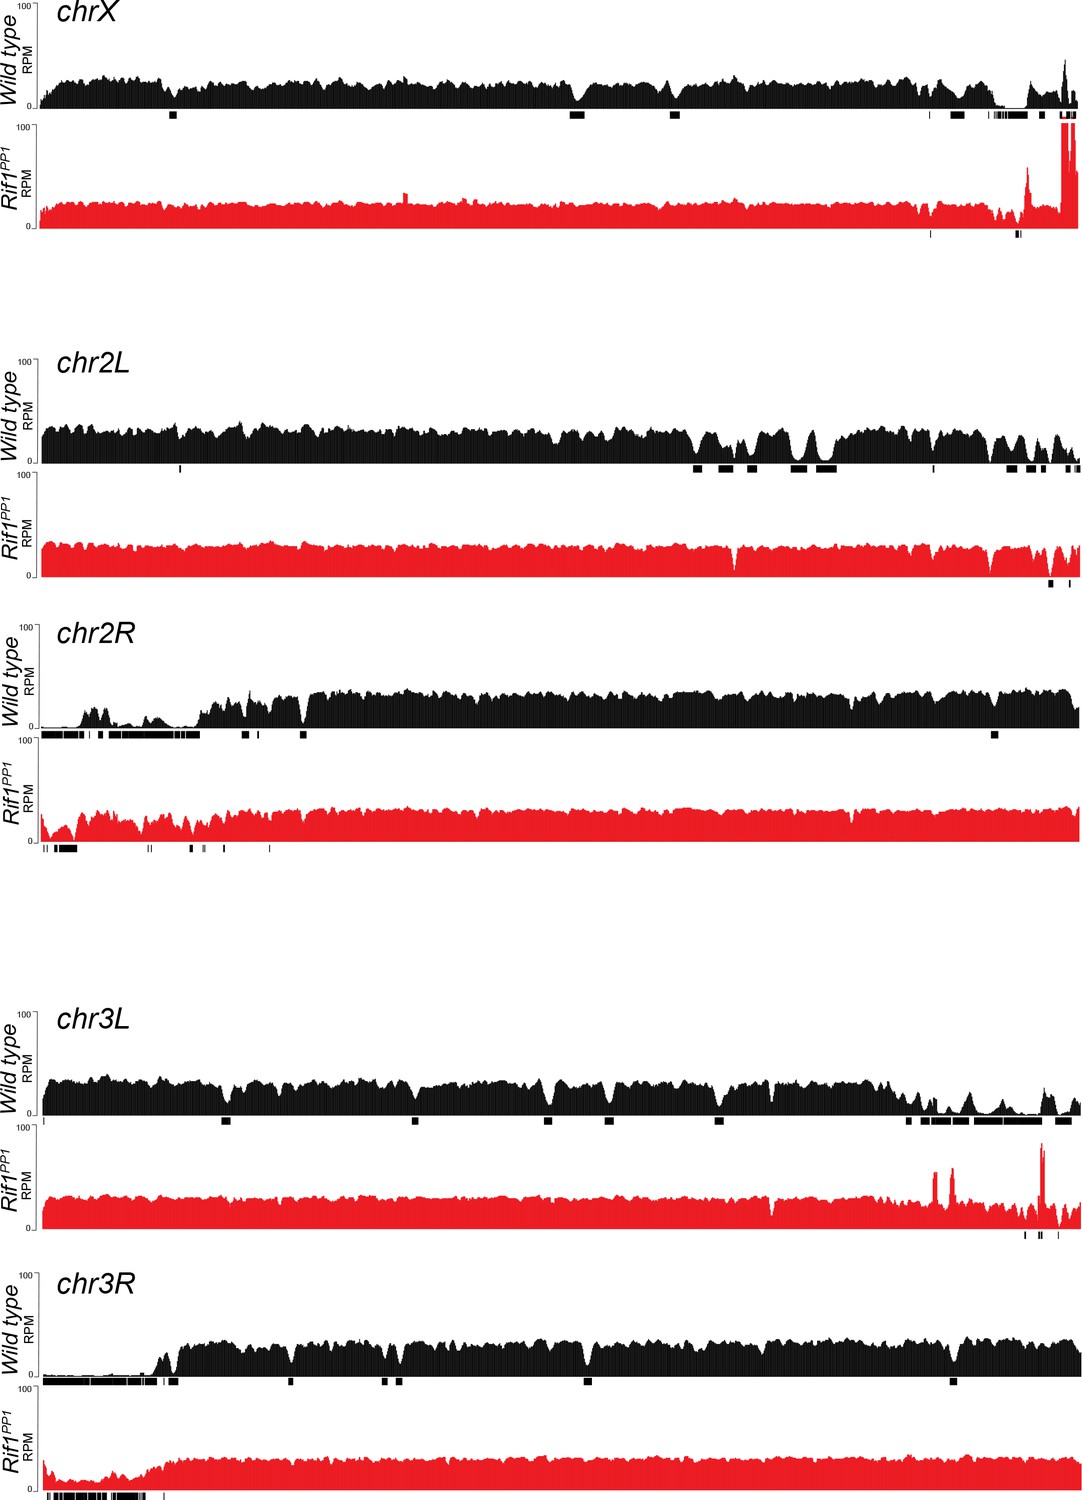
Genome-wide copy number profile of the Rif1PP1 mutant.
Illumina-based copy number profiles of all chromosome arms except the fourth for larval salivary glands of the indicated genotypes. Black bars below each profile represent called underreplicated regions.
Tables
Key resources table
| Reagent type (species) or resource | Designation | Source or reference | Identifiers | Additional information |
|---|---|---|---|---|
| Gene (Drosophila melanogaster) | Suppressor of Underreplication (SuUR) | NA | FBgn0025355 | |
| Gene (D. melanogaster) | Rap1 interacting factor 1 (Rif1) | NA | FBgn0050085 | |
| Strain, strain background (D. melanogaster) | WT: Oregon R | |||
| Strain, strain background (D. melanogaster) | SuUR | (Makunin et al., 2002) PMID: 11901119 | w118; SuURES | |
| Strain, strain background (D. melanogaster) | SuURΔSNF | This paper | SuURES, PBac{w+ SuURΔSNF} | |
| Strain, strain background (D. melanogaster) | hs > FLAG-SUUR | This paper | w118; hs > FLAG-SUUR | |
| Strain, strain background (D. melanogaster) | hs > FLAG-SNF2 | This paper | w118; hs > FLAG-SNF2 | |
| Strain, strain background (D. melanogaster) | Rif11 | This paper | w118; Rif11 | |
| Strain, strain background (D. melanogaster) | Rif12 | This paper | w118; Rif12 | |
| Strain, strain background (D. melanogaster) | Rif1- | This paper | w118; Rif11/Rif12 | |
| Strain, strain background (D. melanogaster) | Rif1PP1 | This paper | w118; Rif1PP1 | |
| Cell line (D. melanogaster) | S2-DGRC | Drosophila Genomics Resource Center (DGRC) | embryo derived | isolate of S2 used for RNAi in the DRSC modENCODE line |
| Antibody | anti-SUUR (Guinea pig, polyclonal) | (Nordman et al., 2011) PMID: 25437540) | ||
| Antibody | anti-Rif1 (Guinea pig, polyclonal) | This paper | (1:200) | |
| Antibody | anti-Rif1 (Rabbit, polyclonal) | This paper | (1:1000) | |
| Antibody | HRP-anti-FLAG (Mouse, monoclonal) | Sigma-Aldrich | A8592 | (1:1000) |
| Antibody | anti-HP1 (Mouse, monoclonal) | The Developmental Studies Hybridoma Bank (DSHB) | C1A9 | (1:1000) |
| Antibody | anti-biotin (Mouse, moncolonal) | Sigma-Aldrich | SAB4200680 | (1:20,000) |
| Antibody | anti-biotin (rabbit, polyclonal) | Bethyl | A150-109A | (1:3,000) |
| Antibody | HRP-secondaries | Jackson ImmunoResearch | (1:20,000) | |
| Recombinant DNA reagent | pCaSpeR-hs | (Thummel and Pirrotta, V.)Drosophila Genomics Resource Center | ||
| Recombinant DNA reagent | pStinger | (Barolo et al., 2000) PMID: 11056799 | ||
| Recombinant DNA reagent | CHORI-322 (CH322-163L18) | BACPAC Resources | ||
| Recombinant DNA reagent | pET17b | Millipore-Sigma | 69663 | |
| Recombinant DNA reagent | pET17b-Rif1 (694–1094) | This paper | Progenitors:PCR, pET17b | |
| Peptide, recombinant protein | Rif1(694–1094) | This paper | Ni-NTA purified | |
| Commercial assay or kit | PLA probes | Duolink Sigma | ||
| Commercial assay or kit | PLA probemaker | Duolink Sigma | DUO92010 | |
| Commercial assay or kit | PLA Detection Reagents | Duolink Sigma | DUO92008 | |
| Chemical compound, drug | Alexa Fluor Azide 555 | Life Technologies | A20012 | |
| Chemical compound, drug | Biotin-TEG Azide | Berry and Associates | BT 1085 | |
| Chemical compound, drug | EdU (5-ethynyl-2- deoxyuridine) | Life Technologies | A10044 | |
| Software, algorithm | Sequest | Thermo Scientific | ||
| Software, algorithm | Scaffold 4.3.4 | Proteome Software | ||
| Software, algorithm | Skyline version 4.1 | Schilling et al. (2012) (PMID:22454539) | ||
| Software, algorithm | deepTool 2.5.0 | Ramírez et al. (2016) (PMID:27079975) | ||
| Software, algorithm | CNVnator 0.3.3 | Abyzov et al., 2011 (PMID:21324876) | ||
| Other |
Additional files
-
Supplementary file 1
Underreplicated regions called by CNVnator.
- https://doi.org/10.7554/eLife.39140.034
-
Supplementary file 2
Half-max copy number analysis.
- https://doi.org/10.7554/eLife.39140.035
-
Transparent reporting form
- https://doi.org/10.7554/eLife.39140.036
Download links
A two-part list of links to download the article, or parts of the article, in various formats.
Downloads (link to download the article as PDF)
Open citations (links to open the citations from this article in various online reference manager services)
Cite this article (links to download the citations from this article in formats compatible with various reference manager tools)
Rif1 inhibits replication fork progression and controls DNA copy number in Drosophila
eLife 7:e39140.
https://doi.org/10.7554/eLife.39140


