Integrated systems analysis reveals conserved gene networks underlying response to spinal cord injury
- University of British Columbia, Canada
- Vancouver Health Authority, Canada
Figures
Figure 1
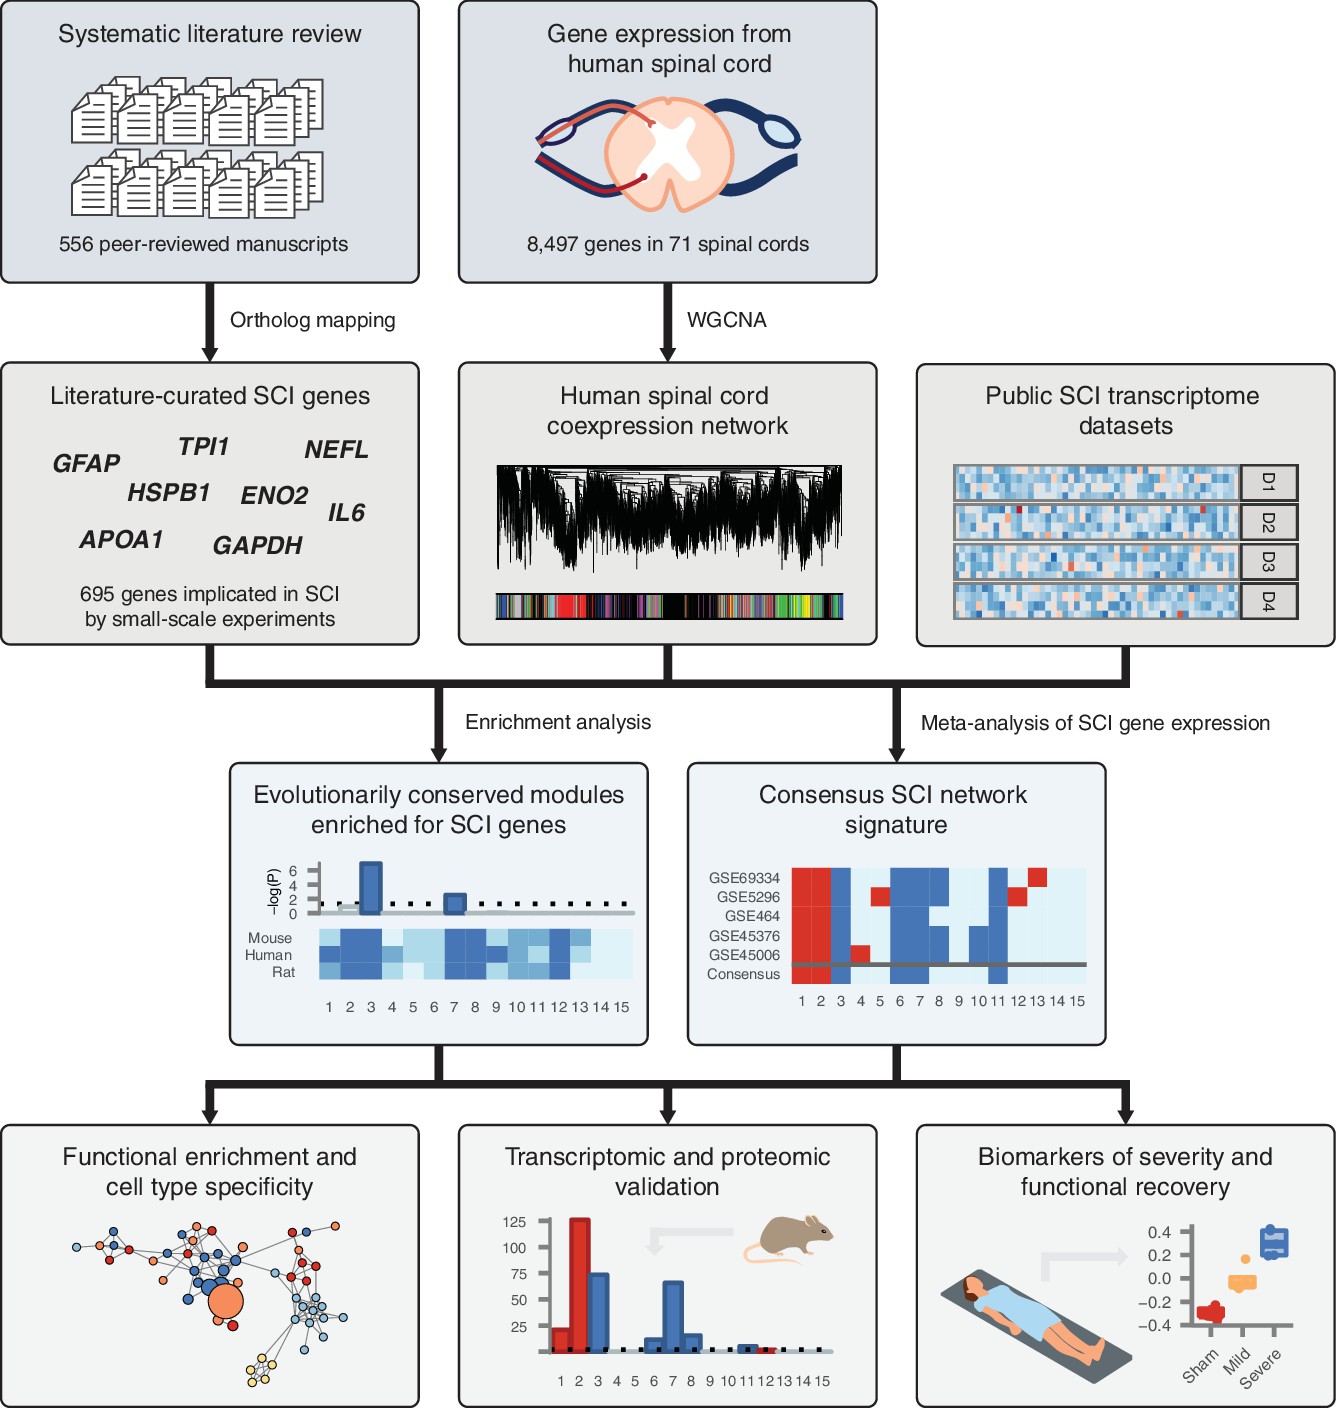
Schematic overview of systems biology approach to SCI pathophysiology integrating small-scale experiments with high-throughput data.
Systematic analysis of over 500 manuscripts revealed the complete set of genes implicated in SCI pathophysiology by small-scale experiments. SCI genes were integrated with unbiased, genome-wide gene expression data from healthy human spinal cord to identify coexpressed gene subnetworks enriched for known SCI genes. Meta-analysis of SCI gene expression data revealed consensus patterns of subnetwork differential expression after SCI. The resulting consensus network signature of the response to SCI in human spinal cord was subjected to functional enrichment and cell type analyses, validated at the transcriptomic and proteomic levels, and leveraged to nominate quantitative biomarkers of SCI severity.
Figure 2 with 2 supplements

Literature curation and validation of genes implicated in the physiological response to SCI by small-scale experiments.
(A) Number of small-scale studies implicating each gene in SCI pathophysiology in the LC gene set. (B) Experimental techniques used to associate LC genes with response to SCI in the LC gene set. (C) Enrichment for shared Gene Ontology terms among LC genes (all p < 10−15). BP, biological process; CC, cellular component; MF, molecular function. (D) Number of protein-protein interactions (PPIs) between LC genes observed in the high-confidence human interactome (Menche et al., 2015) (dotted line) and 1000 randomized interactome networks (density), revealing significant enrichment for PPIs between LC genes relative to random expectation (p < 10−3). (E) Size of the largest connected component (LCC) between LC genes in the high-confidence human interactome (dotted line) and 1000 randomized interactome networks (density), revealing LC genes occupy a distinct region of the human interactome (p < 10−3). (F) LC genes are prioritized by a disease gene prediction algorithm (Ghiassian et al., 2015) (p < 10−15, Kolmogorov–Smirnov test).
Figure 2—figure supplement 1
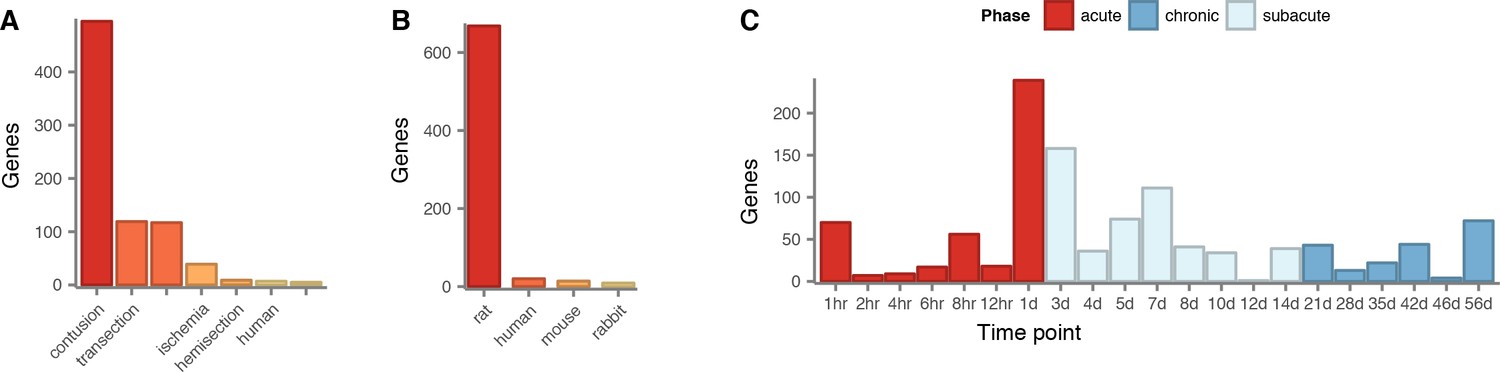
Literature curation of genes implicated in the physiological response to SCI.
(A) Experimental models of SCI employed to associate literature-curated (LC) genes with response to SCI in the LC gene set. (B) Species in which LC genes were associated with response to SCI in the LC gene set. (C) Time points at which LC genes were associated with response to SCI in the LC gene set.
Figure 2—figure supplement 2

Validation of the complete set of genes implicated in the physiological response to SCI.
(A–C) Number of protein-protein interactions (PPIs) between LC genes in the InBioMap (A) (Li et al., 2017) and binary (B) or co-complex (C) subsets of the HINT (Das and Yu, 2012) human interactome databases (dotted lines) and 1000 randomized interactome networks (densities), confirming significant enrichment for PPIs between LC genes relative to random expectation (all p < 10–3). (D–F) Size of the largest connected component (LCC) between LC genes in the InBioMap (D) and binary (E) or co-complex (F) subsets of the HINT human interactome databases (dotted lines) and 1000 randomized interactome networks (densities), confirming significant enrichment for PPIs between LC genes relative to random expectation (all P 0.005). (G–I) LC genes are prioritized by a disease gene prediction algorithm (Ghiassian et al., 2015) in the InBioMap (G) and HINT binary (H) or co-complex (I) human interactomes (all p < 10–15). (J) Number of intra-complex co-memberships between LC genes (dotted line) and 1000 randomized gene sets (density) observed in a global map of human protein complexes (Drew et al., 2017), revealing significant tendency for LC genes to participate in the same protein complex (p < 10–3).
Figure 3 with 1 supplement
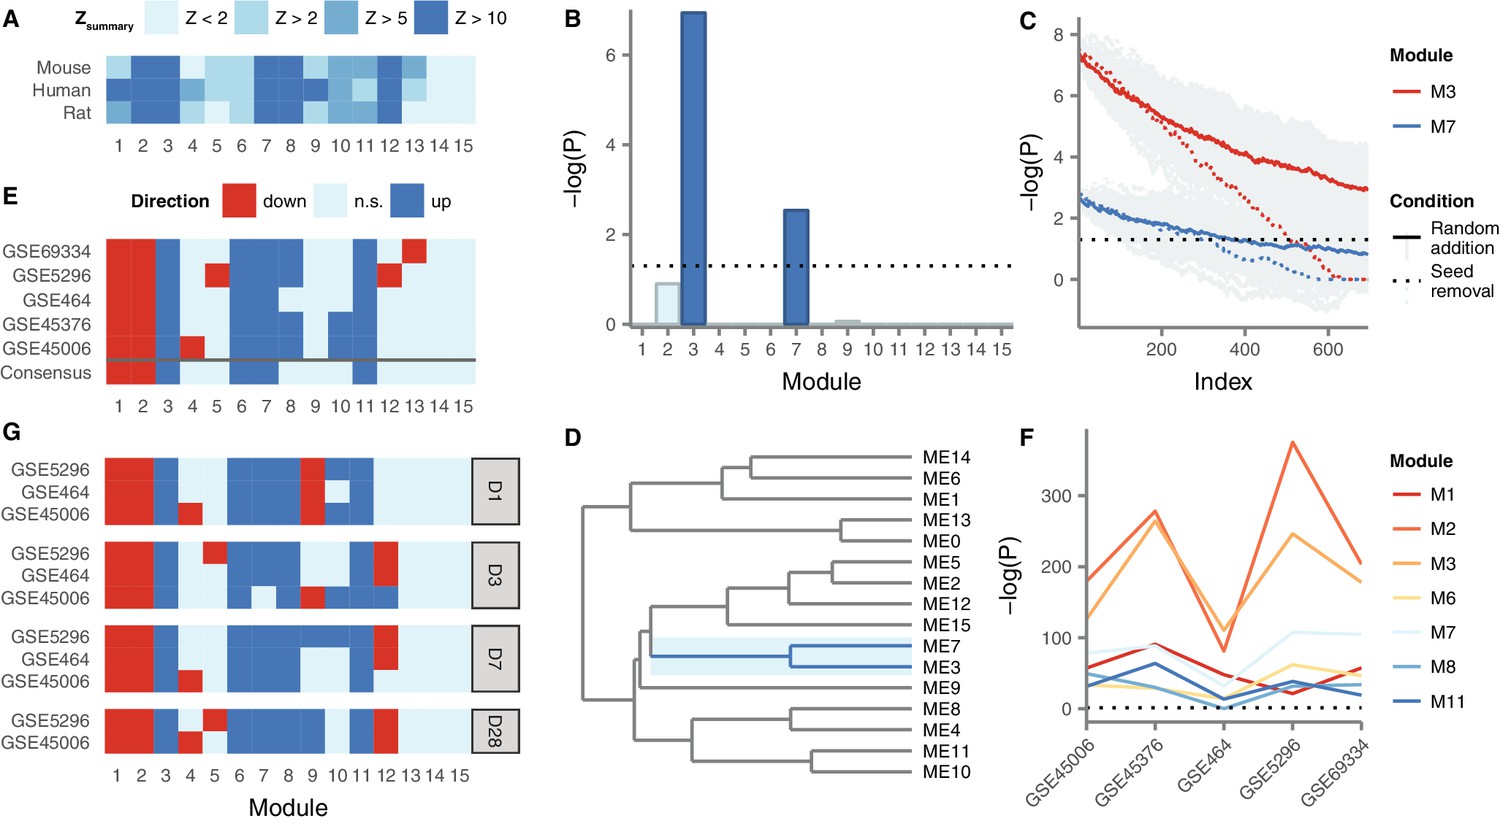
Gene coexpression modules in the human spinal cord and their differential expression in SCI.
(A) Reproducibility of human spinal cord modules in a microarray dataset and conservation in mouse and rat. (B) Enrichment of M3 and M7 for LC SCI genes. (C) Robustness of M3 and M7 enrichment for LC SCI genes. (D) Eigengene network for human spinal cord modules. (E) Differential expression of spinal cord modules following SCI in five datasets, and consensus. (F) Evidence for differential expression of six consensus modules and one majority module (M8). (G) Time-dependent expression of spinal cord modules at acute, subacute, and chronic time points following SCI.
Figure 3—figure supplement 1

Contributions of experimental techniques, injury models, and species to M3 and M7 enrichment for LC genes.
(A) Proportion of LC genes within M3 and M7 by experimental technique. (B) Proportion of LC genes within M3 and M7 by experimental model of SCI. (C) Proportion of LC genes within M3 and M7 by species.
Figure 4 with 5 supplements
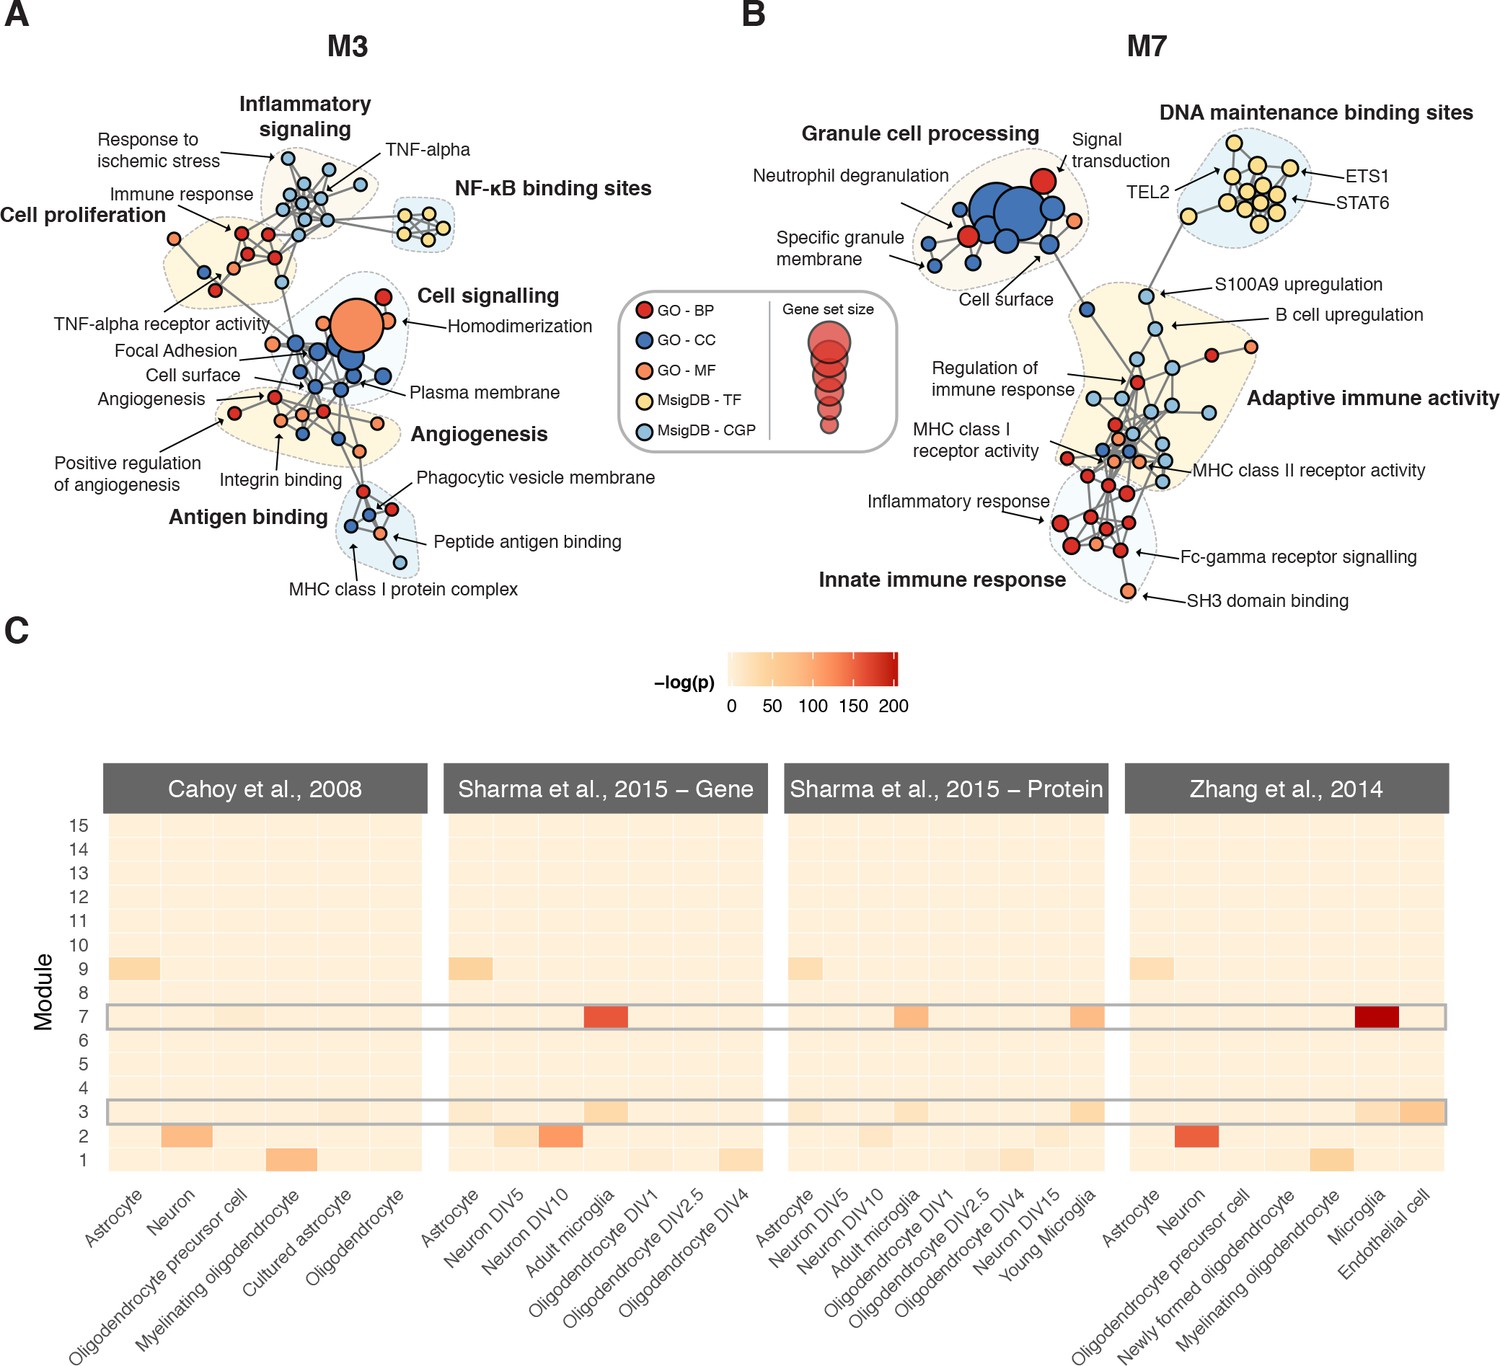
Biological characterization of spinal cord modules.
(A–B) Enrichment maps (Merico et al., 2010) for modules M3 and M7. (C) Meta-analysis of cell type-specific marker gene enrichment in human spinal cord modules at the transcriptomic and proteomic levels.
Figure 4—figure supplement 1
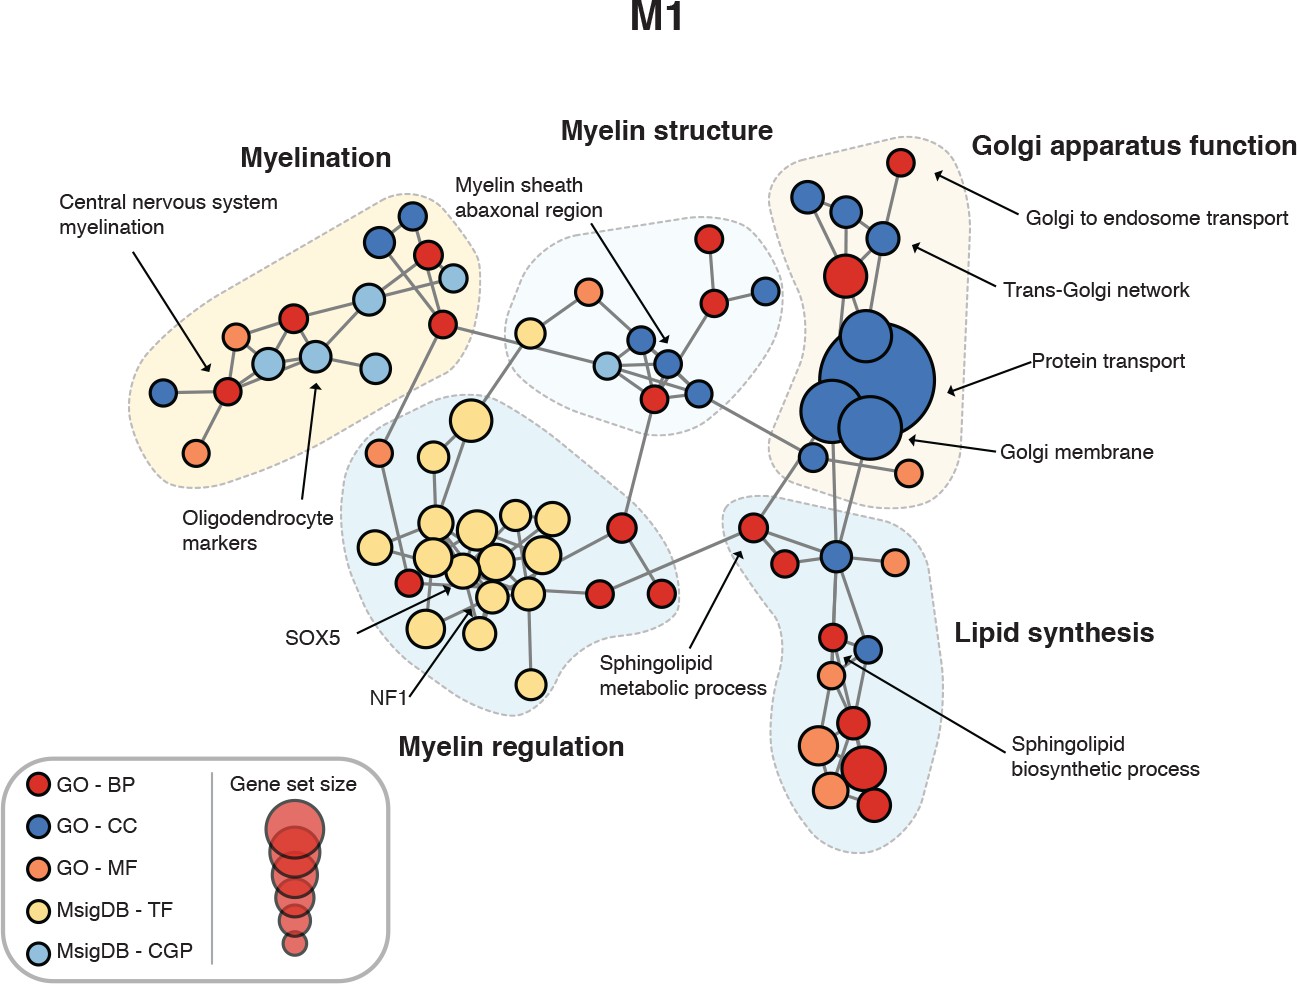
Enrichment map for human spinal cord module M1.
https://doi.org/10.7554/eLife.39188.009
Figure 4—figure supplement 2
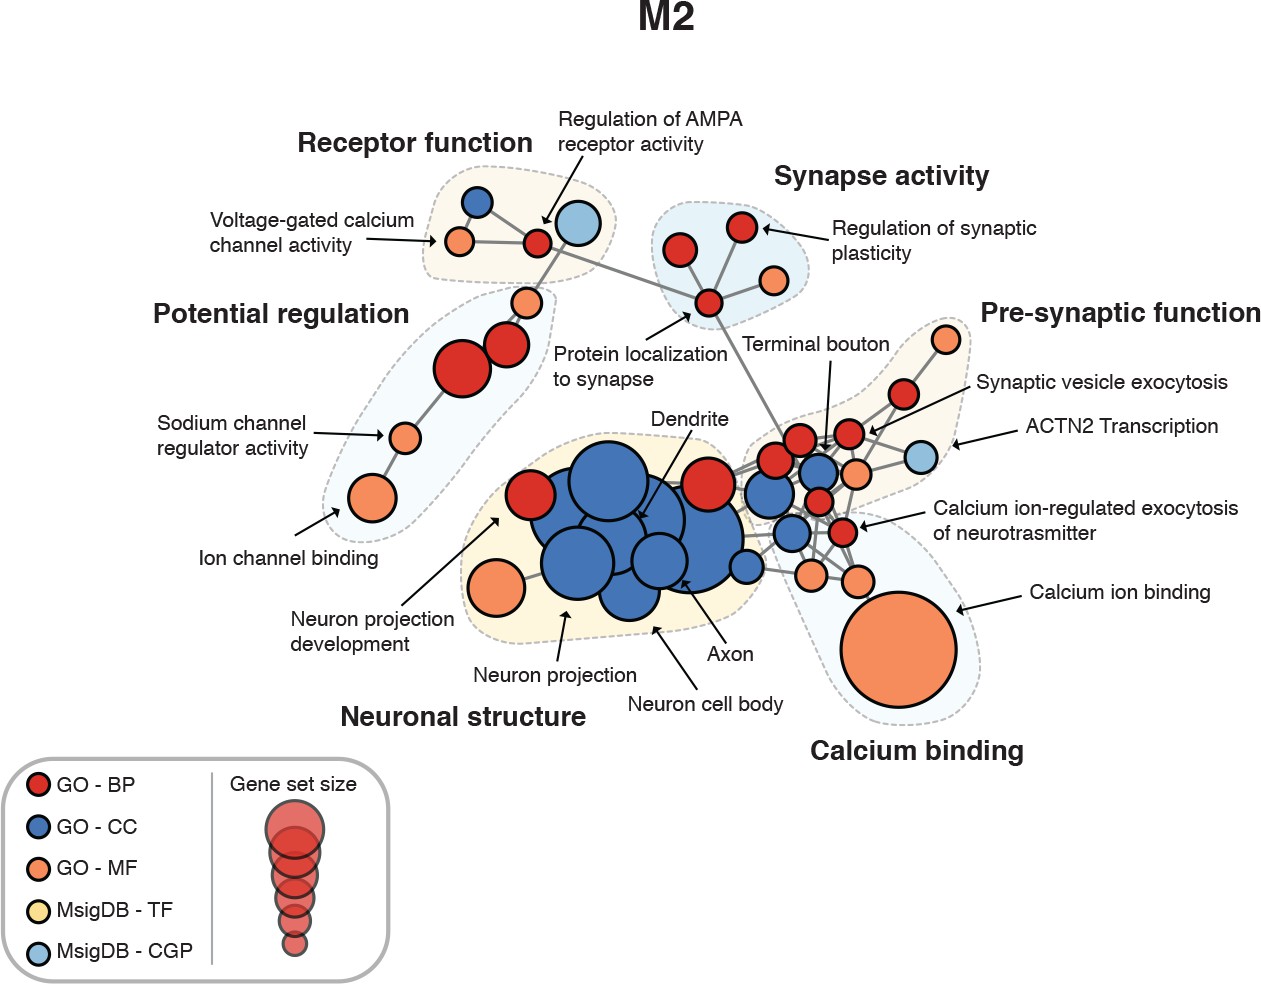
Enrichment map for human spinal cord module M2.
https://doi.org/10.7554/eLife.39188.010
Figure 4—figure supplement 3
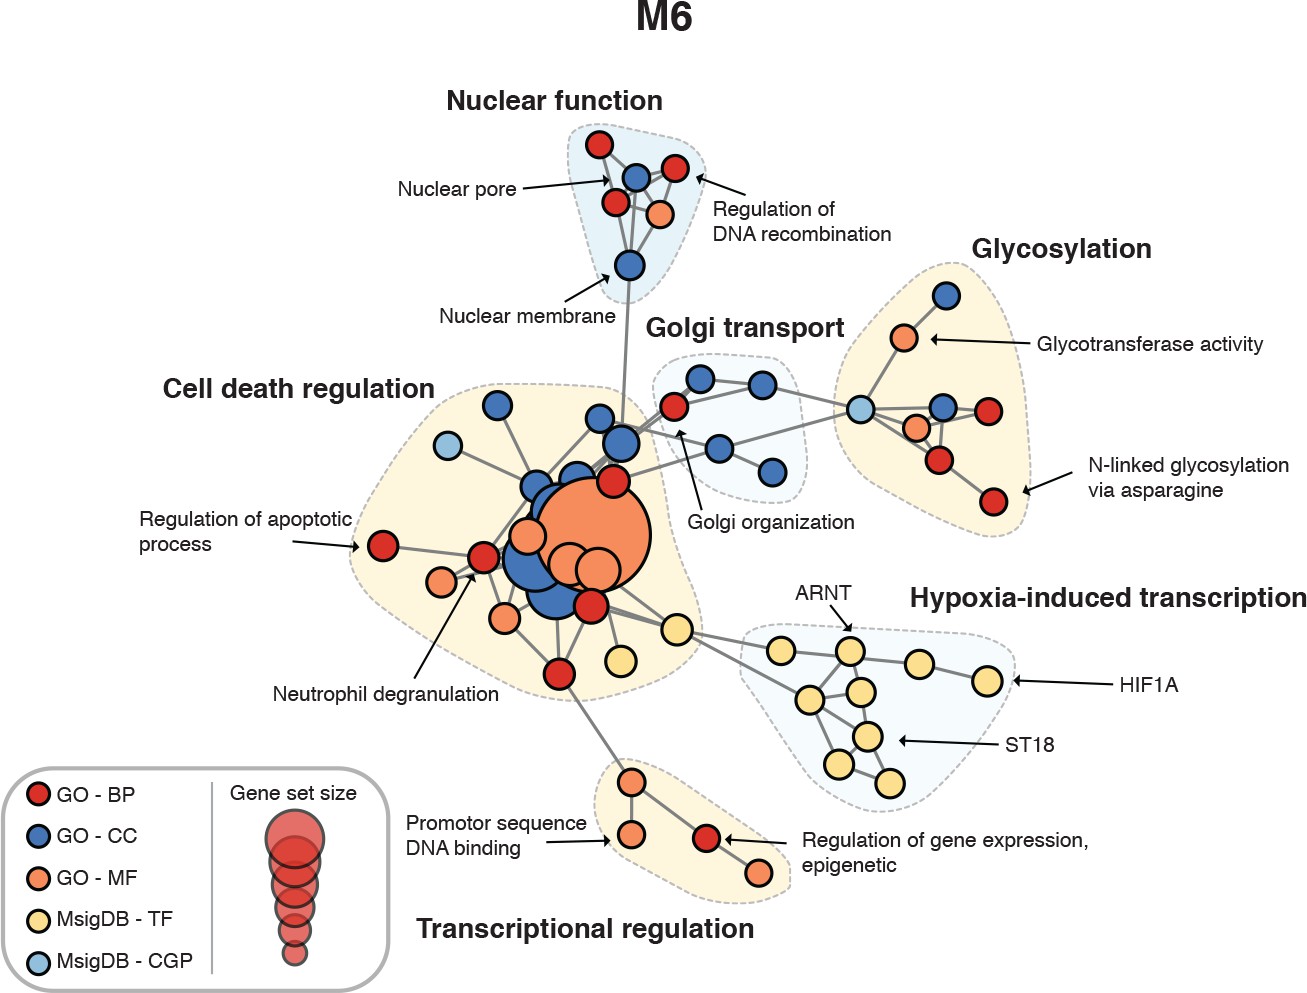
Enrichment map for human spinal cord module M6.
https://doi.org/10.7554/eLife.39188.011
Figure 4—figure supplement 4
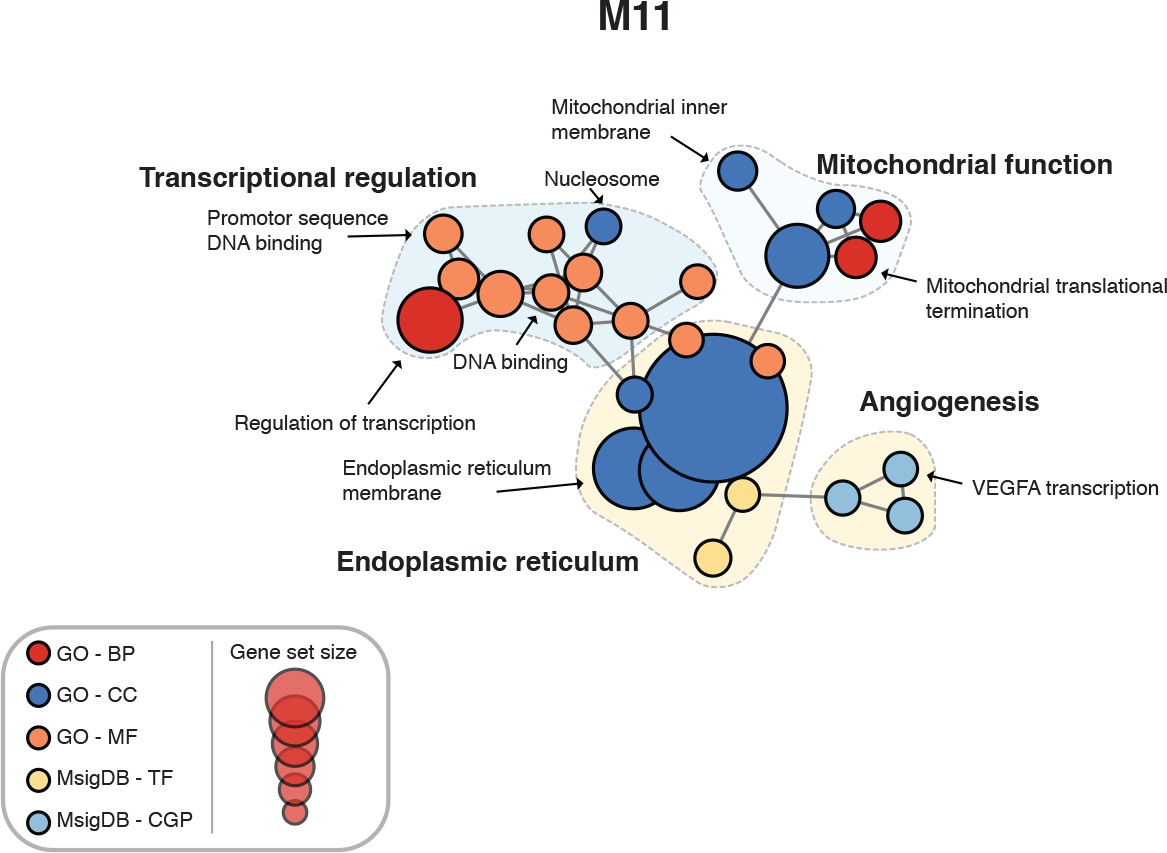
Enrichment map for human spinal cord module M11.
https://doi.org/10.7554/eLife.39188.012
Figure 4—figure supplement 5
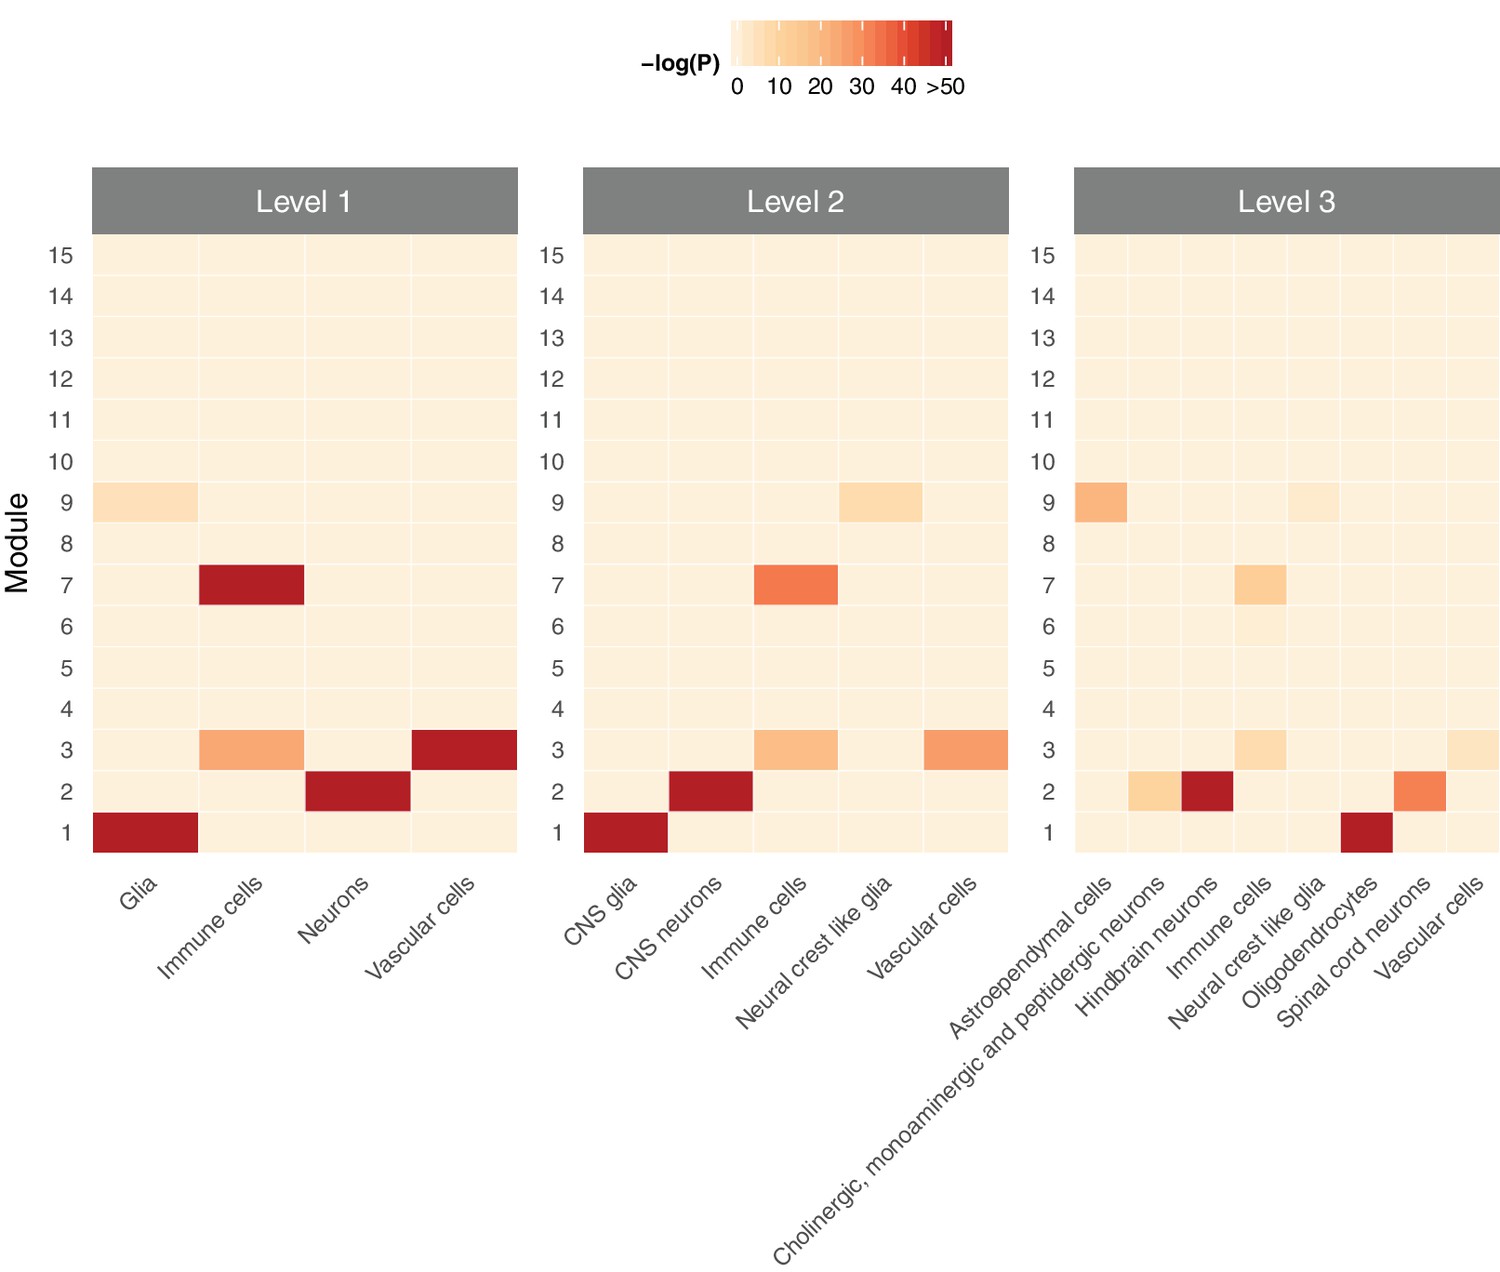
Cell type specificity of human spinal cord modules in single-cell RNA-seq data from the mouse spinal cord (Zeisel et al., 2018), at three different levels of cell type classification.
https://doi.org/10.7554/eLife.39188.013
Figure 5
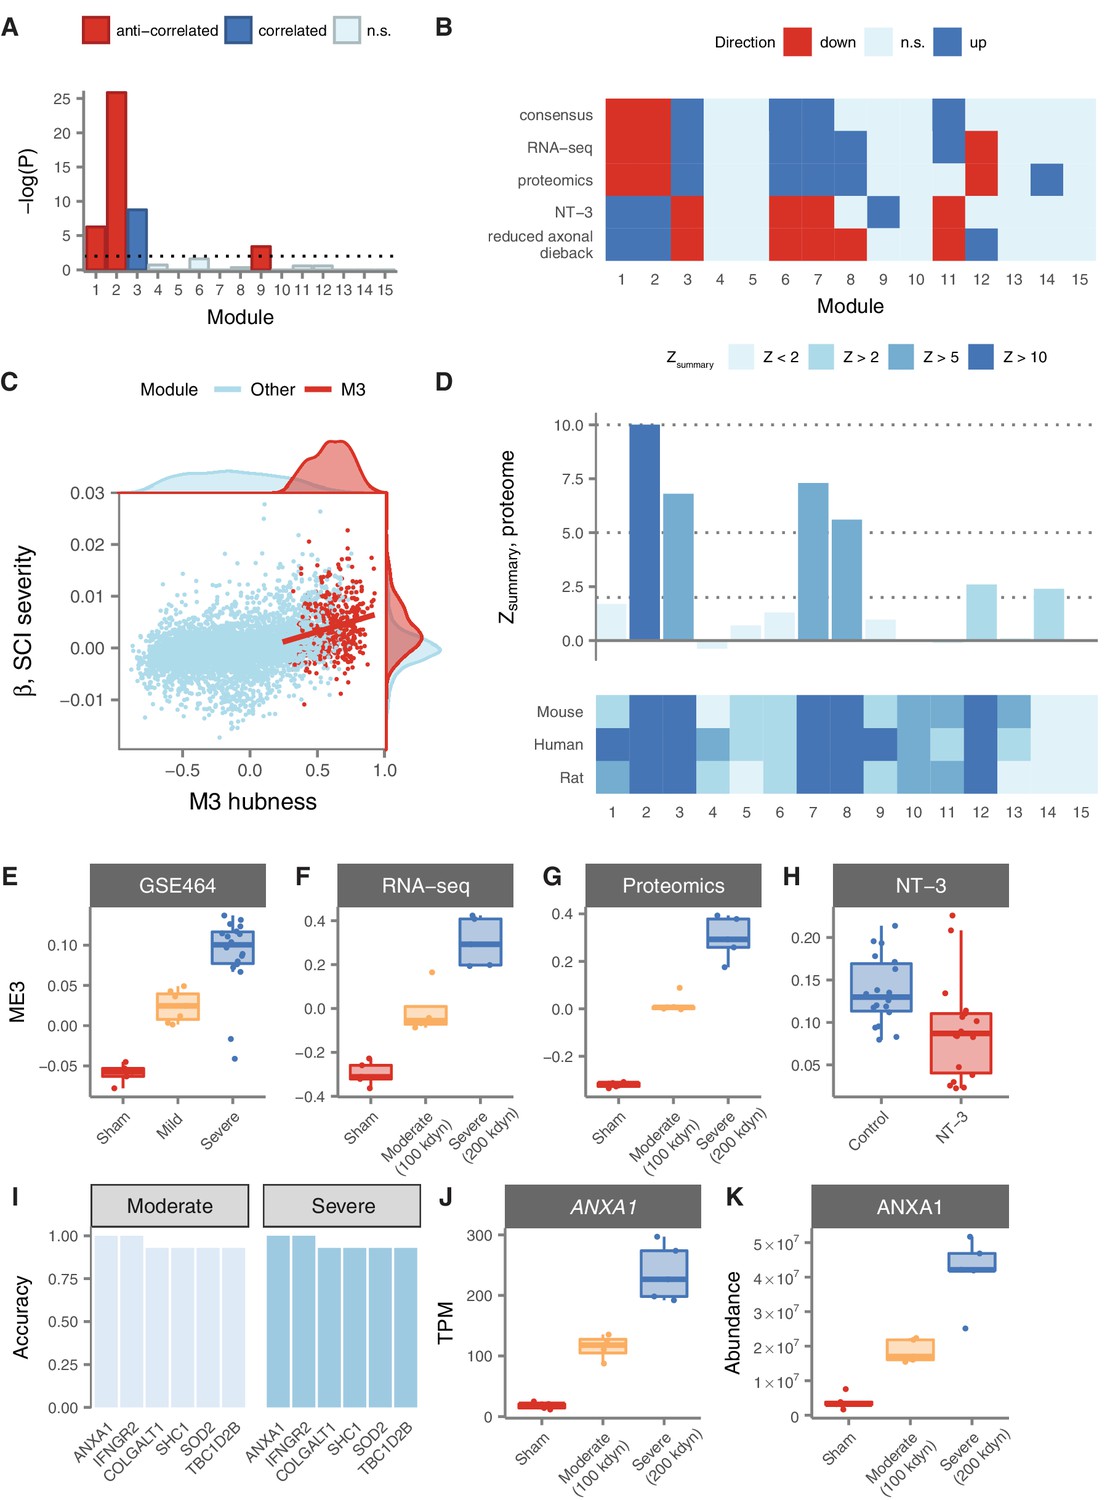
Relationship of spinal cord modules to injury severity and functional recovery.
(A) Enrichment of spinal cord modules for genes correlated or anticorrelated to injury severity in a mouse model. (B) Consensus network signature of SCI pathophysiology, validation in independent transcriptomic and proteomic datasets, and reversal in functional recovery and reduced axonal dieback. (C) Gene expression correlation to M3 eigengene predicts association to SCI severity. (D) Reproducibility and evolutionary conservation of spinal cord modules and their preservation at the proteomic level. (E–F) Relationship between M3 eigengene and injury severity at 7 days post-injury in a mouse model (E), and in our own RNA-seq (F) and proteomic (G) datasets. (H) Downregulation of the M3 eigengene following treatment with NT-3, a neurotrophic agent that promotes functional recovery in acute SCI. (I) Six genes classify moderate and severe injuries in transcriptomic data with 90% or greater accuracy. (J–K) Gene expression and protein abundance of annexin A1 in sham, moderate, and severe SCI.
Additional files
-
Supplementary file 1
Genes associated with response to SCI in small-scale experiments, and their human orthologs.
- https://doi.org/10.7554/eLife.39188.015
-
Supplementary file 2
Assignment of human genes to coexpressed modules in the spinal cord.
- https://doi.org/10.7554/eLife.39188.016
-
Supplementary file 3
Gene Ontology terms enriched within gene coexpression modules in the human spinal cord.
BP, biological process; CC, cellular compartment; MF, molecular function.
- https://doi.org/10.7554/eLife.39188.017
-
Supplementary file 4
ArrayExpress experiments and samples used to construct microarray gene coexpression networks for human, rat, and mouse.
- https://doi.org/10.7554/eLife.39188.018
-
Transparent reporting form
- https://doi.org/10.7554/eLife.39188.019
Download links
A two-part list of links to download the article, or parts of the article, in various formats.
Downloads (link to download the article as PDF)
Open citations (links to open the citations from this article in various online reference manager services)
Cite this article (links to download the citations from this article in formats compatible with various reference manager tools)
Integrated systems analysis reveals conserved gene networks underlying response to spinal cord injury
eLife 7:e39188.
https://doi.org/10.7554/eLife.39188


