Shear-induced damped oscillations in an epithelium depend on actomyosin contraction and E-cadherin cell adhesion
- Stanford University, United States
- University of California, United States
Figures
Figure 1 with 7 supplements
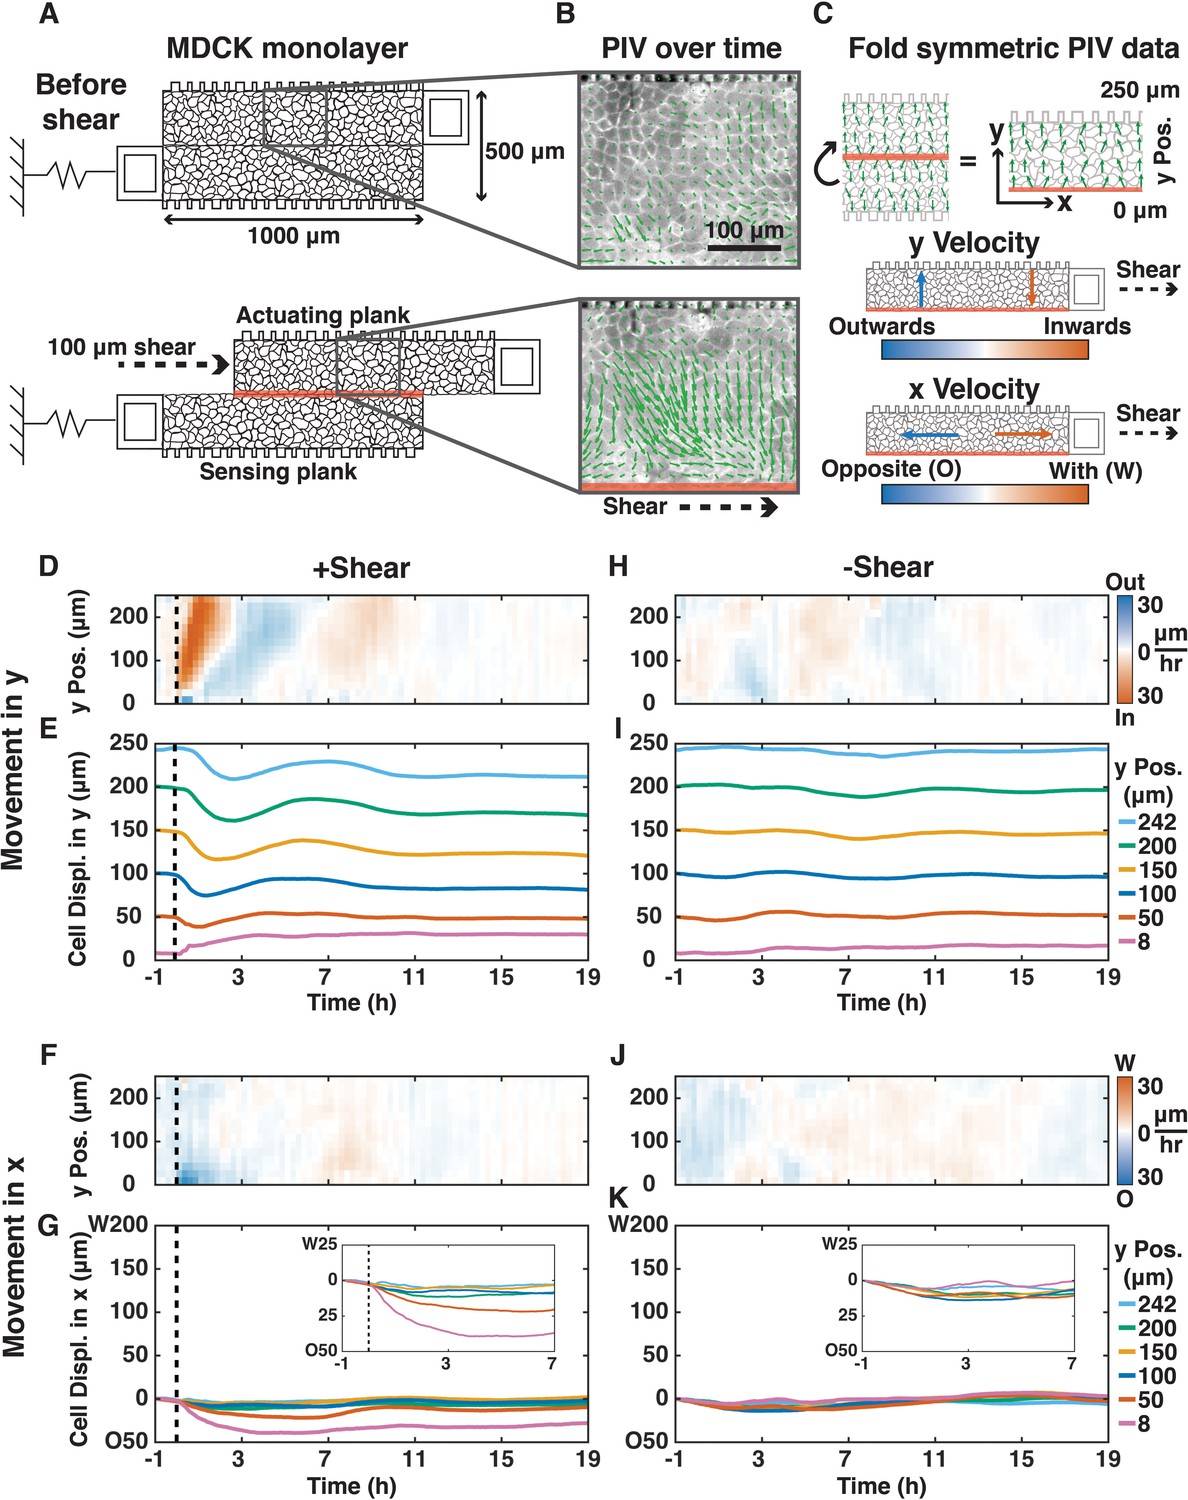
Shear induced inward/outward oscillations in cells in the y-direction and cell movements opposite to the shear in the x-direction.
(A) Shear (100 μm) was applied to a MDCK monolayer adhering to the device planks (Supplementary Materials). (B) PIV was used to quantify the x- and y-direction velocities (green arrows) of MDCK cells expressing E-cadherin:DsRed over time. (C) Symmetric PIV data were averaged by ‘folding’ over the shear-plane. The color map displays the speeds of cell movement in the outward/inward (blue/red) y-direction relative to the shear-plane (0 μm y Pos.), or in the opposite/with x-direction relative to the shear direction (blue/red, 30 μm/h). (D, F, H, J) y- (D and H) and x-velocity (F and J) kymographs from three independent experiments with 15 min binning of three 5 min PIV data of cell movements with (D and F, dashed black line) or without (H and J) shear over 20 h. (E, G, I, K) y- (E and I) and x-direction (G and K) cell movements based on numerical integration of y- and x-velocity kymographs over time, respectively, at positions 8, 50, 100, 150, 200, and 242 μm from the shear-plane (Figure 1—figure supplement 7). Insets provide greater spatial resolution of movement in the deformation zone (G and K, insets).
Figure 1—figure supplement 1
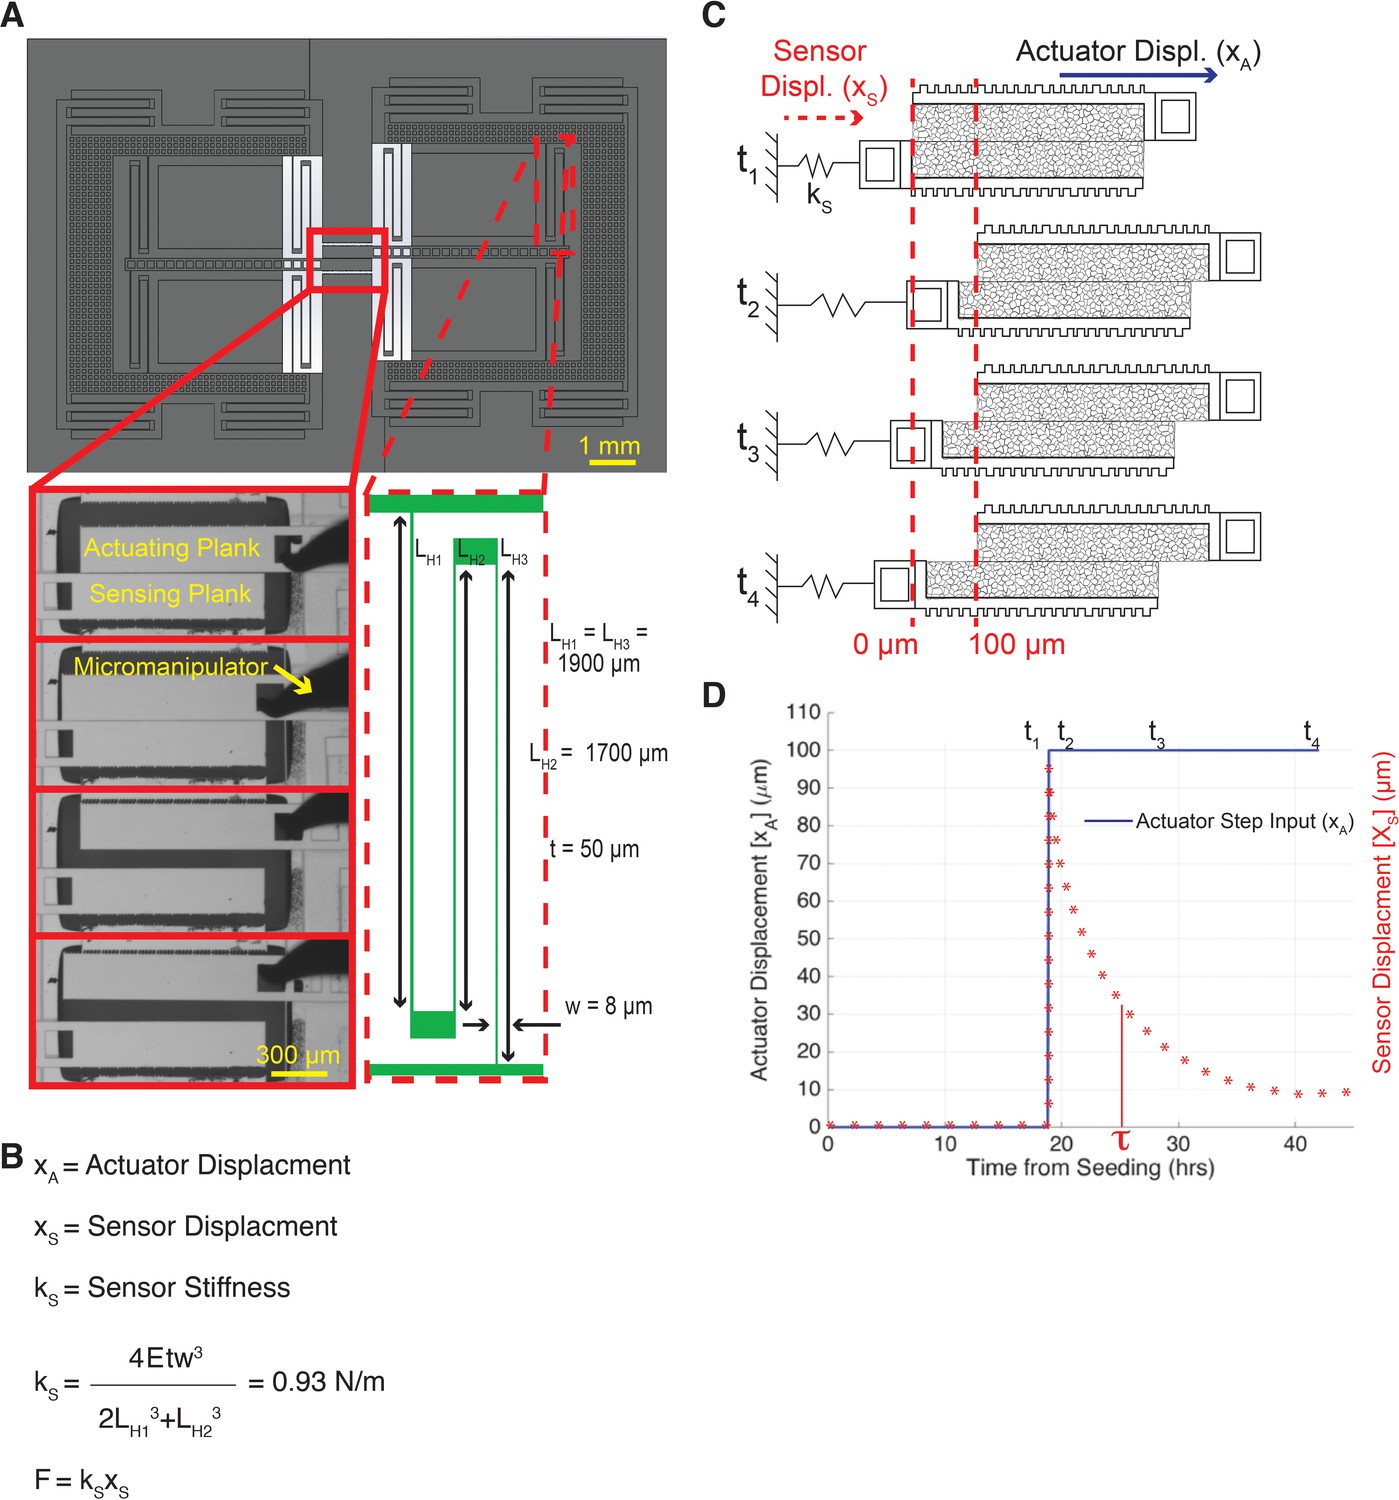
A silicon device for force sensing and the application of in-plane shear to a cell monolayer.
(A) The shear device consisted of two 250 μm x 1000 μm planks that were positioned adjacent to each other using a needle connected to a 3-axis micromanipulator to apply x- and y- displacements of the actuating plank. The spring-suspended, sensing plank was used to infer force. Four folded flexures were used to provide stability and force sensing for each actuator and each sensor in the shear direction, respectively (2017 IEEE. Reprinted, with permission, from (Sadeghipour et al., 2017)). (B) The equation used to calculate the stiffness (0.93 N/m) of the device in the shear direction. The in-plane Young’s Modulus (E) of silicon is 169 GPa, and the other components are width (w), length (L), and thickness (t) of the flexures. The numerator is multiplied by four (number of folded flexures in parallel), and the denominator adds the three components of each flexure in series. F is calculated by multiplying the stiffness of the sensing arm (kS) by its x-displacement (xS). (C) In all experiments, the actuating plank is displaced 100 μm in the x-direction (xA), yielding in-plane shear of the monolayer at the mid-plane. The sensing plank changes position (xS) only via deformation of the monolayer that was contiguous with the actuating plank. (D) Displacements of the actuating (blue line) and sensing (red *) planks over time. t1-t4 refer to positions depicted in ; Figure 1—figure supplement 1C.
© 2017 IEEE. Figure 1—figure supplement 1A and C reprinted with permission, from Sadeghipour et al., 2017.
Figure 1—figure supplement 2
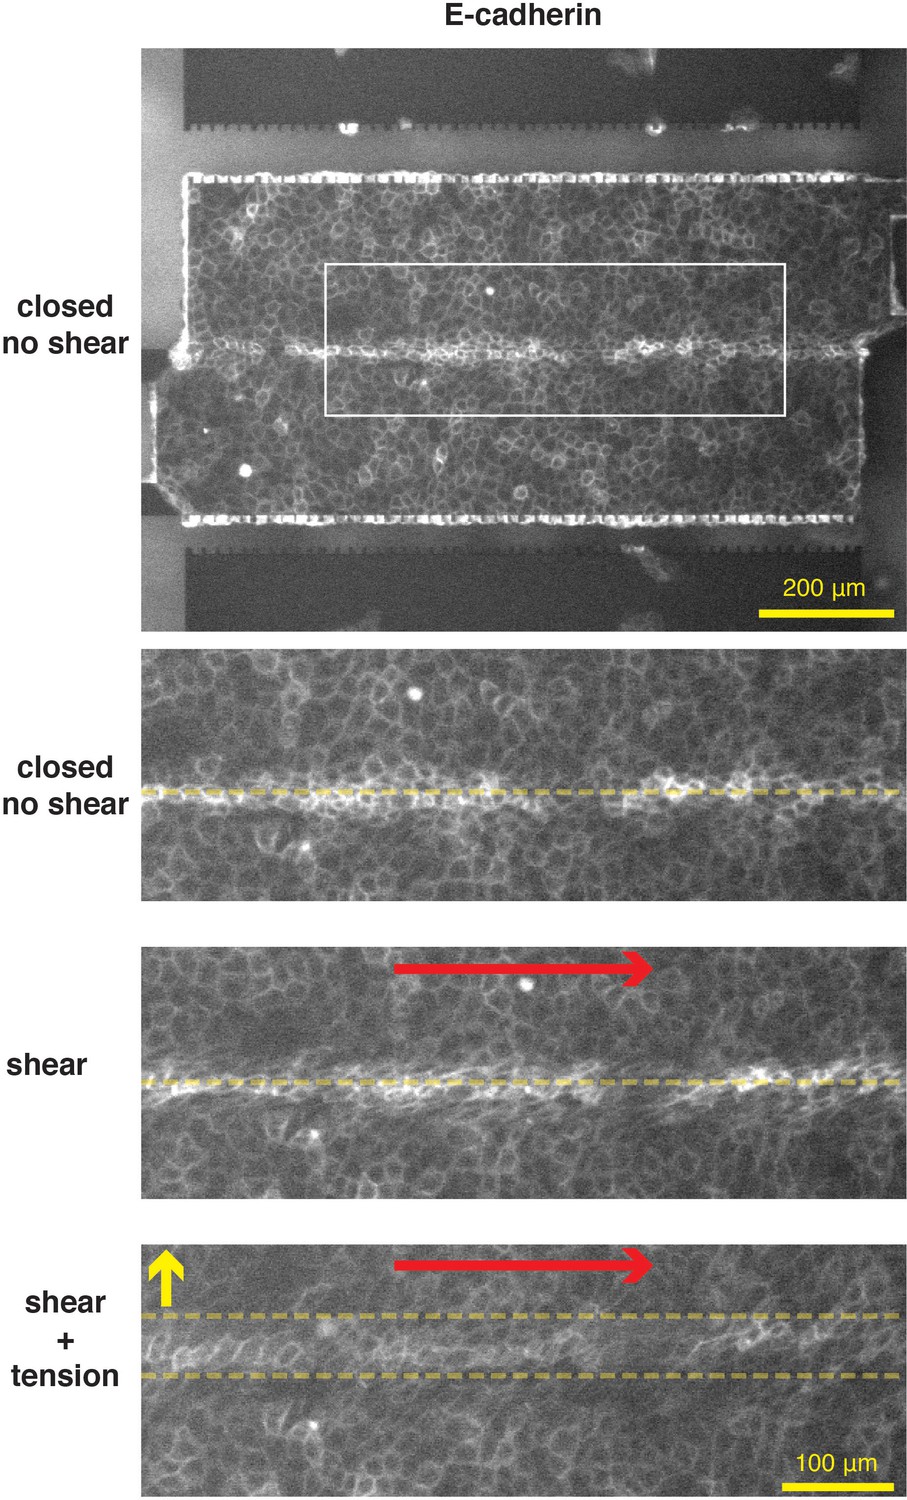
MDCK E-cadherin:DsRed cell monolayers before and after shear plus tension show the monolayer remains intact.
MDCK E-cadherin:DsRed cell monolayers were sheared by 100 μm displacement of the top plank, red arrow, followed by a tensile displacement of 50 μm, yellow arrow. Yellow dashed lines represent the edges of the top and bottom planks. The cell monolayer is suspended over a gap between the planks without rupture, bottom panel.
Figure 1—figure supplement 3
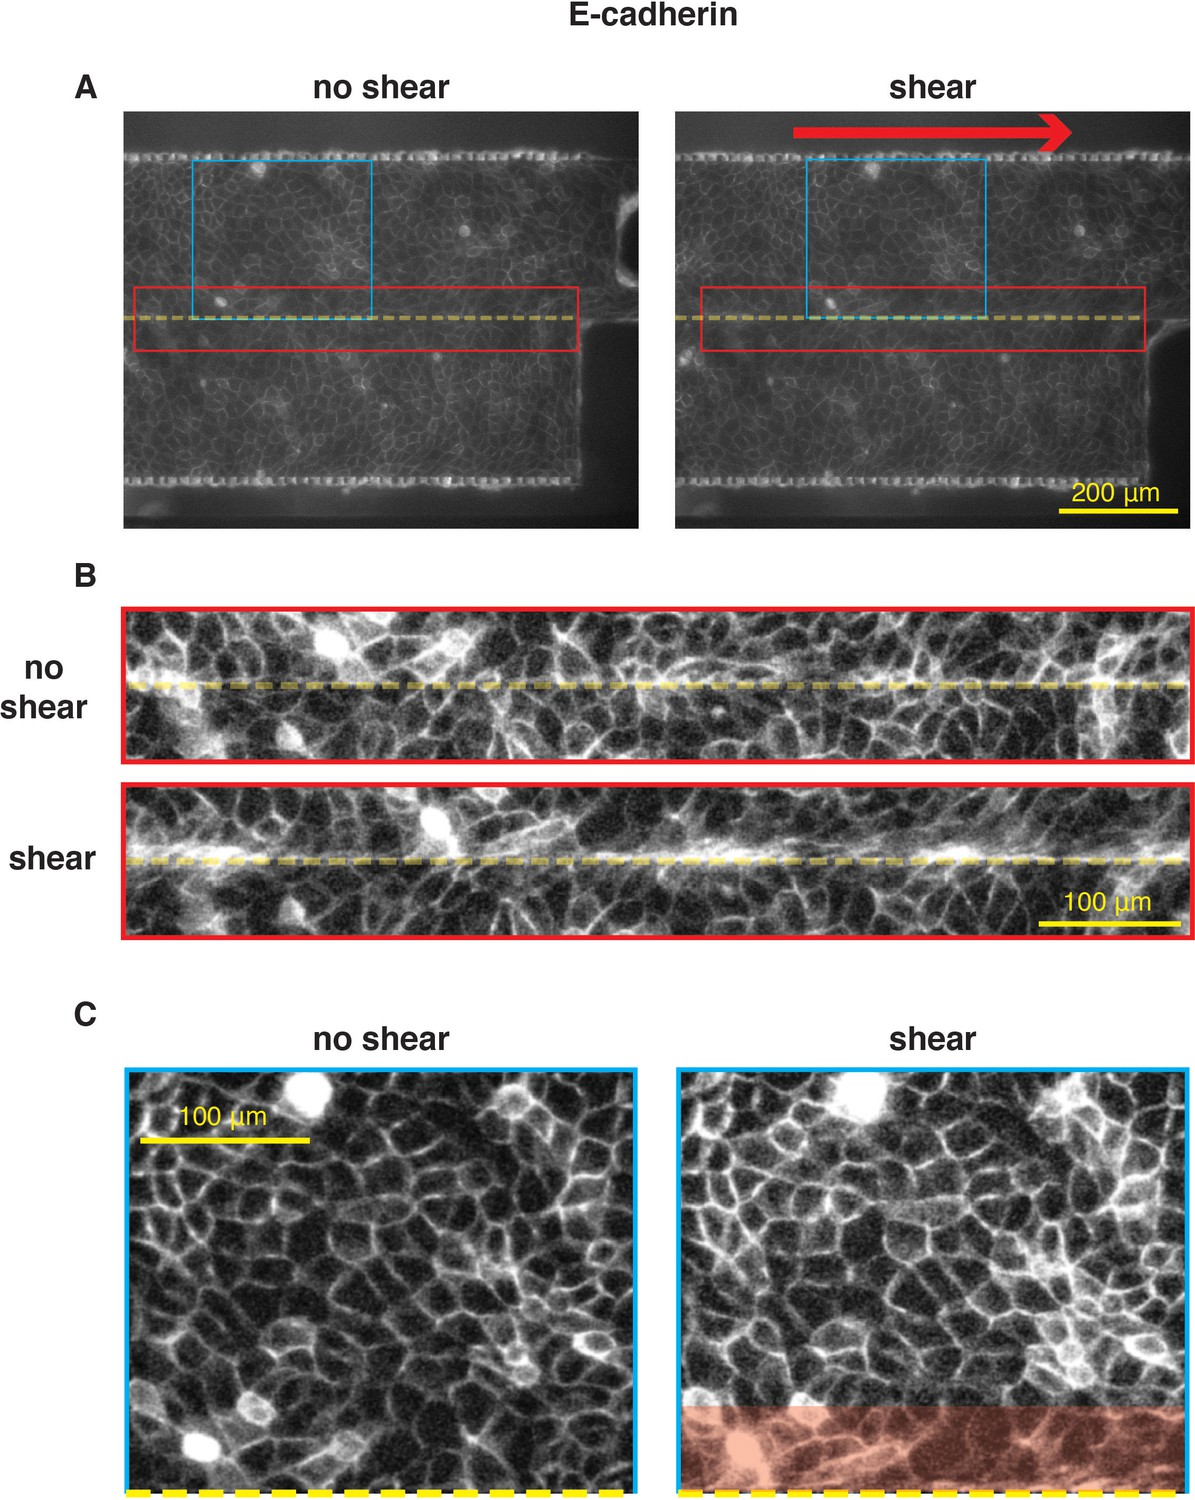
MDCK E-cadherin:DsRed cell monolayers before and after shear show deformation localized to the shear plane.
Example frames of MDCK E-cadherin:DsRed cell monolayers on a shear device before and after shear. Images were taken as described in methods and materials. (A) full 10x images with the shear zone outlined with a red box and the middle third of the top cell plank outlined with a blue box. Red arrow denotes the direction of shear by the displacement of the top plank. (B) contrast enhanced image of the shear zone region before and after shear from the red box in A). (C) contrast enhanced image of the middle third region of the top plank before and after shear from the blue box in A). Red highlighted region in the shear frame marks deformed cells at the shear zone while the rest of the monolayer remained the same immediately after shear. Yellow dashed line is the interface of the top and bottom planks.
Figure 1—figure supplement 4
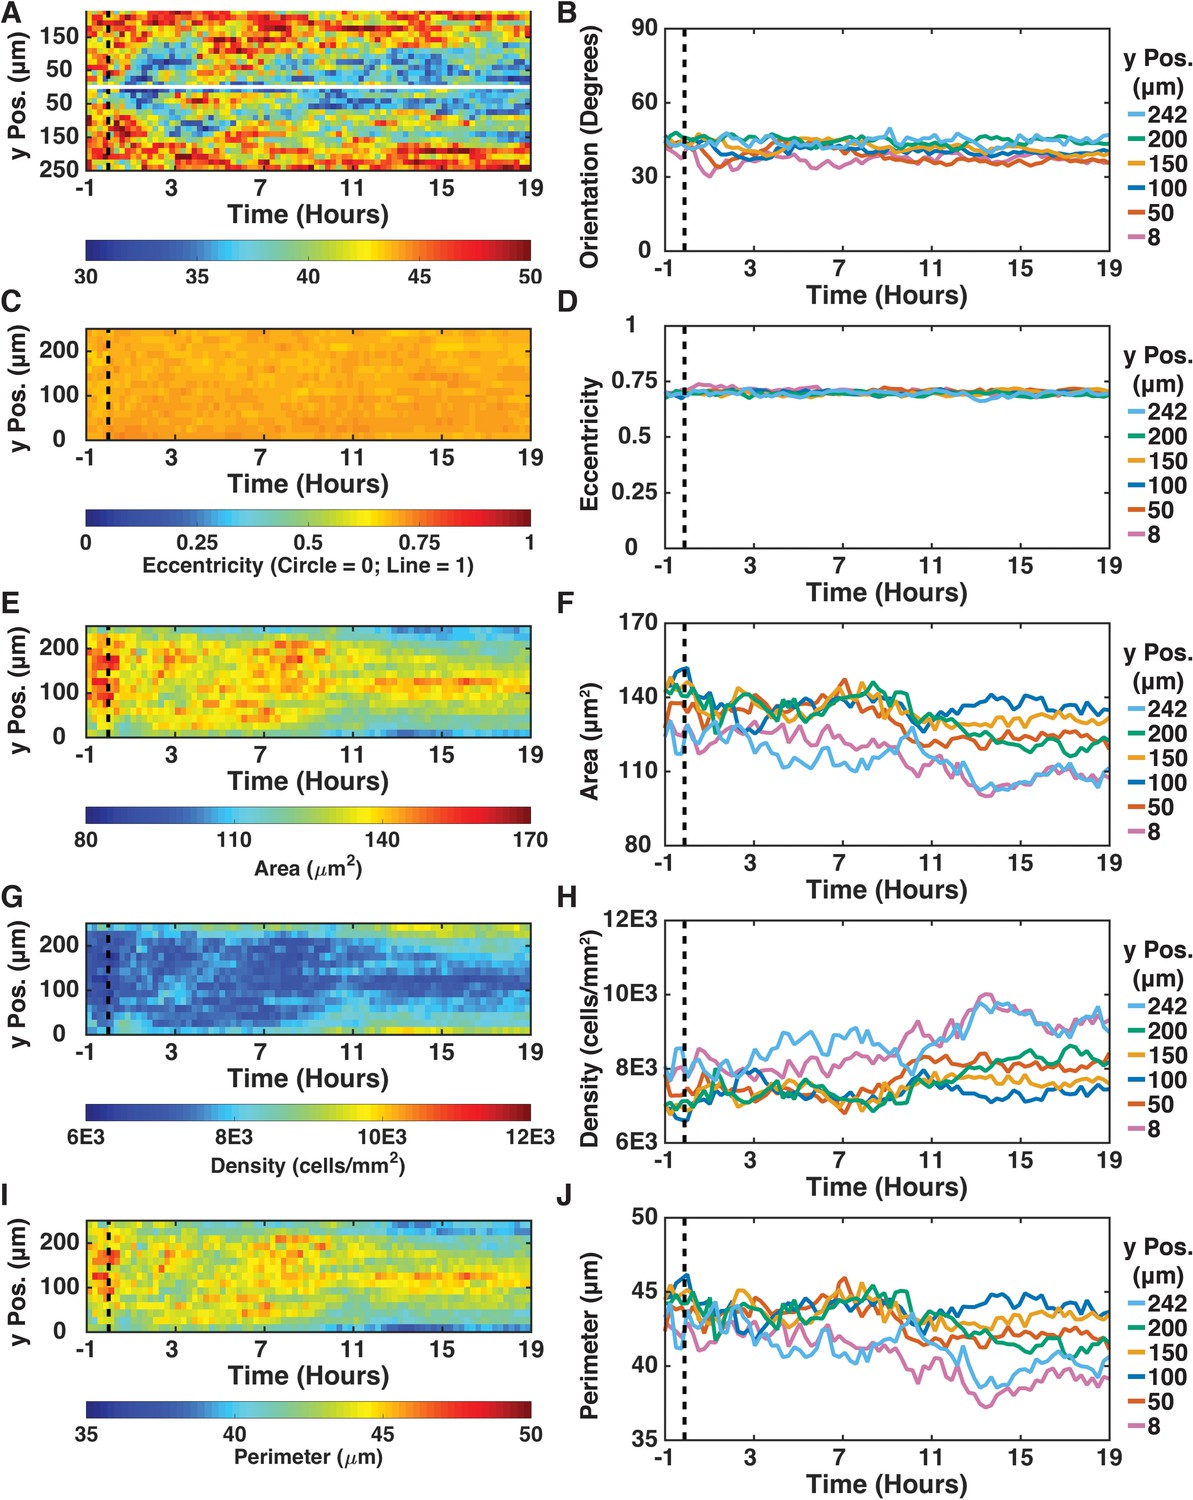
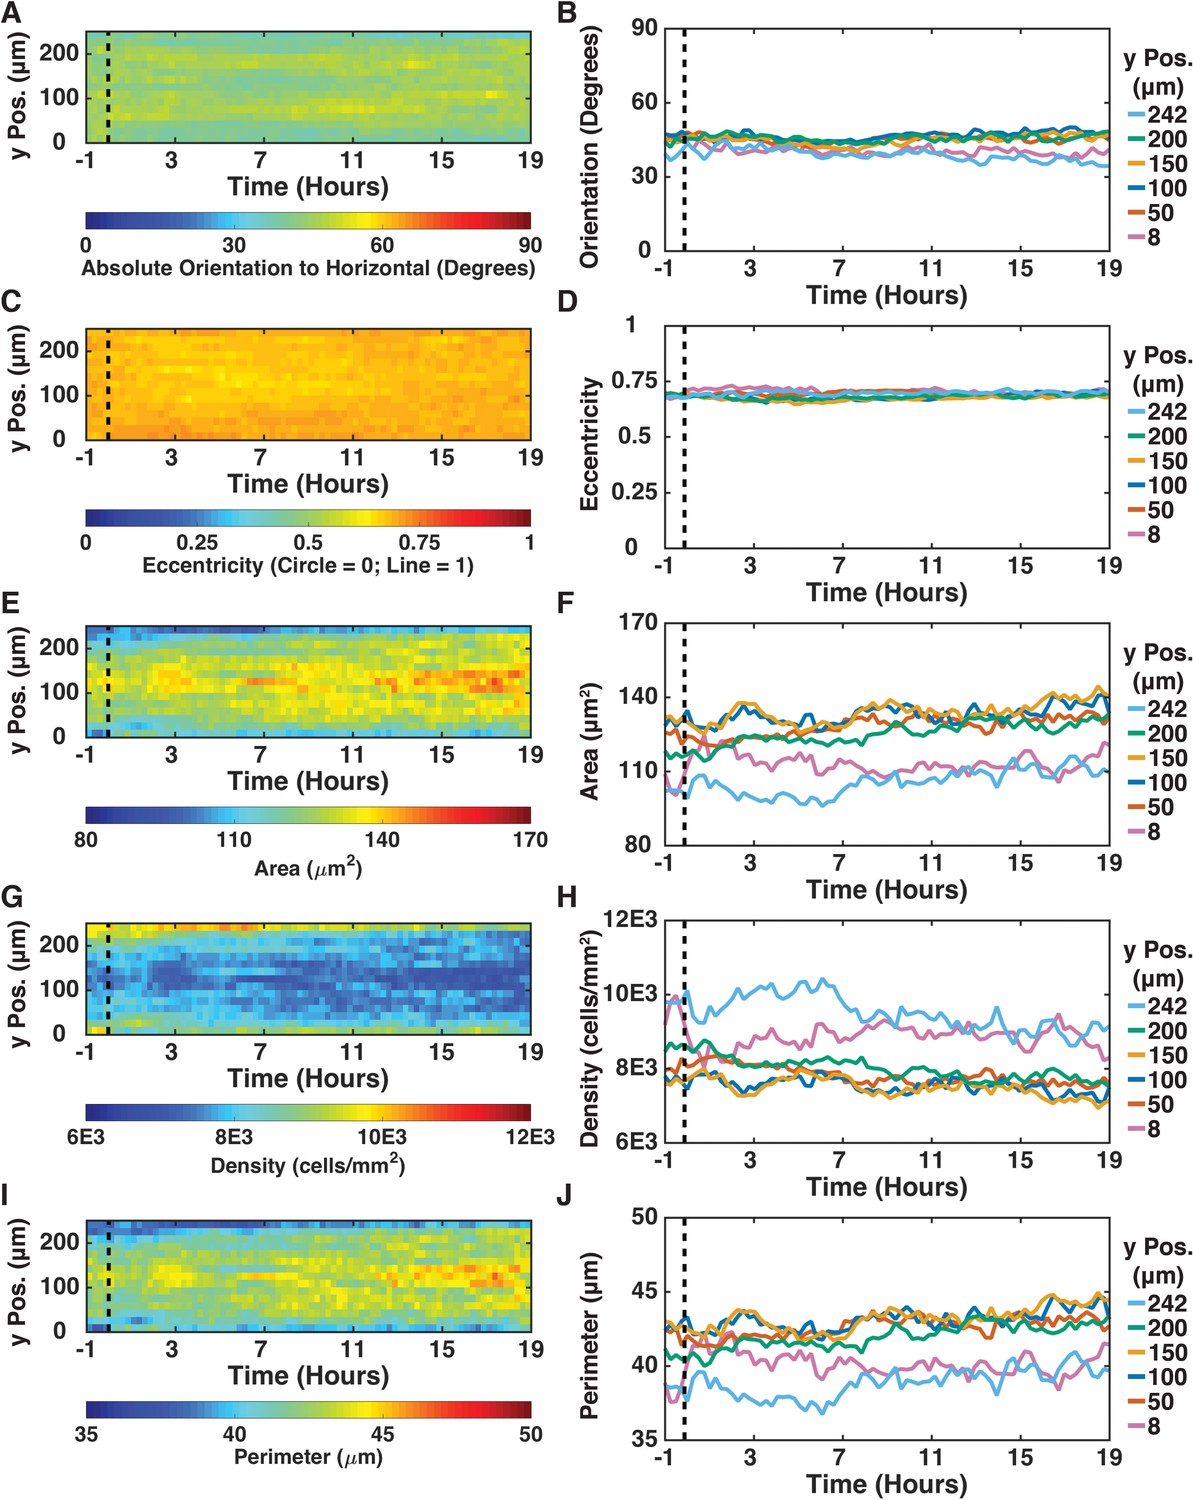
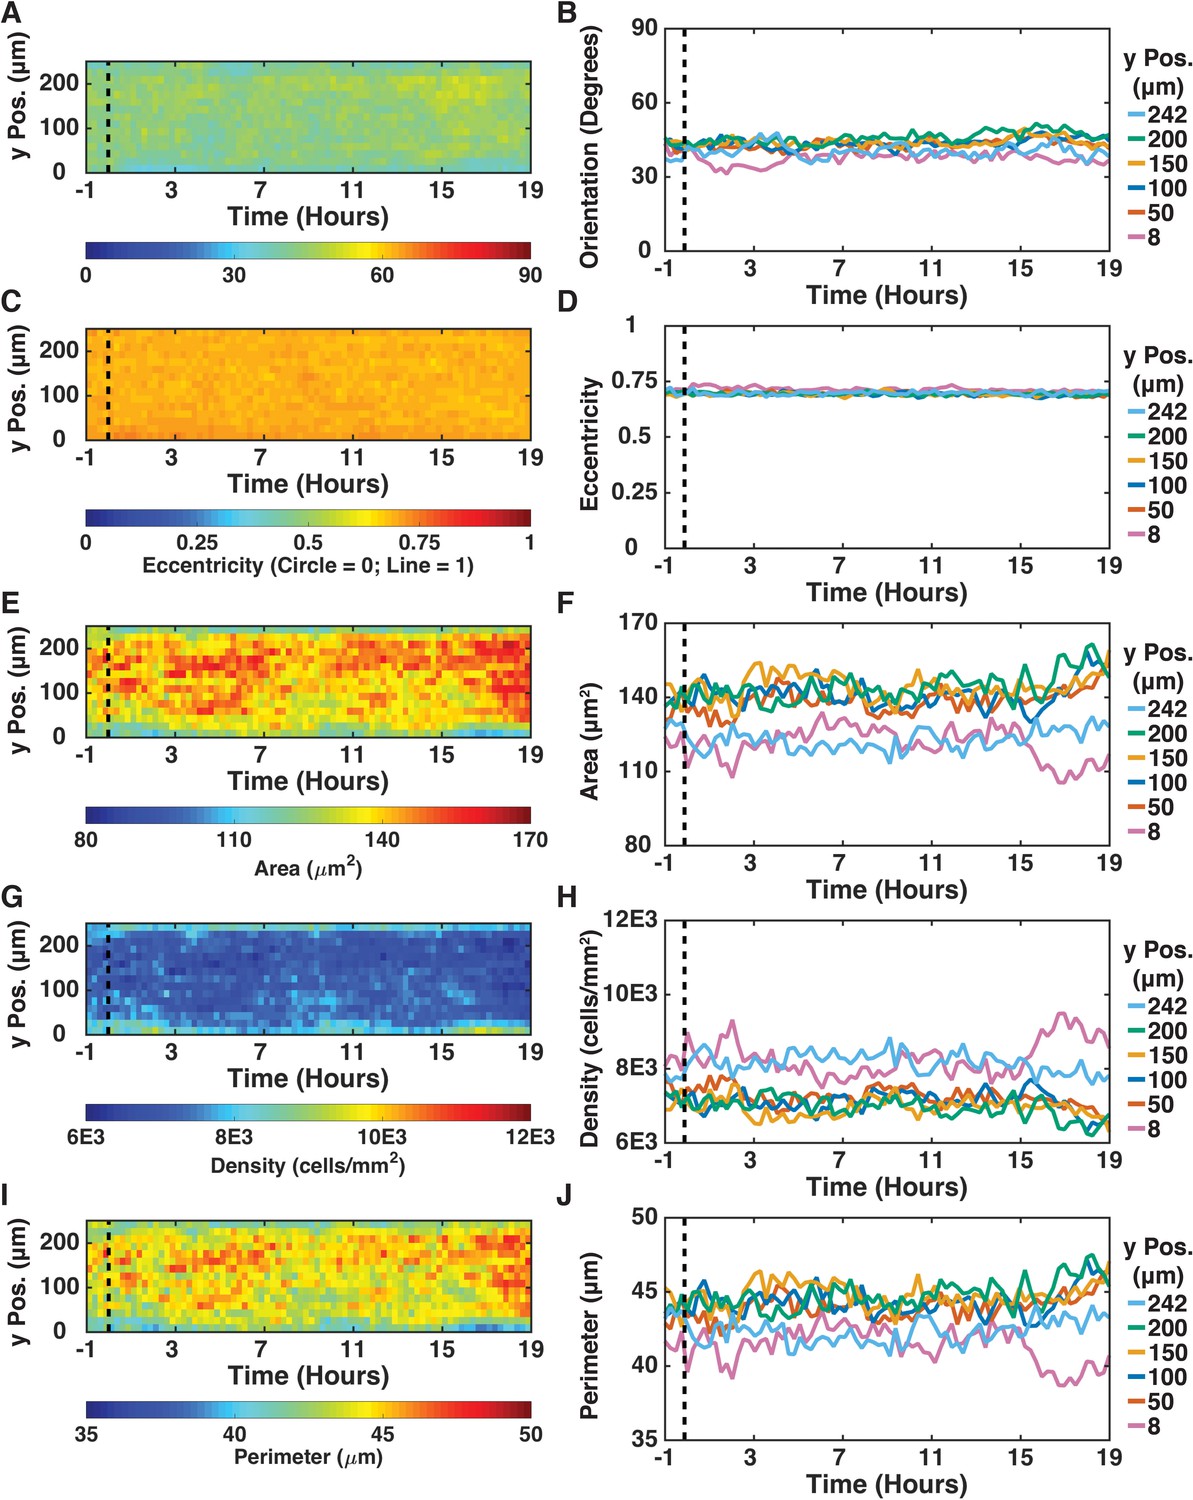
Cell orientation, eccentricity, area, density, and perimeter over time after shear did not match the periodicity of y-direction oscillations.
(A, C, E, G, I) Kymographs of cell orientation (A), eccentricity (C), area (E), density (G), and perimeter (I), based on the cell segmentation of MDCK E-cadherin:DsRed cells in the control + Shear (dashed black line) condition (Figure 1D–G). Kymographs are from three independent experiments with 15 min binning of 3 × 5 min cell segmentation data (similar to Figure 1). (B, D, F, H, J) Line plots of cell orientation (B), eccentricity (D), area (F), density (H), and perimeter (J), at positions 8, 50, 100, 150, 200, and 242 μm from the shear-plane.
Figure 1—figure supplement 5

High-magnification of MDCK E-cadherin:DsRed cells at the shear plane shows no change in E-cadherin asymmetry or recruitment upon shear.
MDCK E-cadherin:DsRed cells were imaged on the Leica DM-RXA2 upright microscope with a Leica 63x water immersion objective. The frames for the moment of shear where taken at 200 ms intervals and binned 2 × 2 for fast acquisition, panels 0 min before and after shear. The 10 and 45 min frames were taken from a series of images at 1 min intervals, with 500 ms exposures, were not binned, and we used Micromanager’s autofocus. Red arrow represents the direction of shear from displacement of the top plank. Yellow dashed line represents the interface of the two cell adhesion planks.
Figure 1—figure supplement 6
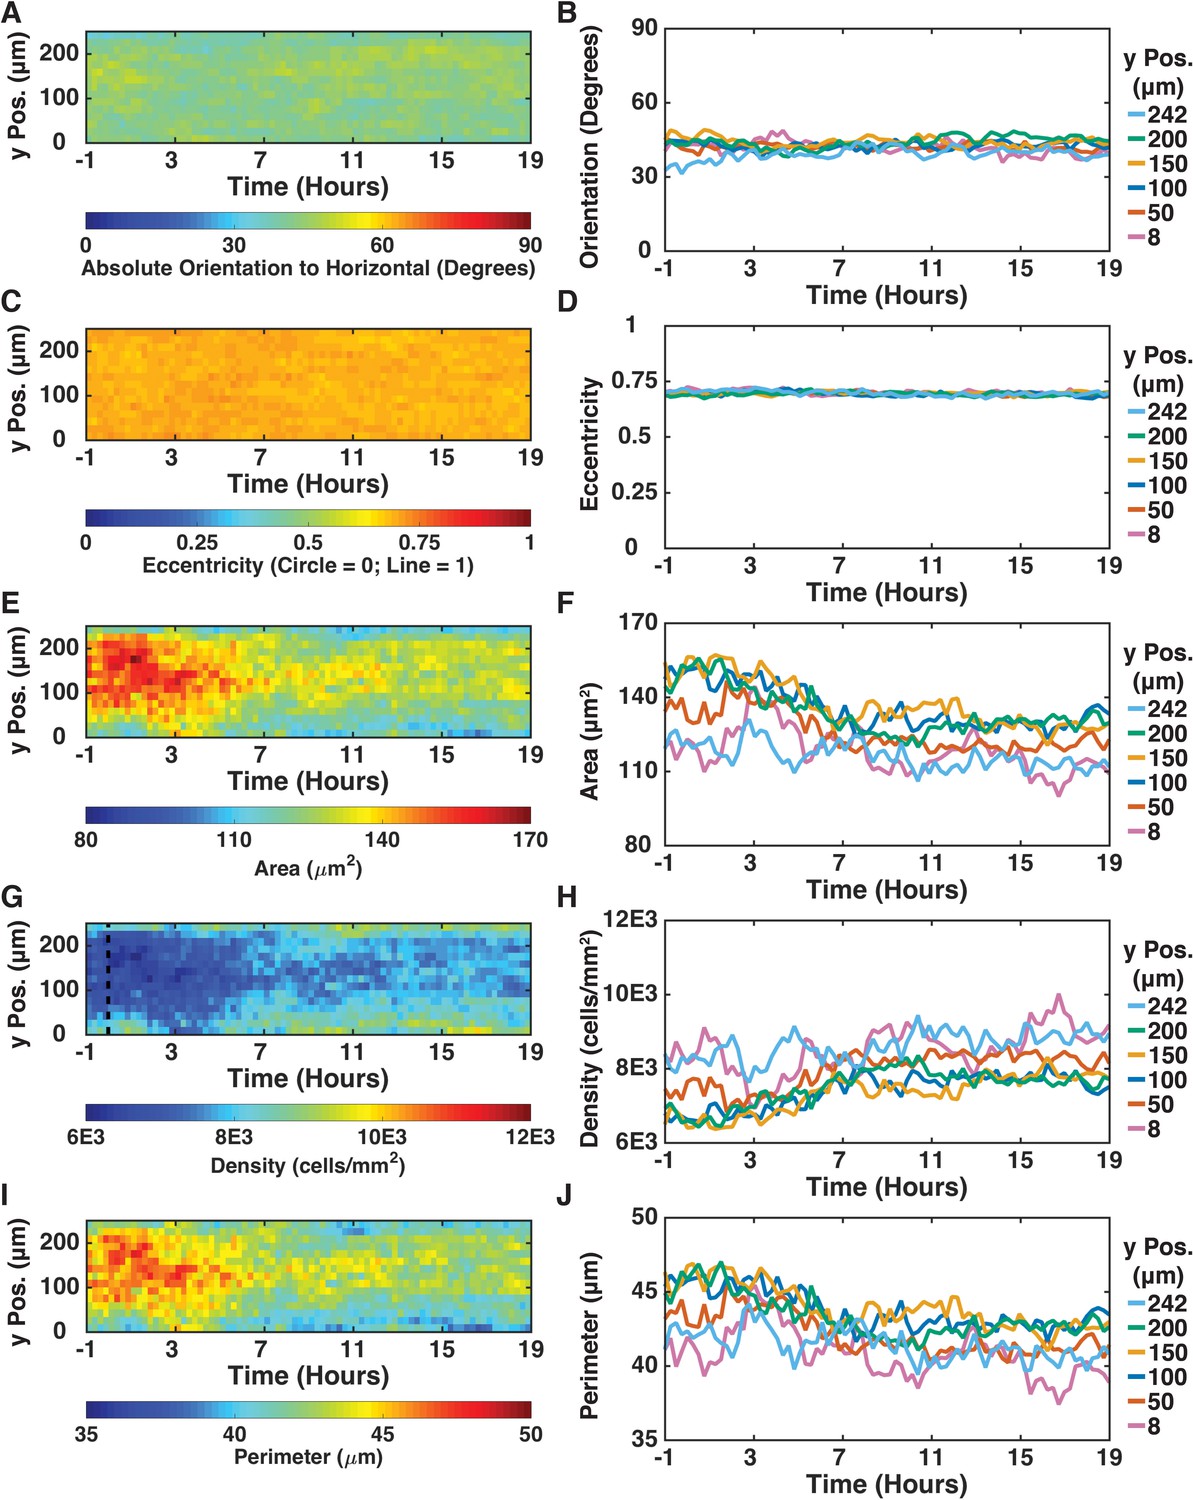
Density of MDCK cells without shear was similar to their density with shear.
(A, C, E, G, I) Kymographs of cell orientation (A), eccentricity (C), area (E), density (G), and perimeter (I), based on the cell segmentation of MDCK E-cadherin:DsRed cells in the -Shear condition (Figure 1H–K). Kymographs are from three independent experiments with 15 min binning of 3 × 5 min cell segmentation data (similar to Figure 1). (B, D, F, H, J) Line plots of cell orientation (B), eccentricity (D), area (F), density (H), and perimeter (J), at positions 8, 50, 100, 150, 200, and 242 μm from the shear-plane.
Figure 1—figure supplement 7
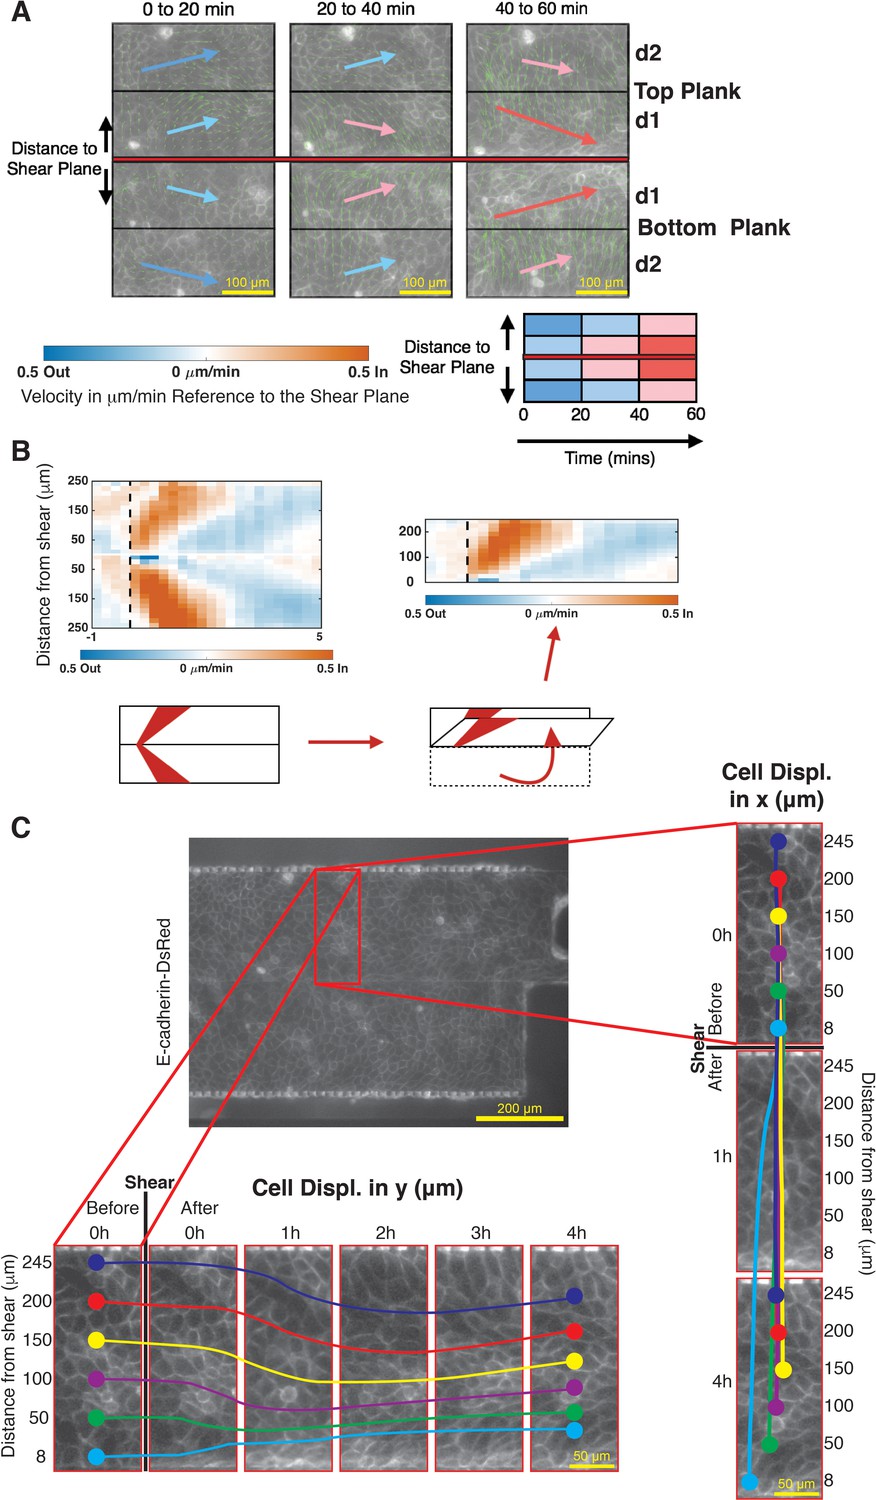
Velocity kymographs and cell-displacement plots generated from PIV data.
(A) MDCK E-cadherin-DsRed cell movements were detected between two time points using PIV. Top and bottom are relative to the shear-plane (red bar), and images were divided spatially from the shear-plane to the edge of each plank (d1 and d2). PIV velocity vectors (green arrows) were averaged per divided distance from the shear-plane over time and weighted based on cell velocities and movements inward (red) or outward (blue) from the shear-plane. Velocity kymographs were generated by plotting the averaged weighted values as pixels over time with reference to the shear-plane. (B) Velocity kymograph of cell movements in the y-direction relative to the shear-plane 1 hr before shear (dashed black line) and 5 hr after shear. Symmetrical data for x- and y-direction movements for all experiments were folded with reference to the shear-plane to generate velocity kymographs to combine data from both top and bottom planks. (C) Representative images of x- and y-direction cell movements based on numerical integration of y- and x-velocity kymographs over time at positions 8, 50, 100, 150, 200, and 242 μm from the shear-plane.
Figure 2 with 2 supplements
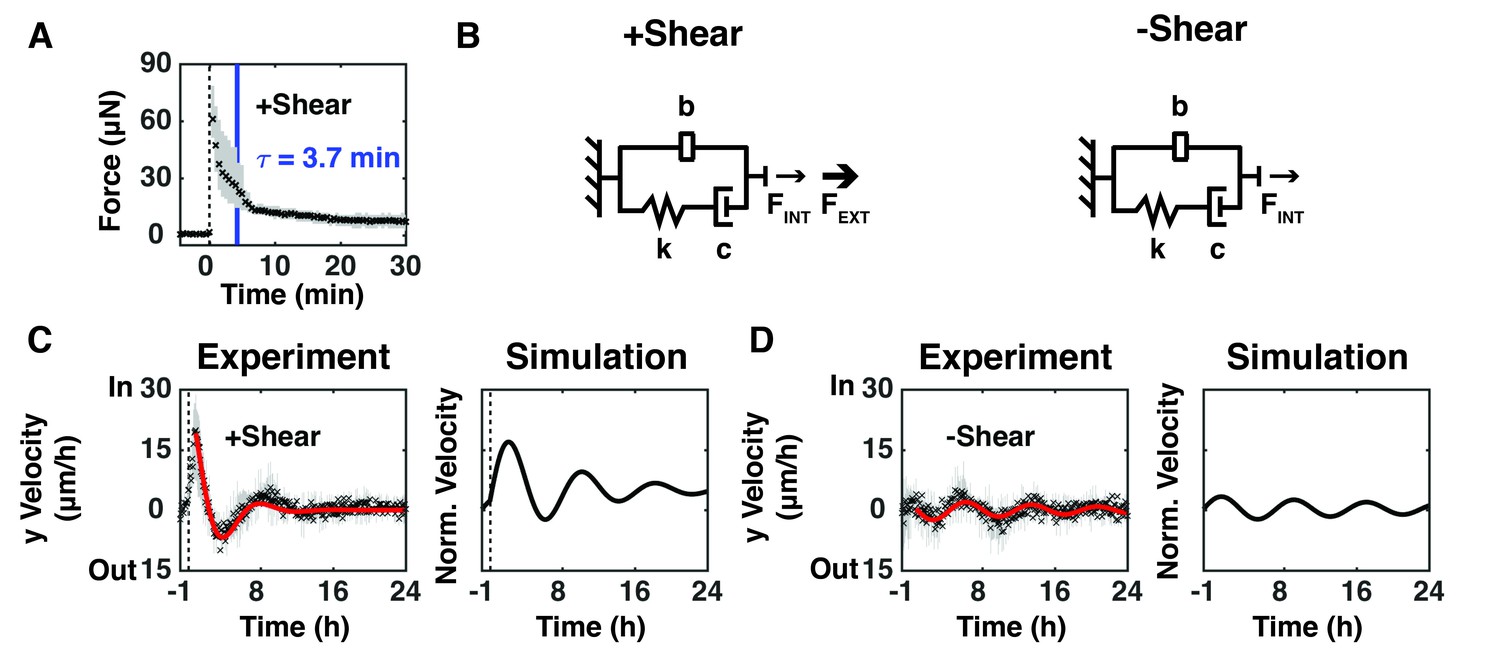
Epithelium oscillated over tens of hours to dissipate force imbalance generated by intrinsic or extrinsic shear forces.
(A) The measured resistive force of the epithelium over 30 min in response to 100 μm shear displacement for +Shear relaxed with an exponential decay characteristic of a viscoelastic material (dashed line, time of shear; solid blue bar, 63.2% decay time constant τ; Figure 2—figure supplement 1). (B) The model captures mechanical properties of the epithelium as stiffness (k) and damping (c) elements in series with each other and in parallel with a mechanical signal storage and relay element (b). FINT represents the intrinsic shear force of the epithelium and FEXT represents the extrinsically applied shear force. (C, D) (Experiment) Unbinned (5 min) y-velocity kymographs for + Shear (Figure 1D) and -Shear (Figure 1H) were averaged in the y-direction to obtain the overall y-direction cell velocities at each time point with (C), dashed black line) or without (D) shear. The range (gray bars) and mean (black cross) of the data come from three independent experiments at each time point. Red lines represent the best fit of an exponentially decaying sinusoidal function (Figure 2—figure supplement 2B) to the average y-direction cell velocity for +Shear and -Shear conditions. (Simulation) Normalized output of the MATLAB Simulink/Simscape simulation for the mechanical model (Figure 2—figure supplement 1).
Figure 2—figure supplement 1

Simulation of mechanics of local cell deformation and global cell behavior.
(A) MATLAB Simulink/Simscape simulation of the mechanical model used an ideal motion sensor to measure the velocity of the stiffness (spring) and damping (damper) elements in parallel with the force storage and relay (inerter) element when subjected to a step input in internal force (at −1 hr) and external force (at 0 hr) from an ideal force source. The velocity data output by the simulation were normalized (divided by 1000) to match the scale of experimental velocity. (B) Values used for elements of the mechanical model to run MATLAB Simulink/Simscape simulations in Figures 2C, D, 3G, N and 4G; variables were stiffness (k), damping (c), force storage and relay (b), internal shear force (FINT), and external shear force (FEXT).
Figure 2—figure supplement 2
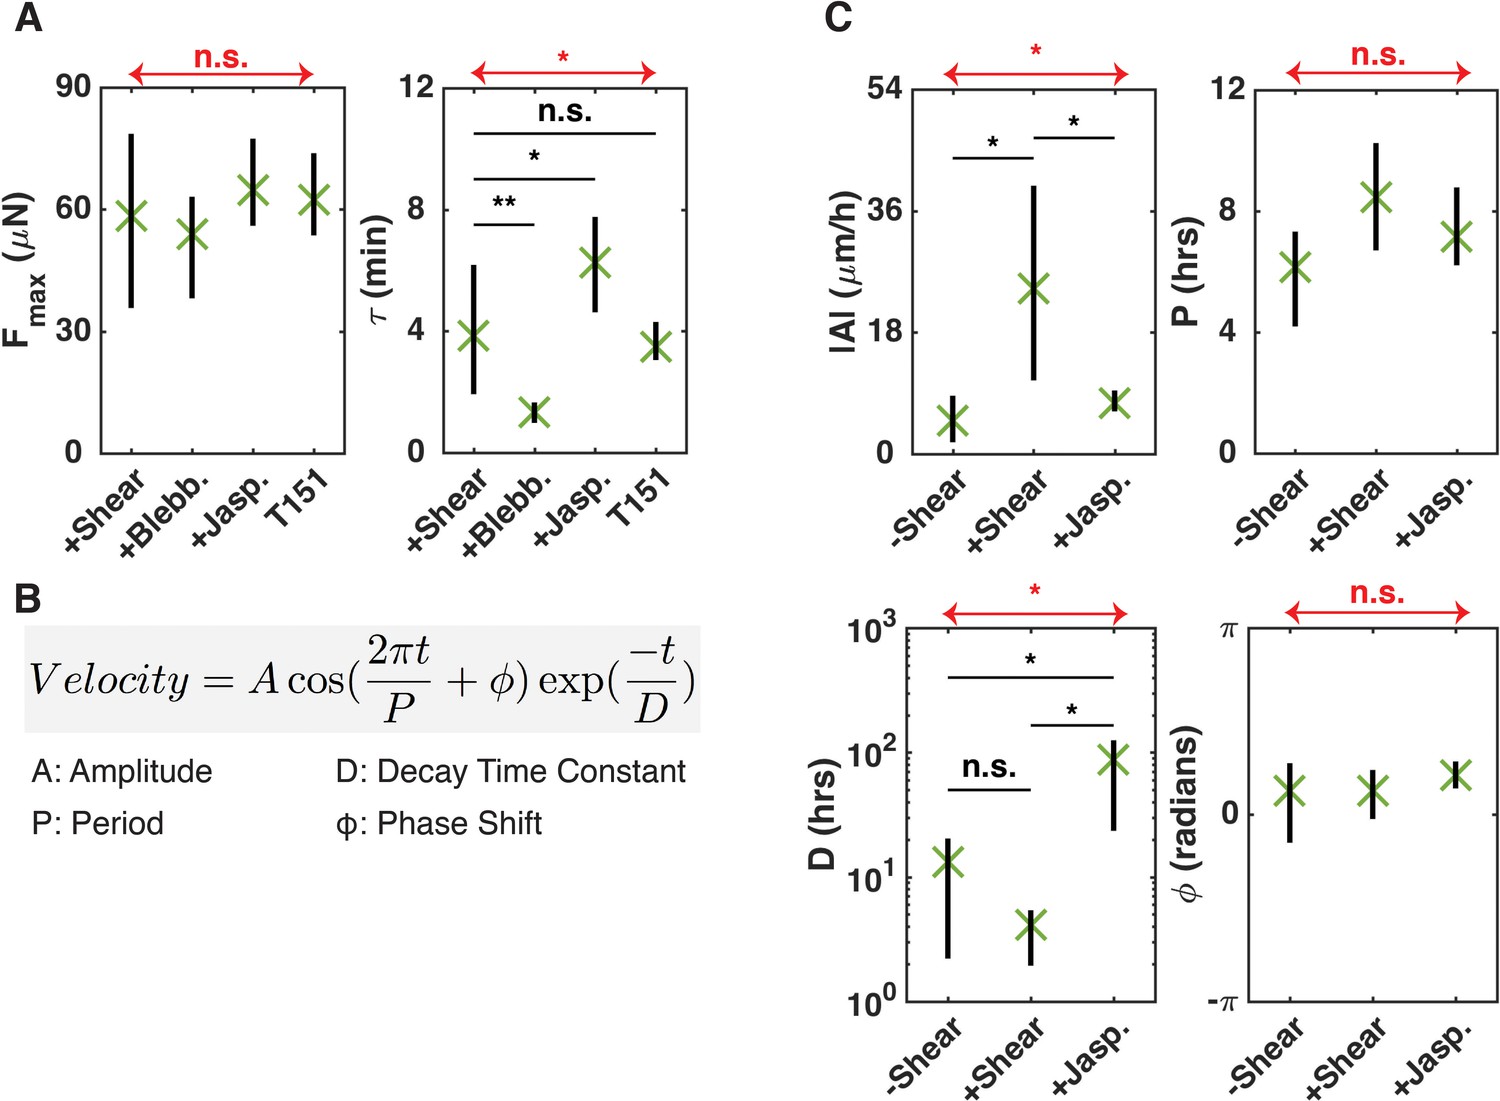
Statistical analysis of FMAX, τ, and components of exponentially damped sinusoidal function from all experimental conditions.
(A) The range (vertical black line) and mean (green X) of 6 (+Shear) or 3 (+Blebb,+Jasp, T151) independent shear experiments. Force relaxation data from the addition of blebbistatin after shear (Figure 1—figure supplement 7) were combined with the control + Shear. Using the Kruskal-Wallis test (red horizontal arrows), differences in 63% time constant (τ) were statistically significant (p<0.05), but differences in maximum force (FMAX) were not. Mann-Whitney U tests (black horizontal lines) showed that blebbistatin decreased τ (p<0.01), jasplakinolide increased τ (p<0.05), and T151 cells did not change τ. (B) The default MATLAB least squares fit function was used to fit an exponentially damped sinusoidal function with constitutive components of amplitude (A), period (P), decay time (D), and phase shift (Φ) to the average y-direction velocity. (C) Range (vertical black line) and mean (green X) of the constitutive components of an exponentially damped sinusoidal function (Figure 2—figure supplement 2B) for three independent experiments in control -Shear, control + Shear, and +Jasp conditions. Using the Kruskal-Wallis test (red horizontal arrows), differences in the amplitude (A) and decay time (D) were statistically significant (p<0.05), but differences in period (P) or phase shift (Φ) were not. Mann-Whitney U tests (black horizontal lines) showed that shear increased the amplitude (A) of the damped oscillator (p<0.05). Jasplakinolide lowered this value (p<0.05), but increased the decay time constant (D) by an order of magnitude compared to the control + Shear (p<0.05) and -Shear (p<0.05) cells.
Figure 3 with 2 supplements
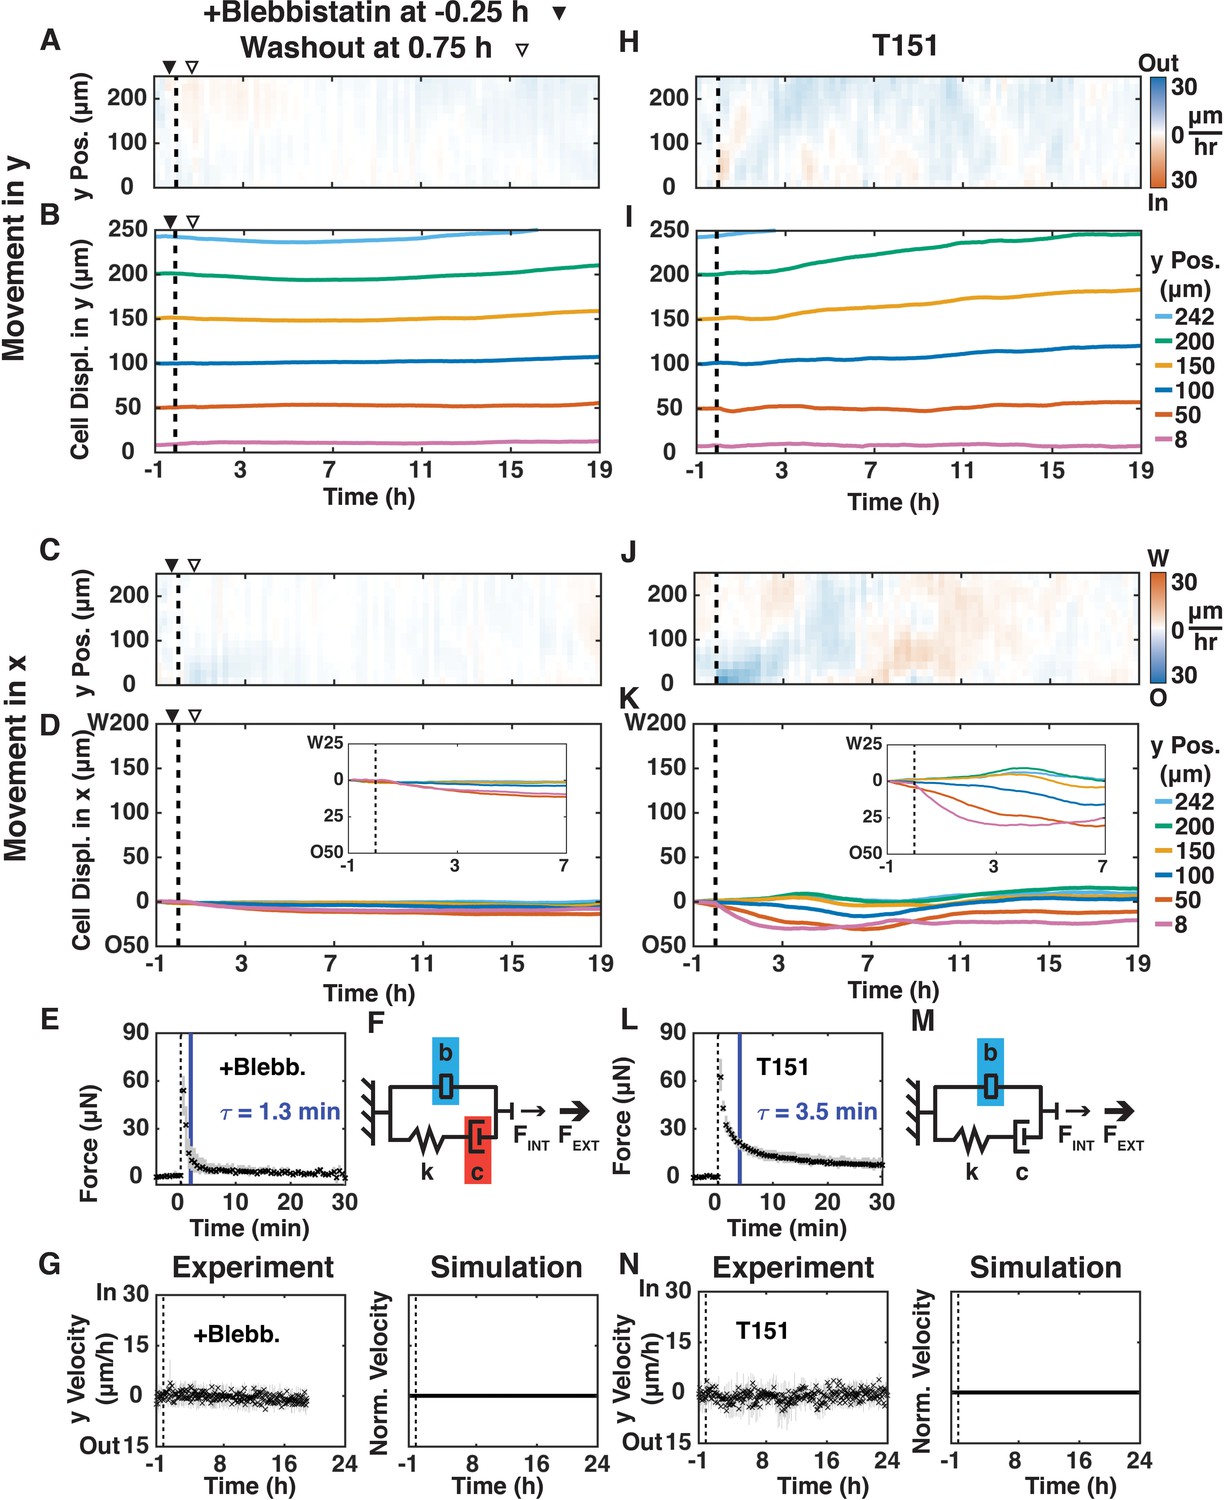
Disrupting actomyosin contraction with blebbistatin or loss of E-cadherin-mediated extracellular adhesion disrupted shear-induced y-direction cell oscillations.
(A, C, H, J) y- (A, H) and x-velocity (C, J) kymographs from three independent experiments with 15 min binning of three 5 min PIV data of movements of MDCK E-cadherin:DsRed cells treated with 50 μM blebbistatin (+Blebb) (A, C) or of MDCK T151 cells (H, J) and sheared (dashed black line) over 20 hr. (A–D) Blebbistatin was added 15 min before shear (filled arrowhead) and washout one hour later (empty arrowhead). (B, D, I, K) y- (B and I) and x-direction (D and K) cell movements at positions 8, 50, 100, 150, 200, and 242 μm from the shear-plane for +Blebb MDCK cells (B, D) and T151 cells (J, K), with insets providing greater spatial resolution of passive movement in the deformation zone (D and K, insets). (E, L) Measured resistive force of the epithelium over 30 min in response to 100 μm shear displacement for +Blebb MDCK cells (E) and T151 cells (L) (dashed line, time of shear; solid blue bar, 63.2% decay time constant τ; Figure 2—figure supplement 2). (F, M) Values of the mechanical model elements presented in Figure 2B (+Shear) were increased (blue) or decreased (red) to capture the mechanics and movement of the epithelium. (G, N) (Experiment) Unbinned (5 min) y-velocity kymographs for +Blebb MDCK cells (G) and T151 cells (N) were averaged in the y-direction to obtain the overall y-direction cell velocities at each time point with shear (dashed black line). The range (gray bars) and mean (black crosses) of three independent experiments at each time point (E, G, L, N) are shown. (Simulation) Normalized output of the MATLAB Simulink/Simscape simulation for the mechanical model (Figure 2—figure supplement 1). Kymograph assembly, color maps, data binning, and numerical integration over time were as in Figure 1.
Figure 3—figure supplement 1
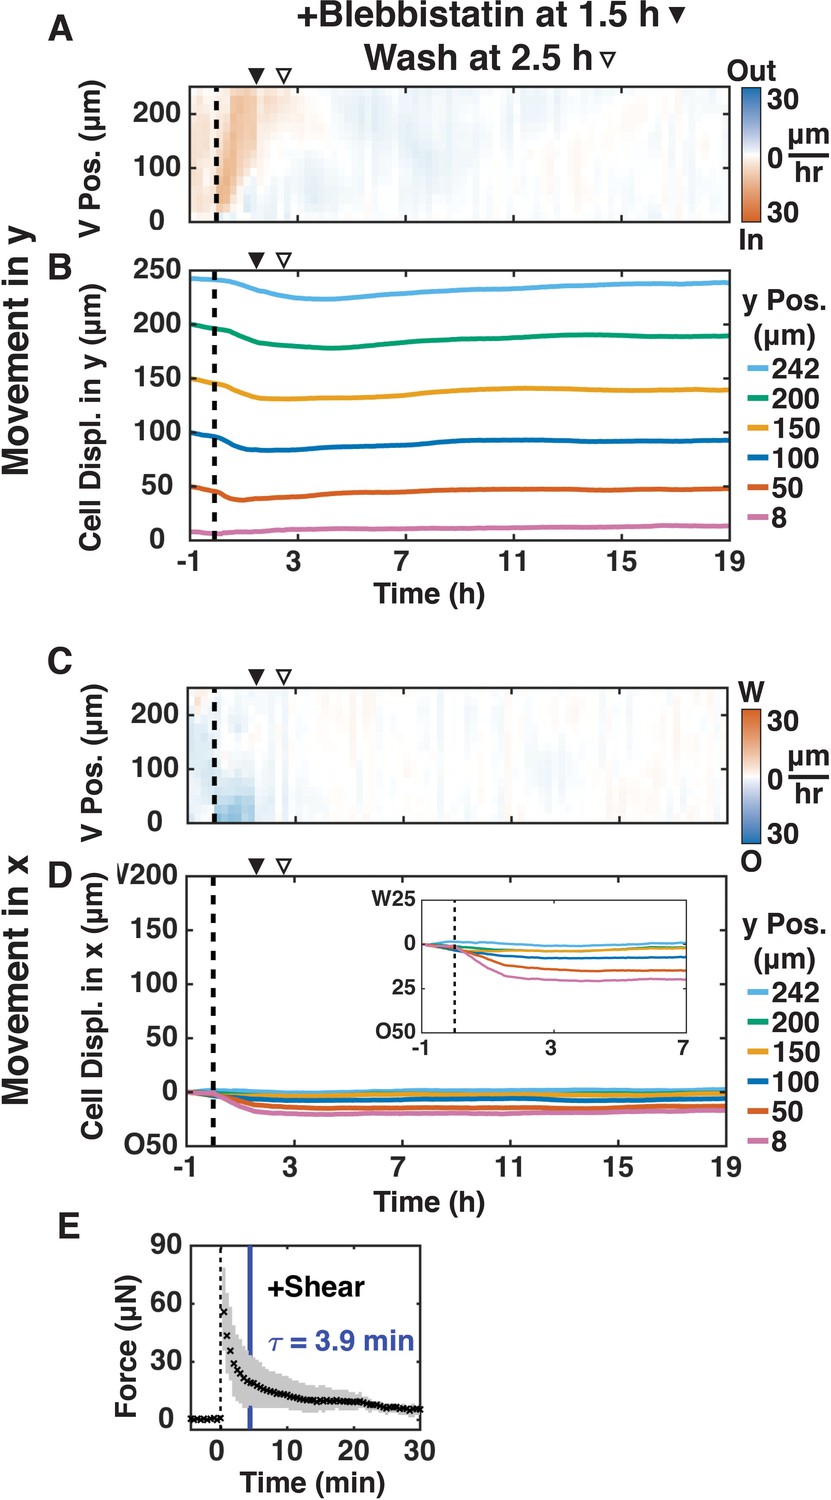
Disrupting actomyosin contraction with blebbistatin blocked and prevented recovery of shear-induced y-direction oscillations.
(A, C) y- (A) and x-velocity (C) kymographs from three independent experiments with 15 min binning of three 5 min PIV data of cell movements of MDCK E-cadherin:DsRed cells treated with 50 μM blebbistatin and sheared (dashed black line) over 20 h. (A–D) Blebbistatin was added 1.5 h after shear (filled arrowhead) and washed out one hour later (empty arrowhead). (B, D) y- (B) and x-direction (D) cell movements at positions 8, 50, 100, 150, 200, and 242 μm from the shear-plane, with inset providing greater spatial resolution (D), inset). (E) Measured resistive force of the epithelium over 30 min in response to 100 μm shear displacement (dashed line, time of shear; solid blue bar, 63.2% decay time constant τ).
Figure 3—figure supplement 2
Density of cells with blebbistatin was similar to their density without it.
(A, C, E, G, I) Kymographs of cell orientation (A), eccentricity (C), area (E), density (G), and perimeter (I), based on the cell segmentation of MDCK E-cadherin:DsRed cells with blebbistatin 15 min before shear (dashed black line) and washed 1 h later (Figure 3A–D). Kymographs are from three independent experiments with 15 min binning of 3 × 5 min cell segmentation data (similar to Figure 1). (B, D, F, H, J) Line plots of cell orientation (B), eccentricity (D), area (F), density (H), and perimeter (J), at positions 8, 50, 100, 150, 200, and 242 μm from the shear-plane.
Figure 4 with 2 supplements
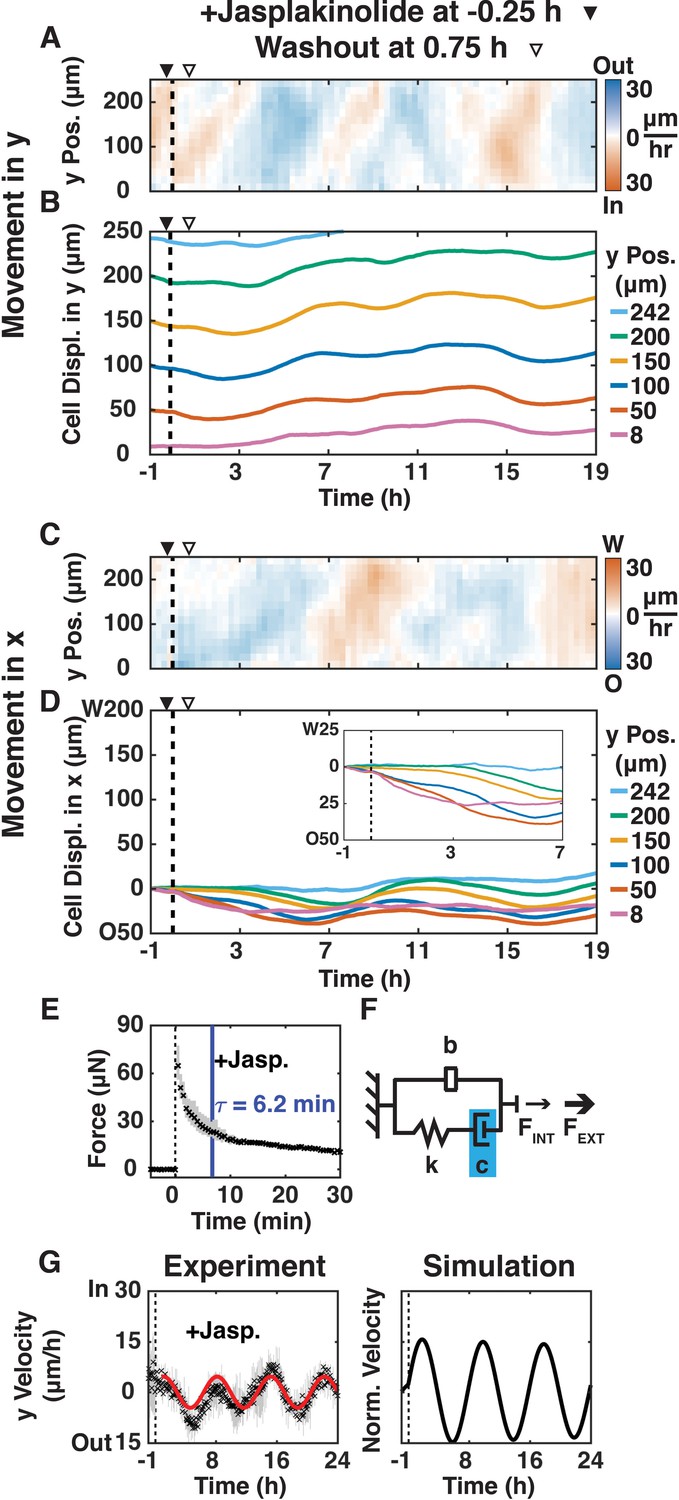
Reducing actin dynamics with jasplakinolide prolonged y-direction oscillations.
(A, C) y- (A) and x-velocity (C) kymographs from three independent experiments with 15 min binning of three 5 min PIV data of cell movements of MDCK E-cadherin:DsRed cells treated with 200 μM jasplakinolide and sheared (dashed black line) over 20 h. (A–D) Jasplakinolide was added 15 min before shear (filled arrowhead) and washout one hour later (empty arrowhead). (B, D) y- (B) and x-direction (D) cell movements at positions 8, 50, 100, 150, 200, and 242 μm from the shear-plane, with inset providing greater spatial resolution (D), inset of movement in the deformation zone. (E) Measured resistive force of the epithelium over 30 min in response to 100 μm shear displacement (dashed line, time of shear; solid blue bar, 63.2% decay time constant τ; Figure 2—figure supplement 2) decayed more slowly than + Shear (Figure 2A), suggesting higher damping. (F) Values of the mechanical model elements in Figure 2B (+Shear) were increased (blue) or decreased (red) to capture the mechanics and movement of the epithelium. (G) (Experiment) Unbinned (5 min) y-velocity kymographs were averaged in y-direction to obtain the overall y-direction cell velocities at each time point with shear (dashed black line). Range (gray bars) and mean (black cross) are shown for three independent experiments at each time point. The red line represents the best fit of an exponentially decaying sinusoidal function (Figure 2—figure supplement 1B) to the average y-direction cell velocity (E, G). (Simulation) Normalized output of the MATLAB Simulink/Simscape simulation for the mechanical model (Figure 2—figure supplement 1). Kymograph assembly, color maps, data binning, and numerical integration over time are as Figure 1.
Figure 4—figure supplement 1
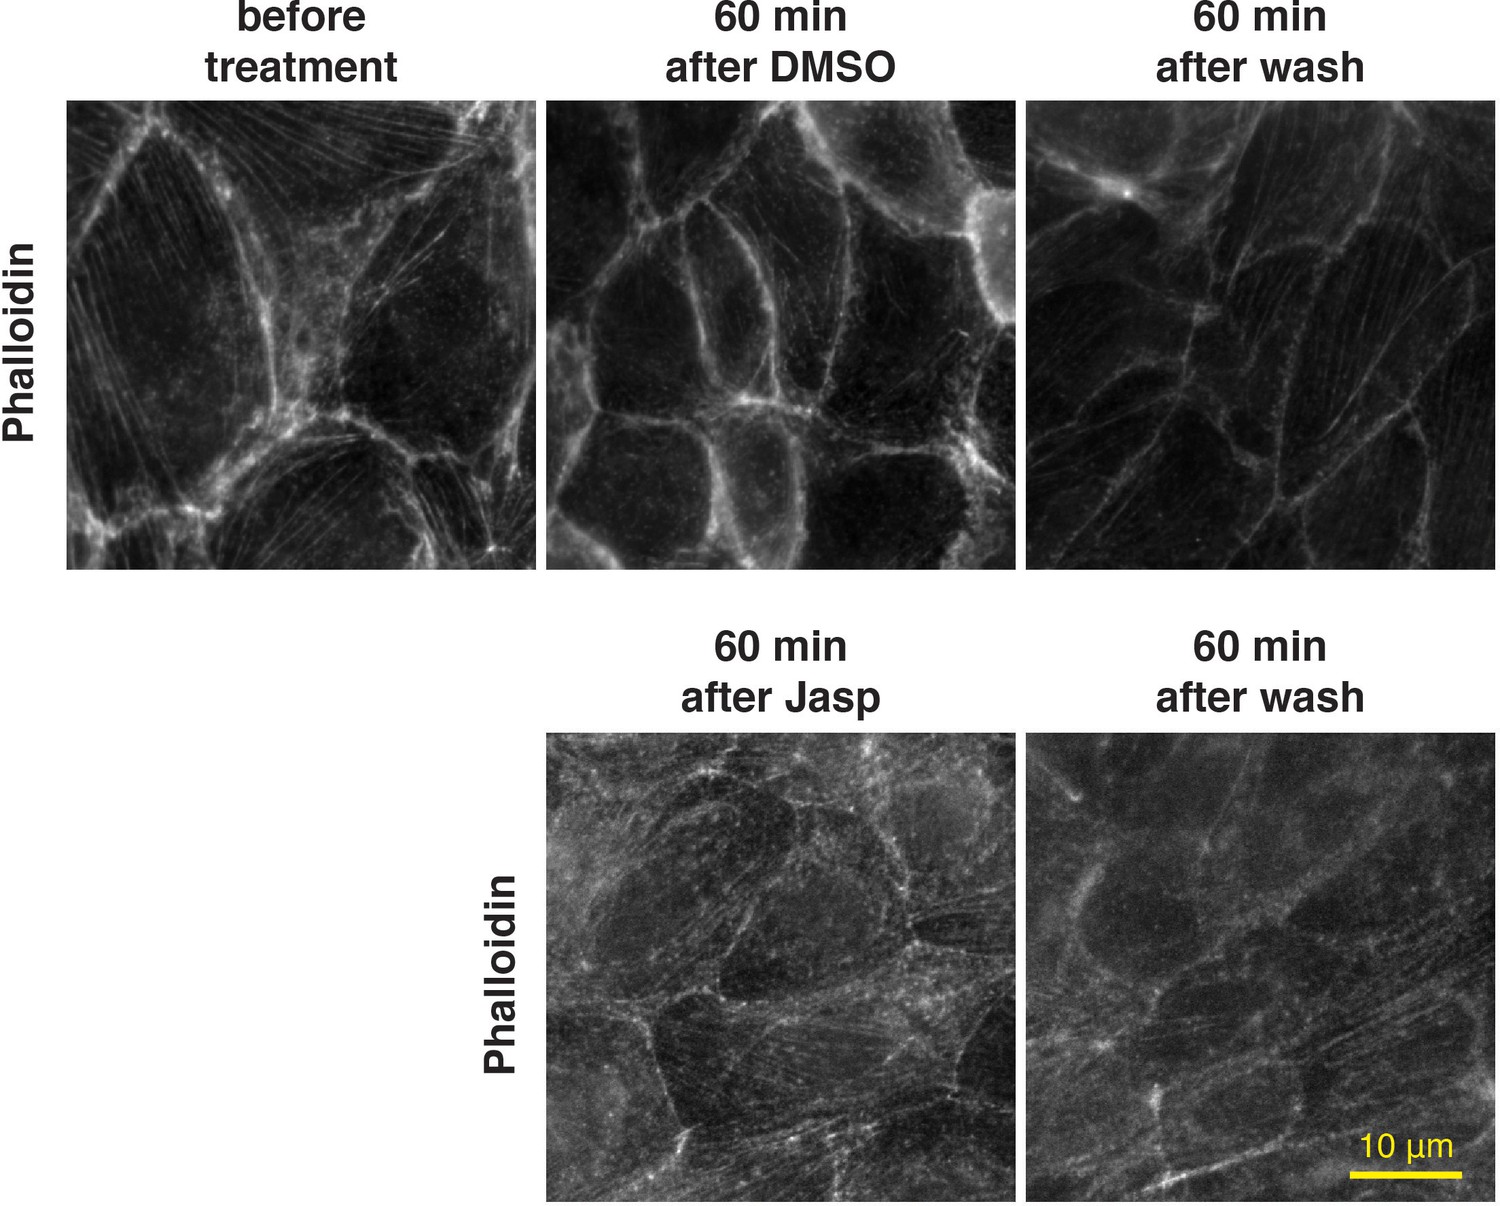
High-magnification of MDCK E-cadherin:DsRed cells treated with Jasplakinolide show altered F-actin organization.
Sets of MDCK E-cadherin:DsRed cell monolayers were either untreated, treated with DMSO or 200 nM Jasplakinolide for 1 h and then fixed, treated with DMSO or 200 nM Jasplakinolide for 1 hr, then washed with media, incubated for 1 h and then fixed. Fixation was done with −20°C methanol for 20 min. Cells were then blocked with and stained with Phalloidin FITC (ABCAM, ab235138). Images were acquired with a Zeiss Axiovert 200 inverted microscope equipped with a mercury lamp and a 100X objective.
Figure 4—figure supplement 2
Density of cells with jasplakinolide was similar to their density without it.
(A, C, E, G, I) Kymographs of cell orientation (A), eccentricity (C), area (E), density (G), and perimeter (I), based on the cell segmentation of MDCK E-cadherin:DsRed cells with jasplakinolide 15 min before shear (dashed black line) and washed 1 h later (Figure 4A–D). Kymographs are from three independent experiments with 15 min binning of 3 × 5 min cell segmentation data (similar to Figure 1). (B, D, F, H, J) Line plots of cell orientation (B), eccentricity (D), area (F), density (H), and perimeter (J), at positions 8, 50, 100, 150, 200, and 242 μm from the shear-plane.
Videos
Video 1
MDCK E-cadherin:DsRed monolayer imaged 1 hr before shear and 19 hr after shear.
https://doi.org/10.7554/eLife.39640.010
Video 2
Cell tracking within MDCK E-cadherin:DsRed monolayer reveals cells retain their neighbors before and after shear.
Representative image series of the middle third bottom plank of a shear MDCK E-cadherin:DsRed monolayer. Cells were tracked in the shear zone, middle and at the edge of the monolayer using ImageJ’s Tracking plugin. Sets of 4 cells were tracked for 1 h before shear and 6.75 h after shear.
Video 3
MDCK E-cadherin:DsRed monolayer imaged for 20 hr without shear.
https://doi.org/10.7554/eLife.39640.012
Video 4
MDCK E-cadherin:DsRed monolayer imaged for imaged 1 h before shear and 19 h after shear.
Blebbistatin was added 15 min prior to shear and washed out 1 h later.
Video 5
MDCK E-cadherin:DsRed monolayer imaged for imaged 1 h before shear and 19 h after shear.
Blebbistatin was added 90 min after shear and washed out 1 h later.
Video 6
MDCK T151 monolayer imaged 1 h before shear and 19 h after shear.
https://doi.org/10.7554/eLife.39640.021
Video 7
MDCK E-cadherin:DsRed monolayer imaged for imaged 1 h before shear and 19 h after shear.
Jasplakinolide was added 15 min prior to shear and washed out 1 h later.
Additional files
-
Transparent reporting form
- https://doi.org/10.7554/eLife.39640.026
Download links
A two-part list of links to download the article, or parts of the article, in various formats.
Downloads (link to download the article as PDF)
Open citations (links to open the citations from this article in various online reference manager services)
Cite this article (links to download the citations from this article in formats compatible with various reference manager tools)
Shear-induced damped oscillations in an epithelium depend on actomyosin contraction and E-cadherin cell adhesion
eLife 7:e39640.
https://doi.org/10.7554/eLife.39640


