Disparate expression specificities coded by a shared Hox-C enhancer
- Division of Biological Sciences, Section of Cell & Developmental Biology, University of California San Diego, United States
Figures
Figure 1 with 1 supplement
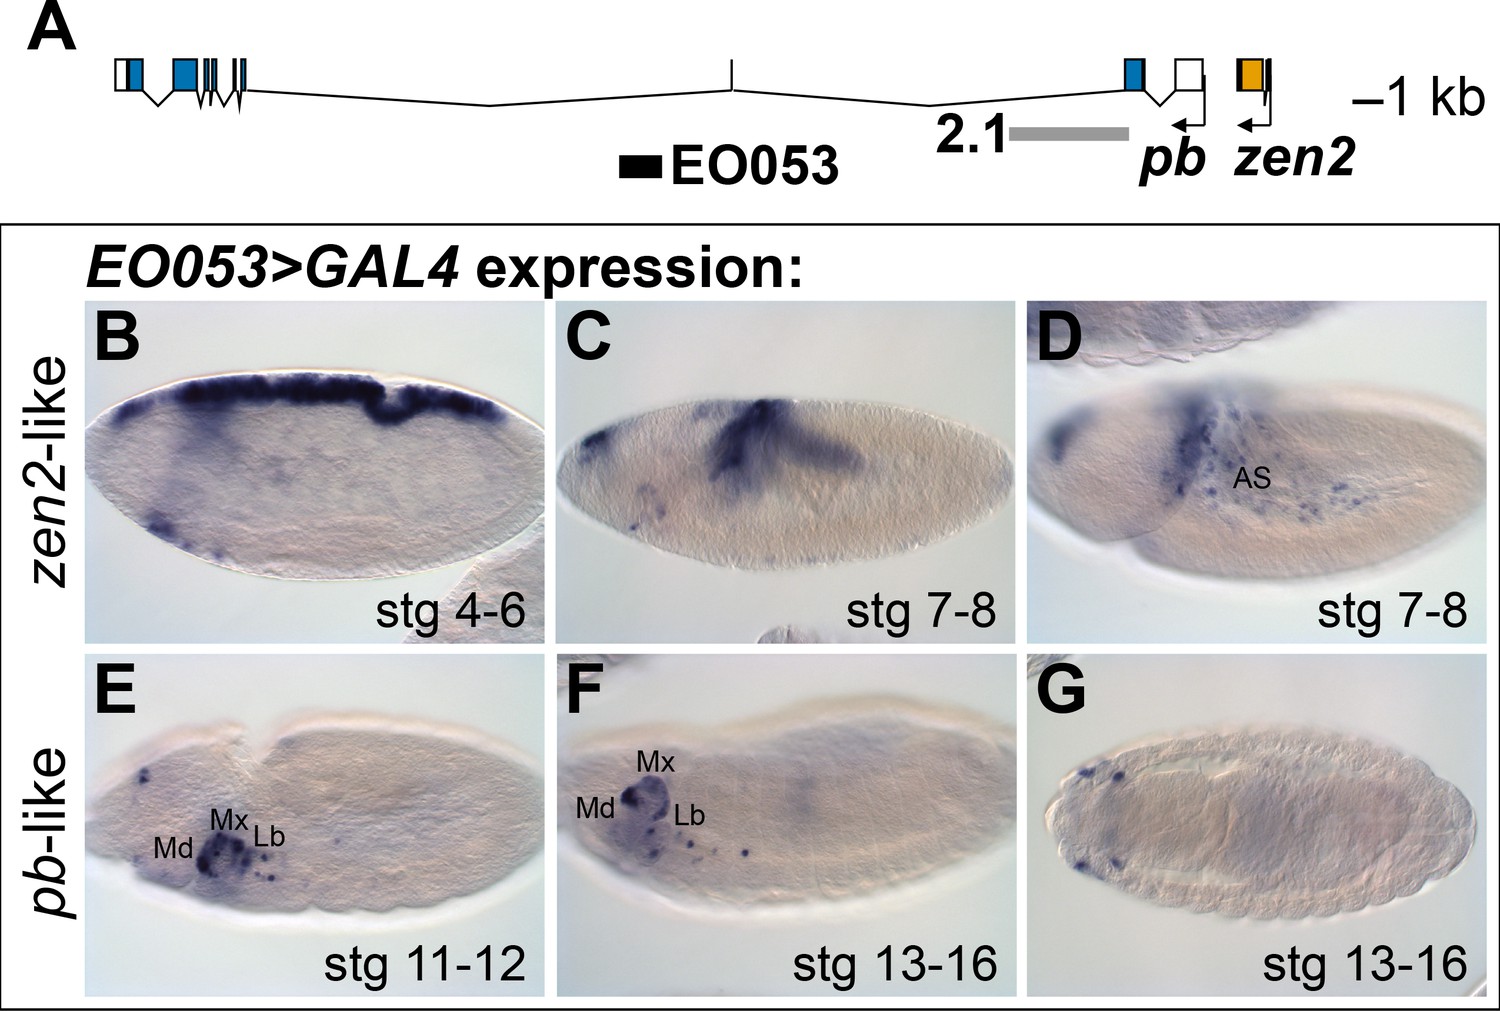
EO053 exhibits both zen2-like and pb-like expression patterns.
(A) Diagram of the pb (blue) and zen2 (yellow) genes and the locations of EO053 (black bar) and the 2.1 pb regulatory region (grey bar) (Kapoun and Kaufman, 1995a). Scale is shown at upper right. (B-G) Expression of GAL4 mRNA by in situ hybridization in EO053>GAL4 embryos exhibits a pattern reminiscent of zen2 (Rushlow et al., 1987) in early embryonic stages (B-D; see also Figure 5 and http://insitu.fruitfly.org/cgi-bin/ex/report.pl?ftype=1&ftext=FBgn0004054) and overlaps expression of pb (Pultz et al., 1988) in later stages (E-G; see also Figure 5 and http://insitu.fruitfly.org/cgi-bin/ex/report.pl?ftype=1&ftext=FBgn0051481). AS: amnioserosa. Md: mandibular segment. Mx: maxillary segment. Lb: labial segment. See also Figure 1—figure supplement 1.
Figure 1—figure supplement 1
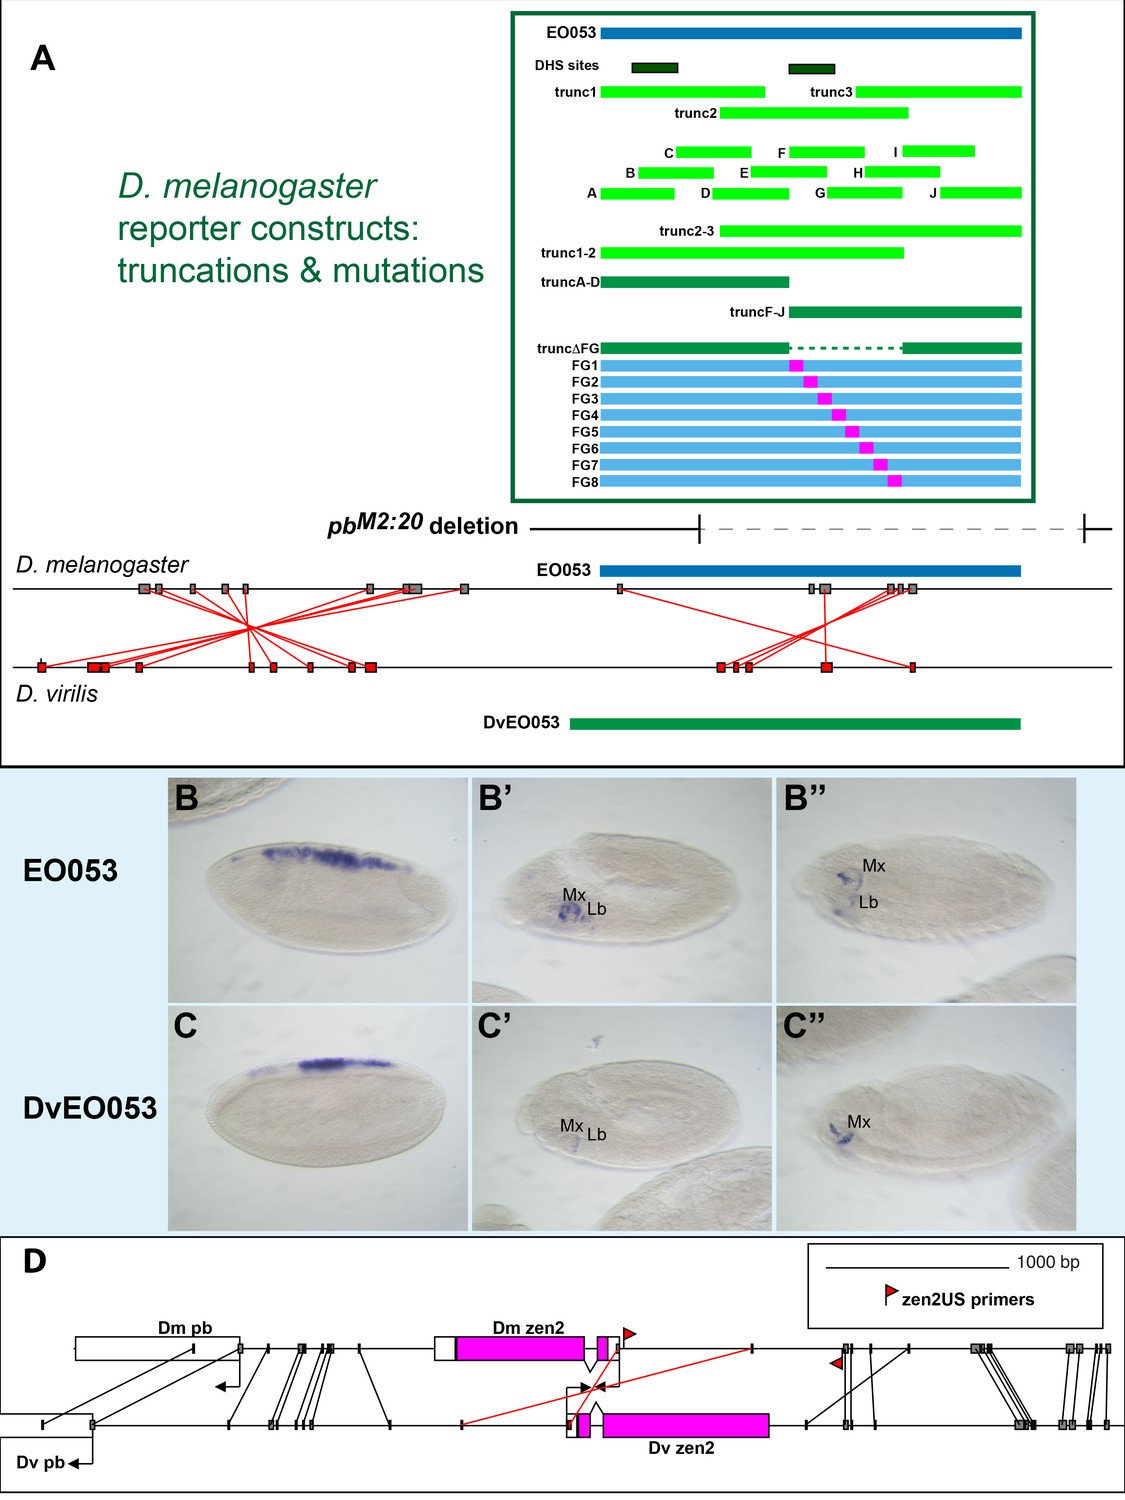
Summary of Reporter Fragments.
(A) Scale diagram indicating sizes and positions of reporter fragments used in this study, relative to EO053 (top). Green-lined box displays DNA segments used in reporter constructs. Below the reporter fragments in the green box, the sequence deleted in pbM2:20 is indicated by a dotted line. Compare with the boundaries of EO053 either above or below. Below the deletion is comparison of the D. melanogaster region and the region orthologous to EO053 in D. virilis, with red lines connecting nucleotide stretches identical between the two species (both EO053 and an adjacent region are inverted in D. virilis relative to the sequence in D. melanogaster). Boxed areas connected by lines are identical sequences (15 bp minimum comparison word size); these can be viewed with reference to D. melanogaster reporter fragments above and D. virilis sequence and reporter fragment (DvEO053) below. (B-C’’). GAL4 mRNA expression driven by the DvEO053>GAL4 reporter constructs in D. melanogaster embryos (C–C’’), as compared to D. melanogaster EO053 (B–B’’). Shown are stage 5–7 (B, C), stage 10 (B’, C’), and stage 13–16 (B’’, C’’). (D) Alignment of the region in D. melanogaster and D. virilis upstream of the pb promoter, containing zen2 (inverted in D. virilis relative to D. melanogaster). Grey vertical lines indicate nucleotide stretches identical between the species; red lines indicate sequences both identical and inverted between the species (13 bp minimum comparison word size). Location of primers used to clone zen2US are indicated by red pennants.
Figure 2
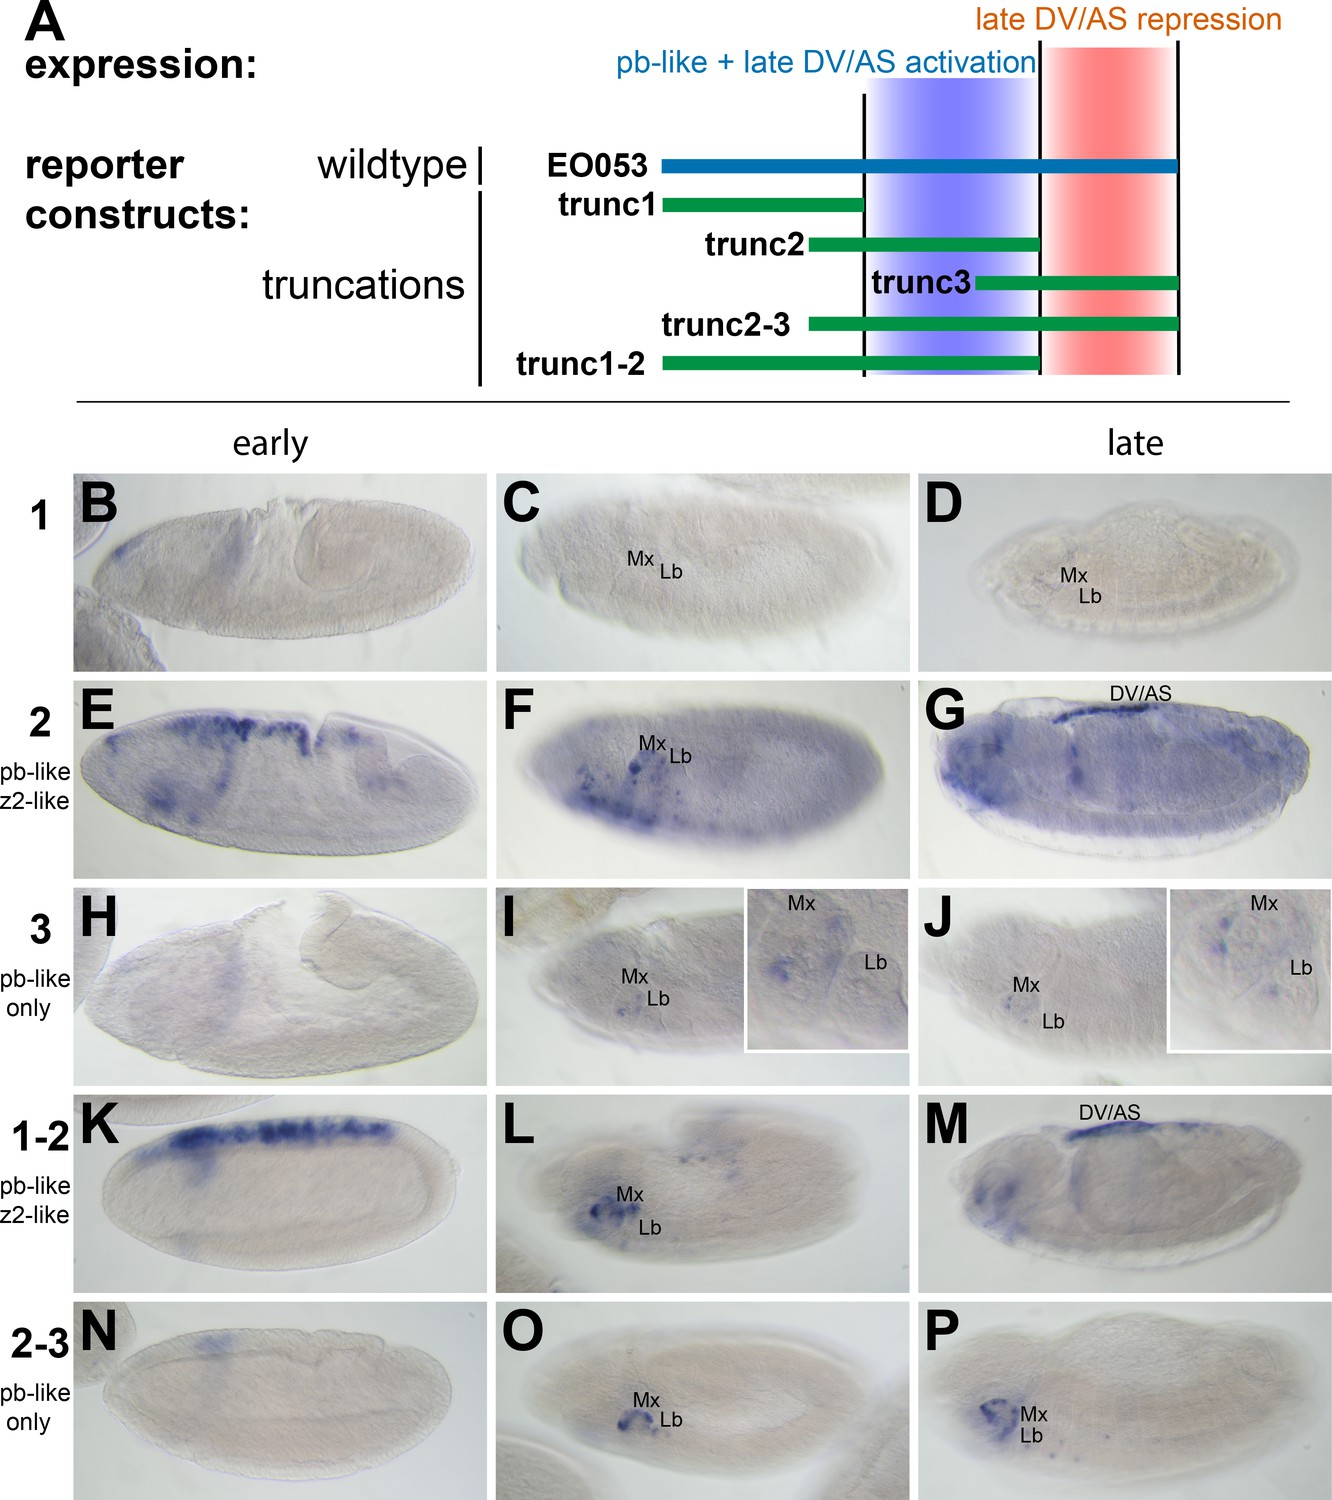
pb-like expression driven by EO053 can be localized to a central region of the enhancer.
(A) Diagram indicating the boundaries of five truncations of EO053 (green bars) and localized expression specificities deduced from reporter assays. While pb-like expression can be localized to a subregion of EO053, the zen2-like expression cannot. ‘DV/AS’=dorsal vessel/amnioserosa. (B-P) Expression of GAL4 mRNA by in situ hybridization in transgenic reporter lines described in panel A. (B, E, H, K, N) GAL4 expression in early embryos (stg 5–8), noting the zen2-like pattern in E and K only. E represents a rare embryo with early dorsal expression, and only during stage 6. (C, F, I, L, O) Segment labels as in Figure 1. GAL4 expression in stage 10–12 embryos, noting pb-like expression in panels F, I, L, and O. (D, G, J, M, P) GAL4 expression in stage 13–16 embryos. Two constructs that both contain the trunc2 region but lack the remaining 3’ portion of EO053 express ectopic GAL4 in the DV/AS region (G, M). Insets in I and J represent zoomed-in sections highlighting the low signal in the maxillary and labial segments found with the trunc3 construct. See Figure 1—figure supplement 1 for a diagram of these and all constructs used in this study.
Figure 3 with 1 supplement
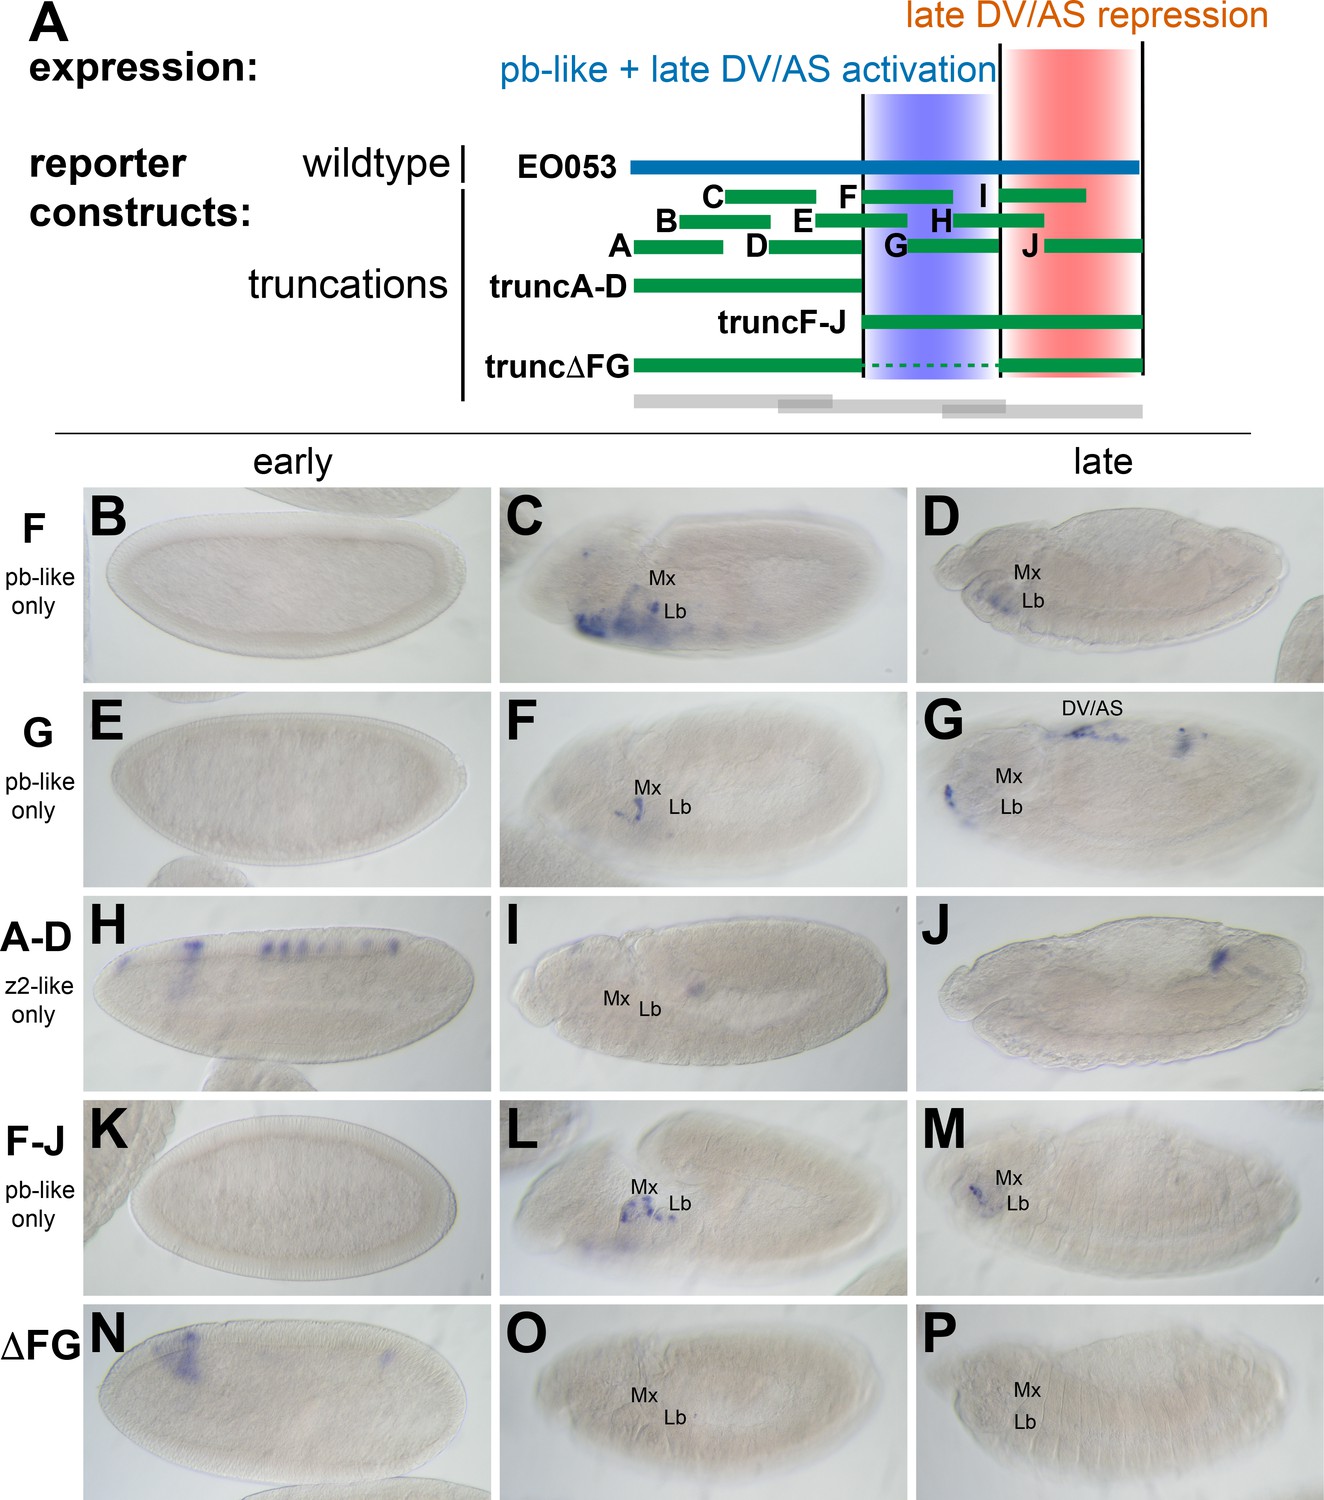
zen2-like expression driven by EO053 requires the central region of the enhancer.
(A) Diagram indicating relative locations of the second set of constructs representing truncated versions of EO053 (green bars). Boundaries of the constructs shown in Figure 2 are indicated for comparison (grey bars). (B-P) Expression of GAL4 mRNA by in situ hybridization in a subset of transgenic reporter lines described in A (See Figure 3—figure supplement 1 for images of truncA – truncJ). DV/AS: dorsal vessel/amnioserosa; segment labels as in previous figures. (B, E, H, K, N) GAL4 expression in early embryos (stg 5–8), noting the striped zen2-like pattern in H only. (C, F, I, L, O) GAL4 expression in stage 10–12 embryos, noting pb-like expression in panels C, F, and L. (D, G, J, M, P) GAL4 expression in stage 13–16 embryos. truncG overlaps trunc2 region but lacks the remaining 3’ portion of EO053 and expresses ectopic GAL4 in the DV/AS region (G). (N-P) truncΔFG, which lacks regions F through G, fails to express GAL4 in either pb- or zen2-like patterns. See also Figure 1—figure supplement 1.
Figure 3—figure supplement 1
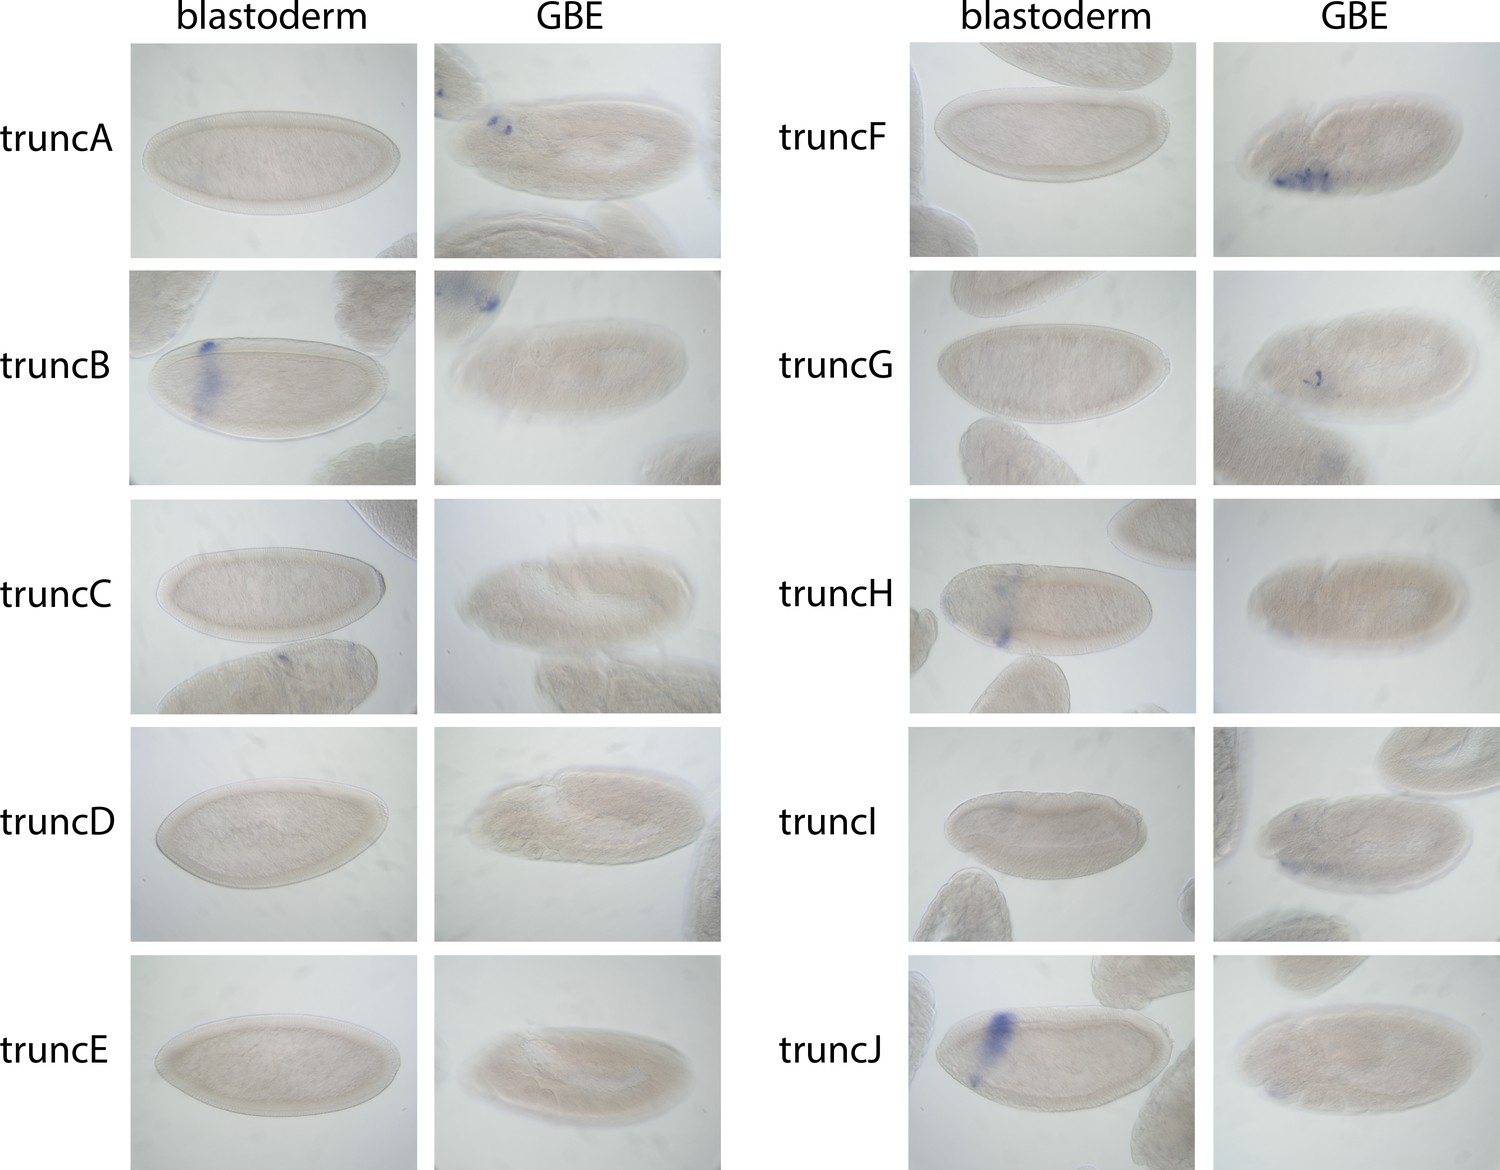
Embryo images of truncA – truncJ expression patterns.
See also Figure 3. Representative images from either stg 5–7 (‘blastoderm’) or germ band-extended embryos (‘GBE’; stg. 10) containing the indicated EO053*>GAL4 reporter constructs and probed for GAL4 mRNA expression by in situ hybridization. Note absence of any embryos expressing a zen2-like pattern at the early stages; only truncF and truncG express GAL4 in the pb-like territory in GBE embryos.
Figure 4
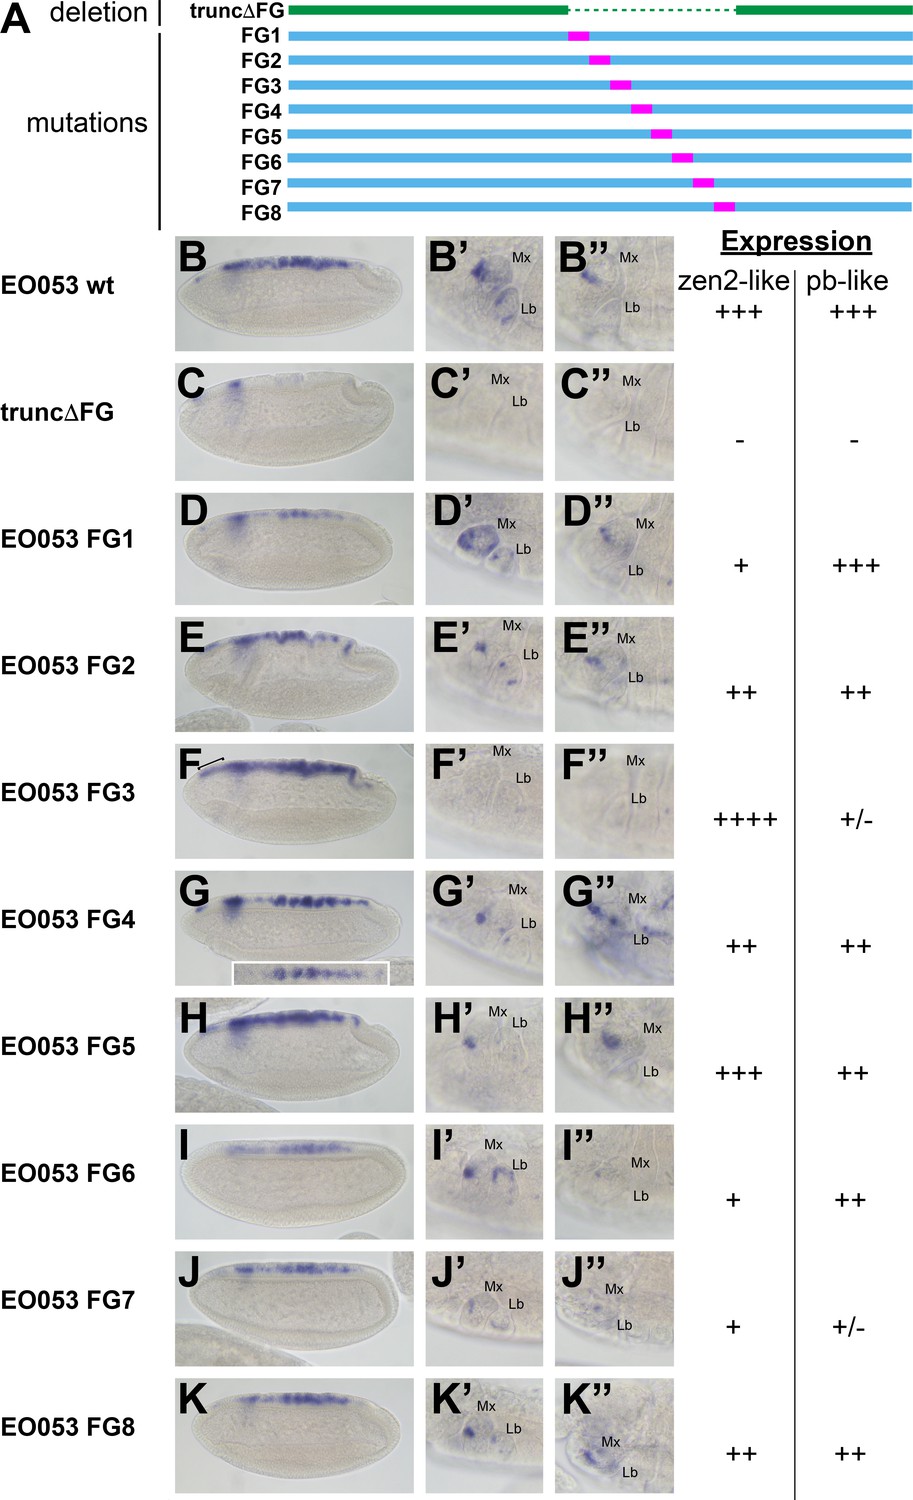
Mutation of specific nucleotide segments in the FG region of EO053 can affect either pb-like or zen2-like expression.
(A) Diagram of a series of 47-nt non-complementary transversion mutants generated within the FG region (FG1 – FG8, blue, with mutated segments shown in pink), and the same region deleted in the truncΔFG construct (green). (B-K) GAL4 mRNA expression in early (stage 4–6) embryos. zen2-like expression is absent in truncΔFG (C); reduced in FG1 (D), FG2 (E), FG4 (G), FG6 (I), FG7 (J), and FG8 (K); and expanded anteriorly in FG3 (F: bracket). Inset in G is a dorsal view of an embryo exemplifying the pseudo-stripe pattern of GAL4 expression along the anteroposterior axis driven by the FG4 mutant reporter. (B’-K’’) GAL4 mRNA expression in maxillary and labial segments of stage 10–12 embryos (B’–K’) and stage 13–16 embryos (B’’–K’’). Segment labels as in previous figures. pb-like expression is absent in truncΔFG (C’, C’’) and strongly reduced in FG3 (F’, F’’) and FG7 (J’, J’’). Qualitative scoring of reporter strength is represented to the right of the images for each line. See also Figure 1—figure supplement 1.
Figure 5 with 5 supplements

EO053 cooperates with other enhancers to regulate mRNA accumulation from both pb and zen2.
(A) Diagram of the pb-zen2 region, noting the locations of putative Polycomb Response Elements (‘PREs’, red; see Discussion) (Nègre et al., 2011); EO053 and zen2US enhancer regions (black) and the pb 2.1 regulatory region (grey) (Kapoun and Kaufman, 1995a); and a Doc type transposon (Vaury et al., 1994) in the 5’ end of pb intron 2. Below the diagram of the genomic region are shown CRISPR/Cas9-generated deletions overlapping EO053 only (pbM2:20), the 2.1 enhancer only (pb11A or the identical pb11D seen in Figure 5—figure supplement 3 and Figure 5—figure supplement 1), and both EO053 and 2.1 enhancers (pb11C or the identical pb11E seen in Figure 5—figure supplement 3 and Figure 5—figure supplement 1). (B-F) Effects of enhancer deletion on pb expression. (B) pb mRNA expression in a w1118 embryo at stage 11–12. (B’) Zoom-in of the pb in situ signal in the mandibular (Md), maxillary (Mx), labial (Lb) segments, and hypopharyngeal lobe (Hy). (C) pb mRNA expression in a pbM2:20 embryo at stage 11–12. (C’) Zoom-in of the pb in situ signal, with labeling as in B’. See also Figure 5—figure supplement 2. (D-F) Confocal maximum projection of pb mRNA detected through fluorescent in situ hybridization (FISH) in the maxillary and labial segments of embryos of the indicated genotypes. (D) pb11C/TM3,Ubx-LacZ stage 11–12 embryo. (E) pb11A/pb11A stage 11–12 embryo, noting dramatically reduced signal area relative to D. (F) pb11C/pb11C stage 11–12 embryo exhibiting signal area reduced relative to D and E. See also Figure 5—figure supplement 3 – 5. (G, H) Expression of GAL4 directed by the reporter zen2US. Embryos containing zen2US>GAL4 have detectable GAL4 mRNA expression at stage 4 (G) and lack GAL4 expression during stage 5 (H). (I-L’) Effect of the pbM2:20 deletion on zen2 expression. zen2 mRNA expression at either stage 4 (I,K) or stage 5 (J,L) in w1118 embryos (I,J) or pbM2:20 embryos (K,L). (I’,J’,K’,L’) Pie-chart representation of zen2 mRNA expression pattern as resembling zen2US (polar, red), EO053 (dorsal, blue), or absent (none, green).
-
Figure 5—source data 1
Scoring Data for pbM2:20 pb and zen2 in situ phenotypes (Figure 5 and Figure 5—figure supplement 2).
- https://cdn.elifesciences.org/articles/39876/elife-39876-fig5-data1-v1.xlsx
Figure 5—figure supplement 1
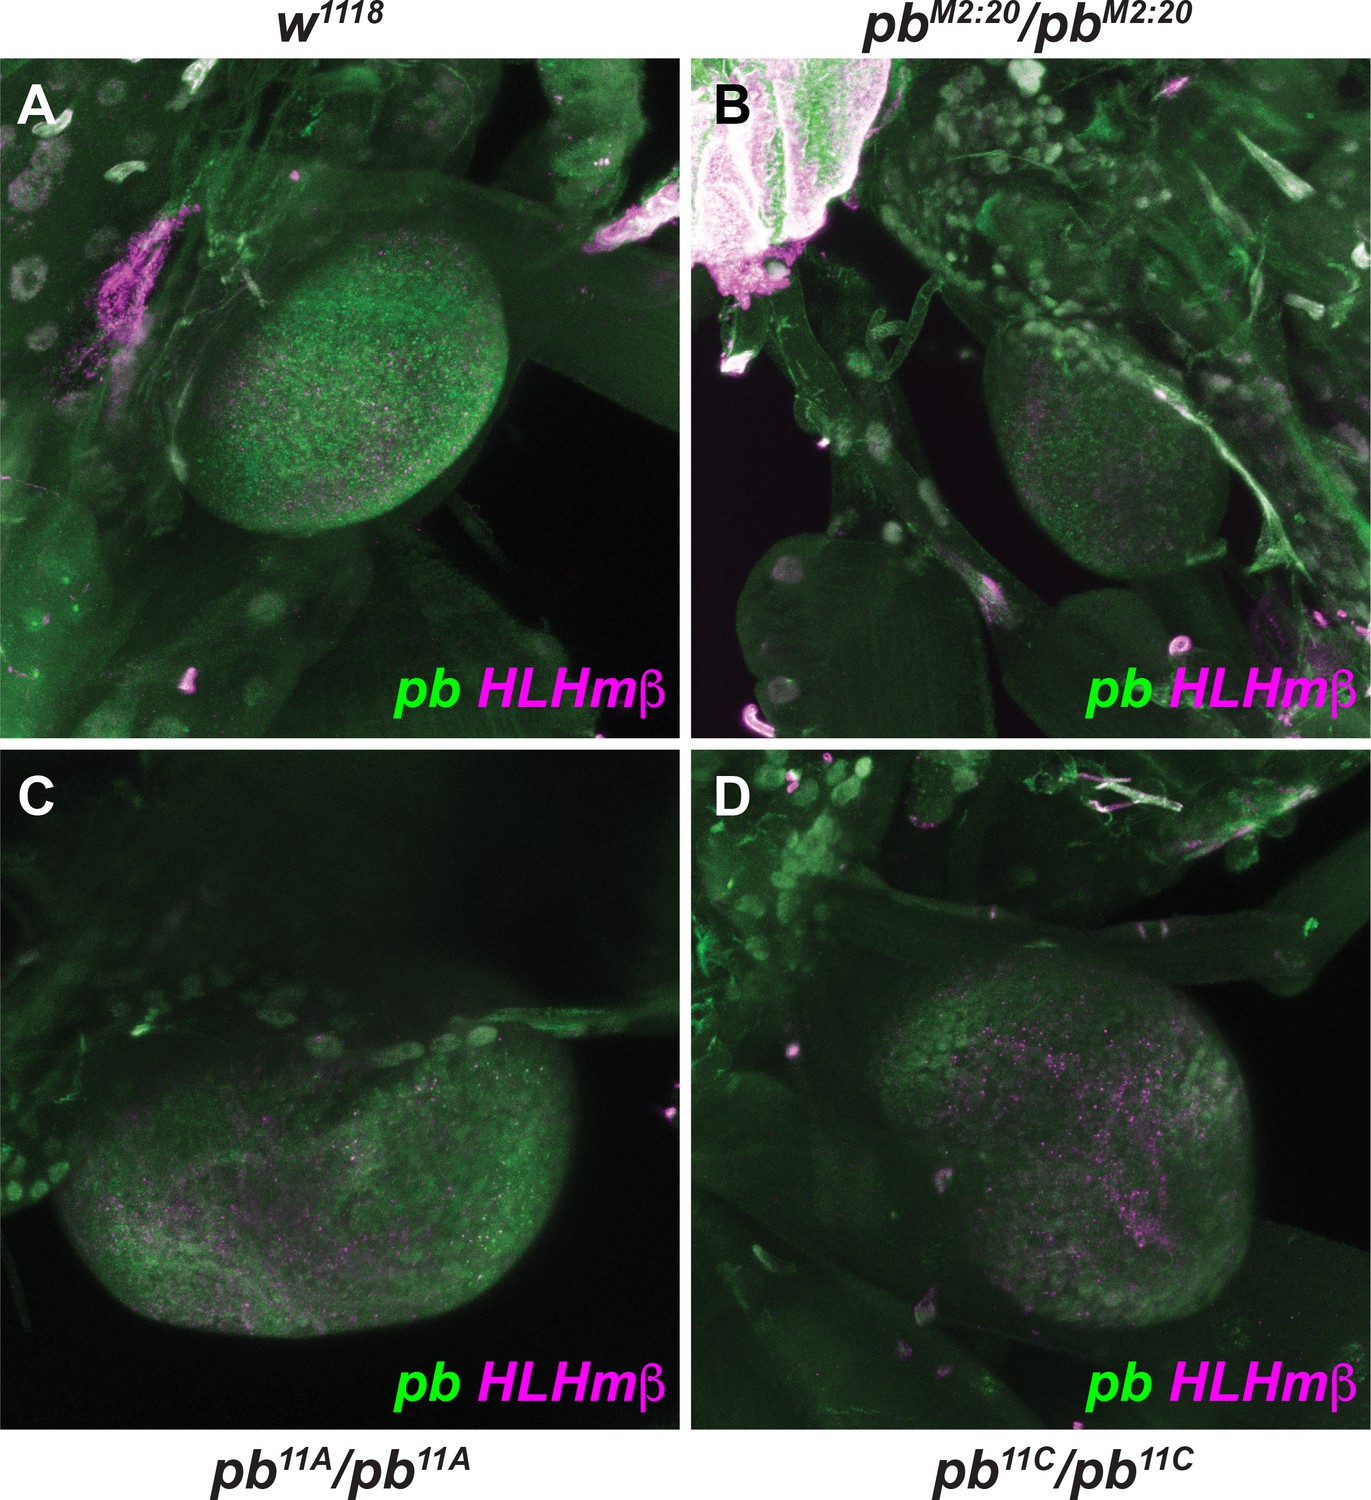
Fluorescent detection of pb mRNA in 3rd-instar labial discs.
Fluorescent detection of pb mRNA (green) and HLHmβ mRNA (magenta) following in situ hybridization in 3rd-instar labial discs from w1118, pbM2:20/pbM2:20 (EO053 deletion), pb11A/pb11A (region 2.1 deletion), or pb11C/pb11C (region 2.1, EO053 double deletion) larvae. Both pb and HLHmβ are detectable in multiple cytoplasmic dots throughout the labial discs in both A and B. In C, while HLHmβ expression remains similar, discrete pb cytoplasmic dots are only present in a subset of the disc above the broader background signal. In D, HLHmβ expression is again similar to A-C, but no discrete pb cytoplasmic dots are visible above background.
Figure 5—figure supplement 2
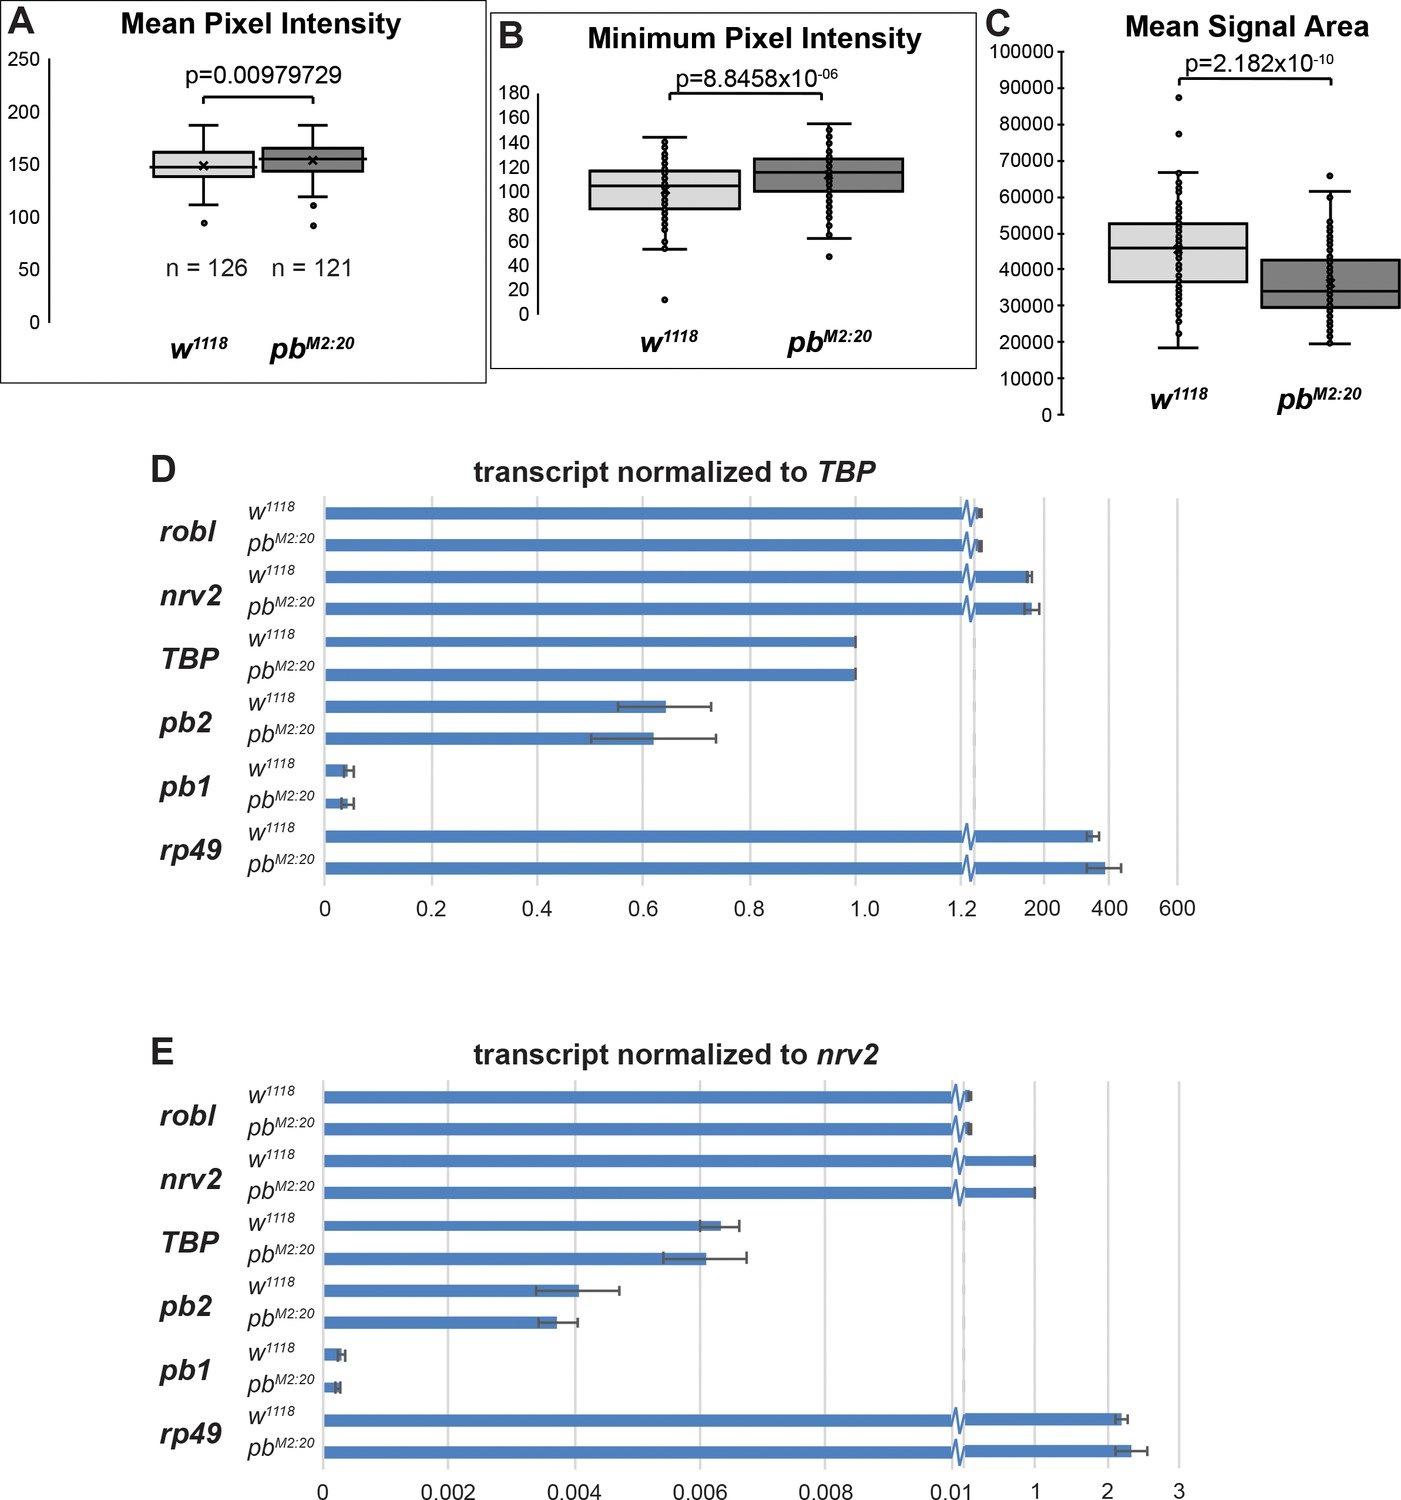
Quantification of pb expression in pbM2:20 mutant embryos.
(A–C) Analysis of histochemical detection of pb mRNA in germ band-extended w1118 and pbM2:20 embryo images from Figure 5B–C, measuring the mean (A) and minimum (B) pixel intensity within the area of visible in situ hybridization signal. The alkaline phosphatase reaction deposits a blue product; less product results in a higher pixel intensity. (C) Analysis of the mean area of visible in situ hybridization signal in w1118 and pbM2:20 germ band-extended embryo images with representatives shown in Figure 5B–C. The datasets were subject to a Student’s t-test, with the p value reported in each panel. (D,E) Quantitative PCR detection of first-strand cDNA from pb (using two different target regions) and the control genes robl, nrv2, TBP, and rp49 in staged embryo collections from either w1118 or pbM2:20 embryos. Relative expression is normalized to either TBP expression (D) or nrv2 expression (E). No significant difference in pb expression is detected between w1118 or pbM2:20 in either normalization.
-
Figure 5—figure supplement 2—source data 1
Raw qPCR data and analysis.
- https://cdn.elifesciences.org/articles/39876/elife-39876-fig5-figsupp2-data1-v1.xlsx
Figure 5—figure supplement 3
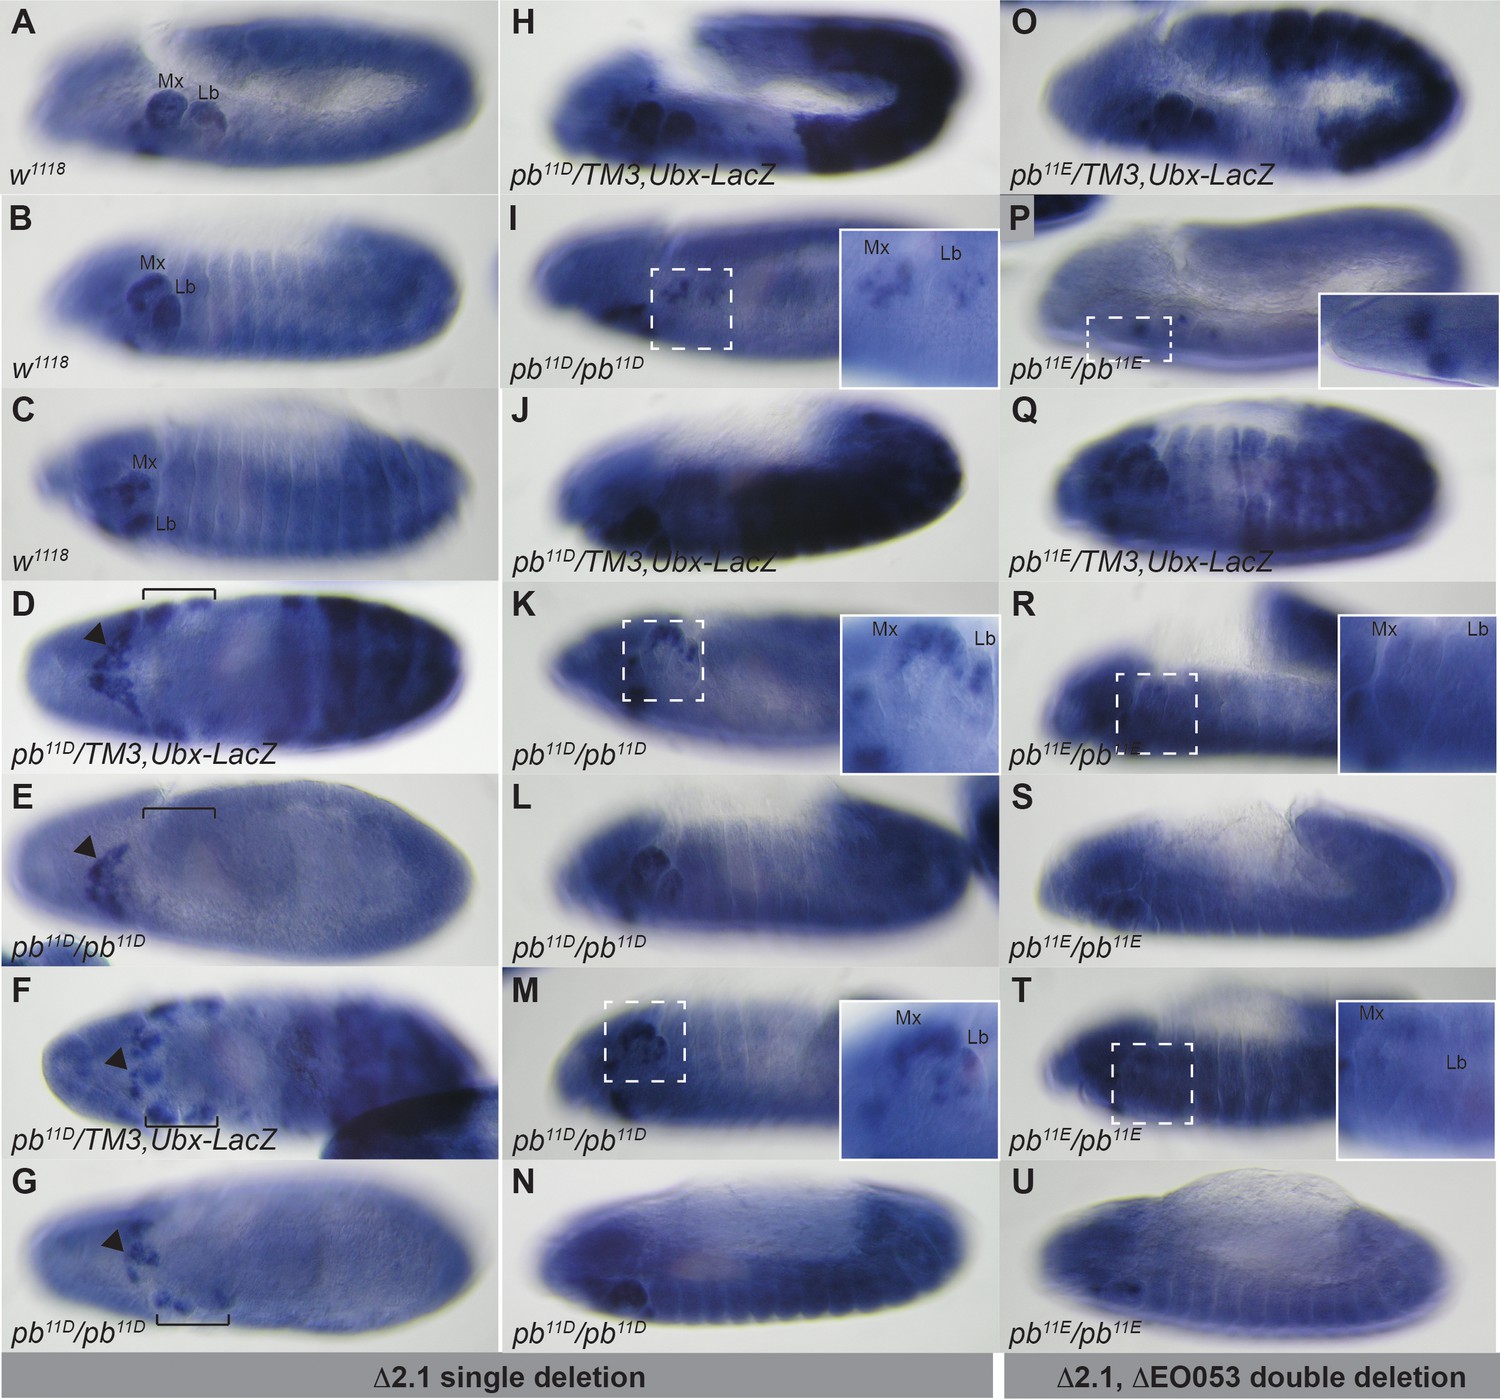
Region 2.1 and EO053 cooperate to drive pb expression.
Histochemical detection of pb and LacZ mRNA expression following in situ hybridization in embryos of the indicated genotypes and stages. (A–C). w1118 embryos at stage 11 (A), stage 12 (B), and stage 13 (C). (D–N) Region 2.1-deleted embryos, either as balanced heterozygotes identified by abdominal LacZ expression (D, F, H, J) or homozygotes lacking LacZ (E, G, I, K, L, M, N). (D,E) Ventral view of pb expression in maxillary and labial lobes (bracket) that is present in pb11D/TM3,Ubx-LacZ (D) and absent in pb11D/pb11D embryos at stage 9–10 (E), while expression in the hypopharyngeal lobe is similar for both genotypes (arrowhead). (F,G) By stage 11, expression in the maxillary and labial lobes (bracket) is detectable in both pb11D/TM3,Ubx-LacZ (F) and pb11D/pb11D (G) embryos, but visibly reduced in pb11D/pb11D (G). As in D,E, similar hypopharyngeal lobe expression is detectible in both genotypes (arrowhead). (H) Laterial view of stage 11 embryos, illustrating pb expression in pb11D/TM3,LacZ similar to w1118 (compare with A). (I) pb11D homozygous stage 11 embryos have detectable pb expression in the maxillary and labial lobes (see inset for higher magnificiation), but in a noticeably reduced territory. (J-N) Stage 12 pb11D/TM3,Ubx-LacZ embryos have pb expression comparable to w1118 (J, compare with B), while stage 12–13 pb11D homozygous embryo show similar reduction in expression area relative to w1118 and pb11D/TM3,Ubx-LacZ, (see also insets in K and M for zoom of maxillary and labial lobes, as well as Figure 5—figure supplement 4B,C). (O-U) Embryos from a double deletion of region 2.1 and EO053 (pb11E), either as balanced heterozygotes (O,Q), or homozygotes (P,R–U). Detection of pb mRNA in pb11E heterozygous embryos at stage 11 (O) or stage 12 (Q) is comparable to both w1118 (A,B) and pb11D/TM3,Ubx-LacZ (H,J; See also Figure 5—figure supplement 4A,D). (P) pb mRNA expression is noticeably reduced in stage 11 pb11E/pb11E homozygous embryos, while expression in the hyopharyngeal lobe is unaltered (inset). (R-U) Representative stage 12–13 pb11E/pb11E embryos also demonstrating reduced pb mRNA detection. Compare insets in R and T with K and M, respectively, and also refer to Figure 5—figure supplement 4E,F.
Figure 5—figure supplement 4
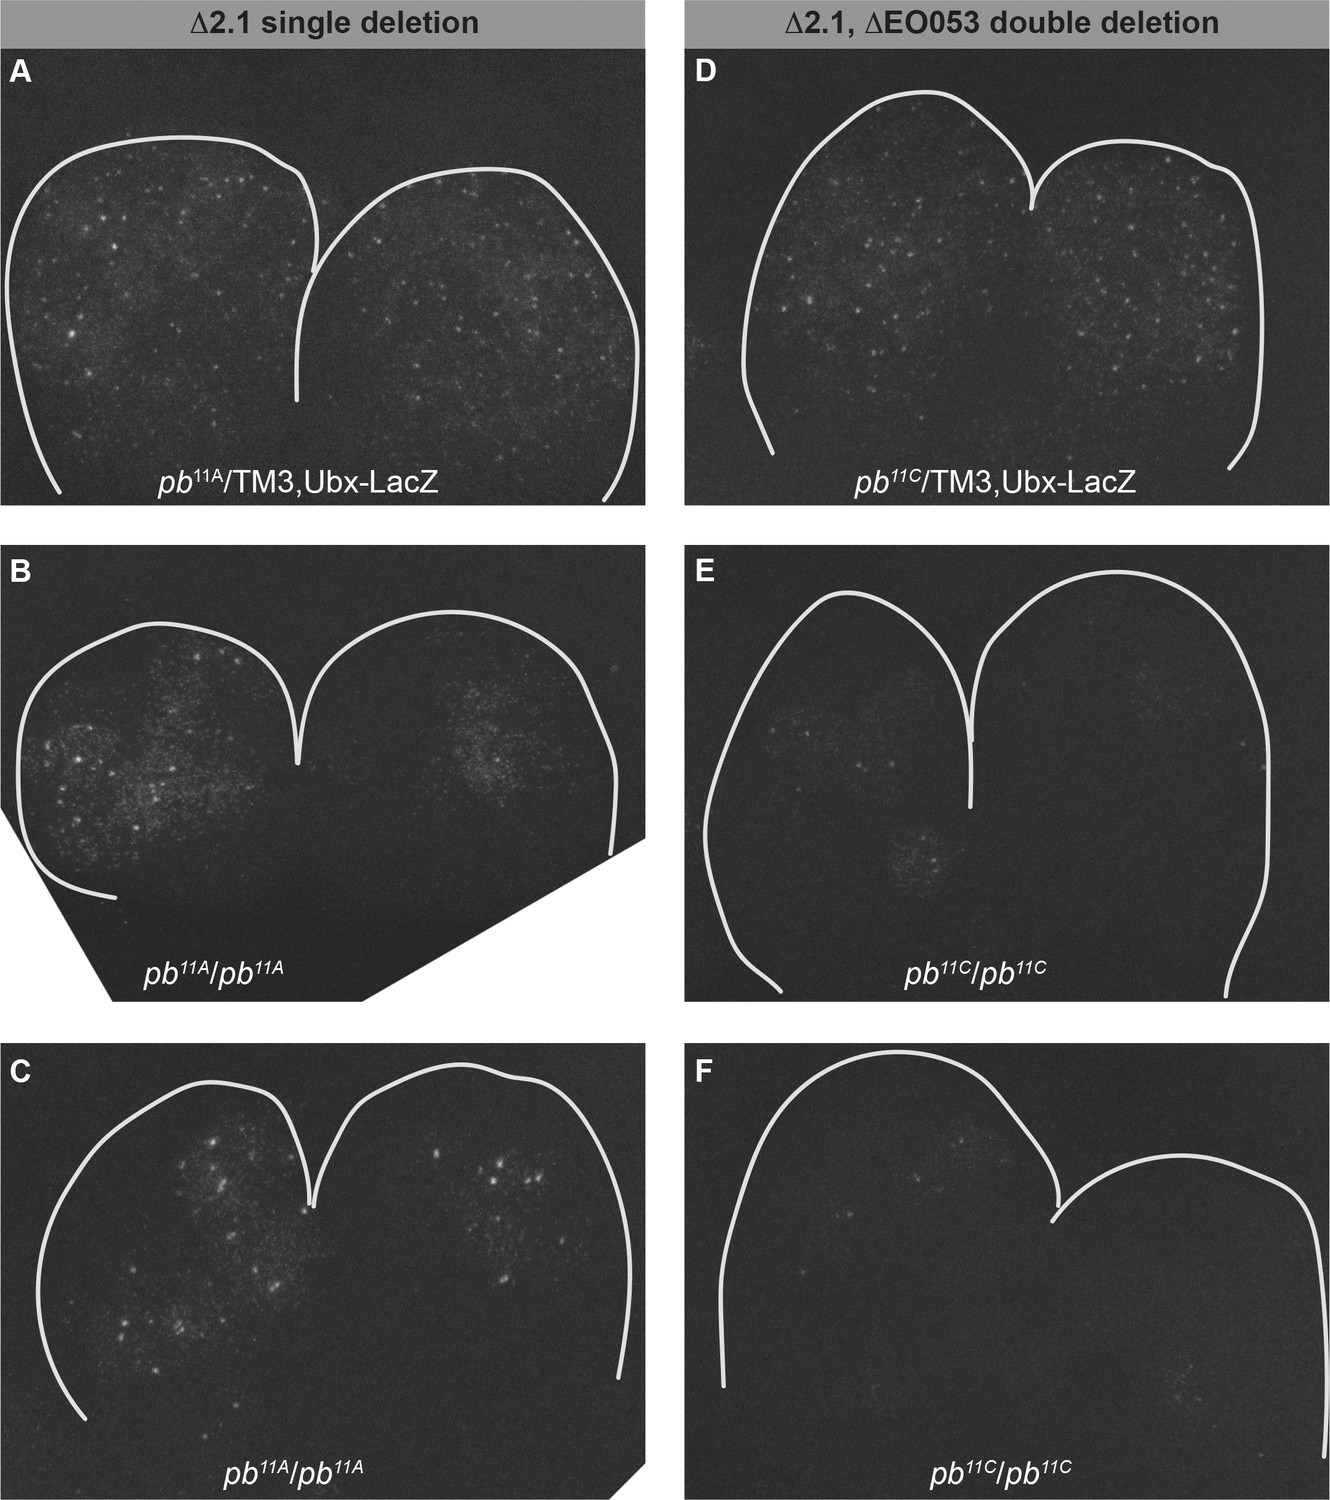
Fluorescent detection of pb mRNA in the maxillary and labial lobes in region 2.1 single deletions and 2.1, EO053 double deletions.
(A–C) Fluorescent detection of pb mRNA expression following in situ hybridization in maxillary and labial lobes from stage 11 embryos with only region 2.1 deleted (pb11A), either in heterozygous pb11A/TM3,Ubx-LacZ embryos (A), or two representative pb11A/pb11A homozygous embryos (B,C), illustrating the noticeable reduction in expression area (compare with A, but also note similarity with Figure 5—figure supplement 3I inset). (D-E) pb mRNA expression in maxillary and labial lobes from embryos with a double deletion in region 2.1 and EO053 (pb11C), either in heterozygous pb11C/TM3,Ubx-LacZ embryos (D), or two representative pb11C/pb11C homozygous embryos (E,F), noting markedly reduced expression area relative to both the heterozygous genotype (D) and the region 2.1 single deletion homozygotes (B,C). Note also the comparison with Figure 5—figure supplement 3P.
Figure 5—figure supplement 5
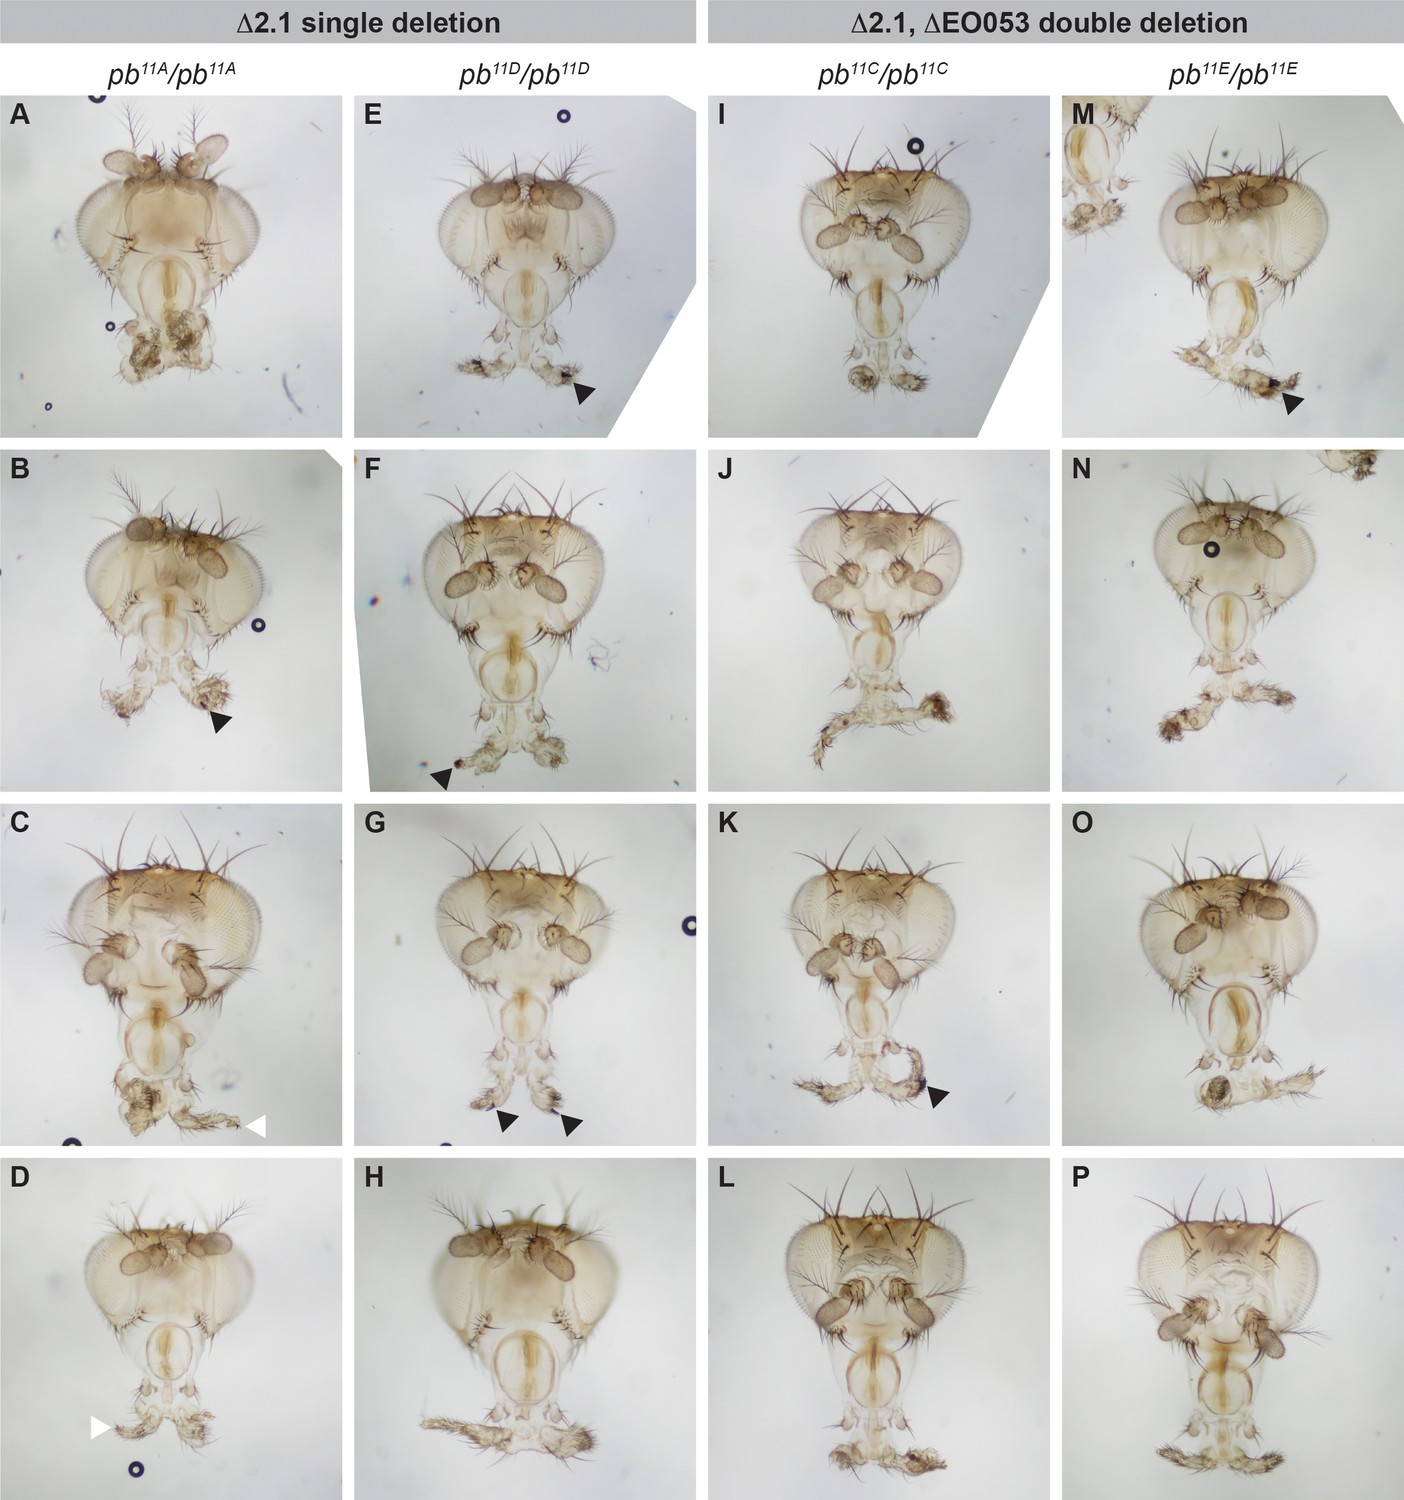
Deletion of region 2.1 is sufficient to cause a proboscis-to-leg transformation.
Representative adult heads collected from flies homozygous either for a region 2.1 deletion (pb11A, (A–H) or for a double-deletion of region 2.1 and EO053 (pb11C, (I–P). Black arrowheads denote the presence of male sex combs, while white arrowheads point to terminal claws.
Figure 6 with 9 supplements
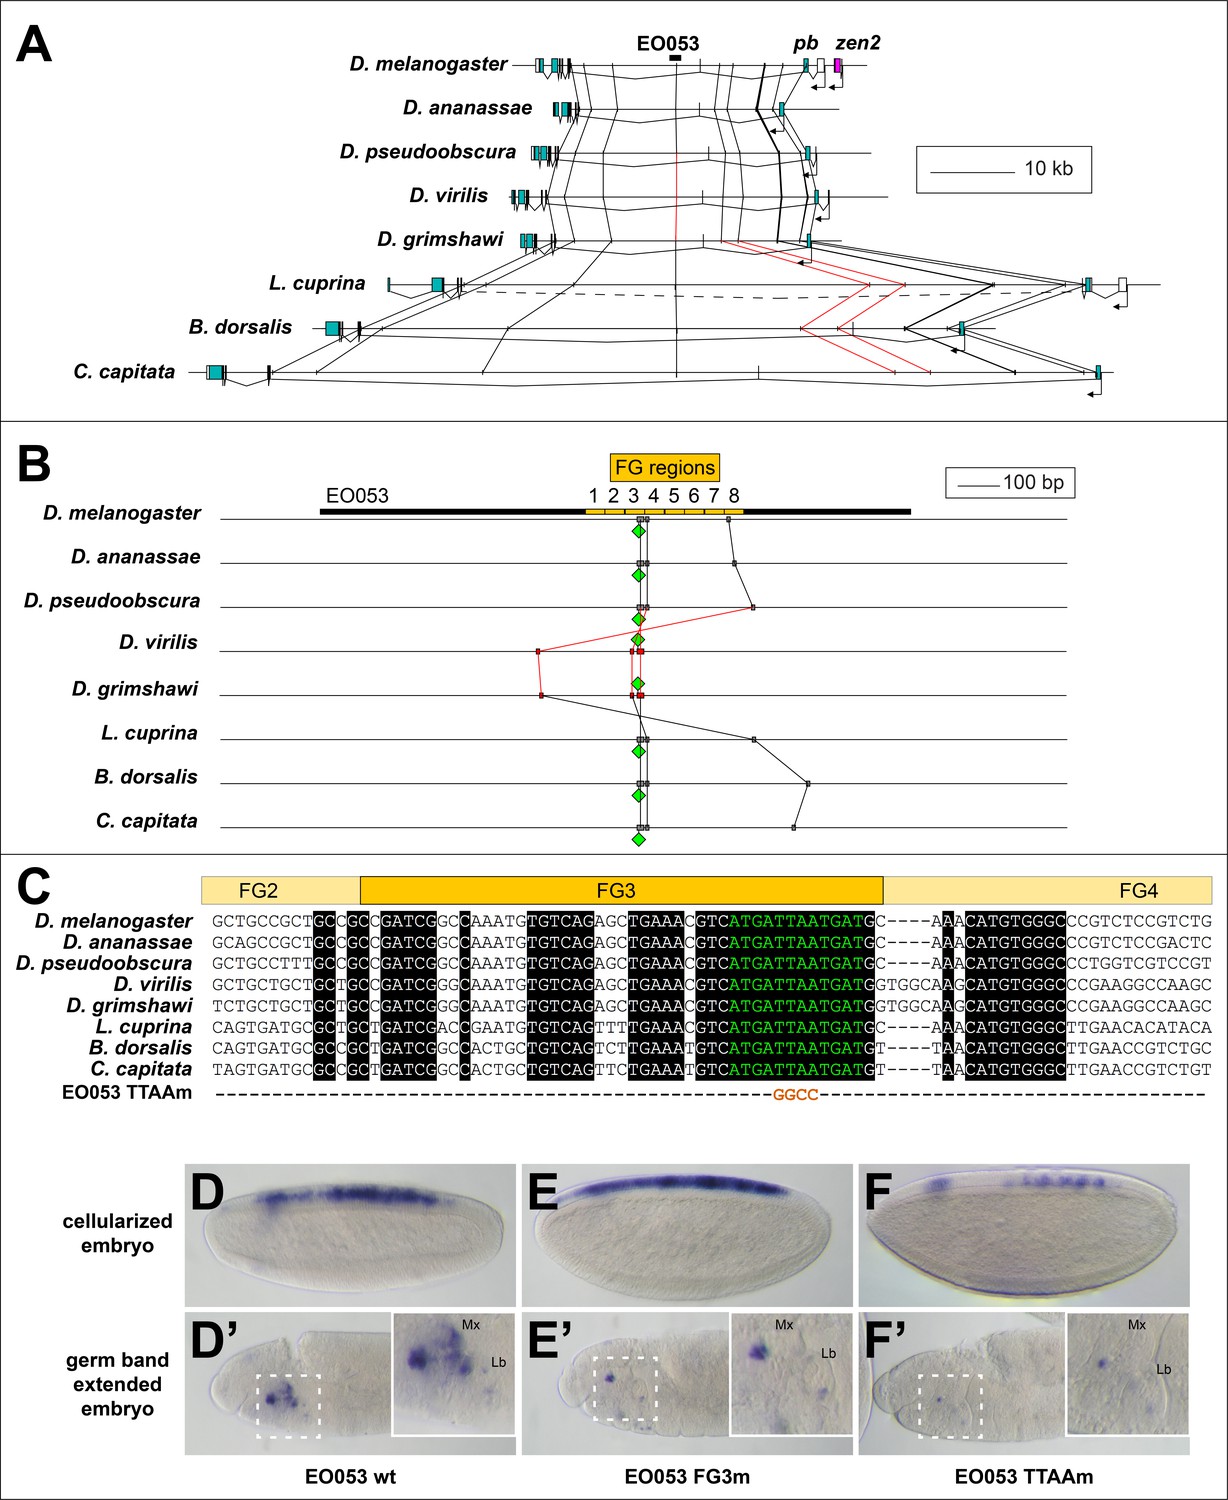
Conservation of EO053 sequences within the Schizophora.
(A) Gene diagrams of pb from select Schizophoran flies with available genome sequence data. Coding exons of pb in each species are colored blue-green, based upon existing genome annotations, and the locations of EO053 and zen2 in D. melanogaster are also noted. Vertical lines between species diagrams connect 14 bp or greater identical sequence blocks present in all eight species. Red lines (e.g., connected to the corresponding EO053 regions in D. virilis and D. grimshawi) represent sequences inverted relative to D. melanogaster (see also Figure 1—figure supplement 1). Dashed line in L. cuprina diagram joins two separate coding regions annotated as belonging to pb, due to the presence of coding sequences for a YPWM motif (right-most exons) and a homeodomain (left-most exons). (B) Diagram of EO053 sequence conservation within select Schizophoran flies. D. melanogaster EO053 span is indicated by the thick black line and yellow boxes represent the boundaries of FG regions mutated in Figure 4. Grey or red boxes connected between species represent 8 bp or greater identical sequence blocks present in all eight species. Green diamonds denote the location and orientation of the conserved ‘EO053 motif’ sequence shown in green in panel C. (C) Alignment of the region including FG3 from select Schizophoran flies, indicating additional sequences conserved in this region in these species (see also Figure 6—figure supplements 1–9). Line below the alignment indicates the nucleotides mutated in the ‘TTAAm’ reporter construct shown in F. (D-F’) GAL4 expression in embryos carrying mutant FG3 region reporter constructs in either early embryos (D–F) or germ band extended embryos (D’–F’). (D, D’) Wildtype EO053 reporter. (E, E’) Noncomplementary transversion FG3 mutant reporter. (F, F’) ‘TTAAm’ reporter, mutating the four nucleotides indicated in C. Insets in D’-F’ show higher-magnification images of the maxillary and labial segments.
Figure 6—figure supplement 1
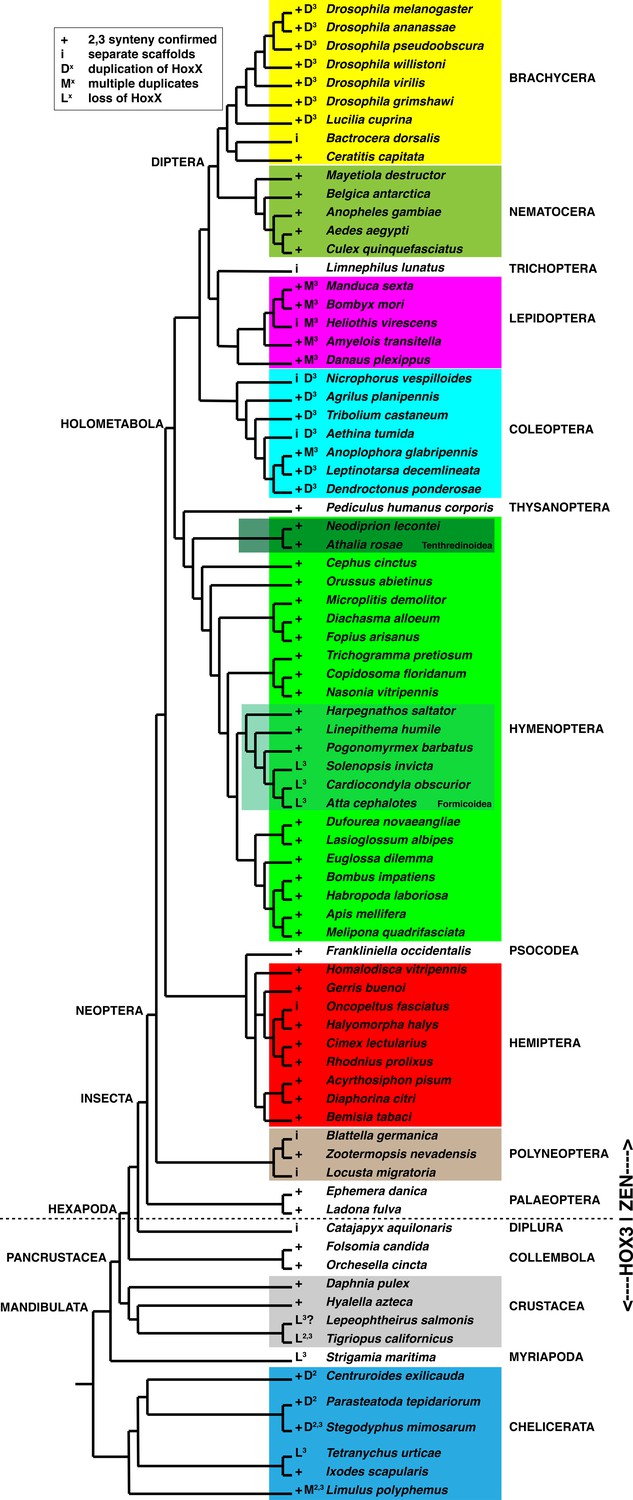
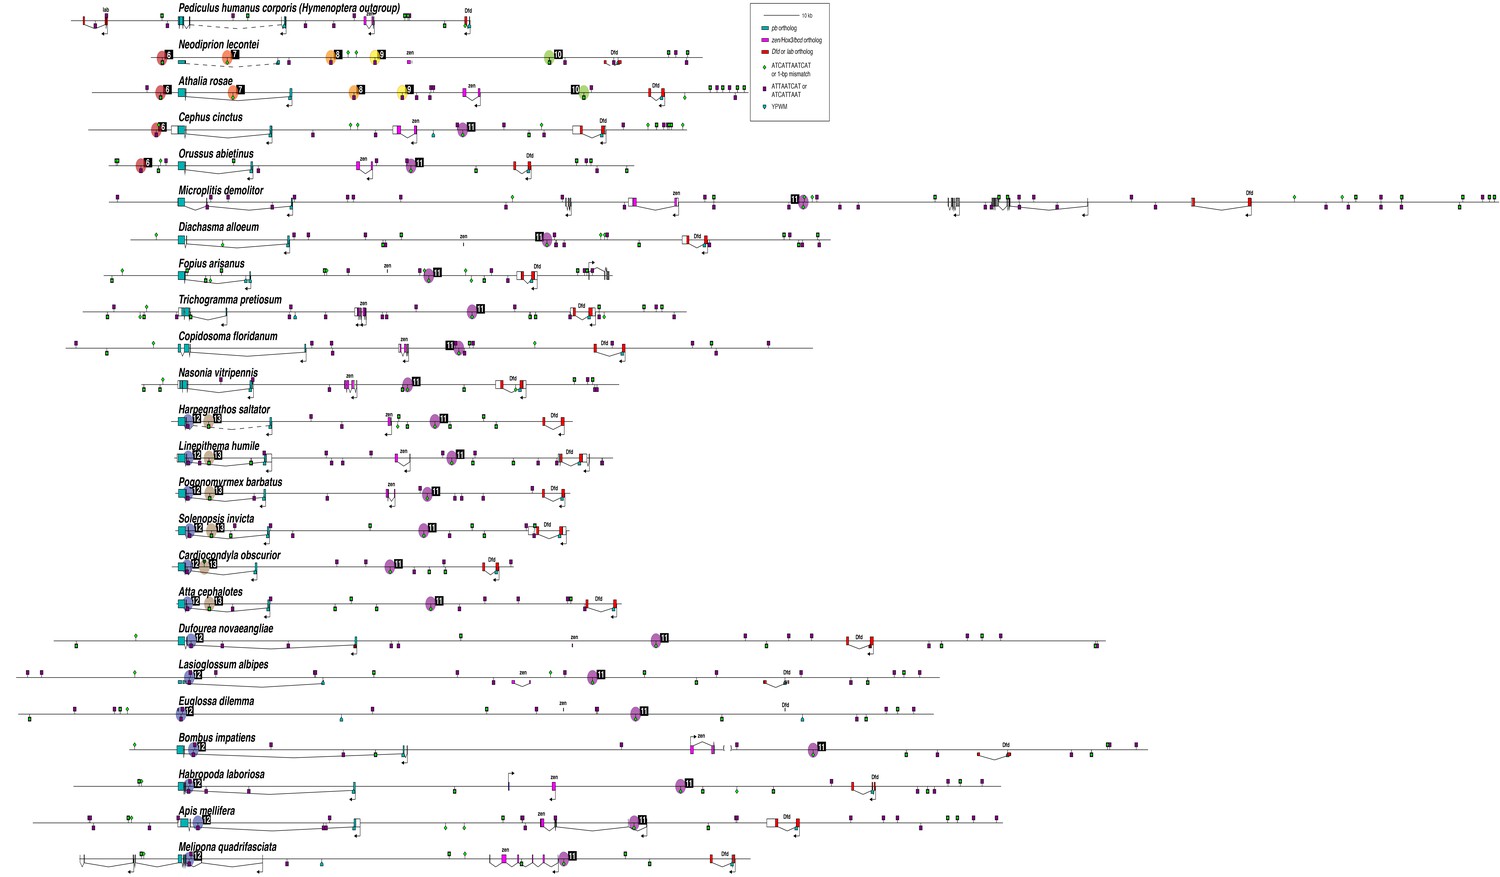
Synteny of pb and zen2 orthologs across Arthropoda.
Best to view high-quality image and zoom in and out as needed. Simplified Arthropod phylogeny indicating functional classification of Hox3 ortholog and observed synteny of pb and zen orthologs. Cladogram based upon annotation in Ensembl Metazoa (https://metazoa.ensembl.org/), Ant Genomes Portal (http://hymenopteragenome.org/ant_genomes/) (Elsik et al., 2016), and others (Beckenbach, 2012; Branstetter et al., 2017; Mao et al., 2015; Misof et al., 2014; Munro et al., 2011; Oosterbroek and Courtney, 1995; Pu et al., 2017; Peters et al., 2017; Regier et al., 2010; Regier et al., 2013; Song et al., 2016). ‘+” next to each species name indicates confirmed synteny of pb and Hox3 orthologs; ‘i’ indicates that pb and Dfd orthologs are found on distinct scaffolds and absence of Hox3 on pb scaffold (‘incomplete information’). ‘D’ indicates duplication of either pb (D2) and/or Hox3 (D3), while ‘M’ indicates multiplication (more than two paralogs). ‘L’ indicates loss of either pb (L2) and/or Hox3 (L3). The transition from Hox-like expression of Hox3 to extraembryonic expression following the divergence of the Collembola and Insecta within Hexapoda (Hughes et al., 2004; Papillon and Telford, 2007) is indicated with a dashed line. Colored boxes identify clades relevant to Figure 6—figure supplements 2–9.
-
Figure 6—figure supplement 1—source data 1
Table of acquired genomic scaffold accession numbers.
- https://cdn.elifesciences.org/articles/39876/elife-39876-fig6-figsupp1-data1-v1.xlsx
Figure 6—figure supplement 2
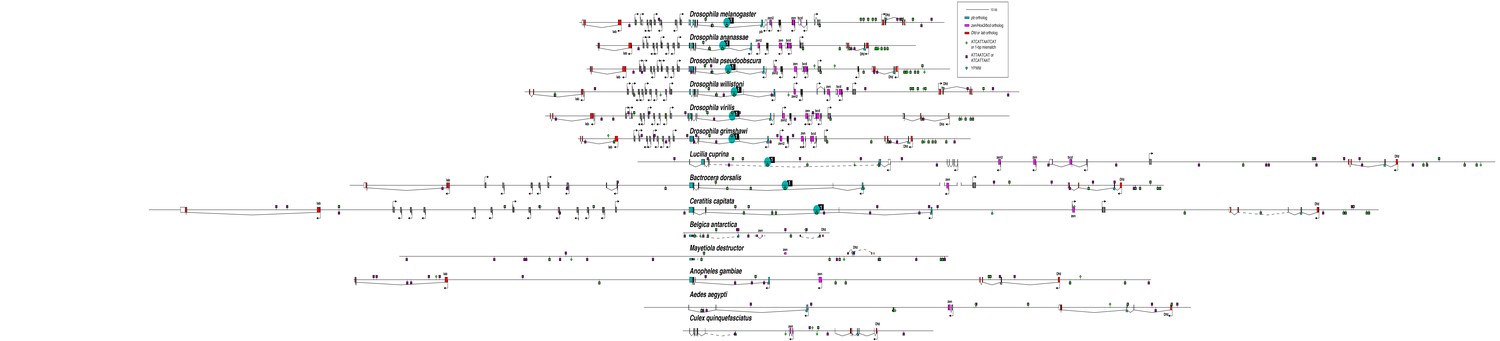
Instances of motifs similar to the EO053 conserved Hox-like motif in the pb region across Arthropods.
Best to view high-quality images and zoom in and out as needed. Visualization of the pb region from the 80 species listed in Figure 6—figure supplement 1. Refer to Figure 6—figure supplement 1 for phylogenetic relationships between species. Each diagram is aligned with the pb ortholog (blue-green) underneath each species name, with labial to the left (red, if present), and Hox3 (magenta, if present) and Dfd (red, if present) to the right of each pb ortholog. Intron/exon structure shown is according to existing genome annotations; dashed lines represent approximate inferred splicing. Open brackets represent boundaries of distinct scaffolds. Locations of sequences matching (12/12 or 11/12) the sequence ATCATTAATCAT are indicated by green diamonds (see Figure 6), while similar sequences (exact matches to either ATCATTAAT or ATTAATCAT) are indicated by dark purple squares. Where green diamonds and purple squares are coincident, the Hox-like ATTAAT core remains intact. Specific Hox-like motifs that show patterns of conservation within clades are indicated by numbered ovals; these specific sequences are aligned in the accompanying Supplementary file 1. The Schizophoran EO053 motif (1; see Figure 6) is not conserved in other Diptera.
Figure 6—figure supplement 3
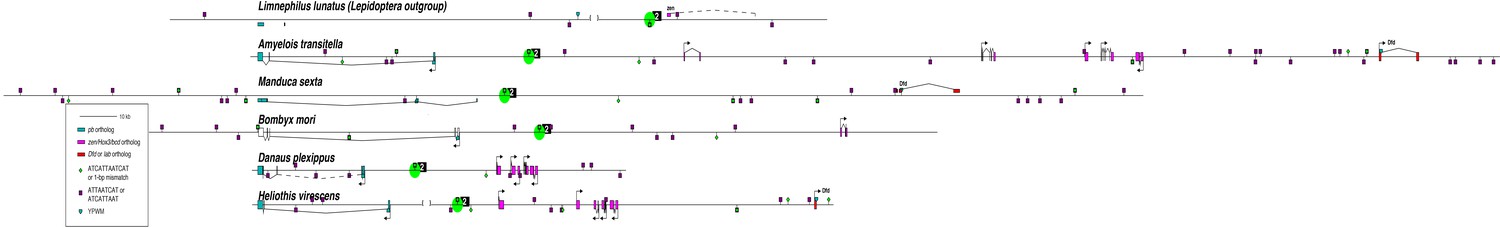
A motif upstream of pb (2) is conserved in Lepidoptera.
Note that for most species many of the Shx (zen homolog) gene duplications are not shown (Ferguson et al., 2014).
Figure 6—figure supplement 4
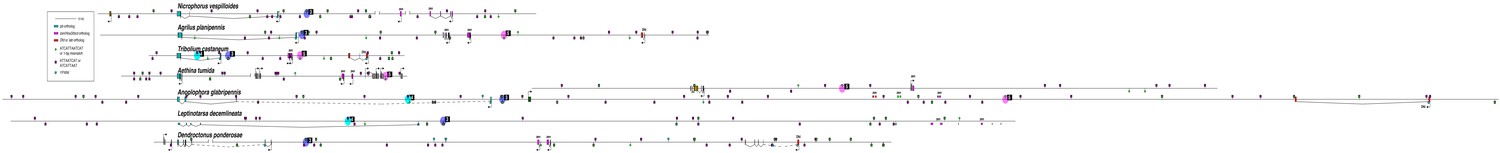
Several motif instances (3, 4, 5) show conservation within the Coleoptera.
The scaffold containing the additional isolated zen paralog in Anoplophora glabripennis is shown above the zen paralogs syntenic to pb.
Figure 6—figure supplement 5
Conservation of several motifs (6-13) within Hymenoptera.
Figure 6—figure supplement 6

A single motif instance (14) appears conserved within some of the Hemiptera, excluding Sternorrhyncha.
Figure 6—figure supplement 7

Diverse basal Hexapods include a motif (15) found in both the termite and cockroach.
Figure 6—figure supplement 8

Crustacea and Myriapoda lack motif conservation and exhibit loss of pb and/or Hox3 orthologs.
Figure 6—figure supplement 9

Some Chelicerates contain similar motifs (16, 17) near the duplicated pb/Hox3 genes.
Where duplicated, paralogs are represented on separate lines.
Figure 7 with 1 supplement

Possible model for EO053 regulation of both zen2 and pb.
(A-C) Diagram of the dynamic activities of EO053 during development. Black arrows indicate active transcription of either zen2 (orange exons) or pb (white and blue exons), and green arrows signify active enhancers regulating transcription of either promoter. (A) At stage 4 in the dorsal blastoderm and at both anterior and posterior poles, zen2 expression is initiated by the upstream enhancer, zen2US. (B) As zen2US loses activity in stage 5, expression of zen2 instead becomes dependent upon EO053 in the dorsal blastoderm, potentially mediated by chromatin looping. (C) Later, in the developing head primordium, EO053 assists region 2.1 in directing pb expression, which may be mediated by interactions involving factors bound to nearby PREs (red in A-C; see also gene diagram in Figure 5).
Figure 7—figure supplement 1
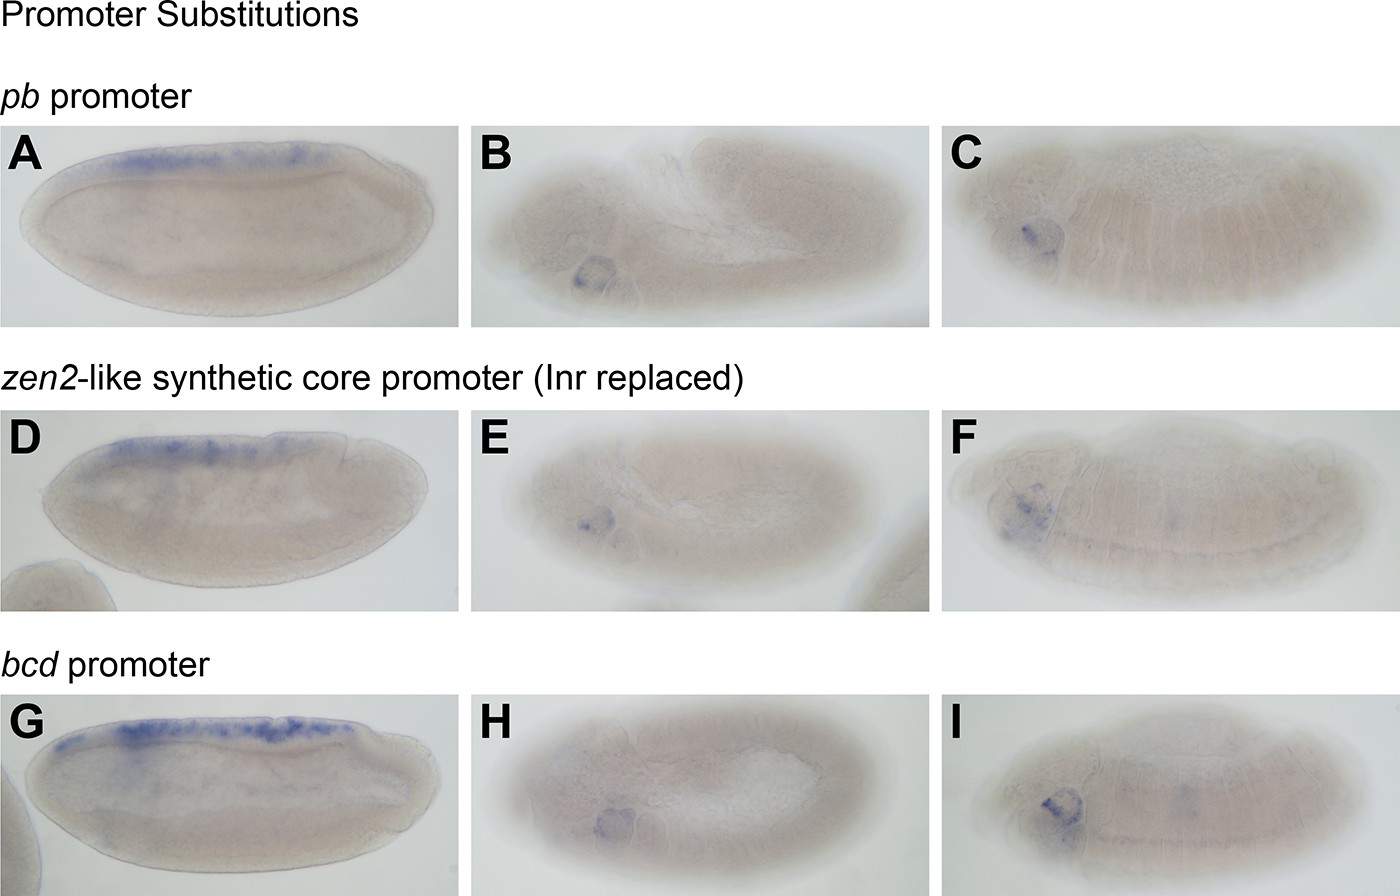
Modifying the reporter promoter does not affect expression pattern driven by EO053.
See also Supplementary file 3 for promoter sequences. Replacement of the Drosophila Synthetic Core Promoter (DSCP) in the reporter vector pBPGUw with either the pb promoter (A–C), a replacement of the DSCP Initiator sequence with that from zen2 (D–F), or the promoter from bcd (G–I). GAL4 mRNA expression from all constructs is shown during the early phase of zen2-like expression (A, D, G) or during later stages of pb-like expression (B, E, H: stage 11–12; C, F, I: stage 13–16).
Tables
Key resources table
| Reagent type (species) or resource | Designation | Source or reference | Identifiers | Additional information |
|---|---|---|---|---|
| Gene (Drosophila melanogaster) | pb | FLYB: FBgn0051481 | ||
| Gene (Drosophila melanogaster) | zen2 | FLYB: FBgn0004054 | ||
| Gene Drosophila virilis) | pb | FLYB: FBgn0211025 | ||
| Genetic reagent (D. melanogaster) | TM3, Ubx-LacZ.w+ | BloomingtonDrosophilaStock Center | BDSC:4432; FBti0002628; RRID:BDSC_4432) | FlyBase symbol: Dmel\P{Ubx-lacZ.w+}TM3 |
| Genetic reagent (D. melanogaster | pbM2:20 | This study | EO053 deletion mutant | |
| Genetic reagent (D. melanogaster | pb11A | This study | 2.1 enhancer deletion mutant | |
| Genetic reagent (D. melanogaster | pb11C | This study | EO053/2.1 enhancer double deletion | |
| Genetic reagent (D. melanogaster | pb11D | This study | 2.1 enhancer deletion mutant | |
| Genetic reagent (D. melanogaster | pb11E | This study | EO053/2.1 enhancer double deletion | |
| Antibody | anti-digoxygenin (sheep polyclonal) | Sigma Aldrich | Cat. No. 11 333 089 001 | 1:500 dilution |
| Antibody | anti-digoxygenin-AP Fab fragments (sheep polyclonal) | Sigma Aldrich | Cat# 11093274910 | 1:2000 dilution |
| Antibody | anti-biotin (mouse) | Roche | Cat. #1 297 597 | 1:500 dilution |
| Antibody | Donkey anti-sheep Alexa-488 | ThermoFisher | Catalog # A-11015 | 1:500 dilution |
| Antibody | Donkey anti-mouse Alexa-555 | ThermoFisher | Catalog # A-31570 | 1:500 dilution |
| Recombinant DNA reagent | DR274 (plasmid) | Addgene | RRID:Addgene_42250 | T7 guide RNA expression |
| Recombinant DNA reagent | MLM3613 (plasmid) | Addgene | RRID:Addgene_42251 | T7 Cas9 expression vector |
| Recombinant DNA reagent | pU6-BbsI-chiRNA (plasmid) | Addgene | RRID:Addgene_45946 | Guide RNA cloning vector forDrosophilainjection |
| Recombinant DNA reagent | pGEM-T (plasmid) | Promega | Cat # A3600 | Cloning vector |
| Recombinant DNA reagent | pBPGUw (plasmid) | Addgene | RRID:Addgene_17575 | GAL4 enhancer cloning vector for Drosophila |
| Sequence-based reagent | EO053-f | This paper | PCR primers | CCCGGAGCGGCACAATTAGTCTTG |
| Sequence-based reagent | EO053-r | This paper | PCR primers | CGGTAATGCTGAATGAACCTTTCAA |
| Sequence-based reagent | DvEO053-f | This paper | PCR primers | TGCCCTGGTTCTTTGGCTAACACG |
| Sequence-based reagent | DvEO053-r | This paper | PCR primers | TTTCTTGTACATAATCGTTCTTGG |
| Sequence-based reagent | Zen2US-f | This paper | PCR primers | TTATATACCCCAGAAGCCCTTCGTGACG |
| Sequence-based reagent | Zen2US-r | This paper | PCR primers | TGATGTGATGACACCAATTTATCTGAGC |
| Commercial assay or kit | LR Clonase II kit | Thermofisher | Cat# 11791020 | |
| Commercial assay or kit | TOPO pCR8/GW kit | Thermofisher | Cat# K2500-20 | |
| Commercial assay or kit | DIG RNA labelling mix | Roche | Cat#11277073910 | |
| Commercial assay or kit | Biotin RNA labelling mix | Roche | Cat#11685597910 | |
| Commercial assay or kit | T7 RNA polymerase | Roche | Cat. No. 10 881 767 001 | |
| Commercial assay or kit | MAXIscript T7 transcription kit | ThermoFisher | Cat# AM1312 | |
| Commercial assay or kit | mMESSAGE mMACHINE T7 Transcription kit | ThermoFisher | Cat# AM1344 | |
| Commercial assay or kit | SuperScript II Reverse Transcription Kit | ThermoFisher | Cat# 18064022 | |
| Commercial assay or kit | iQ SYBR Green Supermix | BioRad | Cat# 18064022 | |
| Other | NBT/BCIP stock solution | Roche | Cat#11681451001 |
Additional files
-
Supplementary file 1
Occurrence and conservation of Hox-like binding motifs in the pb region across Arthropods.
Phylogenetic compilation of motifs similar to the conserved EO053 Hox-like binding motif in the pb region. Alignments correspond to each of the numbered motifs in Figure 5—figure supplement 3–9; shown is a 24-nt segment including each motif (core 12 nt flanked by 6 nt on each side).
- https://cdn.elifesciences.org/articles/39876/elife-39876-supp1-v1.docx
-
Supplementary file 2
Instances of random 12-mer occurrences in the pb region across Schizophora.
A list of 40 random 12-mers analyzed for instances of occurrence and conservation between different species. We also picked a random set of 10 12-mers based upon conservation within the large pb intron between D. melanogaster and D. ananassae for patterns of extended conservation in Schizophora. Only one of the ananassae 12-mers shows conservation beyond D. grimshawi.
- https://cdn.elifesciences.org/articles/39876/elife-39876-supp2-v1.xlsx
-
Supplementary file 3
Promoter sequences relevant to Figure 7—figure supplement 1.
Shown are the D. melanogaster and D. virilis endogenous promoters for pb and zen2, noting the presence and location of various promoter elements, as well as the DSCP sequence from the pBPGUw reporter vector (Pfeiffer et al., 2008). Secondly are shown the sequences replacing the DSCP promoter for testing promoter influence on enhancer expression: pb, zen2-modified DSCP, and bcd.
- https://cdn.elifesciences.org/articles/39876/elife-39876-supp3-v1.docx
-
Supplementary file 4
Reporter sequences and pbM2:20 deletion breakpoints.
All PCR-amplified sequences shown were cloned into pCR8/GW/TOPO. Sequence-verified clones with the same orientation as EO053wt were integrated into pBPGUw by Gateway reaction using LR Clonase II (Pfeiffer et al., 2008). Also included are the sequences at the end of each breakpoint of the pbM2:20 deletion and the HDR template sequence used to generate the deletion of region 2.1.
- https://cdn.elifesciences.org/articles/39876/elife-39876-supp4-v1.docx
-
Transparent reporting form
- https://cdn.elifesciences.org/articles/39876/elife-39876-transrepform-v1.docx
Download links
A two-part list of links to download the article, or parts of the article, in various formats.
Downloads (link to download the article as PDF)
Open citations (links to open the citations from this article in various online reference manager services)
Cite this article (links to download the citations from this article in formats compatible with various reference manager tools)
Disparate expression specificities coded by a shared Hox-C enhancer
eLife 9:e39876.
https://doi.org/10.7554/eLife.39876


