Disparate expression specificities coded by a shared Hox-C enhancer
- Division of Biological Sciences, Section of Cell & Developmental Biology, University of California San Diego, United States
Abstract
Can a single regulatory sequence be shared by two genes undergoing functional divergence? Here we describe a single promiscuous enhancer within the Drosophila Antennapedia Complex, EO053, that directs aspects of the expression of two adjacent genes, pb (a Hox2 ortholog) and zen2 (a divergent Hox3 paralog), with disparate spatial and temporal expression patterns. We were unable to separate the pb-like and zen2-like specificities within EO053, and we identify sequences affecting both expression patterns. Importantly, genomic deletion experiments demonstrate that EO053 cooperates with additional pb- and zen2-specific enhancers to regulate the mRNA expression of both genes. We examine sequence conservation of EO053 within the Schizophora, and show that patterns of synteny between the Hox2 and Hox3 orthologs in Arthropods are consistent with a shared regulatory relationship extending prior to the Hox3/zen divergence. Thus, EO053 represents an example of two genes having evolved disparate outputs while utilizing this shared regulatory region.
Editorial note: This article has been through an editorial process in which the authors decide how to respond to the issues raised during peer review. The Reviewing Editor's assessment is that all the issues have been addressed (see decision letter).
Introduction
Changes in the expression specificity of genes involved in the development of multicellular organisms are implicated in modifications of form and function over evolution (Stern and Orgogozo, 2008; Wray, 2007; Rebeiz and Tsiantis, 2017; Rubinstein and de Souza, 2013). To produce these distinct expression patterns, the promoters of many developmental genes are activated in specific spatiotemporal domains by one or more distal cis-regulatory sequences (Long et al., 2016; Levine, 2010). Over the last three decades, two contrasting modes of promoter regulation by such sequences have emerged. Commonly, a gene specifically expressed in multiple diverse developmental contexts has distinct cis-regulatory sequences known as enhancers, each of which directs expression in a specific, limited subset of the overall context (Kuzin et al., 2012; Frost et al., 2018; Simonet et al., 1991; MacNeill et al., 2000; Harding et al., 1989). In a second mode, multiple neighboring genes with overlapping expression domains can be controlled by a shared distal cis-regulatory region, referred to as a locus control region (LCR), that directs expression of the target genes in a common spatial and temporal pattern during development (Ahn et al., 2014; Choi and Engel, 1988; Deschamps, 2007; Foley et al., 1994; Lehoczky et al., 2004; Sharpe et al., 1998; Spitz et al., 2003; Tsai et al., 2016; Jones et al., 1995; Tsujimura et al., 2007; Mohrs et al., 2001). These two modes of activation are not mutually exclusive, and genes regulated by LCRs can also have their own independent enhancers (Deschamps, 2007; Jones et al., 1995).
Most experimental models for changes in patterns of gene expression have come from studies of specific enhancers. The developmental context of an enhancer’s action is typically determined by the sequence-directed recruitment of specific DNA-binding transcription factors (Levine, 2010). The specificity of an enhancer can be modified in evolution by DNA mutations affecting the complement of transcription factors recruited to the module (Glassford and Rebeiz, 2013; Rebeiz and Tsiantis, 2017; Stern and Frankel, 2013). Thus, enhancers can acquire additional specificities that change the expression pattern of their target genes as long as the change is either not detrimental or accompanied by additional stabilizing mutations. Such models for enhancer evolution are often proposed in the context of ‘shadow enhancers’, in which two enhancers regulating the same gene have overlapping and/or synergistic activity (Barolo, 2012; Perry et al., 2011; Miller et al., 2014; Cannavò et al., 2016; Stern and Frankel, 2013). In this case, the partial redundancy between the two enhancers could buffer the effects of mutation and divergence of regulatory sequence (Payne and Wagner, 2015). When an enhancer acquires multiple specificities, evolution can potentially lead to 1) loss of the newly acquired specificity (Jeong et al., 2008; Jeong et al., 2006), 2) loss of the original specificity, 3) complete loss of enhancer function, or 4) maintenance of the complex pattern. The latter two outcomes may be dependent upon the degree of use of the same transcription factors for both specificities, as loss of binding sites for shared factors would affect both expression patterns (Rebeiz et al., 2011).
In this work, we investigate an unusual case of complex expression through analysis of a 1.4-kb enhancer, referred to as EO053. We identified this region through the modENCODE effort, based upon detection of CBP binding only during embryonic stages (‘Embryo Only 053’) by chromatin immunoprecipitation (Nègre et al., 2011). We show that EO053 encodes complex spatiotemporal activity correlating with the evolutionary divergence in the expression and function of the two neighboring developmental genes under its regulatory influence. We present a distinctive mode of activation by EO053, in which each target gene utilizes EO053 for distinct spatiotemporal outputs.
EO053 is located within an intron of the proboscipedia (pb) gene in Drosophila melanogaster, which encodes a homeodomain-containing transcription factor involved in patterning along the anteroposterior axis. pb is found within a complex of related homeobox (Hox) genes, a pattern common in metazoans (Lemons and McGinnis, 2006). This collection of genes in D. melanogaster, referred to as the Antennapedia Complex (Antp-C), represents half of an ancestral Arthropod Hox gene complex that bifurcated within the Schizophora clade of flies into the Antp-C and Bithorax Complex (Bx-C), located 10 megabases away (Negre and Ruiz, 2007). Adjacent to pb, which is the Hox2 ortholog, are three genes derived from the ancestral Arthropod Hox3 gene: zerknüllt (zen), its duplicate zen2, and bicoid (bcd). At an early stage of insect evolution, the Hox3 ortholog (zen) diverged in both expression and function away from anteroposterior patterning to specifying extra-embryonic tissue at earlier stages in embryonic development (Hughes et al., 2004). More recently within Schizophoran flies, tandem duplications of zen produced zen2 and bcd (Stauber et al., 1999; Stauber et al., 2002; Negre et al., 2005), the latter of which diverged further into a role as a morphogen specifying the anterior pole of the embryo (Driever and Nüsslein-Volhard, 1988; Struhl et al., 1989). The insect radiation that followed the Hox3/zen divergence dates to the Devonian period (Misof et al., 2014), implying that the regulatory changes in zen are roughly 400 million years old. Intriguingly, EO053 encodes a union of expression patterns resembling both pb and its immediate upstream neighbor, zen2, suggesting that this enhancer may regulate the expression of both genes even though they are activated in unrelated, non-overlapping tissues and developmental stages. Here we show that deletion of EO053 via CRISPR/Cas9 affects mRNA accumulation from both pb and zen2, indicating that indeed this enhancer is shared between these two genes. We also find that the sequences responsible for the pb-like and zen2-like expression patterns within EO053 are highly overlapping, and we identify nucleotide segments that contribute to both specificities. One such nucleotide block contains a conserved sequence existing prior to the Schizophoran zen-zen2 duplication, and we find that variants of this motif exhibit patterns of conservation within many of the major insect clades following the Hox3/zen divergence. Finally, we show that the pattern of synteny between zen and pb within the insects, and the lack of separation of these genes by translocation, is consistent with an ancient regulatory relationship between them, even in the face of disparately evolving specificities.
Results
The EO053 enhancer specificities overlap the expression patterns of both pb and zen2
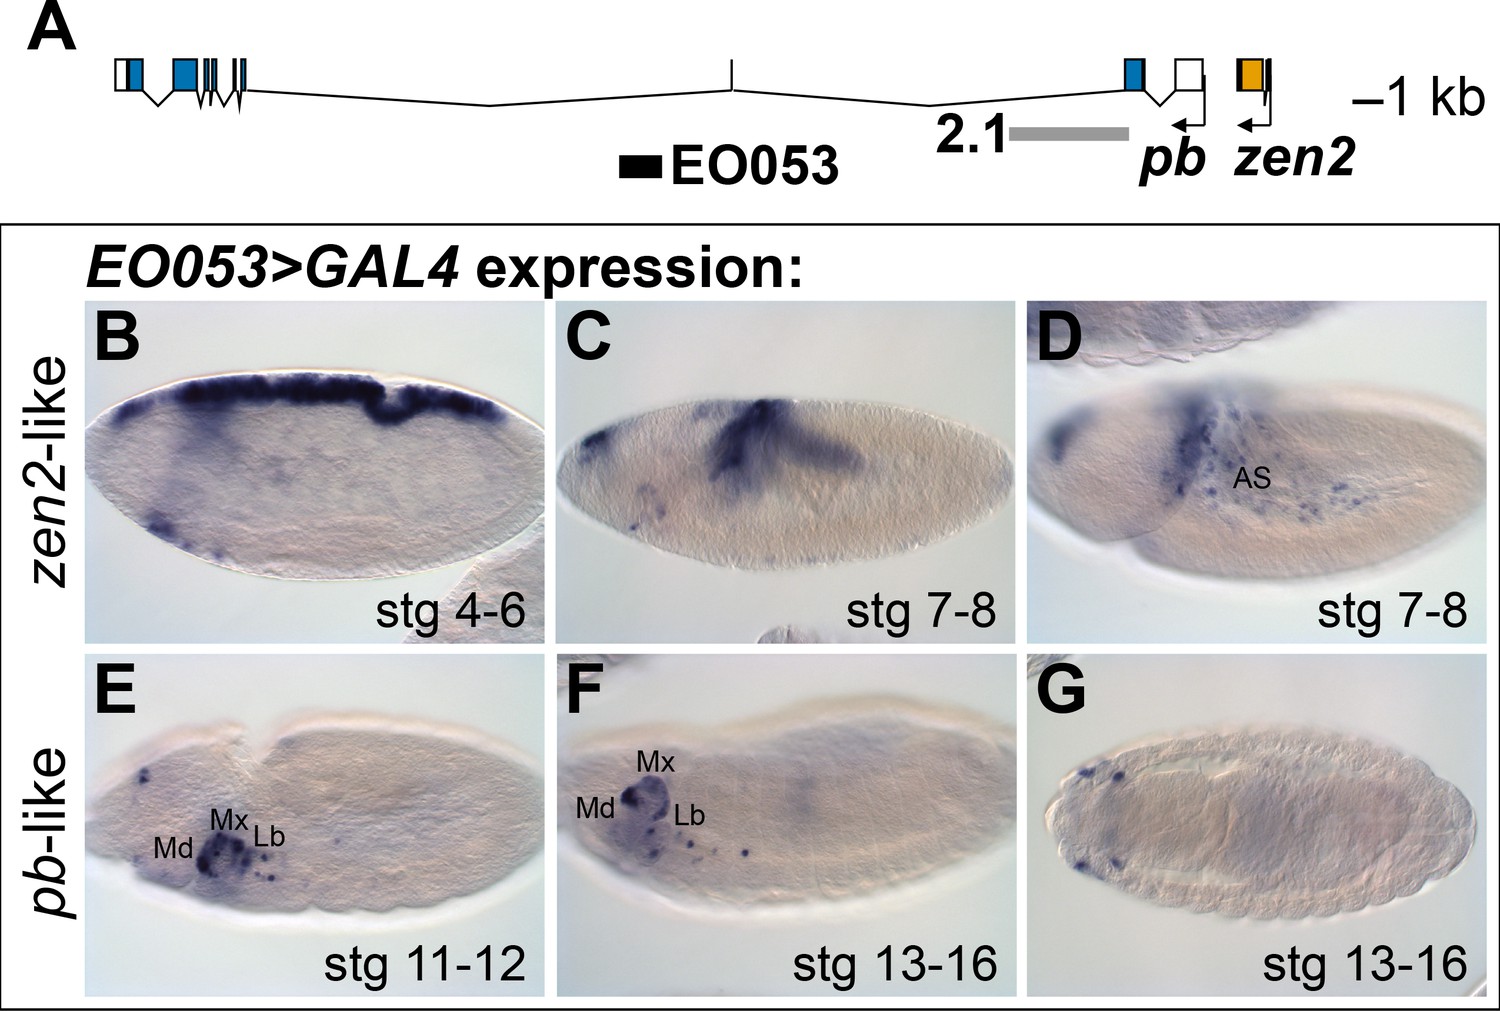
The location of EO053 within the large intron of pb suggested that pb itself may be the target of this enhancer (Figure 1A). Indeed, at embryonic stages when Pb protein is detected in maxillary and labial segments (Pultz et al., 1988) we find that EO053 drives GAL4 expression in these territories as well (Figure 1E-G), although not in a pattern as expansive as that driven by the previously-studied pb regulatory region 2.1 (Figure 1A; Kapoun and Kaufman, 1995a). Interestingly, in blastoderm stages EO053 also drives GAL4 expression dorsally along most of the length of the embryo (similar to the pattern seen in Figure 1B). Following gastrulation, GAL4 is detected in the amnioserosa (Figure 1C,D), a specificity derived from the earlier dorsal cell population (Hartenstein, 1995). This pattern is not representative of pb, but rather mimics the expression of zen2 (Pultz et al., 1988), the gene immediately upstream of pb (Figure 1A). This additional expression could simply represent a coincidental ectopic artifact of the precise genomic segment chosen for cloning the enhancer. However, the orthologous region from Drosophila virilis also encodes both expression specificities, reducing the likelihood of this being a chance occurrence (Figure 1—Figure Supplement 1A, C – C’’).
Figure 1 with 1 supplement see all
EO053 exhibits both zen2-like and pb-like expression patterns.
(A) Diagram of the pb (blue) and zen2 (yellow) genes and the locations of EO053 (black bar) and the 2.1 pb regulatory region (grey bar) (Kapoun and Kaufman, 1995a). Scale is shown at upper right. (B-G) Expression of GAL4 mRNA by in situ hybridization in EO053>GAL4 embryos exhibits a pattern reminiscent of zen2 (Rushlow et al., 1987) in early embryonic stages (B-D; see also Figure 5 and http://insitu.fruitfly.org/cgi-bin/ex/report.pl?ftype=1&ftext=FBgn0004054) and overlaps expression of pb (Pultz et al., 1988) in later stages (E-G; see also Figure 5 and http://insitu.fruitfly.org/cgi-bin/ex/report.pl?ftype=1&ftext=FBgn0051481). AS: amnioserosa. Md: mandibular segment. Mx: maxillary segment. Lb: labial segment. See also Figure 1—figure supplement 1.
While numerous regulatory regions have been shown to serve more than one promoter (Choi and Engel, 1988; Deschamps, 2007; Foley et al., 1994; Lehoczky et al., 2004; Sharpe et al., 1998; Spitz et al., 2003; Tsai et al., 2016; Jones et al., 1995; Tsujimura et al., 2007; Mohrs et al., 2001), these genes typically have expression specificities in common. EO053, then, may serve as an example of a regulatory region that serves more than one promoter but with each gene utilizing the region to generate a different specificity. We thus sought to determine how linked are these specificities and whether each gene indeed requires the EO053 region for expression.
The pb-like expression specificity derives from the central region of EO053
We first began analyzing EO053 under a simple model for encoding multiple specificities: Each expression pattern is dependent upon a separate subregion of the 1.4-kb EO053 sequence. We created a set of reporter constructs containing overlapping truncated portions of EO053 (trunc1, trunc2, trunc3, trunc1-2, trunc2-3; Figure 2). The central region, trunc2, drives both pb-like and zen2-like expression but not as robustly as the full EO053 construct (Figure 2E,F). This region also drives ectopic expression in the ventral embryo at stage 10 (Figure 2F) and ectopic dorsal expression (amnioserosa or dorsal vessel) in late-stage embryos (Figure 2G). The right-most region, trunc3, also drives pb-like expression, though very weakly (Figure 2I,J). A construct that encompasses both the trunc2 and trunc3 regions drives reporter expression in a robust pb-like pattern that also lacks the ectopic activities seen with trunc2 alone (Figure 2O,P), suggesting that trunc3 contains elements that repress the late dorsal expression. This model is further supported by the trunc1-2 construct (removing the right-most portion of EO053) that also drives ectopic late dorsal expression (Figure 2M).
Figure 2
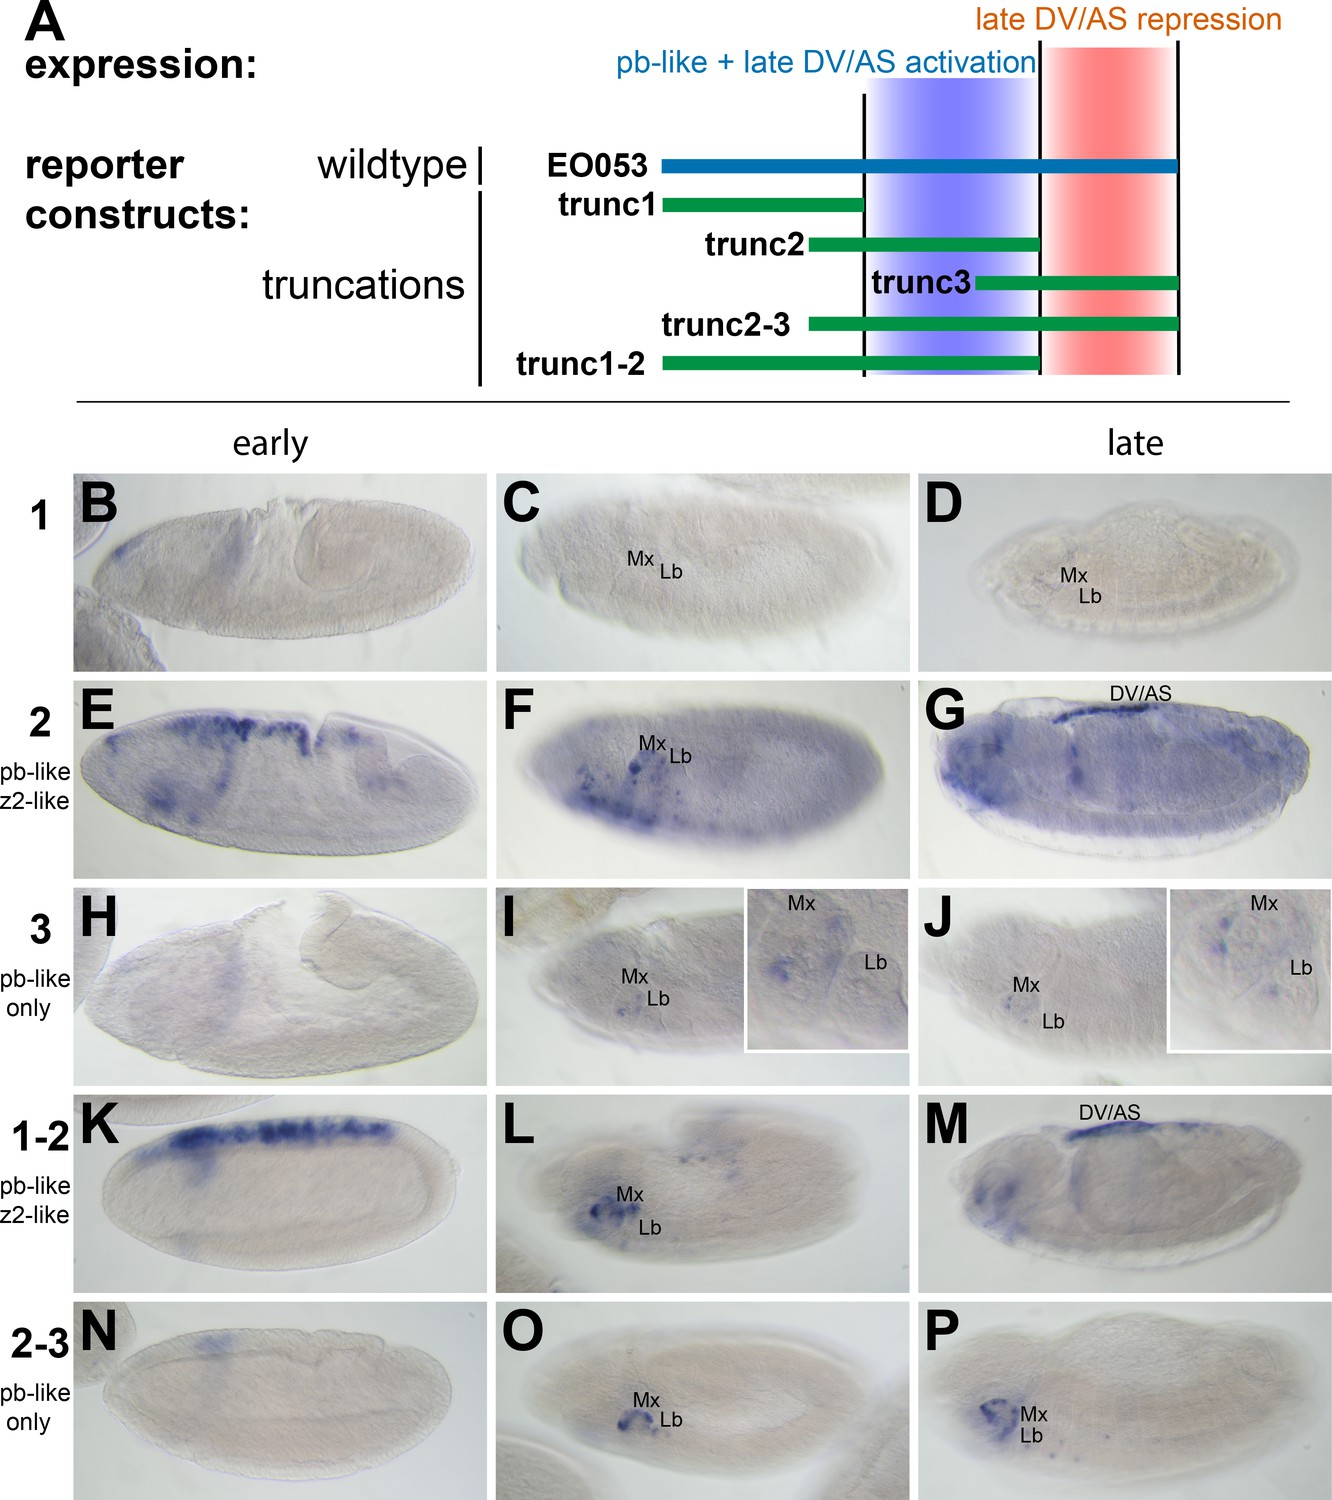
pb-like expression driven by EO053 can be localized to a central region of the enhancer.
(A) Diagram indicating the boundaries of five truncations of EO053 (green bars) and localized expression specificities deduced from reporter assays. While pb-like expression can be localized to a subregion of EO053, the zen2-like expression cannot. ‘DV/AS’=dorsal vessel/amnioserosa. (B-P) Expression of GAL4 mRNA by in situ hybridization in transgenic reporter lines described in panel A. (B, E, H, K, N) GAL4 expression in early embryos (stg 5–8), noting the zen2-like pattern in E and K only. E represents a rare embryo with early dorsal expression, and only during stage 6. (C, F, I, L, O) Segment labels as in Figure 1. GAL4 expression in stage 10–12 embryos, noting pb-like expression in panels F, I, L, and O. (D, G, J, M, P) GAL4 expression in stage 13–16 embryos. Two constructs that both contain the trunc2 region but lack the remaining 3’ portion of EO053 express ectopic GAL4 in the DV/AS region (G, M). Insets in I and J represent zoomed-in sections highlighting the low signal in the maxillary and labial segments found with the trunc3 construct. See Figure 1—figure supplement 1 for a diagram of these and all constructs used in this study.
The zen2-like and pb-like expression specificities are not easily separable
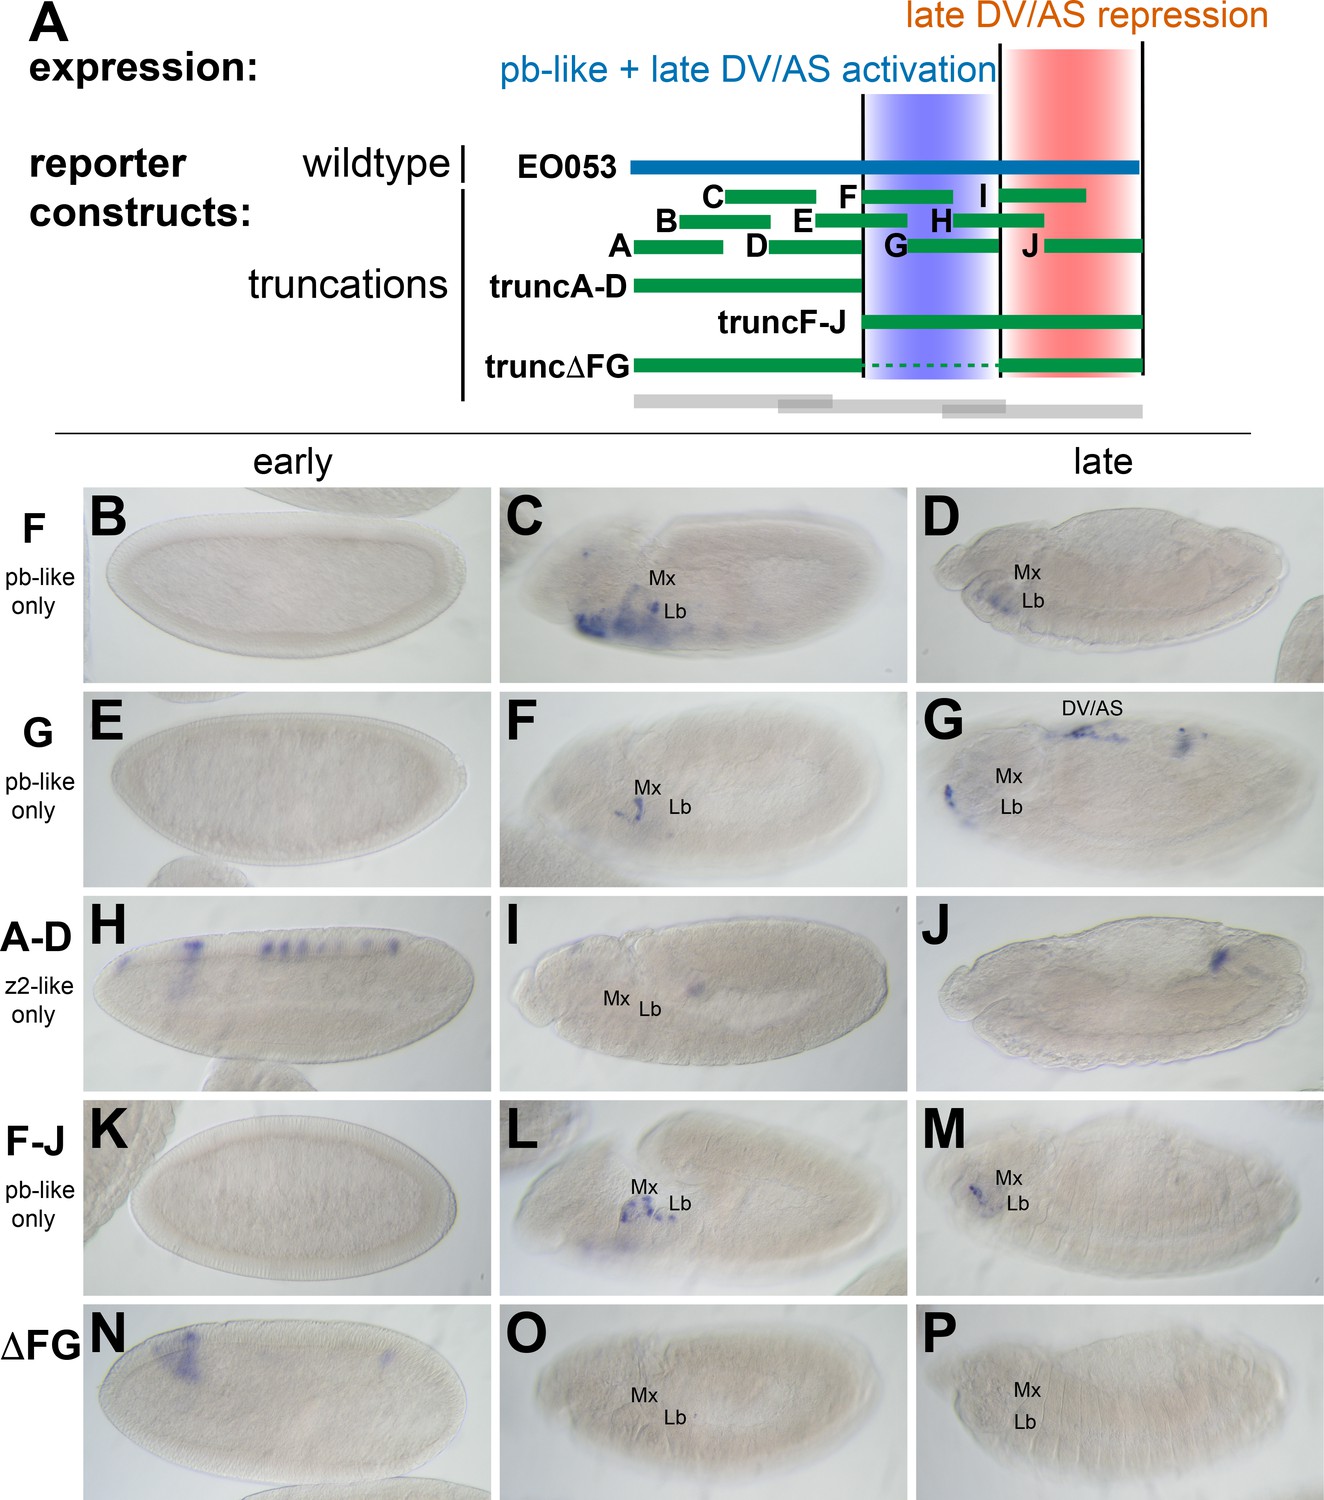
While trunc2 retains some capacity to drive zen2-like expression (Figure 2E), it was only weakly detectable in a few early-gastrulation embryos (embryo in Figure 2E is rare; most stage 5 embryos lack GAL4 expression). A construct including trunc2 and the left-most portion of EO053, trunc1-2, restores zen2-like expression (Figure 2K), yet the left-most portion alone, trunc1, fails to drive reporter expression at any stage (Figure 2B–D). Since these initial truncation constructs failed to reveal a region in EO053 responsible for the zen2-like expression, we designed a set of 10 smaller overlapping reporter constructs to locate the zen2-like activity (Figure 3A). None of these smaller fragments drive reporter expression in a zen2-like pattern (Figure 3—figure supplement 1), while two fragments, truncF and truncG, drive reporter expression in a pb-like pattern (Figure 3C,D,F,G), consistent with their overlap with trunc2 (Figure 3A). Furthermore, we again observed late expression in the dorsal embryo driven by truncG (Figure 3G), refining the location of this ectopic activity seen neither with full-length EO053>GAL4 or endogenous pb or zen2 mRNA. These fragments allowed us to further define the domain sufficient to produce the pb-like pattern, and suggested that if the pb-like and zen2-like specificities were separable, the latter pattern would be localized to the left-most region of EO053 outside of truncF and truncG. Importantly, truncF-J, which lacks this left-most region, fails to drive zen2-like GAL4 expression (Figure 3K). However, truncA-D, a construct containing only this region, fails to drive strong zen2-like reporter expression (Figure 3H). This suggests that while the A-D region is necessary (but not sufficient) for the zen2-like pattern, the FG region likely also contains elements required for this specificity, in addition to being sufficient to drive pb-like expression. Consistent with this interpretation, a construct that deletes this region, truncΔFG, lost both pb-like and zen2-like expression patterns (Figure 3N–P).
Figure 3 with 1 supplement see all
zen2-like expression driven by EO053 requires the central region of the enhancer.
(A) Diagram indicating relative locations of the second set of constructs representing truncated versions of EO053 (green bars). Boundaries of the constructs shown in Figure 2 are indicated for comparison (grey bars). (B-P) Expression of GAL4 mRNA by in situ hybridization in a subset of transgenic reporter lines described in A (See Figure 3—figure supplement 1 for images of truncA – truncJ). DV/AS: dorsal vessel/amnioserosa; segment labels as in previous figures. (B, E, H, K, N) GAL4 expression in early embryos (stg 5–8), noting the striped zen2-like pattern in H only. (C, F, I, L, O) GAL4 expression in stage 10–12 embryos, noting pb-like expression in panels C, F, and L. (D, G, J, M, P) GAL4 expression in stage 13–16 embryos. truncG overlaps trunc2 region but lacks the remaining 3’ portion of EO053 and expresses ectopic GAL4 in the DV/AS region (G). (N-P) truncΔFG, which lacks regions F through G, fails to express GAL4 in either pb- or zen2-like patterns. See also Figure 1—figure supplement 1.
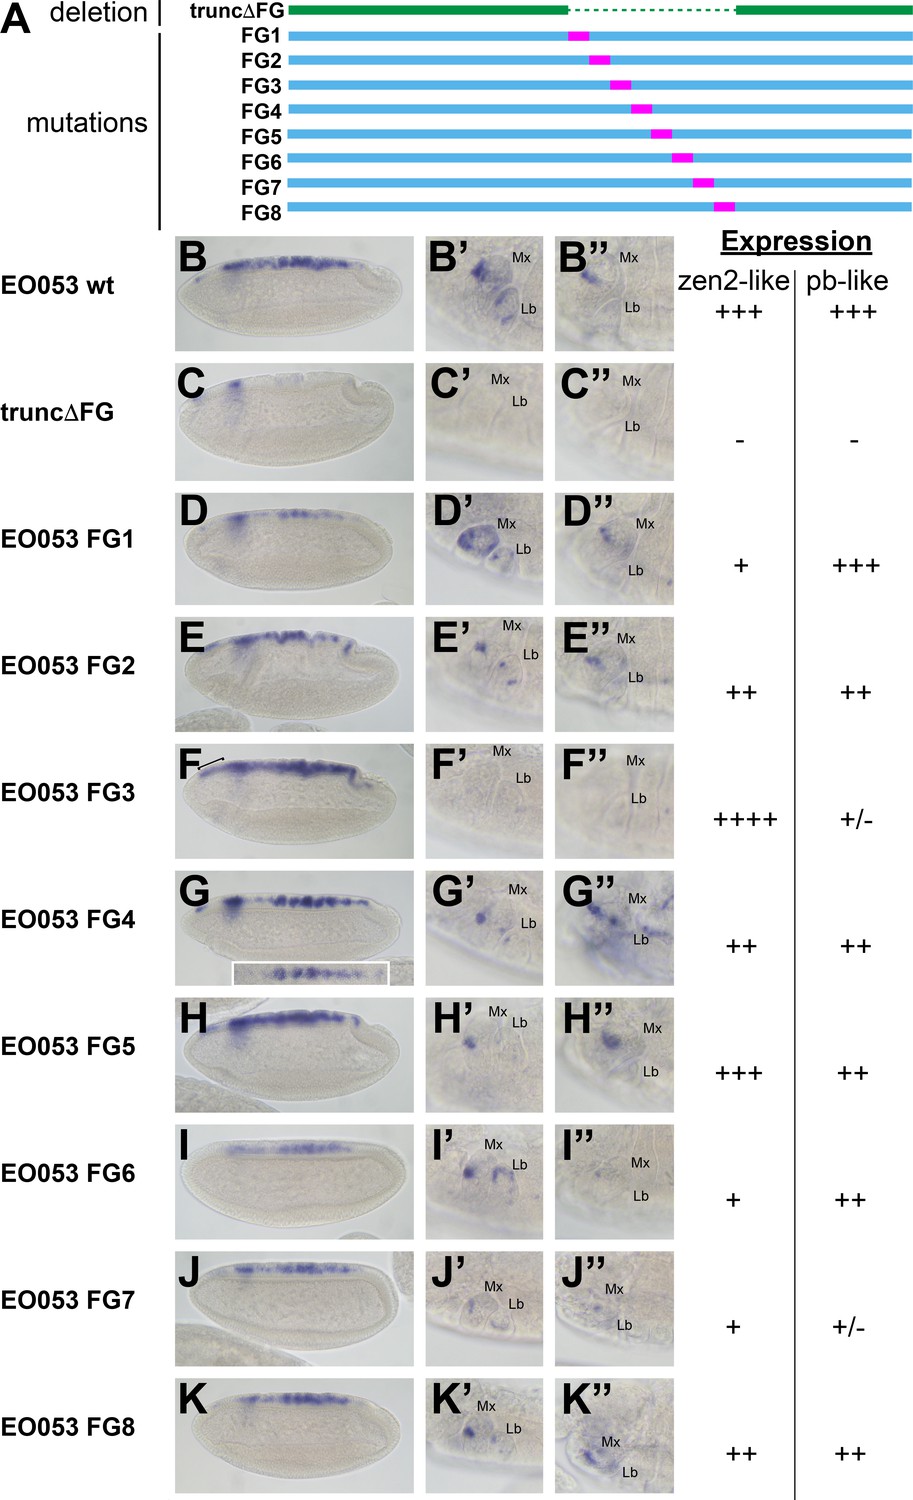
Because the FG region is necessary for both the pb-like and zen2-like patterns, we sought an alternative approach to determine if the two patterns are indeed separable. In a series of eight constructs, we created successive 47-nt non-complementary transversion mutations along the length of the FG region to identify sequences required for either the pb-like or zen2-like patterns (Figure 4). Interestingly, none of the 47-nt mutations could recapitulate the strong reduction of zen2-like activity seen in EO053ΔFG>GAL4. Two mutants, FG3 and FG7, strongly reduce the pb-like expression pattern (Figure 4F’–F’’, J’–J’’). Each of these mutants also affects the zen2-like pattern, though in opposite directions: FG3 causes an ectopic anterior expansion of the zen2-like pattern (Figure 4F), while FG7 reduces zen2-like expression (Figure 4J). FG1, FG2, FG4, FG6, and FG8 also reduce expression in the zen2-like pattern (Figure 4D–K). The reduced expression seen with the FG4 mutation results in dorsal stripes (Figure 4G), which were also observed with the insufficient truncA-D construct (Figure 3H). Together, these data suggest that while the pb-like pattern can be effectively localized to the FG region in EO053, the elements required for zen2-like expression are spread much more broadly throughout EO053 and are even linked to regions necessary for the pb-like pattern.
Figure 4
Mutation of specific nucleotide segments in the FG region of EO053 can affect either pb-like or zen2-like expression.
(A) Diagram of a series of 47-nt non-complementary transversion mutants generated within the FG region (FG1 – FG8, blue, with mutated segments shown in pink), and the same region deleted in the truncΔFG construct (green). (B-K) GAL4 mRNA expression in early (stage 4–6) embryos. zen2-like expression is absent in truncΔFG (C); reduced in FG1 (D), FG2 (E), FG4 (G), FG6 (I), FG7 (J), and FG8 (K); and expanded anteriorly in FG3 (F: bracket). Inset in G is a dorsal view of an embryo exemplifying the pseudo-stripe pattern of GAL4 expression along the anteroposterior axis driven by the FG4 mutant reporter. (B’-K’’) GAL4 mRNA expression in maxillary and labial segments of stage 10–12 embryos (B’–K’) and stage 13–16 embryos (B’’–K’’). Segment labels as in previous figures. pb-like expression is absent in truncΔFG (C’, C’’) and strongly reduced in FG3 (F’, F’’) and FG7 (J’, J’’). Qualitative scoring of reporter strength is represented to the right of the images for each line. See also Figure 1—figure supplement 1.
EO053 cooperates with gene-specific enhancers to direct the full expression of both pb and zen2
While the pb- and zen2-like specificities appear to be linked within the EO053 sequence, we sought to determine whether EO053 is functionally linked to either pb or zen2, or both. We thus generated via CRISPR/Cas9 a deletion of the EO053 region at the endogenous pb locus, designated pbM2:20. A chromosomal deletion removing zen2 and null for pb, pb23 (a.k.a. pbmap8), lacks any embryonic cuticle phenotype (Pultz et al., 1988). Therefore, we examined effects upon both pb and zen2 mRNA accumulation (Figure 5). Kapoun and Kaufman have shown that pb mini-genes lacking large sections of the intron overlapping EO053 are capable of rescuing adult mouthparts-to-leg transformations in pb null flies and that the 2.1 enhancer is required for rescue in the context of these small pb mini-genes (Kapoun and Kaufman, 1995a). Thus, because the 2.1 enhancer is unaffected in pbM2:20 homozygous embryos, we were not surprised to observe detectable pb mRNA in these embryos (Figure 5B,C), as well as in labial discs from 3rd-instar larvae (Figure 5—figure supplement 1). Kapoun and Kaufman also showed that a 10.6-kb fragment—apparently overlapping EO053 sequence—was able to drive LacZ expression in maxillary and, to a lesser extent, labial segments in embryos (Kapoun and Kaufman, 1995a). While this is strikingly similar to the EO053 expression pattern we observe, it is possible that additional pb enhancers outside of EO053 reside on this 10.6-kb fragment. Despite 2.1 and other potential pb enhancers remaining intact in pbM2:20 flies, in double-blind scoring of pb expression in parallel in situ hybridization experiments, we were able to observe a statistically significant reduction in pb mRNA accumulation in pbM2:20 embryos compared to w1118 controls (Figure 5—figure supplement 2A–C). We failed to validate this difference by qPCR in staged embryos, however (Figure 5—figure supplement 2D,E), and suspected that region 2.1 may be masking the consequence of EO053 deletion. Consistent with this hypothesis, deletion of region 2.1 alone was sufficient to cause a noticeable reduction in expression area in maxillary and labial segments in mutant embryos (Figure 5E, Figure 5—figure supplements 3, 4) and in labial discs from 3rd-instar larvae (Figure 5—figure supplement 1), and to cause a proboscis-to-leg transformation in adult flies (Figure 5—figure supplement 5) reminiscent of pb null mutants. The remaining pb mRNA detectable in Δ2.1 single mutants, however, was reduced to an even greater extent when EO053 was also deleted, as observed in maxillary and labial segments in double mutant embryos (Figure 5F, Figure 5—figure supplements 3, 4) and in labial discs (Figure 5—figure supplement 1). This strong effect upon pb mRNA expression relative to the Δ2.1 single mutants did not appear to enhance the proboscis-to-leg transformation, however (Figure 5—figure supplement 5). These data suggest that indeed EO053 serves a role as a dual enhancer of pb, operating in addition to the 2.1 and potentially other enhancers (Kapoun and Kaufman, 1995a).
Figure 5 with 5 supplements see all

EO053 cooperates with other enhancers to regulate mRNA accumulation from both pb and zen2.
(A) Diagram of the pb-zen2 region, noting the locations of putative Polycomb Response Elements (‘PREs’, red; see Discussion) (Nègre et al., 2011); EO053 and zen2US enhancer regions (black) and the pb 2.1 regulatory region (grey) (Kapoun and Kaufman, 1995a); and a Doc type transposon (Vaury et al., 1994) in the 5’ end of pb intron 2. Below the diagram of the genomic region are shown CRISPR/Cas9-generated deletions overlapping EO053 only (pbM2:20), the 2.1 enhancer only (pb11A or the identical pb11D seen in Figure 5—figure supplement 3 and Figure 5—figure supplement 1), and both EO053 and 2.1 enhancers (pb11C or the identical pb11E seen in Figure 5—figure supplement 3 and Figure 5—figure supplement 1). (B-F) Effects of enhancer deletion on pb expression. (B) pb mRNA expression in a w1118 embryo at stage 11–12. (B’) Zoom-in of the pb in situ signal in the mandibular (Md), maxillary (Mx), labial (Lb) segments, and hypopharyngeal lobe (Hy). (C) pb mRNA expression in a pbM2:20 embryo at stage 11–12. (C’) Zoom-in of the pb in situ signal, with labeling as in B’. See also Figure 5—figure supplement 2. (D-F) Confocal maximum projection of pb mRNA detected through fluorescent in situ hybridization (FISH) in the maxillary and labial segments of embryos of the indicated genotypes. (D) pb11C/TM3,Ubx-LacZ stage 11–12 embryo. (E) pb11A/pb11A stage 11–12 embryo, noting dramatically reduced signal area relative to D. (F) pb11C/pb11C stage 11–12 embryo exhibiting signal area reduced relative to D and E. See also Figure 5—figure supplement 3 – 5. (G, H) Expression of GAL4 directed by the reporter zen2US. Embryos containing zen2US>GAL4 have detectable GAL4 mRNA expression at stage 4 (G) and lack GAL4 expression during stage 5 (H). (I-L’) Effect of the pbM2:20 deletion on zen2 expression. zen2 mRNA expression at either stage 4 (I,K) or stage 5 (J,L) in w1118 embryos (I,J) or pbM2:20 embryos (K,L). (I’,J’,K’,L’) Pie-chart representation of zen2 mRNA expression pattern as resembling zen2US (polar, red), EO053 (dorsal, blue), or absent (none, green).
-
Figure 5—source data 1
Scoring Data for pbM2:20 pb and zen2 in situ phenotypes (Figure 5 and Figure 5—figure supplement 2).
- https://cdn.elifesciences.org/articles/39876/elife-39876-fig5-data1-v1.xlsx
We similarly anticipated that if EO053 regulates zen2 it may not act alone on this target either. Endogenous zen2 mRNA accumulation expands to the anterior and posterior poles of blastoderm-stage embryos (Figure 5I), a pattern that differs from expression driven by EO053, which is absent from the poles (Figure 1B). While the regulation of zen2 expression has not yet been pursued, an investigation of the paralogous zen gene found that a reporter driven by the promoter-proximal region recapitulates endogenous zen gene expression (Doyle et al., 1989). Guided by the zen2 inversion between D. melanogaster and D. virilis (Figure 1—figure Supplement 1D), we cloned the zen2 promoter-proximal region (zen2US) and found that it is indeed capable of driving reporter expression in a pattern that recapitulates the polar expansion of endogenous zen2 mRNA (Figure 5G). Intriguingly, the EO053 and zen2US patterns differ not only spatially but temporally, with zen2US driving reporter expression only until the completion of cellularization at stage 5 (Figure 5G,H), while EO053 is strongly active at this stage and continues to gastrulation (Figure 1B–D). Such a transition is also observed with endogenous zen2 mRNA: Early expression includes expression in polar regions as well as dorsally at stage 4 (Figure 5I), but following cellularization the mRNA is largely detectable only in dorsal-most cells and is absent from the anterior and posterior poles (Figure 5J). We find that only this later and not the earlier accumulation of endogenous zen2 mRNA requires EO053, as pbM2:20 embryos largely fail to express zen2 beyond cellularization (Figure 5L,L’). Thus, EO053 appears to have dual roles in Drosophila embryogenesis, assisting other enhancers in early stages with zen2 expression and then with pb expression during later morphogenetic events (Figure 7).
pb and zen genes remain syntenic despite the change in zen expression
The zen, zen2, and bicoid (bcd) genes in Drosophila are derivatives of the ancestral Hox3 ortholog in basal arthropods, and have diverged in expression and function from the ancient homeotic role. Why, then, do they remain at their ancestral genomic location within the Hox complex? Splits and inversions within the Hox complex are common in Schizophoran flies, suggesting loosened constraints on colinearity (Negre and Ruiz, 2007; Von Allmen et al., 1996). The sharing of regulatory elements among members of the Hox complex has been a model to explain the persistent linkage of Hox genes in metazoan genomes (Spitz et al., 2003; Sharpe et al., 1998), and the function of EO053 provides direct support for maintenance of an ancestral regulatory linkage as a contributing factor to persistence of a pb-zen linkage. While it is challenging to trace EO053 itself across evolution, patterns of synteny between pb and zen following the functional transition offer an opportunity to test such a model. Specifically, any translocation of a zen ortholog away from the pb ortholog would presumably not be favored if one or more regulatory elements are shared between the two genes. Indeed, examining available genomic scaffolds across 80 different Arthropods, we were unable to detect any translocation event that breaks the synteny between pb/Hox2 and zen/Hox3 (Figure 6—figure supplements 1–9). Furthermore, among the 66 species examined that evolved following the Hox3/zen divergence, only three species—all members of the Formicoidea—exhibit a change in synteny: only via the loss of the zen coding sequence (Figure 6—figure supplements 1 and 5). In contrast, 3/14 species examined that predate the Hox3/zen divergence exhibit loss of Hox3 or pb—representing Crustacea, Myriapoda, and Chelicerata (Figure 6—figure supplements 1, 8 and 9; Chipman et al., 2014; Grbić et al., 2011; Pace et al., 2016; Kim et al., 2016; Kenny et al., 2014).
An EO053 motif important for both pb- and zen-like expression exhibits patterns of conservation within various clades
Examining patterns of regulatory sequence conservation is a complementary approach to exploring the model of ancient, shared regulation as an explanation of the persistent pb/zen linkage. Sequence conservation makes possible the identification of EO053 throughout the Schizophora (Figure 6A,B). In particular, 33/36 nt of the region containing the 5' 12nt of FG4 and the 3' half of FG3, the latter of which we have shown to be required for the proper expression of both pb- and zen2-like specificities (Figure 4F–F’’), are identical between D. melanogaster and Ceratitis capitata (Figure 6C). Outside of the Brachycera it is challenging to identify orthologous regulatory regions. Comparing D. melanogaster EO053 and pb intronic sequence from the mosquito Anopheles gambiae identified a 12-nt sequence from within the Schizophora 36-nt span (ATCATTAATCAT, henceforth referred to as ‘the EO053 motif’, in green in Figure 6B,C) that is also found in the Anopheles intron (Figure 6—figure supplement 2). This sequence is similar to others that have been shown to be bound by Exd/Hox dimers (Bergson and McGinnis, 1990; Chan et al., 1997; Regulski et al., 1991; Rusch and Kaufman, 2000; Zeng et al., 1994), and thus represents a plausible candidate for an ancient motif with regulatory function. We find that this motif is important for EO053 function, as a TTAA>GGCC mutation to abrogate Hox binding dramatically reduces GAL4 expression in both the zen2-like and pb-like specificities (Figure 6D–F’). The deepest we are able to identify a region orthologous to EO053 outside of Schizophora is in the assassin fly Proctacanthus coquilletti (Brachycera; Orthorrapha). This species contains a variant EO053 motif (ATCATAAATCAT) that could still mediate an Exd/Hox interaction (Slattery et al., 2011). Given the functional importance of this motif for both aspects of EO053 expression and its conservation within Brachycera, we chose to examine the 80 Arthropod Hox2/3 regions for patterns consistent with an ancient regulatory function for this or similar sequences.
Figure 6 with 9 supplements see all
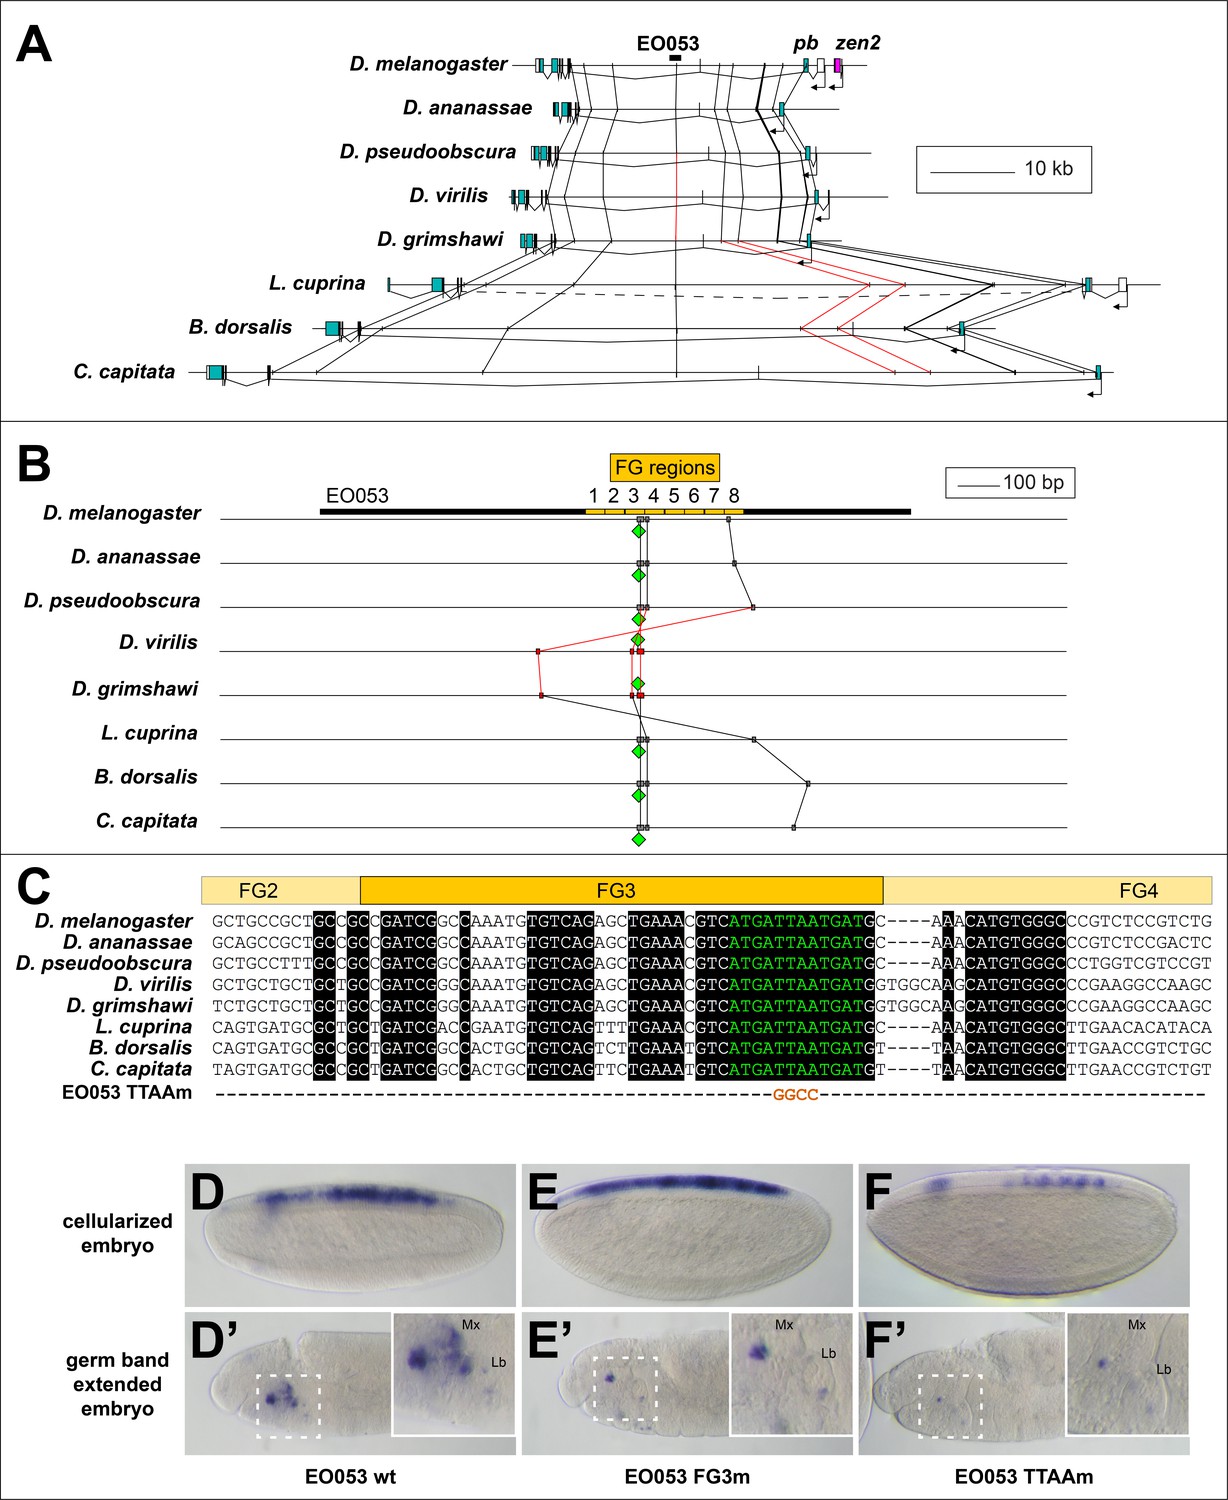
Conservation of EO053 sequences within the Schizophora.
(A) Gene diagrams of pb from select Schizophoran flies with available genome sequence data. Coding exons of pb in each species are colored blue-green, based upon existing genome annotations, and the locations of EO053 and zen2 in D. melanogaster are also noted. Vertical lines between species diagrams connect 14 bp or greater identical sequence blocks present in all eight species. Red lines (e.g., connected to the corresponding EO053 regions in D. virilis and D. grimshawi) represent sequences inverted relative to D. melanogaster (see also Figure 1—figure supplement 1). Dashed line in L. cuprina diagram joins two separate coding regions annotated as belonging to pb, due to the presence of coding sequences for a YPWM motif (right-most exons) and a homeodomain (left-most exons). (B) Diagram of EO053 sequence conservation within select Schizophoran flies. D. melanogaster EO053 span is indicated by the thick black line and yellow boxes represent the boundaries of FG regions mutated in Figure 4. Grey or red boxes connected between species represent 8 bp or greater identical sequence blocks present in all eight species. Green diamonds denote the location and orientation of the conserved ‘EO053 motif’ sequence shown in green in panel C. (C) Alignment of the region including FG3 from select Schizophoran flies, indicating additional sequences conserved in this region in these species (see also Figure 6—figure supplements 1–9). Line below the alignment indicates the nucleotides mutated in the ‘TTAAm’ reporter construct shown in F. (D-F’) GAL4 expression in embryos carrying mutant FG3 region reporter constructs in either early embryos (D–F) or germ band extended embryos (D’–F’). (D, D’) Wildtype EO053 reporter. (E, E’) Noncomplementary transversion FG3 mutant reporter. (F, F’) ‘TTAAm’ reporter, mutating the four nucleotides indicated in C. Insets in D’-F’ show higher-magnification images of the maxillary and labial segments.
65/66 species that arose following the Hox3/zen divergence contain instances of the EO053 motif within the large introns between the YPWM- and homeodomain-encoding exons of pb (Figure 6—figure supplements 2–9). The outlier Locusta migratoria scaffold containing the homeodomain coding sequence lacks upstream motif instances but also lacks the upstream exon necessary to confirm motif absence (Figure 6—figure supplement 7). In species that arose prior to the Hox3/zen divergence, the Ixodes scapularis (Chelicerata) (Figure 6—figure supplement 9), Daphnia pulex (Crustacea) (Figure 6—figure supplement 8), and Orchesella cincta (Hexapoda) (Figure 6—figure supplement 7) pb orthologs lack intron motif instances. Despite a lack of direct evidence for which, if any, motifs in the Hox2/3 regions are functional outside of Schizophora, we nevertheless examined these genomic intervals for patterns of conservation.
We identified in several major Arthropod clades conserved instances of the EO053 motif, based upon relative location and flanking sequences (Figure 6—figure supplements 2–9, Supplementary file 1). Lepidoptera contain a conserved motif instance between pb and zen2 (Motif 2 in Figure 6—figure supplement 3, Supplementary file 1). Coleoptera contain a conserved mismatch upstream of the pb promoter (Motif 3 in Figure 6—figure supplement 4, Supplementary file 1), and several species contain conserved motifs within the pb intron (Motif 4) and upstream of the duplicated zen genes, including on an isolated scaffold harboring a fourth zen paralog in the Asian long-horned beetle A. glabripennis (Motif 5 in Figure 6—figure supplement 4, Supplementary file 1). Within Hymenoptera, the two basal Tenthredinoidea species have five conserved motif mismatches (Motifs 6–10 in Figure 6—figure supplement 5, Supplementary file 1). Outside the Tenthredinoidea, all remaining species conserve a mismatch upstream of zen (Motif 11 in Figure 6—figure supplement 5, Supplementary file 1). Of particular note, this sequence is still present in the three Formicoidea that have lost the zen coding sequence. The Formicoidea also contain an intron motif specific to this clade (Motif 13 in Figure 6—figure supplement 5, Supplementary file 1), as well as another intron motif also conserved throughout the Aculeata (Motif 12 in Figure 6—figure supplement 5, Supplementary file 1). Several of the Hemiptera examined (excluding the Sternorrhyncha species A. pisum, D. citri, and B. tabaci) contain a conserved motif mismatch downstream of zen (Motif 14 in Figure 6—figure supplement 6, Supplementary file 1), and the two Dictyoptera species contain a conserved motif mismatch upstream of zen (Motif 15 in Figure 6—figure supplement 7, Supplementary file 1). Within the Chelicerata, gene duplication and loss present interesting opportunities to examine motif instances. The multiple rounds of whole-genome duplication in the basal Limulus polyphemus led to three copies each of pb and Hox3, two of which have confirmed synteny. All three Hox3 paralogs have a motif mismatch downstream (Motif 16 in Figure 6—figure supplement 9, Supplementary file 1). At a similar position downstream of one of the pb paralogs is the same 12-nt motif, with a variant site at the same position downstream of a second pb. We found another curious parallel between one adjacent Limulus pb and Hox3: the same 12-mer mismatch motif is found in the introns of each gene, though upstream of the putative Hox3 coding sequence, at a similar distance from a separate motif instance (Motif 17 in Figure 6—figure supplement 9, Supplementary file 1). This same motif was also found upstream of the coding sequence of the third Limulus Hox3, again at a similar distance from another motif instance. We also found instances of these motifs in Arachnida, with a Hox3 ortholog in Centruroides exilicauda, Parasteatoda tepidariorum, and Stegodyphus mimosarium as well as a pb ortholog in Centruroides and Parasteatoda having the downstream motif (Motif 16); we also found a 12-mer matching the intron motif (Motif 17) in one of the pb paralogs in Stegodyphus (Figure 6—figure supplement 9, Supplementary file 1). By contrast, we observed largely no conservation of 40 randomly generated 12mers (also allowing for a 1-bp mismatch) even when examining the Schizophoran regions, for example, with a single motif instance occurring every 772,189 bp on average (Supplementary file 2). Together our analysis indicates that while functional assumptions are limited to the Schizophora, sequences resembling the EO053 motif exhibit patterns of conservation across Arthropod clades within the Hox2/Hox3 genomic region, particularly within clades emerging after the Hox3/zen divergence.
Discussion
We have shown that the EO053 enhancer exhibits inherent regulatory complexity in two critical ways. First, it encodes more than one specificity, manifested by its ability to drive reporter gene expression in two distinct temporal and spatial patterns: the zen2-like dorsal expression in stage 5–7 embryos and the pb-like maxillary and labial segment expression beginning in stage 10. Second, each of these specificities is functionally linked to regulation of a separate target promoter. As such, this region serves as a curious contrast to existing models of complex regulatory output derived from examples of multiple independent enhancers working additively on a single target gene (Simonet et al., 1991; MacNeill et al., 2000; Harding et al., 1989), a single enhancer directing multiple specificities on a single target gene (Betancur et al., 2011; Nagy et al., 2018; Preger-Ben Noon et al., 2018), or control regions conferring common expression patterns upon multiple local target genes (Choi and Engel, 1988; Deschamps, 2007; Foley et al., 1994; Lehoczky et al., 2004; Sharpe et al., 1998; Spitz et al., 2003; Tsai et al., 2016; Jones et al., 1995; Tsujimura et al., 2007; Mohrs et al., 2001; Cheng et al., 2014).
Serving separate promoters
Perhaps the most curious feature of EO053 is its requirement by distinct genes for the reliability (pb) or temporal progression (zen2) of their expression. Given its intronic location, we suggest that this regulatory arrangement would be mediated by a looping interaction between EO053 and each target promoter (Levine et al., 2014; Matharu and Ahituv, 2015). Such interactions are likely permitted by the distinct temporal activation profiles of each target gene, allowing the enhancer to separately engage only a single active promoter at a time (Figure 7). In addition, we have gained insight into the temporal dynamics with which EO053 operates on the zen2 locus, whereby the initial activation of zen2 expression is mediated by the promoter-proximal zen2US segment and then switches to control by EO053.
Figure 7 with 1 supplement see all

Possible model for EO053 regulation of both zen2 and pb.
(A-C) Diagram of the dynamic activities of EO053 during development. Black arrows indicate active transcription of either zen2 (orange exons) or pb (white and blue exons), and green arrows signify active enhancers regulating transcription of either promoter. (A) At stage 4 in the dorsal blastoderm and at both anterior and posterior poles, zen2 expression is initiated by the upstream enhancer, zen2US. (B) As zen2US loses activity in stage 5, expression of zen2 instead becomes dependent upon EO053 in the dorsal blastoderm, potentially mediated by chromatin looping. (C) Later, in the developing head primordium, EO053 assists region 2.1 in directing pb expression, which may be mediated by interactions involving factors bound to nearby PREs (red in A-C; see also gene diagram in Figure 5).
The regulatory interactions between EO053 and both pb and zen2 are likely influenced by the overall regulatory architecture of the Antp Complex. Recent high-resolution analyses of topologically associated domains (TADs) suggest that pb, zen2, zen, and bcd all reside in a single TAD (Eagen et al., 2017; Stadler et al., 2017), potentially biasing regulatory activities between these loci and separate from Dfd, which is a regulatory island (Stadler et al., 2017). The three-dimensional architecture facilitating interactions between EO053 and its target promoters is likely mediated by Polycomb Response Elements (PREs) that have been mapped within the pb locus (Figure 5A; Kapoun and Kaufman, 1995b; Nègre et al., 2011; Stadler et al., 2017) and exhibit chromosomal pairing experimentally (Kapoun and Kaufman, 1995b). The observed establishment of Polycomb bodies in the nucleus at stage 5 (Cheutin and Cavalli, 2012) also correlates well with the temporal shift in regulation of zen2 from promoter-proximal to distal regulatory regions.
Distinct temporal and spatial specificities
We have shown that the pb-like and zen2-like specificities overlap within the FG region of EO053. While the pb-like expression is largely restricted to this region, the zen2-like expression appears to be much more broadly extended throughout EO053. Moreover, within the FG region, mutation of FG3 or FG7 affects both specificities, suggesting the specificities may have one or more motifs in common in their regulatory logic. Such a motif could be bound by the same transcription factor in both settings or related factors with different temporal and/or spatial profiles. We raise the possibility that the conserved EO053 motif may represent such a site. First, its pattern of conservation and location within the functionally important FG3 region suggests that this sequence itself may be required. Second, we show that mutating the core Hox motif affects both the pb-like and zen2-like expression in the context of EO053 (Figure 6). Similar sequences have been identified as functionally relevant to the expression of Dfd (Chan et al., 1997; Zeng et al., 1994; Bergson and McGinnis, 1990; Regulski et al., 1991; Lou et al., 1995) and pb itself (Rusch and Kaufman, 2000). Both of these examples involve regulation by Dfd, and we suspect the pb-like expression mediated by this motif would likely also involve Dfd. We also notice instances of this motif upstream of the Dfd orthologs themselves in many of the species we have analyzed (Figure 6—figure supplements 2–9), suggesting that Dfd auto-regulation within the arthropods may be ancient. Given the similar binding specificities of Hox proteins (Noyes et al., 2008; Berger et al., 2008), this site could be utilized by one or more of these proteins, even operating as a promiscuous auto-regulatory enhancer. This is consistent with the demonstrated role of EO053 in the temporal dynamics of zen2 expression where its activity is preceded by zen2US activity, and also with our observation that region 2.1 deletion significantly affects the early pb expression in maxillary and labial segments (Figure 5—figure supplement 3E). We expect activation and specificity to also involve key regulators binding non-Hox motifs, which again could participate in one or both specificities.
Why does neither pb nor zen2 mRNA expression reflect the complete regulatory capacity of EO053? A common feature of many enhancers is their ability to interact reliably with a heterologous promoter to drive reporter gene expression in a manner that not only largely recapitulates specificity encoded by the enhancer, but also represents a subset of the expression pattern of the endogenous gene. EO053, however, produces a pattern that would be considered an ectopic specificity relative to the pattern of either target gene (i.e. if EO053 were only a pb enhancer the blastoderm spatiotemporal activity is ectopic and the mouthpart activity does not recapitulate zen2 expression). Promoter selectivity/interpretation is a likely model to explain the different transcriptional outputs of the separate promoters that utilize EO053. The collection of core promoter elements at an individual promoter can bias promoter-enhancer compatibility (Butler and Kadonaga, 2001), and the pb promoter itself is required for expression driven by certain enhancers (Kapoun and Kaufman, 1995a). Replacing the promiscuous synthetic core promoter (Pfeiffer et al., 2008) in the pBPGUw vector used here (TATA box present) with the minimal core promoter from either pb or bcd (TATA box absent) or replacing the initiator sequence with that of zen2 had no effect on reporter gene expression (Supplementary file 3, Figure 7—figure supplement 1), which may suggest that promoter interpretation may require additional promoter-proximal elements to mediate the appropriate spatial/temporal output. It is additionally possible that an EO053-proximal element may facilitate appropriate promoter targeting and output (Chen et al., 2005; Zhou and Levine, 1999), or another separate region (i.e. dominant repressor) may be influencing output (Perry et al., 2011).
Evolution and maintenance
The stable colinearity of vertebrate Hox genes has been attributed to sharing of regulatory elements (Gould et al., 1997; Gérard et al., 1996; Sharpe et al., 1998). Arthropods may not share this paradigm across the complete complex, as suggested by the occurrence of rearrangements (Pace et al., 2016; Faddeeva-Vakhrusheva et al., 2017; Wu et al., 2017), inversions (Negre and Ruiz, 2007), gene loss (Chipman et al., 2014; Grbić et al., 2011), regulatory independence (Gellon and McGinnis, 1998; Shippy et al., 2008), and local chromatin organization (Eagen et al., 2017; Stadler et al., 2017). We provide evidence here for the possibility of limited shared regulation within an Arthropod Hox complex, between a true Hox (pb) and a neighboring Hox-derived gene (zen2) both sharing EO053. While we do not know how deeply this regulatory relationship extends, the organization of Hox complexes across the phylum exhibits features consistent with shared regulation. The strong synteny of pb and zen and reduced gene loss (a subset of ant genomes being the exception to date) suggests shared regulation may have existed from the point of Hox3/zen divergence, if not earlier. The most likely scenario based upon the available data would be a pb-Hox3 shared duplicate enhancer that drives a pattern of expression common to both genes. Acquisition of a novel expression specificity by the shared enhancer would then be buffered by the additional independent regulatory sequences of each gene. Alternatively, the change in spatial/temporal expression of the shared enhancer might also impart selective pressure alleviated by differential interpretation of the enhancer by each gene, and/or functional divergence. Regardless of the mechanism, EO053 serves as an unusual example of an enhancer maintaining a promiscuous relationship with two distinct gene promoters even in the context of disparately evolving expression specificities.
Materials and methods
Key resources table
| Reagent type (species) or resource | Designation | Source or reference | Identifiers | Additional information |
|---|---|---|---|---|
| Gene (Drosophila melanogaster) | pb | FLYB: FBgn0051481 | ||
| Gene (Drosophila melanogaster) | zen2 | FLYB: FBgn0004054 | ||
| Gene Drosophila virilis) | pb | FLYB: FBgn0211025 | ||
| Genetic reagent (D. melanogaster) | TM3, Ubx-LacZ.w+ | BloomingtonDrosophilaStock Center | BDSC:4432; FBti0002628; RRID:BDSC_4432) | FlyBase symbol: Dmel\P{Ubx-lacZ.w+}TM3 |
| Genetic reagent (D. melanogaster | pbM2:20 | This study | EO053 deletion mutant | |
| Genetic reagent (D. melanogaster | pb11A | This study | 2.1 enhancer deletion mutant | |
| Genetic reagent (D. melanogaster | pb11C | This study | EO053/2.1 enhancer double deletion | |
| Genetic reagent (D. melanogaster | pb11D | This study | 2.1 enhancer deletion mutant | |
| Genetic reagent (D. melanogaster | pb11E | This study | EO053/2.1 enhancer double deletion | |
| Antibody | anti-digoxygenin (sheep polyclonal) | Sigma Aldrich | Cat. No. 11 333 089 001 | 1:500 dilution |
| Antibody | anti-digoxygenin-AP Fab fragments (sheep polyclonal) | Sigma Aldrich | Cat# 11093274910 | 1:2000 dilution |
| Antibody | anti-biotin (mouse) | Roche | Cat. #1 297 597 | 1:500 dilution |
| Antibody | Donkey anti-sheep Alexa-488 | ThermoFisher | Catalog # A-11015 | 1:500 dilution |
| Antibody | Donkey anti-mouse Alexa-555 | ThermoFisher | Catalog # A-31570 | 1:500 dilution |
| Recombinant DNA reagent | DR274 (plasmid) | Addgene | RRID:Addgene_42250 | T7 guide RNA expression |
| Recombinant DNA reagent | MLM3613 (plasmid) | Addgene | RRID:Addgene_42251 | T7 Cas9 expression vector |
| Recombinant DNA reagent | pU6-BbsI-chiRNA (plasmid) | Addgene | RRID:Addgene_45946 | Guide RNA cloning vector forDrosophilainjection |
| Recombinant DNA reagent | pGEM-T (plasmid) | Promega | Cat # A3600 | Cloning vector |
| Recombinant DNA reagent | pBPGUw (plasmid) | Addgene | RRID:Addgene_17575 | GAL4 enhancer cloning vector for Drosophila |
| Sequence-based reagent | EO053-f | This paper | PCR primers | CCCGGAGCGGCACAATTAGTCTTG |
| Sequence-based reagent | EO053-r | This paper | PCR primers | CGGTAATGCTGAATGAACCTTTCAA |
| Sequence-based reagent | DvEO053-f | This paper | PCR primers | TGCCCTGGTTCTTTGGCTAACACG |
| Sequence-based reagent | DvEO053-r | This paper | PCR primers | TTTCTTGTACATAATCGTTCTTGG |
| Sequence-based reagent | Zen2US-f | This paper | PCR primers | TTATATACCCCAGAAGCCCTTCGTGACG |
| Sequence-based reagent | Zen2US-r | This paper | PCR primers | TGATGTGATGACACCAATTTATCTGAGC |
| Commercial assay or kit | LR Clonase II kit | Thermofisher | Cat# 11791020 | |
| Commercial assay or kit | TOPO pCR8/GW kit | Thermofisher | Cat# K2500-20 | |
| Commercial assay or kit | DIG RNA labelling mix | Roche | Cat#11277073910 | |
| Commercial assay or kit | Biotin RNA labelling mix | Roche | Cat#11685597910 | |
| Commercial assay or kit | T7 RNA polymerase | Roche | Cat. No. 10 881 767 001 | |
| Commercial assay or kit | MAXIscript T7 transcription kit | ThermoFisher | Cat# AM1312 | |
| Commercial assay or kit | mMESSAGE mMACHINE T7 Transcription kit | ThermoFisher | Cat# AM1344 | |
| Commercial assay or kit | SuperScript II Reverse Transcription Kit | ThermoFisher | Cat# 18064022 | |
| Commercial assay or kit | iQ SYBR Green Supermix | BioRad | Cat# 18064022 | |
| Other | NBT/BCIP stock solution | Roche | Cat#11681451001 |
Reporter constructs
Request a detailed protocolThe EO053 region was identified by enriched CBP binding in embryonic rather than later stages [i.e., ‘Embryo Only’ (EO) (Nègre et al., 2011)]. It was amplified from genomic DNA using the primers EO053-f (CCCGGAGCGGCACAATTAGTCTTG) and EO053-r (CGGTAATGCTGAATGAACCTTTCAA). ΔFG, FG, and TTAAm mutations were generated using overlap extension PCR (Ho et al., 1989). The DvEO053 primers were DvEO053-f (TGCCCTGGTTCTTTGGCTAACACG) and DvEO053-r (TTTCTTGTACATAATCGTTCTTGG). PCR products amplified from genomic DNA were cloned into pBPGUw (Pfeiffer et al., 2008) through an LR Clonase II (ThermoFisher—Waltham, MA) Gateway reaction from a pCR8/TOPO/GW intermediate. All variants were inserted upstream of the DSCP promoter in the same orientation with respect to EO053. zen2US was amplified using zen2US-f (TTATATACCCCAGAAGCCCTTCGTGACG) and zen2US-r (TGATGTGATGACACCAATTTATCTGAGC) and cloned as above. See also Supplementary file 4 for complete sequences.
Generation of pb mutants by CRISPR/Cas9 mutagenesis
Request a detailed protocolPreparation of guide RNA and Cas9 mRNA was done as described previously (Hwang et al., 2013). The sequences for guide RNAs directed against EO053 (GGAGTCGGTCGGACACAGAG) or region 2.1 (GAGAAAGATTTTCTCCCCTC and GCTGTGCCTCATTTAATGCA) were cloned into DR274 (Addgene—Cambridge, MA; deposited by J Keith Joung) cut with BsaI. For pbM2:20, sequence-verified clones were linearized with DraI and 1 μg transcribed using the MAXIscript T7 kit (ThermoFisher). Cas9 mRNA was transcribed using the mMESSAGE mMachine T7 kit, using 1 μg MLM3613 (Addgene; deposited by J Keith Joung) linearized with PmeI. RNAs were precipitated according to the manufacturer’s instructions and resuspended in injection buffer. The final injection cocktail for injecting w1118 embryos contained 900 ng/μL Cas9 mRNA and 100 ng/μL EO053 guide RNA. For pb11A, pb11C, pb11D, and pb11E, pbM2:20 flies were crossed to Cas9-expressing flies and a cocktail containing both guide RNAs and the homology-directed repair template were injected by BestGene, Inc The region 2.1 HDR template was constructed by separately cloning each arm (~2 kb each, see Supplementary file 4) into pGEM-T (Promega). The left arm was flanked by BamHI and SalI sites and the right arm contained tandem BglII and XhoI sites on the 5’ end. The left arm was cut with BamHI and SalI and subcloned into the plasmid containing the right arm, digested with BglII and XhoI. Injected flies were crossed to w;;TM2/TM6C individually, and then F1 males from each injected fly were crossed individually to w;;TM2/TM6C. After viable larvae were detected, the F1 males were removed from the vials and pooled into groups of four for gDNA extraction and PCR screening for deletion. F2 vials from positive pools were screened and sequenced to uncover the pbM2:20 1255-bp deletion and the precise region 2.1 deletion. Only a single injected fly harbored the 2.1 deletion, and we were ecstatic to obtain progeny with deletions on both the EO053 deletion chromosome and the wildtype homologous chromosome to provide us with both the single and double mutants.
In situ hybridization
Request a detailed protocolThe GAL4 digoxygenin probe was prepared as previously described (Nègre et al., 2011; Pfeiffer et al., 2008). The large exons from pb and zen2 were amplified from genomic DNA and cloned into pGEM-T (Promega—Madison, WI). Linearized plasmids served as template for in vitro transcription of digoxygenin-labeled RNA probes as described (Kosman et al., 2004) using T7 RNA polymerase (Promega or Roche) and DIG-UTP or biotin-UTP RNA labeling mixes (Roche). Embryo in situ hybridizations using GAL4, LacZ, pb, or zen2 digoxygenin probes and HLHmβ biotin probes were performed as previously described (Kosman et al., 2004; Nègre et al., 2011; Reeves and Posakony, 2005). GAL4 in situ hybridizations with related mutant constructs were performed in parallel batches and representative images presented.
pb in situ hybridization image scoring
Request a detailed protocolFollowing in situ hybridization and mounting of w1118 and pbM2:20 embryos in parallel, images were collected of lateral views of stage 10–12 embryos. Filenames of experimental and control in situ hybridization images were gathered, randomly shuffled, and renamed for double-blind scoring image analysis using ImageJ (Fiji). The area of visible stain in maxillary and labial segments was selected for each image and values for area, mean intensity, min intensity, and max intensity were recorded. After data collection, values were reassigned to the corresponding genotype and statistically analyzed.
zen2 in situ hybridization image scoring
Request a detailed protocolFollowing in situ hybridization and mounting of w1118 and pbM2:20 embryos in parallel, slides were manually screened for dorsal visibility at stage 4 or stage 5 (staging based upon cellularization under DIC optics). The in situ hybridization signal at these stages was scored as ‘dorsal-weak,’ ‘dorsal-strong,’ ‘poles+dorsal,’ ‘poles-strong,’ ‘poles-weak,’ or ‘no expression.’ In Figure 5, ‘dorsal-weak’ and ‘dorsal-strong’ represent the ‘dorsal’ category, and ‘poles+dorsal,’ ‘poles-strong,’ and ‘poles-weak’ represent the ‘polar’ category, to distinguish between EO053-like and zen2US-like expression.
Quantitative PCR
Request a detailed protocolRNA was prepared using Trizol (Ambion) from embryos collected for 2 hr and aged 4 hr at 25 °C (4–6 hr embryos). Sample embryos were examined with a compound microscope to verify desired age (approximately stage 11). First-strand cDNA was synthesized with a SuperScript II kit (Invitrogen). Quantitative RT-PCR was performed on an iQ5 cycler (BioRad) using iQ SYBR Green Supermix (BioRad).
Scaffold analysis
Request a detailed protocolWe queried genomic scaffolds of sequenced arthropods by BLAST using Drosophila melanogaster amino acid sequence for Pb, Zen2, Zen, or Dfd, as well as orthologous sequences from other annotated species. Scaffolds or accession numbers were obtained from http://metazoa.ensembl.org/, http://hymenopteragenome.org/, http://www.vectorbase.org/, http://i5k.nal.usda.gov/, http://www.ncbi.nlm.nih.gov/genbank/, http://genome.wustl.edu/, http://www.collembolomics.nl/collembolomics/. Gene structures were inferred from either annotations or database gene predictions. For some species, only the homeodomain sequence for each gene was determined and located. In some cases (e.g., Dendroctonus ponderosae), the pb and zen homeodomains are encoded on separate scaffolds but the zen scaffold includes near one end a YPWM-encoding ORF that by BLAST is most similar to pb, suggesting that the scaffolds are likely adjacent.
Gene diagrams and motif analysis
Request a detailed protocolEach sequence was opened in GenePalette (Rebeiz and Posakony, 2004; Smith et al., 2017), and the location of each gene identified by either GenBank or manual annotation. Sequences were searched for instances of ATCATTAATCAT (allowing for 1-bp mismatch), ‘ATTAAT’ (ATCATTAAT or ATTAATCAT), and ‘YPWM’ (TAYCCNTGGATG). Instances found at similar relative locations in related species were analyzed for similarity in both core and flanking sequence to suggest orthology within clades. All figure gene diagrams were generated by creating a postscript export from GenePalette and compiling/editing in Adobe Illustrator.
Data availability
No new sequence data generated, all found in public archives (GenBank, Ensembl, and other public genome browsers/queries). Accession numbers for all genome scaffolds used are collected in Fig. 6 - Figure Supplements 1-9 - Source Data.
References
-
Enhancer-promoter specificity mediated by DPE or TATA core promoter motifsGenes & Development 15:2515–2519.https://doi.org/10.1101/gad.924301
-
Switching the in vivo specificity of a minimal Hox-responsive elementDevelopment 124:2007–2014.
-
Ancestral and recently recruited global control of the Hox genes in developmentCurrent Opinion in Genetics & Development 17:422–427.https://doi.org/10.1016/j.gde.2007.07.008
-
Spatial regulation of zerknüllt: a dorsal-ventral patterning gene in DrosophilaGenes & Development 3:1518–1533.https://doi.org/10.1101/gad.3.10.1518
-
Hymenoptera genome database: integrating genome annotations in HymenopteraMineNucleic Acids Research 44:D793–D800.https://doi.org/10.1093/nar/gkv1208
-
Multiple enhancer regions govern the transcription of CCN2 during embryonic developmentJournal of Cell Communication and Signaling 12:231–243.https://doi.org/10.1007/s12079-017-0440-4
-
Assessing constraints on the path of regulatory sequence evolutionPhilosophical Transactions of the Royal Society B: Biological Sciences 368:20130026.https://doi.org/10.1098/rstb.2013.0026
-
Efficient genome editing in zebrafish using a CRISPR-Cas systemNature Biotechnology 31:227–229.https://doi.org/10.1038/nbt.2501
-
The human growth hormone gene is regulated by a multicomponent locus control regionMolecular and Cellular Biology 15:7010–7021.https://doi.org/10.1128/MCB.15.12.7010
-
A functional analysis of 5’ intronic and promoter regions of the homeotic gene proboscipedia in Drosophila melanogasterDevelopment 121:2127–2141.
-
Regulatory regions of the homeotic gene proboscipedia are sensitive to chromosomal pairingGenetics 140:643–658.
-
Identification of Hox genes and rearrangements within the single homeobox (Hox) cluster (192.8 kb) of the cyclopoid copepod (Paracyclopina nana)Journal of Experimental Zoology. Part B, Molecular and Developmental Evolution 326:105–109.https://doi.org/10.1002/jez.b.22668
-
Genomic evolution of Hox gene clustersScience 313:1918–1922.https://doi.org/10.1126/science.1132040
-
Transcriptional enhancers in animal development and evolutionCurrent Biology 20:R754–R763.https://doi.org/10.1016/j.cub.2010.06.070
-
Modular regulation of cGATA-5 gene expression in the developing heart and gutDevelopmental Biology 217:62–76.https://doi.org/10.1006/dbio.1999.9539
-
Higher-level phylogeny of the Hymenoptera inferred from mitochondrial genomesMolecular Phylogenetics and Evolution 84:34–43.https://doi.org/10.1016/j.ympev.2014.12.009
-
Deletion of a coordinate regulator of type 2 cytokine expression in miceNature Immunology 2:842–847.https://doi.org/10.1038/ni0901-842
-
BookPhylogeny of the Nematocerous families of Diptera (Insecta)Blackwell Publishing Ltd.
-
Evolution of Hox3 and ftz in arthropods: insights from the crustacean Daphnia pulexDevelopment Genes and Evolution 217:315–322.https://doi.org/10.1007/s00427-007-0141-8
-
Mechanisms of mutational robustness in transcriptional regulationFrontiers in Genetics 6:322.https://doi.org/10.3389/fgene.2015.00322
-
Evolutionary history of the HymenopteraCurrent Biology : CB 27:1013–1018.https://doi.org/10.1016/j.cub.2017.01.027
-
GenePalette: a universal software tool for genome sequence visualization and analysisDevelopmental Biology 271:431–438.https://doi.org/10.1016/j.ydbio.2004.04.011
-
Enhancer evolution and the origins of morphological noveltyCurrent Opinion in Genetics & Development 45:115–123.https://doi.org/10.1016/j.gde.2017.04.006
-
Evolution of transcriptional enhancers and animal diversityPhilosophical Transactions of the Royal Society B: Biological Sciences 368:20130017.https://doi.org/10.1098/rstb.2013.0017
-
Regulation of proboscipedia in Drosophila by homeotic selector genesGenetics 156:183–194.
-
Analysis of the Tribolium homeotic complex: insights into mechanisms constraining insect Hox clustersDevelopment Genes and Evolution 218:127–139.https://doi.org/10.1007/s00427-008-0213-4
-
Multiple tissue-specific elements control the apolipoprotein E/C-I gene locus in transgenic miceThe Journal of Biological Chemistry 266:8651–8654.
-
Phylogenetic relationships of Hemiptera inferred from mitochondrial and nuclear genesMitochondrial DNA Part A 27:4380–4389.https://doi.org/10.3109/19401736.2015.1089538
-
The structure and evolution of cis-regulatory regions: the shavenbaby storyPhilosophical Transactions of the Royal Society B: Biological Sciences 368:20130028.https://doi.org/10.1098/rstb.2013.0028
-
The evolutionary significance of cis-regulatory mutationsNature Reviews Genetics 8:206–216.https://doi.org/10.1038/nrg2063
Article and author information
Author details
Funding
NIH (1R01GM120377)
- James W Posakony
The funders had no role in study design, data collection and interpretation, or the decision to submit the work for publication.
Acknowledgements
We wish to acknowledge those members of the lab contributing helpful comments throughout the course of this work, including Jenny Atanasov and Artem Movsesyan. We are also grateful for the services of Genetic Services, Inc (Cambridge, MA), and BestGene, Inc (Chino Hills, CA) for injecting some of the constructs used in this study.
Copyright
© 2020, Miller and Posakony
This article is distributed under the terms of the Creative Commons Attribution License, which permits unrestricted use and redistribution provided that the original author and source are credited.
Metrics
-
- 978
- views
-
- 122
- downloads
-
- 3
- citations
Views, downloads and citations are aggregated across all versions of this paper published by eLife.
Citations by DOI
-
- 3
- citations for umbrella DOI https://doi.org/10.7554/eLife.39876
Download links
A two-part list of links to download the article, or parts of the article, in various formats.
Downloads (link to download the article as PDF)
Open citations (links to open the citations from this article in various online reference manager services)
Cite this article (links to download the citations from this article in formats compatible with various reference manager tools)
Disparate expression specificities coded by a shared Hox-C enhancer
eLife 9:e39876.
https://doi.org/10.7554/eLife.39876


