Dopamine neurons projecting to medial shell of the nucleus accumbens drive heroin reinforcement
- University of Geneva, Switzerland
- University of California Davis, United States
- University of Geneva Hospital, Switzerland
Figures
Figure 1
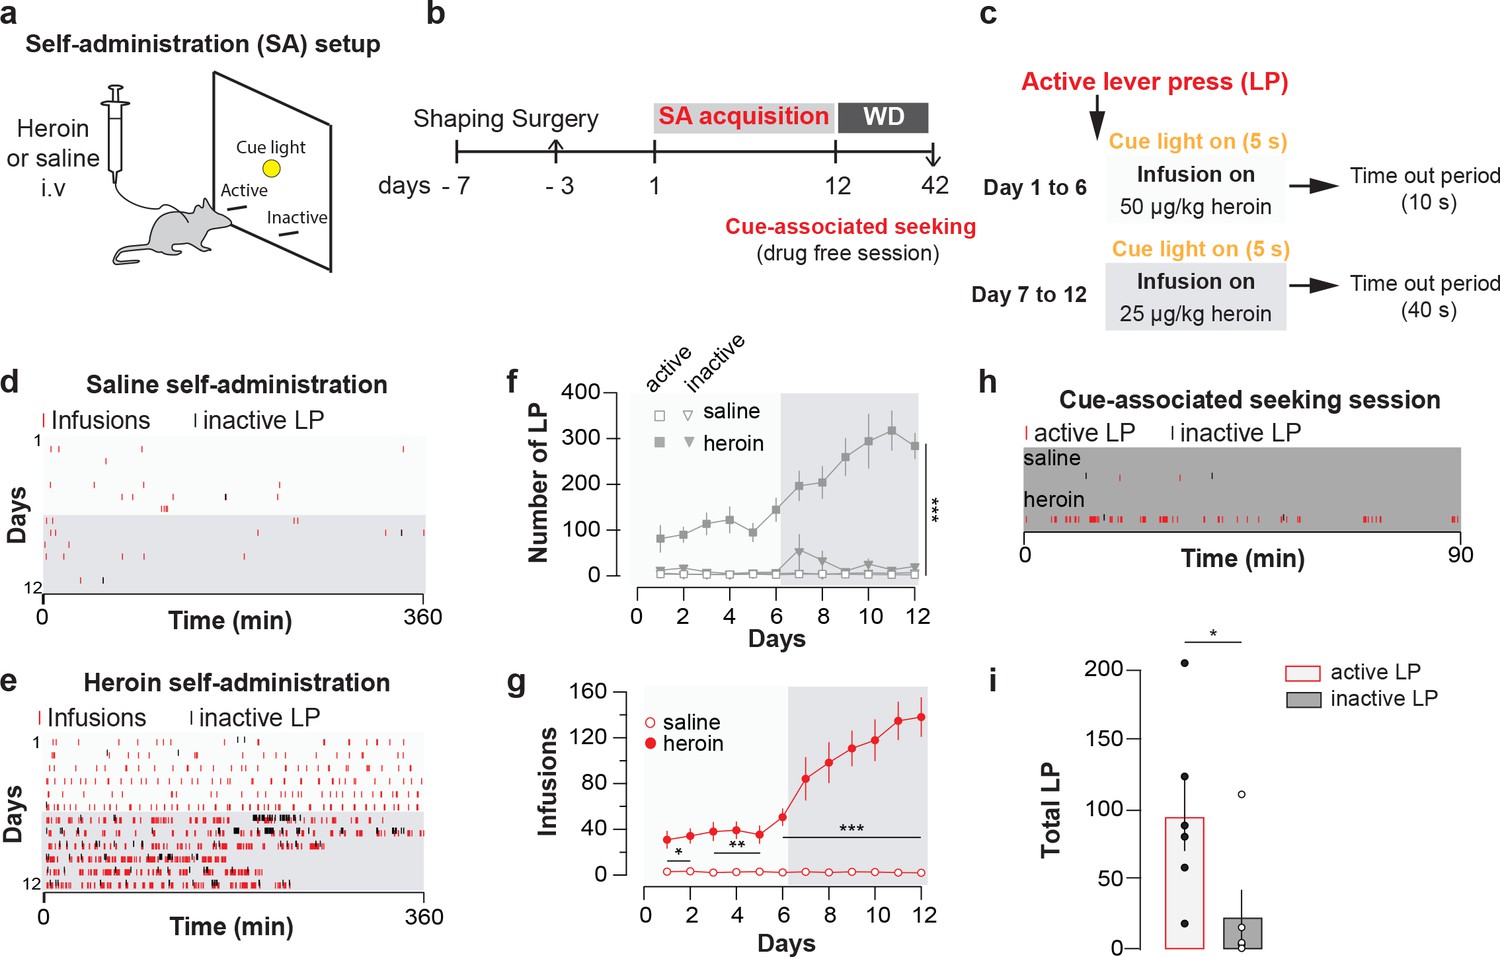
Heroin self-administration.
(a), Schematic of behavioral setup for self-administration experiments in (d-g). (b), Day-to-day schedule of experiment for (d–g). (c), Detail of the sequence of events following a press on the active lever. An active lever press triggers the illumination of a cue-light just above the lever and an infusion of heroin. The infusion is followed by a time-out period (7 or 37 s depending on the session) where heroin is no longer available despite presses on the correct lever. WD, withdrawal. (d), Raster plot for infusions and inactive lever presses as a function of time during acquisition of daily self-administration session of 6 hr for a mouse that self-administered saline or (e), heroin. (f), Mean ±SEM total lever presses and (g), infusions during the acquisition phase of saline (n = 10) or heroin (n = 14) self-administration. Infusion rate was very robust in mice which self-administered heroin (two-way repeated-measures [RM] ANOVA, group effect, F(1, 22)=142.2, p<0.001, time effect, F(11, 242)=30.51, p<0.001, group X time interaction, F(11, 242)=31.13, p<0.001; Bonferroni post hoc analysis, *p<0.05, **p<0.01, ***p<0.001) and animals quickly learned to discriminate between the active and inactive lever (two-way RM ANOVA, group effect, F(3, 44)=47.16, p<0.001, time effect, F(11, 484)=6.464, p<0.001, group X time interaction, F(33, 484)=47.16, p<0.001; Bonferroni post hoc analysis, ***p<0.001). (h), Raster plot (top) for active and inactive lever presses as a function of time during cue-induced relapse session at day 30 of withdrawal for a mouse that self-administered either saline (top) or heroin (bottom) during acquisition phase. (i), Mean±SEM total lever presses at 30 days of withdrawal for mice trained for heroin (n = 6) self-administration. After 30 days of forced withdrawal seeking was robust in mice which self-administered heroin (active versus inactive lever, paired t test, t10 = 2.31, *p<0.05).
Figure 2
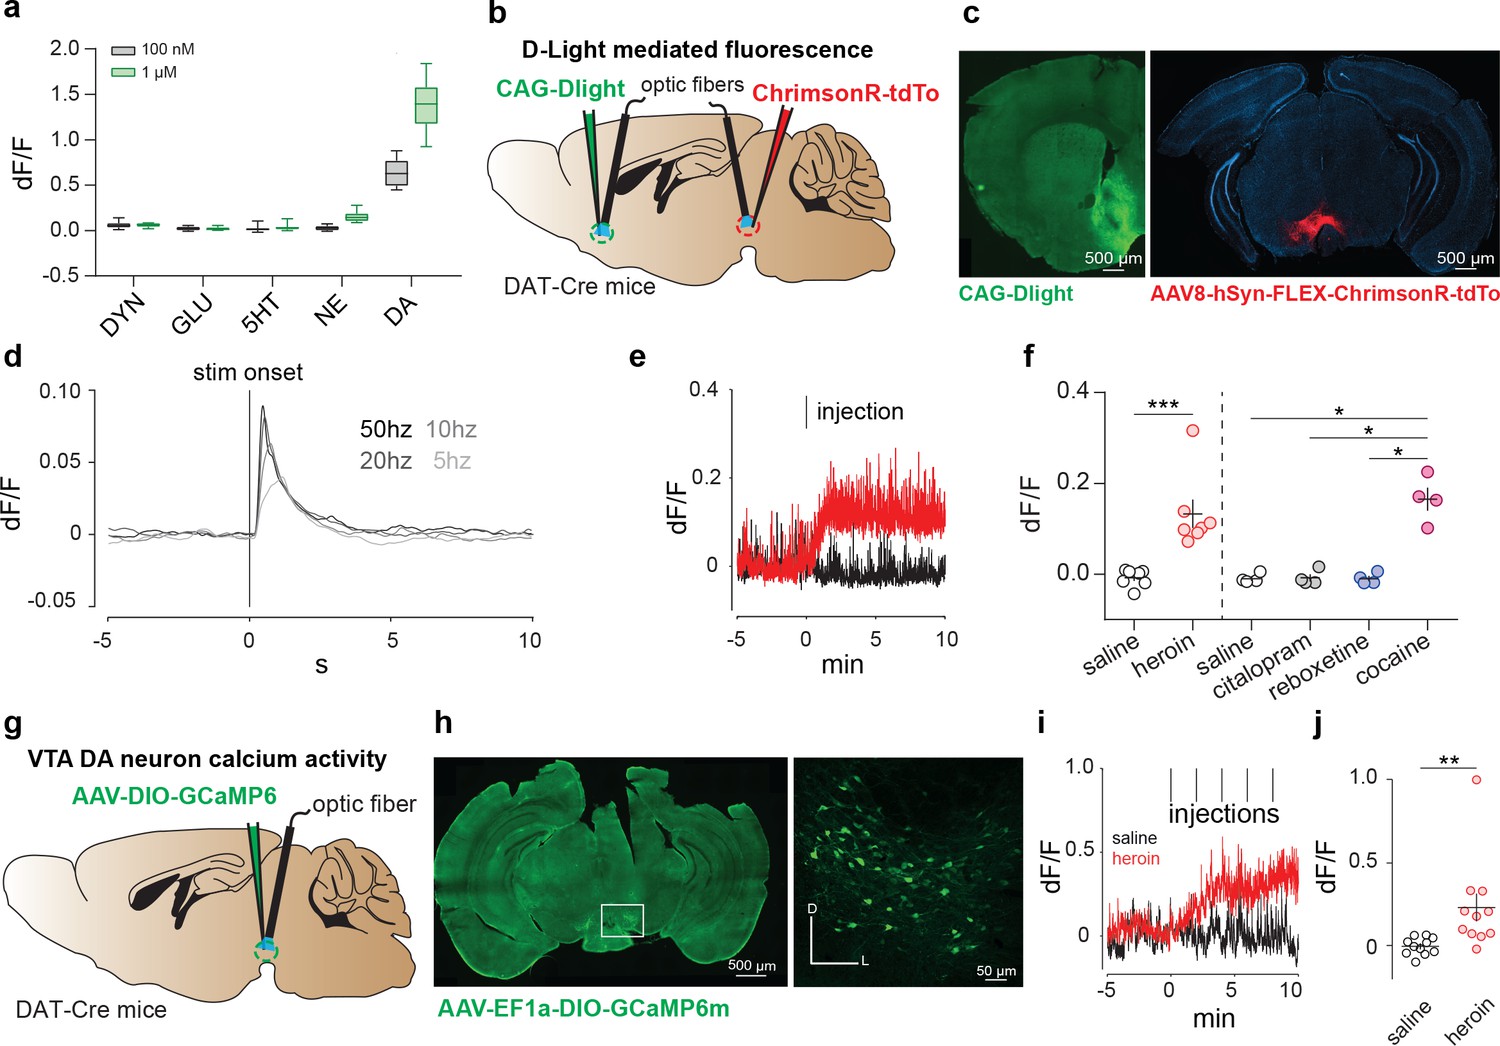
Heroin increases DA levels in the NAc via enhanced VTA DA neuron activity.
(a) Fluorescence in response to five neuromodulators in HEK293 cells expressing dLight1 (DYN: dynorphin; GLU: glutamate; 5HT: serotonin; NE: norepinephrine). Data are presented as median with 25/75 percentile (box) and min-max (whiskers).( b), Schematic of the experiment for c-f; (c), Left, medial NAc shell of DAT-Cre+ mice were bilaterally injected with the DRD1-based DA sensor (dLight). Right, the amber light–drivable channelrhodopsin Chrimson was injected unilaterally in the VTA. (d), D-light-mediated fluorescence change following optogenetic activation of VTA DA neurons by Chrimson (mean of n = 3 animals). (e), Example trace from single animal, showing dLight-mediated fluorescence change in the NAc following intraperitoneal heroin (8 mg/kg) or saline injections. Tick mark indicates injection. (f), Average fluorescence after saline, heroin (8 mg/kg), citalopram (10 mg/kg), reboxetine (20 mg/kg) or cocaine (20 mg/kg) treatment compared to pre-infusion baseline (n = 4–7). Intraperitoneal injection of heroin or cocaine significantly increased fluorescence signals (as compared to control injections for heroin, paired t test, t6 = 4.117, **p<0.01; for citalopram, reboxetine and cocaine, RM one-way ANOVA: F(3,15) = 42.48, p<0.01; Bonferroni post hoc analysis: *p<0.05).( g), Schematic of the experiment for h-j; h, Left, VTA of DAT-Cre+ mice was bilaterally injected with the floxed version of the calcium indicator GCAMP6m. Right, coronal confocal images of infected VTA. (i), Average GCaMP6m fluorescence in VTA DA neurons following first intravenous infusion of heroin (100 μg/kg/inf) or saline. Red tick marks indicate injection onset. (j), Average fluorescence after heroin or saline treatment compared to pre-infusion baseline (n = 11). Calcium transients significantly increased after heroin infusions (dF/F for saline versus heroin, Lilliefors test for normality, Wilcoxon matched-pairs signed rank test, ***p<0.001). Error bars, SEM.
Figure 3
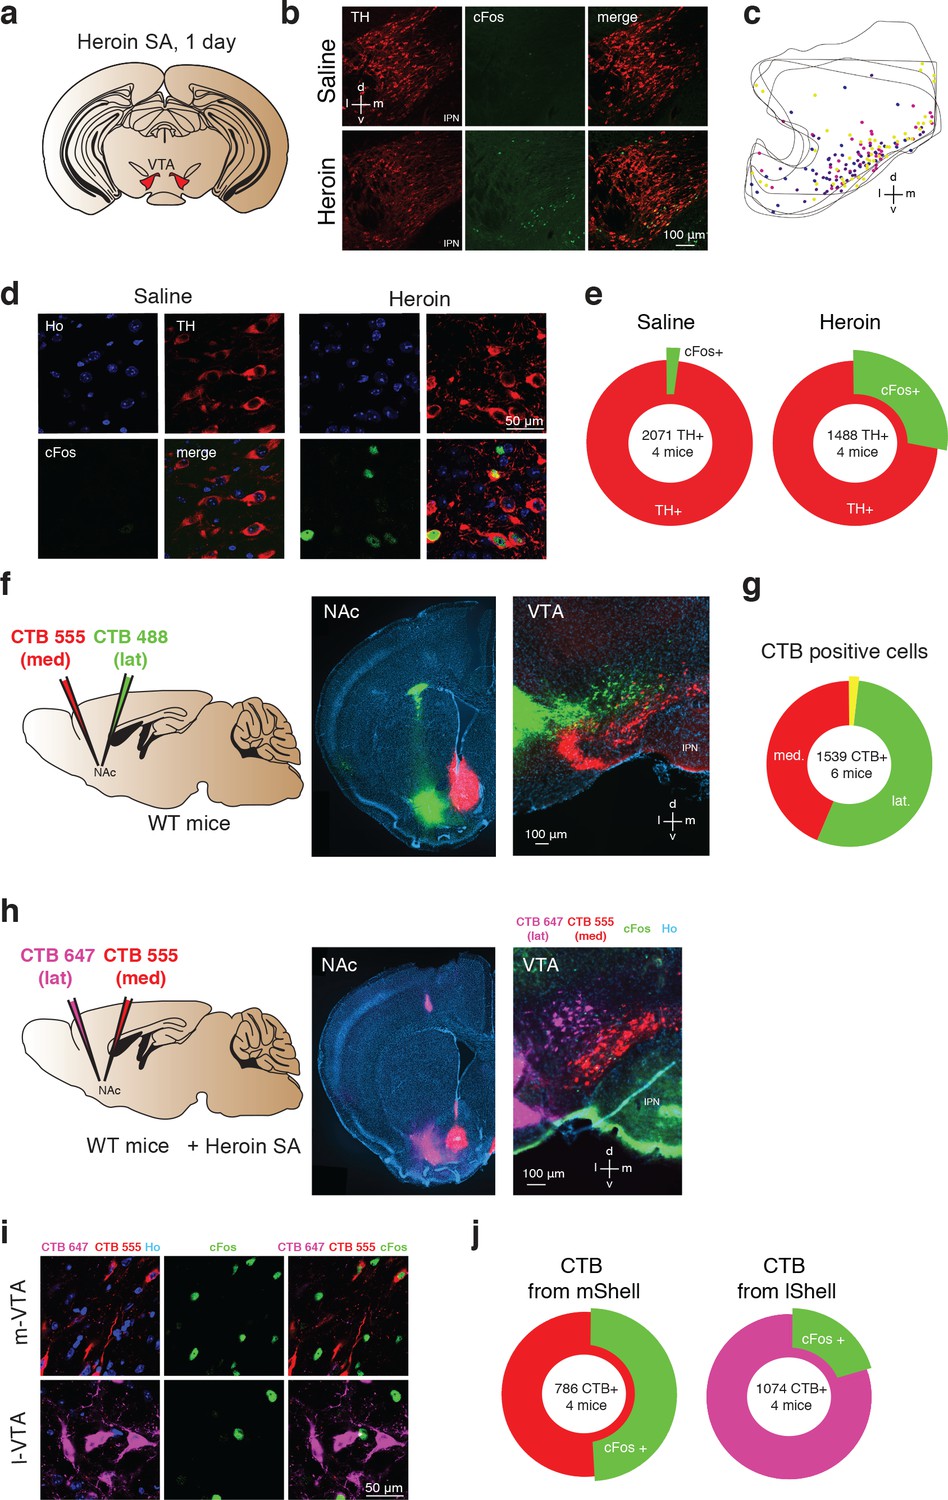
Heroin activates NAc projecting DA neurons in the medial VTA.
(a), Schematic of experiment for (b-e); (b), TH (left, red), cFos (middle, green) staining of VTA DA neurons and co-localization of TH- and cFos-expressing neurons (right) after one day of either saline (top) or heroin (bottom) self-administration. Mice were perfused 60 min after the end of a single self-administration session. Cell nuclei are stained with Hoechst (not shown). D, dorsal; L, lateral; v, ventral; m, medial. (c) , Location within the VTA of histologically identified DA neurons expressing cFos after one day of heroin self-administration. Each color of the markers represents one animal.( d), High magnification confocal pictures of TH and cFos staining in saline and heroin mice. (e), Quantification of the TH positive VTA DA neurons also expressing cFos after one day of saline or heroin self-administration (saline: 2102 cells from four mice, heroin: 1902 cells from four mice). (f), Schematic of experiment for (f–g). The retrograde tracers CTB, conjugated to either the fluorescent dye AlexaFluor 488 (green) or AlexaFluor 555 (red) were injected in the lateral NAc shell or the medial one, respectively. In addition, a catheter implantation was performed (see methods) in order to allow heroin self-administration.( f), Left, coronal images showing infections in the NAc shell. Right, coronal image of the VTA. (g), Quantification of CTB positive cells in the VTA. (h), Schematic for cFos staining in the medial and lateral VTA, projecting to the NAc medial and lateral. Coronal pictures of NAc injected with CTB-555 in the medial Shell and CTB-647 in the lateral Shell and corresponding pictures in the VTA with cFos staining. (i), High magnification confocal images of CTB-555 and 647 with Hoechst (left), cFos (middle, green) and cFos with CTBs (right, green/red/magenta) in the medial or lateral VTA neurons after one day of heroin self-administration. Mice were perfused 60 min after the end of the self-administration session and cell nuclei have also been stained with Hoechst (not shown).( j), Quantification of the cFos positive VTA neurons labelled with red or magenta CTB.
Figure 4
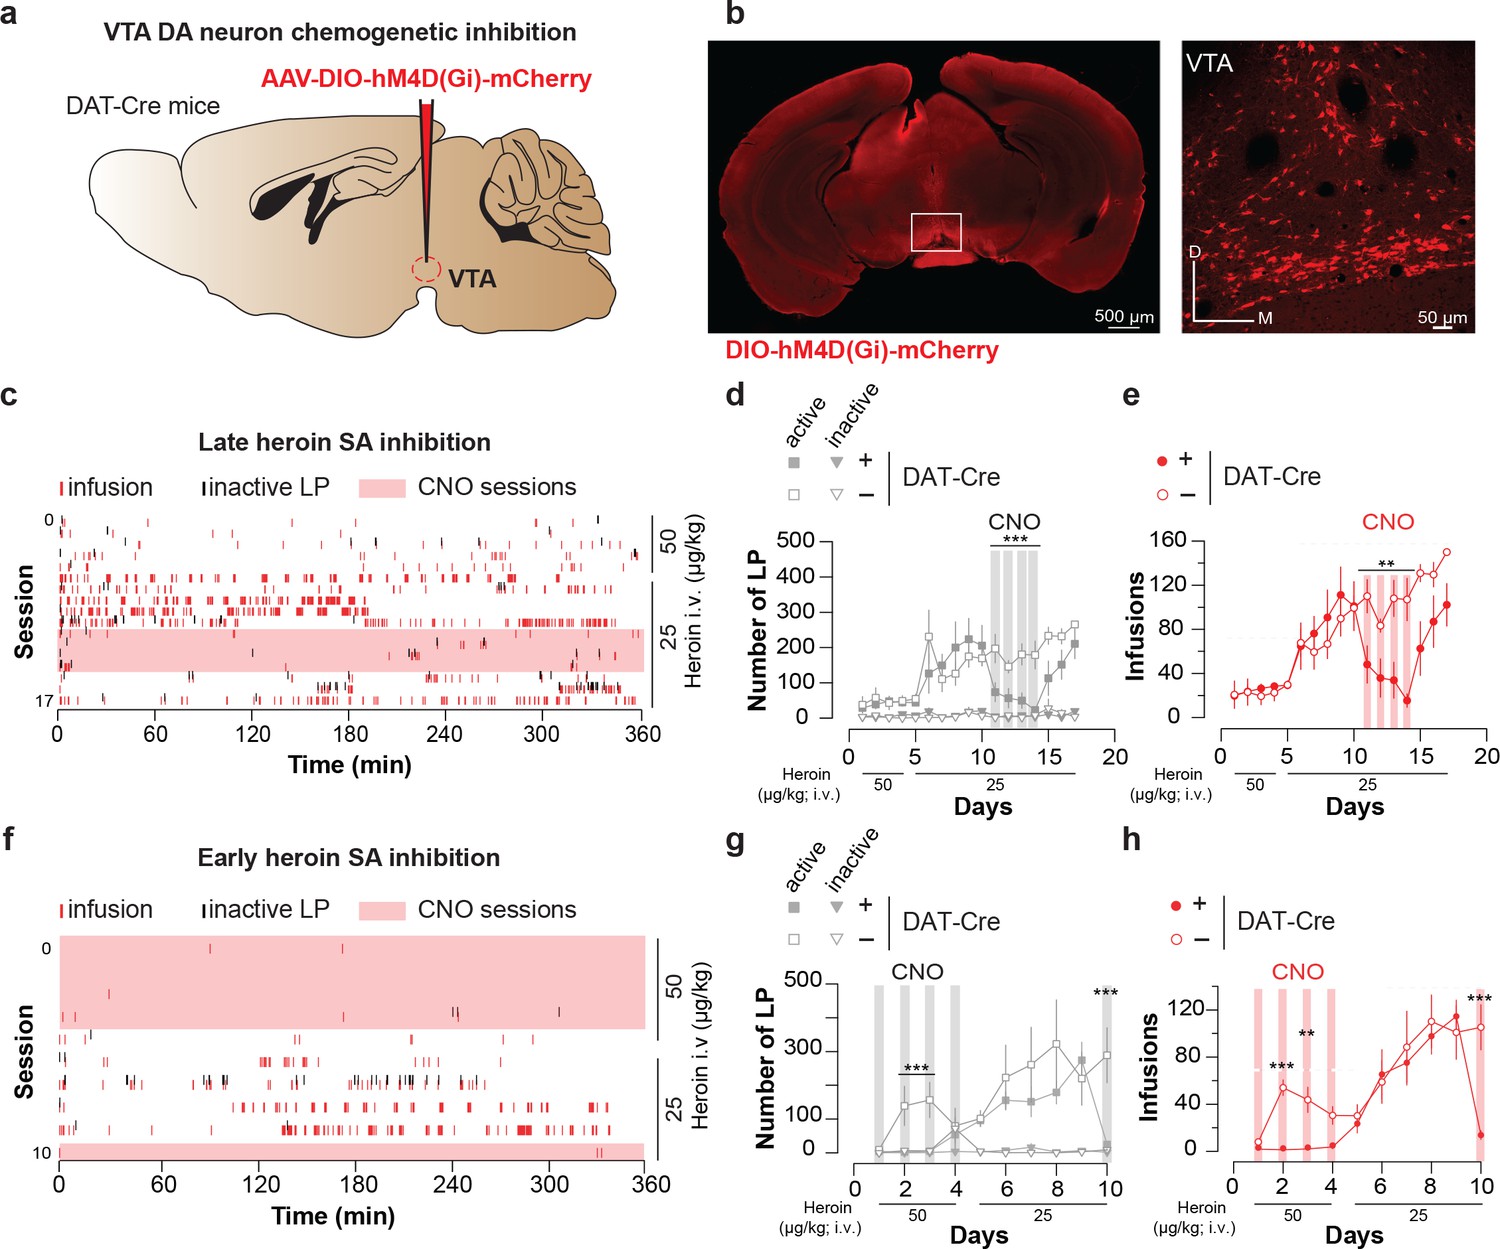
Chemogenetic inhibition of VTA DA neurons suppresses heroin self-administration.
(a), Schematic of the experiment for (b-e); (b), Left, VTA of DTA-Cre+ mice were bilaterally injected with the inhibitory DREADD hM4D. Right, coronal confocal images of infected VTA. (c), Raster plot for infusions and inactive lever presses during the daily acquisition sessions of heroin self-administration for a DAT-Cre+ mouse. CNO (2 mg/kg) was injected intraperitoneally 20 min prior. (d), Mean ±SEM total lever presses and (e), infusions during the acquisition phase of heroin self-administration for DAT-Cre+ (n = 5, closed circle) and DAT-Cre- mice (n = 6, open circle). When the self-administration behavior was well established CNO was injected prior to the session and the activation of the inhibitory DREADD dramatically decreased the number of lever presses and infusions (session highlighted in grey and red, respectively) in the DAT-Cre+ animals (condition (DAT-Cre+ versus DAT-Cre-) x CNO (present, absent); (for LP: two-way RM ANOVA, group effect, F(3, 14)=21.81, p<0.001, time effect, F(3, 42)=1.366, p=0.269, group X time interaction, F(9, 42)=1.328, p=0.252; Bonferroni post hoc analysis, ***p<0.001; for infusions: two-way RM ANOVA, group effect, F(1, 7)=12.25, p<0.01, time effect, F(3, 21)=2.664, p=0.0743, group X time interaction, F(3, 21)=2.816, p=0.064; Bonferroni post hoc analysis, **p<0.01). (f), Raster plot for infusions and inactive lever presses during the daily acquisition session of heroin self-administration for a DAT-Cre+ mouse. Twenty minutes prior to the sessions highlighted in pink, CNO (2 mg/kg) was injected intraperitoneally. (g), Mean ±SEM total lever presses and (h), infusions during the acquisition phase of heroin self-administration for DAT-Cre+ (n = 6, closed circle) or DAT-Cre- mice (n = 4, open circle). CNO injection from the first session prevented the establishment of heroin self-administration behavior in the DAT-Cre+ animals (condition (DAT-Cre+ versus DAT-Cre-) x CNO (present, absent); (for LP: two-way RM ANOVA, group effect, F(3, 16)=37.14, p<0.0001, time effect, F(4, 64)=3.755, p=0.0083, group X time interaction, F(12, 64)=2.959, p=0.002; Bonferroni post hoc analysis, **p<0.01, ***p<0.001; for infusions: two-way RM ANOVA, group effect, F(1, 8)=168.6, p<0.0001, time effect, F(4, 32)=13.52, p=0.0001, group X time interaction, F(4, 32)=8.269, p=0.0001; Bonferroni post hoc analysis, **p<0.01, ***p<0.001).
Figure 5
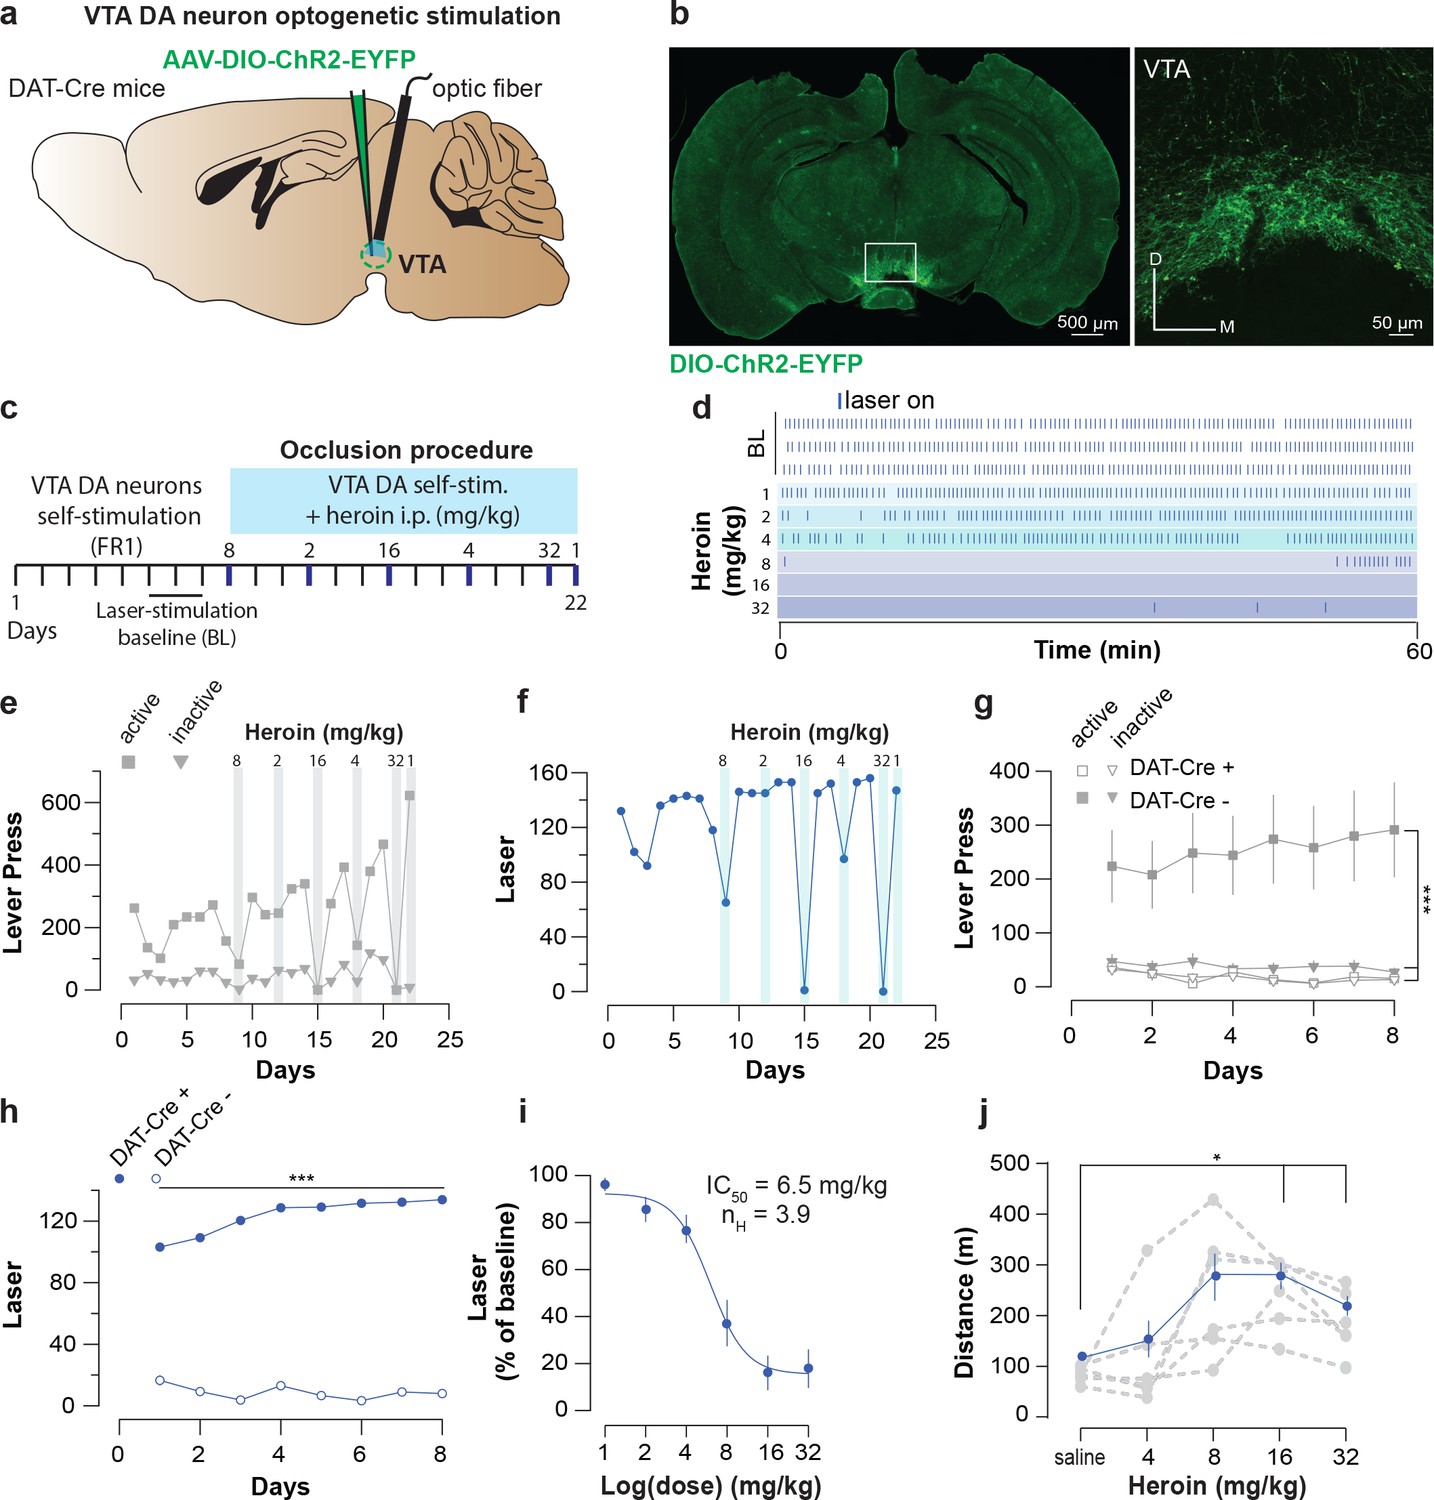
Heroin occludes optogenetic self-stimulation of VTA DA neurons.
(a), Schematic of the experiment for (b-f); (b), Left, VTA of DAT-Cre+ mice was bilaterally injected with a floxed version of the excitatory opsin ChR2. Right, coronal confocal images of infected VTA.(c), Schedule of the experiment.(d), Raster plot for laser stimulation during the daily acquisition session of 1 hr for a DAT-Cre+ mouse. Right before the sessions highlighted in blue, heroin (mg/kg, dose administrated in a random order) was injected intraperitoneally. For a matter of clarity, only the three last baseline sessions are shown and the heroin sessions are arranged from the lowest dose to the highest.(e), Active, inactive lever presses and (f), laser stimulation during each session for an example DAT-Cre+ mouse. Heroin dose-dependently reduced active lever pressing and the number of laser stimulations. (g), Active, inactive lever presses and (h), laser stimulation during the acquisition sessions of self-stimulations for either DAT-Cre+ mice (n = 11, closed circles) or DAT-Cre- mice (n = 6, open circles). Establishment of self-stimulation behavior was present only in mice with expression of eYFP-ChR2 in VTA DA neurons (DAT-Cre+ but not DAT-Cre- mice (for LP: two-way RM ANOVA, group effect, F(3, 30)=38.27, p<0.001, time effect, F(7, 210)=0.4947, p=0.8378, group X time interaction, F(21, 210)=2.179, p=0.0029; Bonferroni post hoc analysis, **p<0.01, ***p<0.001; for laser stimulation: two-way RM ANOVA, group effect, F(1, 15)=581.8, p<0.0001, time effect, F(7, 105)=3.938, p=0.0007, group X time interaction, F(7, 105)=8.233, p<0.0001; Bonferroni post hoc analysis, ***p<0.001).( i), Dose-response and fitting curve for effect of heroin i.p. injection on laser self-stimulation for DAT-Cre+ (n = 11, closed circles) or DAT-Cre- (n = 6, open circles) mice. The values of IC50 and Hill coefficient are 6.5 mg/kg and 3.9 respectively. (j), Mean ±SEM of distance traveled in an open field after daily injections of increasing doses of saline or heroin (n = 6). At highest doses used (16 and 32 mg/kg), heroin significantly increased the distance traveled (saline versus heroin injection, one-way RM ANOVA, heroin doses effect, F(2.475, 12.37)=581.80.27, p=0.00084; Bonferroni post hoc analysis, *p<0.05).
Figure 6
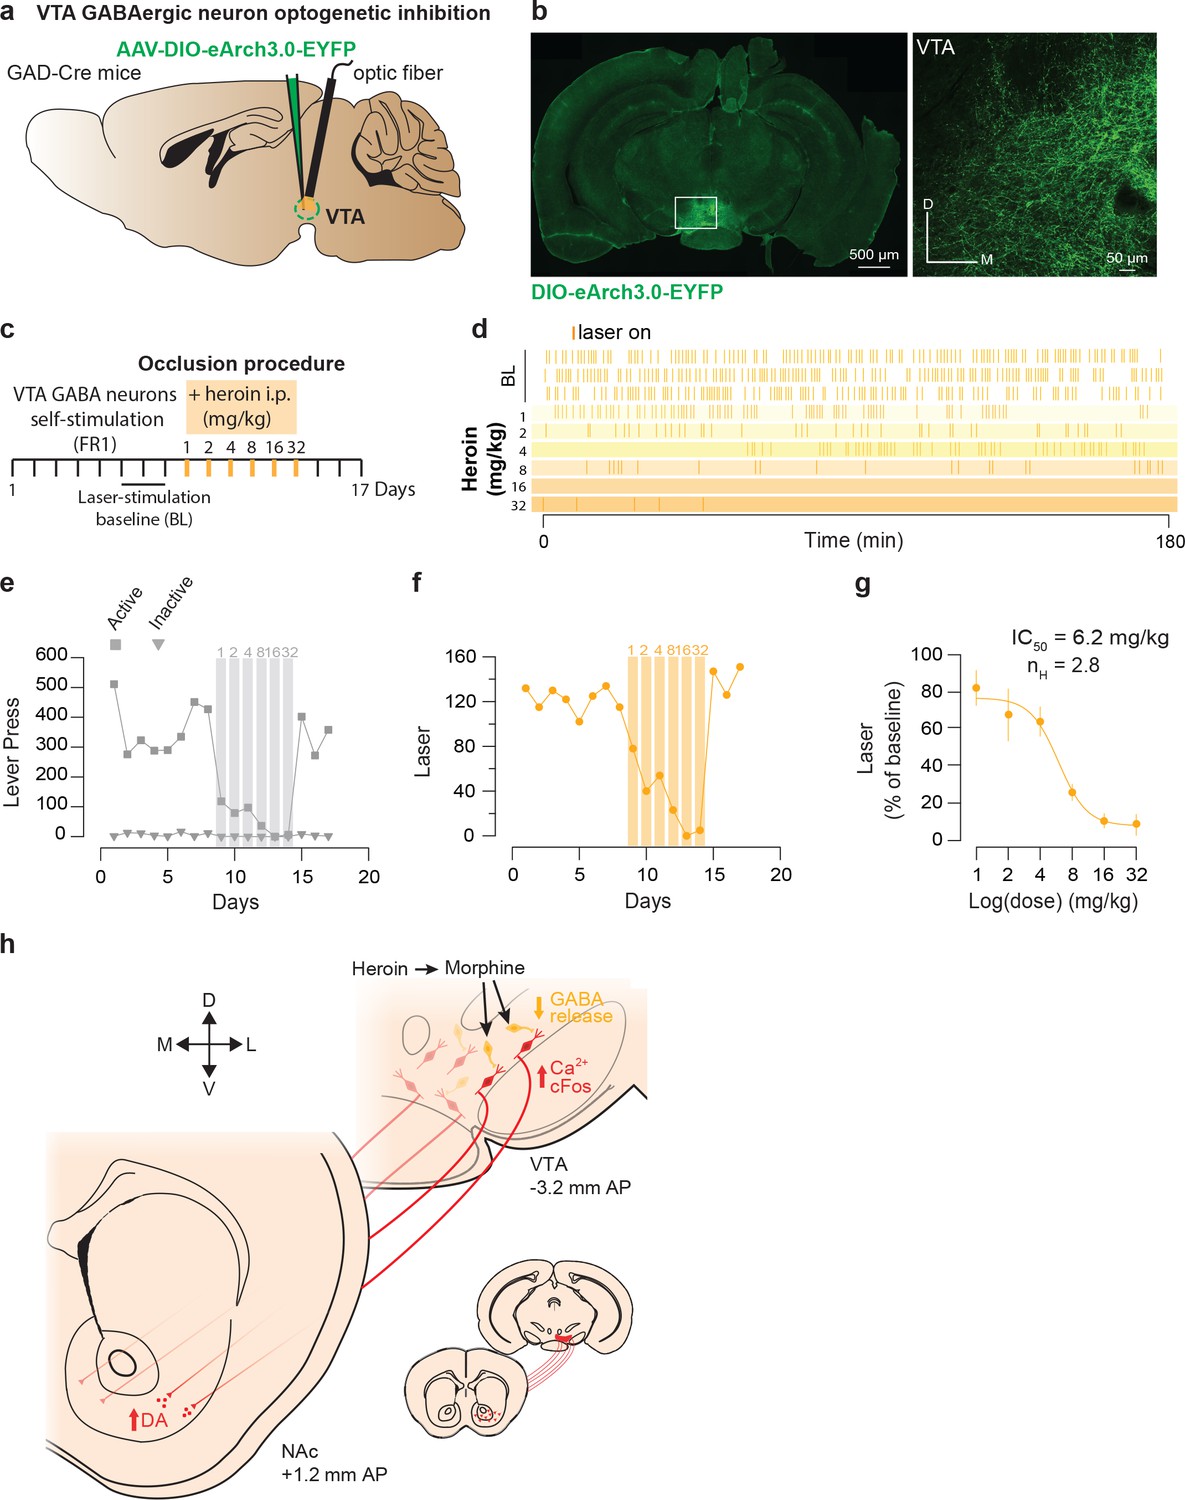
Heroin occludes reinforcing effects of self-inhibition of VTA GABA neurons.
(a), Schematic of the experiment for b-f; (b), Left, VTA of GAD-Cre+ mice was bilaterally injected with a floxed version of the inhibitory opsin Arch3.0. Right, coronal confocal images of infected VTA.( c,) Schedule of the experiment.( d), Raster plot for laser inhibition during the daily acquisition session of 3 hr for a GAD-Cre+ mouse. Right before the sessions highlighted in yellow, heroin (mg/kg) was injected intraperitoneally.( e), total lever presses and (f), infusions during the acquisition phase of laser self-inhibition for an example GAD-Cre+ mouse. Heroin injection resulted in a dose-dependent decrease in laser self-inhibition.( g,) Dose-response and fitting curve for effect of heroin i.p injection on laser self-inhibition for GAD-Cre+ mice (n = 7). The values of IC50 and Hill coefficient are 6.2 mg/kg and 2.8 respectively. (h,) Summary diagram. After self-administration heroin, metabolized in morphine, binds to the MORs located on GABA neurons and activates GIRKs channels. It results in the inhibition of these neurons and the disinhibition of the DA neurons located in the ventromedial VTA. Disinhibition of these neurons leads to an increase in DA release in the medial NAc shell.
Tables
Key resources table
| Reagent type (species) or resource | Designation | Source or reference | Identifiers | Additional information |
|---|---|---|---|---|
| Genetic reagent (M. musculus) | DATIREScre | The Jackson Laboratory (www.jax.org) | MGI:3689434 | |
| Genetic reagent (M. musculus) | Gad2tm2(cre)Zjh | The Jackson Laboratory (http://www.jax.org) | MGI:4418713 | |
| Cell line (homo sapiens, human) | HEK293T | ATCC | Cat# CRL-1573 | |
| Recombinant DNA reagent | AAV9-CAG-dLight1.1 | Dr. Lin Tian, University of California Davis | Patriarchi et al., 2018 | |
| Recombinant DNA reagent | AAVDJ-EF1a-DIO-GCaMP6m | Stanford Vector Core | Cat# GVVC-AAV-94 | |
| Recombinant DNA reagent | AAV8-hSyn-DIO-ChrimsonR-tdTo | UNC Vector Core | ||
| Recombinant DNA reagent | AAV5-hSyn-DIO-HM4D(Gi)-mCherry | UNC Vector Core | ||
| Recombinant DNA reagent | AAV5-EF1a-DIO-ChR2(H134R)-eYFP | UNC Vector Core | ||
| Recombinant DNA reagent | AAV5-EF1a-DIO-eArch3.0-eYFP | UNC Vector Core | ||
| Peptide, recombinant protein | CTB (Alexa FluorTM 555 Conjugate) | Invitrogen/Thermo Fisher | Cat# C34776 | |
| Peptide, recombinant protein | CTB (Alexa FluorTM 488 Conjugate) | Invitrogen/Thermo Fisher | Cat# C34775 | |
| Peptide, recombinant protein | CTB (Alexa FluorTM 647 Conjugate) | Invitrogen/Thermo Fisher | Cat# C34778 | |
| Chemical compound, drug | Diacetylmorphine (heroin) | DiaMo Narcotics GmbH | DIAPHIN | |
| Chemical compound, drug | Citalopram | Cayman Chemical | Cat# 14572 | |
| Chemical compound, drug | Reboxetine | Tocris | Cat# 1982 | |
| Chemical compound, drug | Cocaine | University Hospital of Geneva | ||
| Antibody | Anti-cFos | Santa Cruz Biotechnology | RRID: AB_2106783 | (dilution 1:5000) |
| Antibody | Anti-Tyrosine Hydroxylase | Sigma-Altrich | Cat# T2928 | (dilution 1:500) |
| Antibody | Anti- GFP | Invitrogen/Thermo Fisher | Cat# 11122 | (dilution 1:500) |
| Software, algorithm | Prism 7.02 | Graphpad | ||
| Software, algorithm | MATLAB R2017a | Mathworks | ||
| Software, algorithm | Synapse | Tucker-Davis Technologies |
Additional files
-
Supplementary file 1
Statistics table
- https://doi.org/10.7554/eLife.39945.008
-
Transparent reporting form
- https://doi.org/10.7554/eLife.39945.009
Download links
A two-part list of links to download the article, or parts of the article, in various formats.
Downloads (link to download the article as PDF)
Open citations (links to open the citations from this article in various online reference manager services)
Cite this article (links to download the citations from this article in formats compatible with various reference manager tools)
Dopamine neurons projecting to medial shell of the nucleus accumbens drive heroin reinforcement
eLife 7:e39945.
https://doi.org/10.7554/eLife.39945


