A Phytophthora effector recruits a host cytoplasmic transacetylase into nuclear speckles to enhance plant susceptibility
- Nanjing Agriculture University, China
- Key Laboratory of Integrated Management of Crop Diseases and Pests (Ministry of Education), China
- Oregon State University, United States
Figures
Figure 1 with 1 supplement

PsAvh52 is an essential gene for full virulence of P.sojae.
(A)-(B) Virulence of ∆PsAvh52 knockout transformants of P. sojae on etiolated soybean hypocotyls. (A) Disease symptoms were observed 2 days after inoculation of the hypocotyls with 100 zoospores of P. sojae wild-type (P6497), knock-out mutants T33 and T37, or CK which was a non-knockout transformant recovered from the knockout transformation experiment. (B) Quantification of the biomass of P. sojae using genomic DNA qPCR. Data are the means ± s.d. of three independent experiments. Different letters on the graph show statistically significant differences among the samples (p < 0.01, Duncan’s multiple range test) (C)-(E) Susceptibility to P. sojae of soybean hairy roots expressing PsAvh52 or carrying an empty vector (EV) control. (C) Oospores produced by RFP-labeled P. sojae inoculated onto soybean hairy roots carrying PsAvh52 or EV. The left image in each case shows the RFP-labeled oospores in the root, while on the right, the images of the oospores and the GFP-labeled root are combined. Scale bars = 0.2 mm. (D) Numbers of oospores of P. sojae were observed at 48 hpi under a confocal microscope. (E) Quantification of the biomass of P. sojae infection in soybean hairy roots using qPCR. In (D) and (E), data are the means ± s.d. of three independent biological replicates. Asterisks denote significant differences between samples (**p < 0.01, Student’s t test).
-
Figure 1—source data 1
Source data for Figure 1.
- https://doi.org/10.7554/eLife.40039.005
Figure 1—figure supplement 1
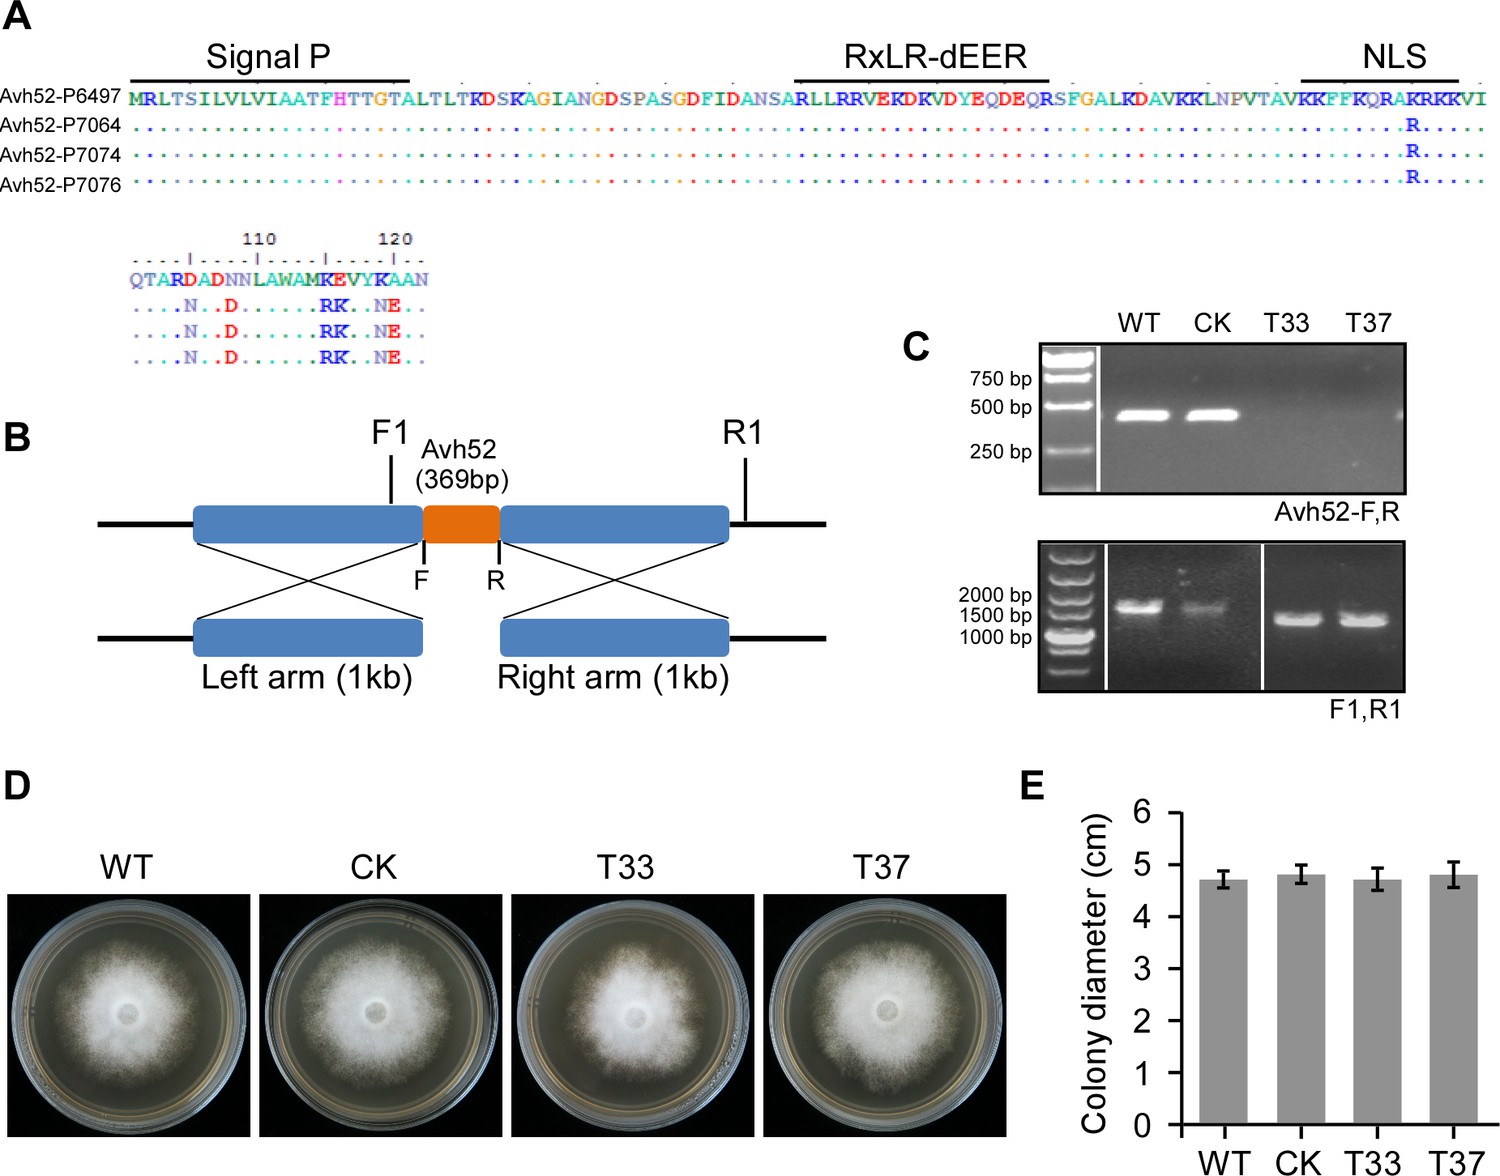
Knock out of PsAvh52 using the CRISPR/Cas9 System.
(A) PsAvh52 is conserved in strains representing four principal genotypes (Forster, 1994), P6497, P7064, P7074, P7076. Dots indicate identical amino acids. Colors indicate chemical natures of amino acids. (B) Strategy for PsAvh52 gene deletion using the CRISPR/Cas9 system. PsAvh52 was deleted using homologous donor recombination. The sizes of the left and right arms are 1 kb. The knock-out mutants were screened by primer pairs F1/R1 and PsAvh52-F/R. (C) Genomic PCR analysis demonstrated that PsAvh52 was completely deleted in mutants T33 and T37 but not in control transformant CK. (D, E) The growth rate of PsAvh52 mutants compared to WT and CK on 10% V8 medium. Data are the means ± s.d. of three independent biological replicates. No significant differences were observed based on Student’s t test.
Figure 2 with 2 supplements

PsAvh52 binds to a soybean acetyltransferase protein, GmTAP1, in vivo and in vitro.
(A) Co-immunoprecipitation of PsAvh52 by GmTAP1 protein, but not by GmTAP2. Total proteins were extracted from N. benthamiana leaves expressing Flag-Avh52-RFP with GFP-GmTAP1 or GFP-GmTAP2. Immunoprecipitation (IP) was performed using GFP-Trap beads and the captured proteins were examined by western blot using anti-Flag antibody. (B) In vitro pull-down of PsAvh52 by GmTAP1 but not by GmTAP2. GST-GmTAP1, GST-GmTAP2 and His-Avh52 were expressed in E. coli and total soluble proteins were mixed as indicated in the input. GST-pull down was performed using GST-beads and the captured proteins were examined by western blotting with anti-His antibodies. (C) GmTAP1 does not pull down mutant Avh52M4 in vitro. His-Avh52, His-Avh52M4 and GmTAP1 were expressed in E. coli and mixed as indicated. Proteins captured on GST-beads were detected by western blotting with anti-His antibodies. (D, E) Susceptibility to P. sojae of soybean hairy roots expressing PsAvh52, PsAvh52M4 or EV. Oospore production by RFP-expressing P. sojae was monitored at 48 hr after inoculation. Protein production was confirmed by western blots (Figure 2—figure supplement 2C). (D) Fluorescence micrographs. Scale bars = 0.25 mm (E) Numbers of oospores are the means ± s.d. of three independent experiments. Different letters indicate statistically significant differences among the samples (p < 0.01, Duncan’s multiple range test). Similar results were observed in three independent biological experiments for (A)-(D).
-
Figure 2—source data 1
Source data for Figure 2.
- https://doi.org/10.7554/eLife.40039.009
-
Figure 2—source data 2
Source data for Figure 2.
- https://doi.org/10.7554/eLife.40039.010
Figure 2—figure supplement 1

Alignment of amino acid sequences of three isoforms of GmTAP1 and paralog GmTAP2 by ClustalW.
Dashes indicate gaps introduced to optimize the alignment.
Figure 2—figure supplement 2
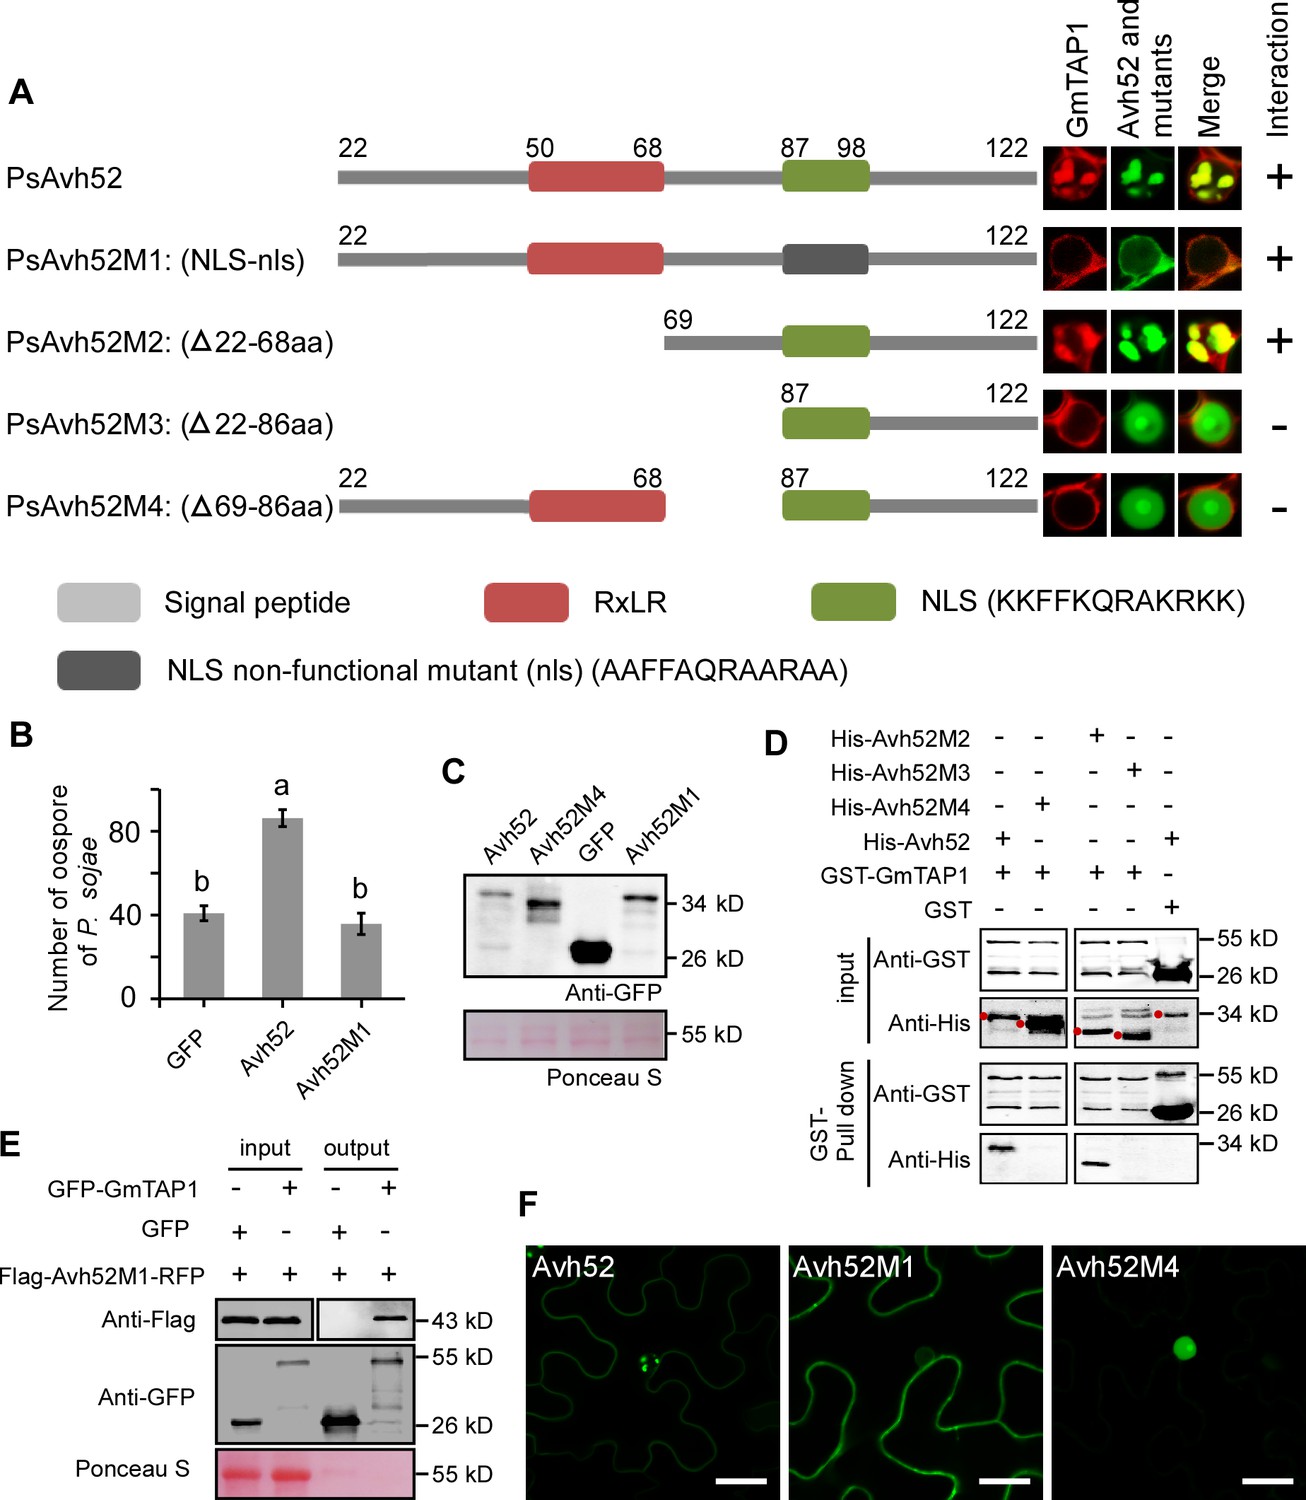
Residues 69 – 86 and the NLS (nuclear localization signal) of PsAvh52 are required for it to cause GmTAP1 to relocate into nuclear speckles.
(A) Structures and co-localization with GmTAP1 of PsAvh52 and its mutants. The center three panels show the localization of GmTAP1-RFP and GFP-PsAvh52 (WT and mutant) proteins after 24 hr co-expression in N. benthamiana leaf cells. Rightmost column shows a summary of the interaction of PsAvh52 and its mutants with GmTAP1. (B) P. sojae oospore production 48 hr after inoculation of soybean hairy roots overexpressing GFP-Avh52M1, GFP-Avh52 or GFP. Data are the means ± s.d. of three independent experiments. Different letters on the graph show statistically significant differences from the samples (p < 0.01, Duncan’s multiple range test). (C) Western blot validation of protein levels of GFP, GFP-PsAvh52, GFP-PsAvh52M1 and GFP-PsAvh52M4 in soybean hairy roots, using anti-GFP antibodies. Total proteins were stained with Ponceau S. (D) The interaction of WT and mutants of PsAvh52 with GmTAP1 assayed using GST pull-downs. (E) Co-immunoprecipitation of PsAvh52M1 by GmTAP1 protein. Total proteins were extracted from N. benthamiana leaves co-expressing Flag-Avh52M1-RFP with GFP-GmTAP1 or GFP control. Immunoprecipitation (IP) was performed using GFP-Trap beads and the captured proteins were examined by western blot using anti-Flag antibody. (F) The localization of PsAvh52 and its mutants expressed alone in N. benthamiana leaf cells for 24 hr. Scale bars = 20 µm. Note that N. benthamiana expresses a GmTAP1 homolog which might bind to PsAvh52 and affect its localization.
Figure 3 with 2 supplements
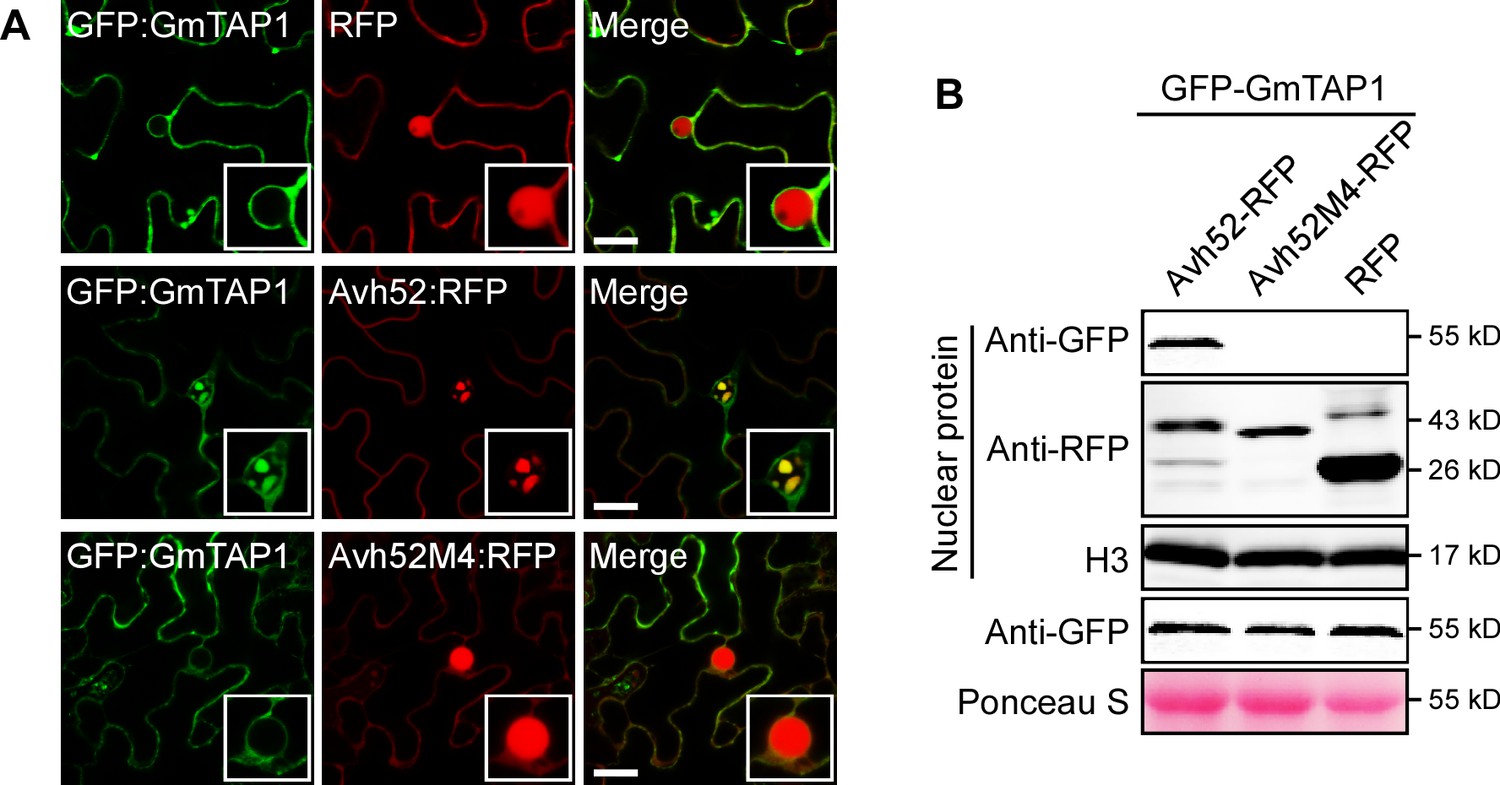
Mutant PsAvh52M4 does not cause re-localization of GmTAP1 into nuclear speckles.
(A) The localization of GFP-GmTAP1 when co-expressed with PsAvh52-RFP, PsAvh52M4-RFP or RFP in N. benthamiana leaf cells. Fluorescence was detected by confocal microscopy at 24 hpi. Scale bars, 25 µm. (B) Western blots of nuclear and total proteins from N. benthamiana leaf tissue co-expressing GFP-GmTAP1 with PsAvh52-RFP fusions (WT and M4 mutant) or RFP. Proteins were detected with the indicated antibodies. Loading controls were histone H3 for the nuclear fraction and Ponceau-stained Rubisco for total proteins.
-
Figure 3—source data 1
Source data for Figure 3.
- https://doi.org/10.7554/eLife.40039.014
Figure 3—figure supplement 1

The localization of GmTAP1 and effectors in N.benthamiana.
(A) Localization of N-terminal GFP-labeled GmTAP1 and C-terminal RFP-labeled GmTAP1 in N. benthamiana leaf cells. (B) Localization of PsAvh52 and GmTAP1 after extended co-expression (36 hr to 48 hr) in N. benthamiana leaf cells. (C) Percentages of nuclei showing co-localization of GFP-GmTAP1 and PsAvh52-RFP in nuclear speckles versus the full nucleus following different times of expression. (D) Localization of GmTAP1-RFP after co-expression with two other nuclear targeted effectors fused to GFP in N. benthamiana leaf cells. In (A, B, D) scale bars = 50 µm. (E) Protein levels of GmTAP1-RFP and GFP-effectors when co-expressed in N. benthamiana leaf tissue, as detected in western blots with the indicated antibodies. Loading control was Ponceau-stained Rubisco. (F) The full predicted amino acid sequences of PsAvh53 and PsAvh137 with predicted NLS sequences highlighted in blue.
Figure 3—figure supplement 2
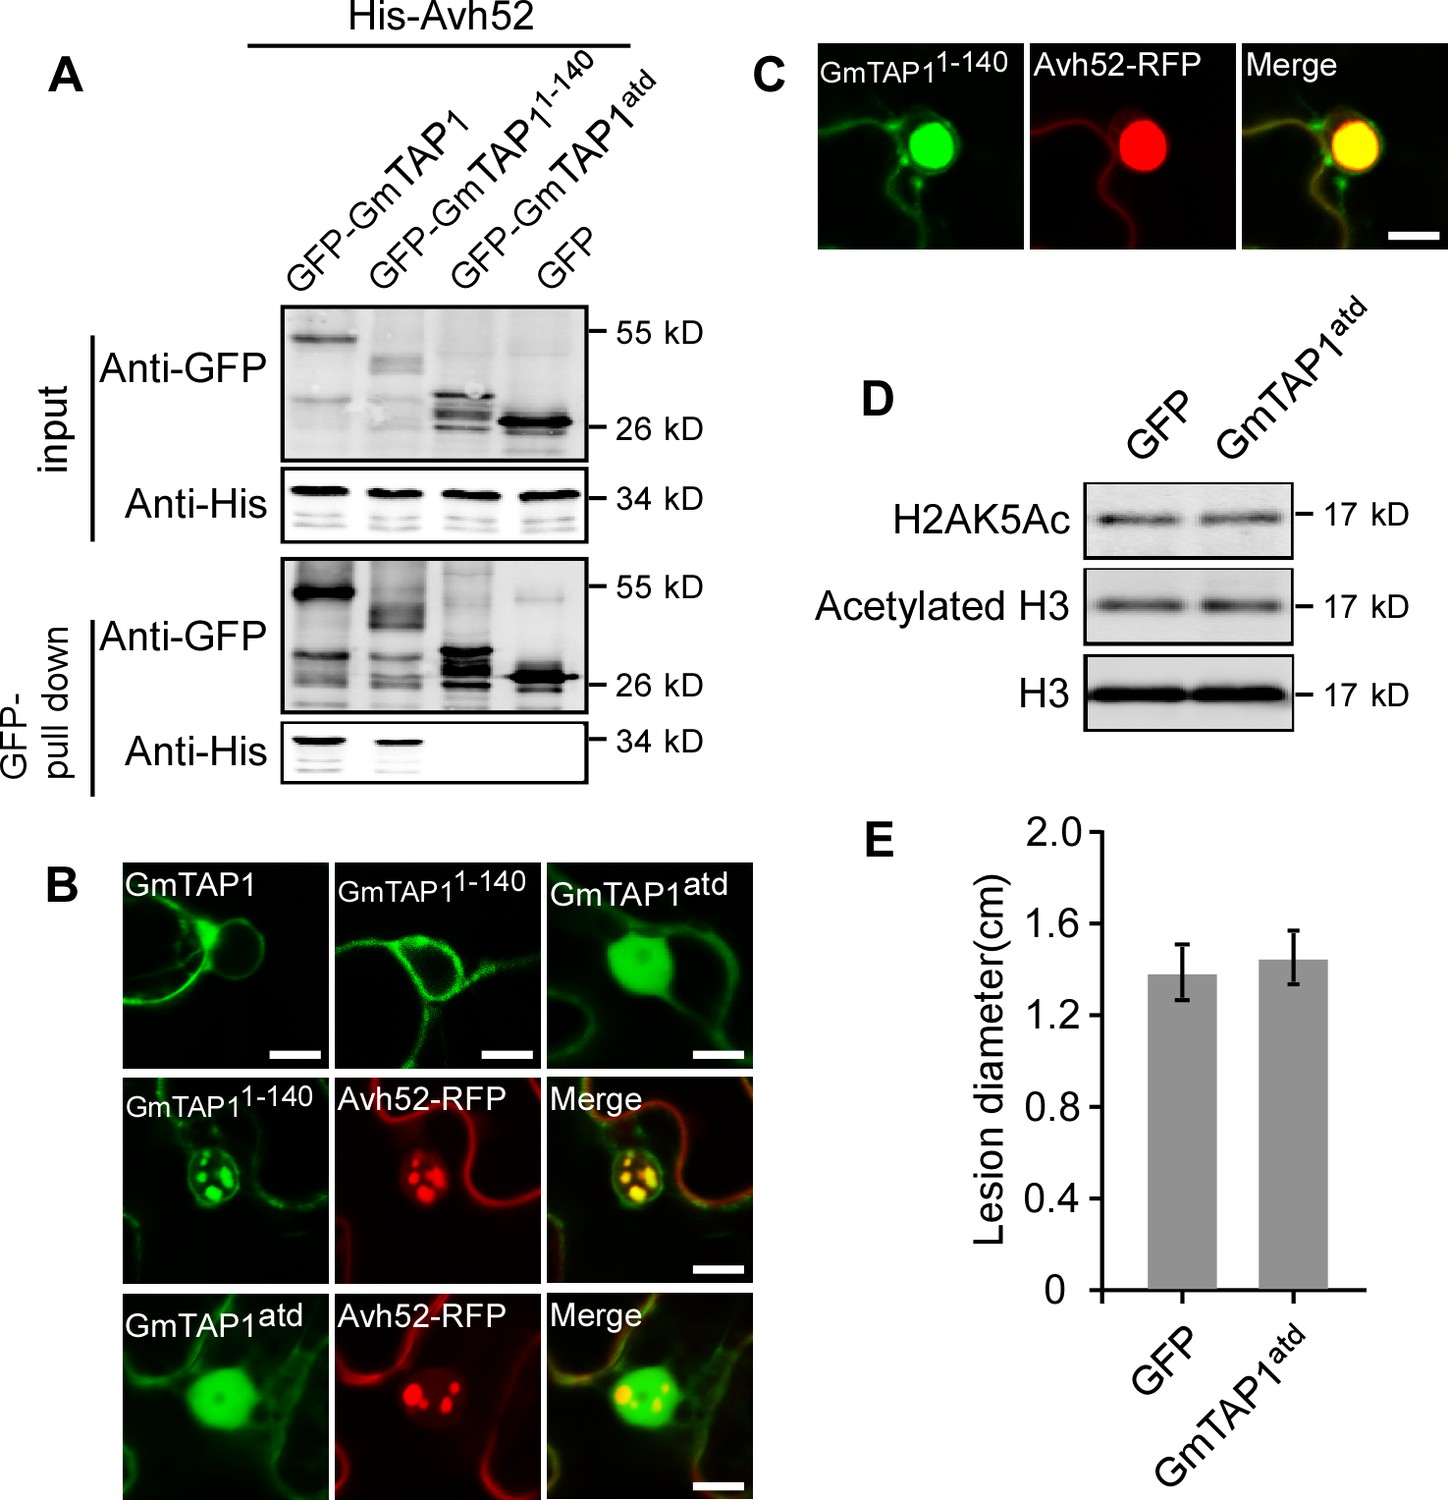
Interaction and co-localization of the N-terminal and C-terminal domains of GmTAP1 with PsAvh52.
(A) Pull down of His-Avh52 by GFP fusions of various GmTAP1 domains. GFP-GmTAP1 fusions and GFP were purified from N. benthamiana, and His-Avh52 was purified from E. coli. (B) Localization of indicated GFP-GmTAP1 proteins in the absence (upper) or presence (the two lower) of PsAvh52-RFP after expression in N. benthamiana cells. Scale bars = 10 µm. (C) Localization of PsAvh52 and GmTAP11-140 after extended co-expression (36 hr to 48 hr) in N. benthamiana leaf cells. Scale bars = 10 µm. (D) In vivo histone acetylation assays following expression of GmTAP1atd in N. benthamiana leaves. Histone acetylation was detected by western blotting. This experiment was repeated three times with similar results. (E) Susceptibility of N. benthamiana leaves to P. capsici infection following transient 48 hr expression of GmTAP1atd. Data are the means ± s.d. of three independent biological replicates. No significant differences were observed based on Student’s t test.
Figure 4 with 1 supplement
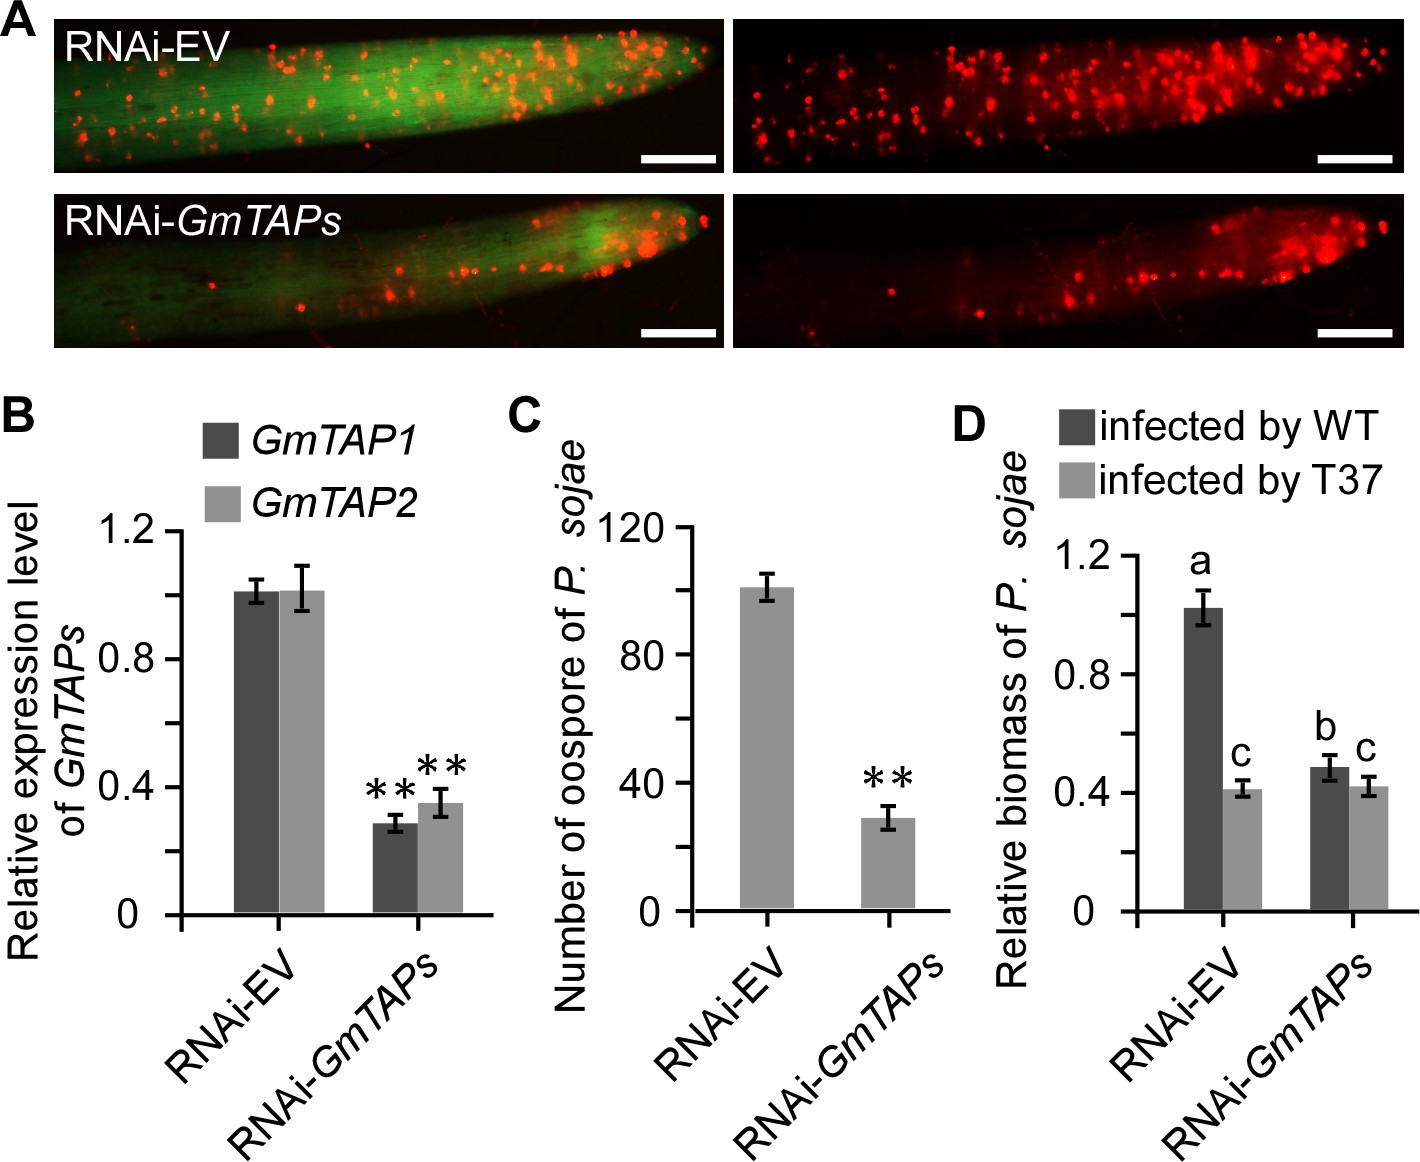
Silencing of GmTAP genes decreased susceptibility of soybean to P. sojae.
Soybean hairy roots were transformed with GmTAP-silencing or empty vector constructs (A) Oospore production by RFP-labeled P. sojae inoculated onto GmTAP-silenced or EV control soybean hairy roots and monitored by fluorescence microscopy at 72 hpi. Scale bars = 0.5 mm. (B) Relative in dividual expression level of each GmTAP gene in the RNAi-GmTAPs hairy roots determined by qRT-PCR, relative to the levels in hairy roots carrying RNAi-EV, after normalization to the internal control, GmCYP2. Data are the means ± s.d. of three independent biological replicates. (C) Numbers of oospores produced by RFP-labeled P. sojae inoculated onto GmTAP-silenced or EV control soybean hairy roots. Numbers are the means ± s.d. of three independent biological replicates. (D) Virulence contribution of PsAvh52 requires GmTAP1 expression. The relative biomass of P. sojae was determined by genomic DNA qPCR 72 hr after inoculation of hairy roots with P. sojae wild type or ∆PsAvh52 knockout line T37. Data are the means ± s.d. of three independent experiments. Different letters show statistically significant differences among the samples (p < 0.05, Duncan’s multiple range test) In (B) and (C), asterisks denote significant differences between silenced and control roots (**p < 0.01, Student’s t test).
-
Figure 4—source data 1
Source data for Figure 4.
- https://doi.org/10.7554/eLife.40039.017
Figure 4—figure supplement 1
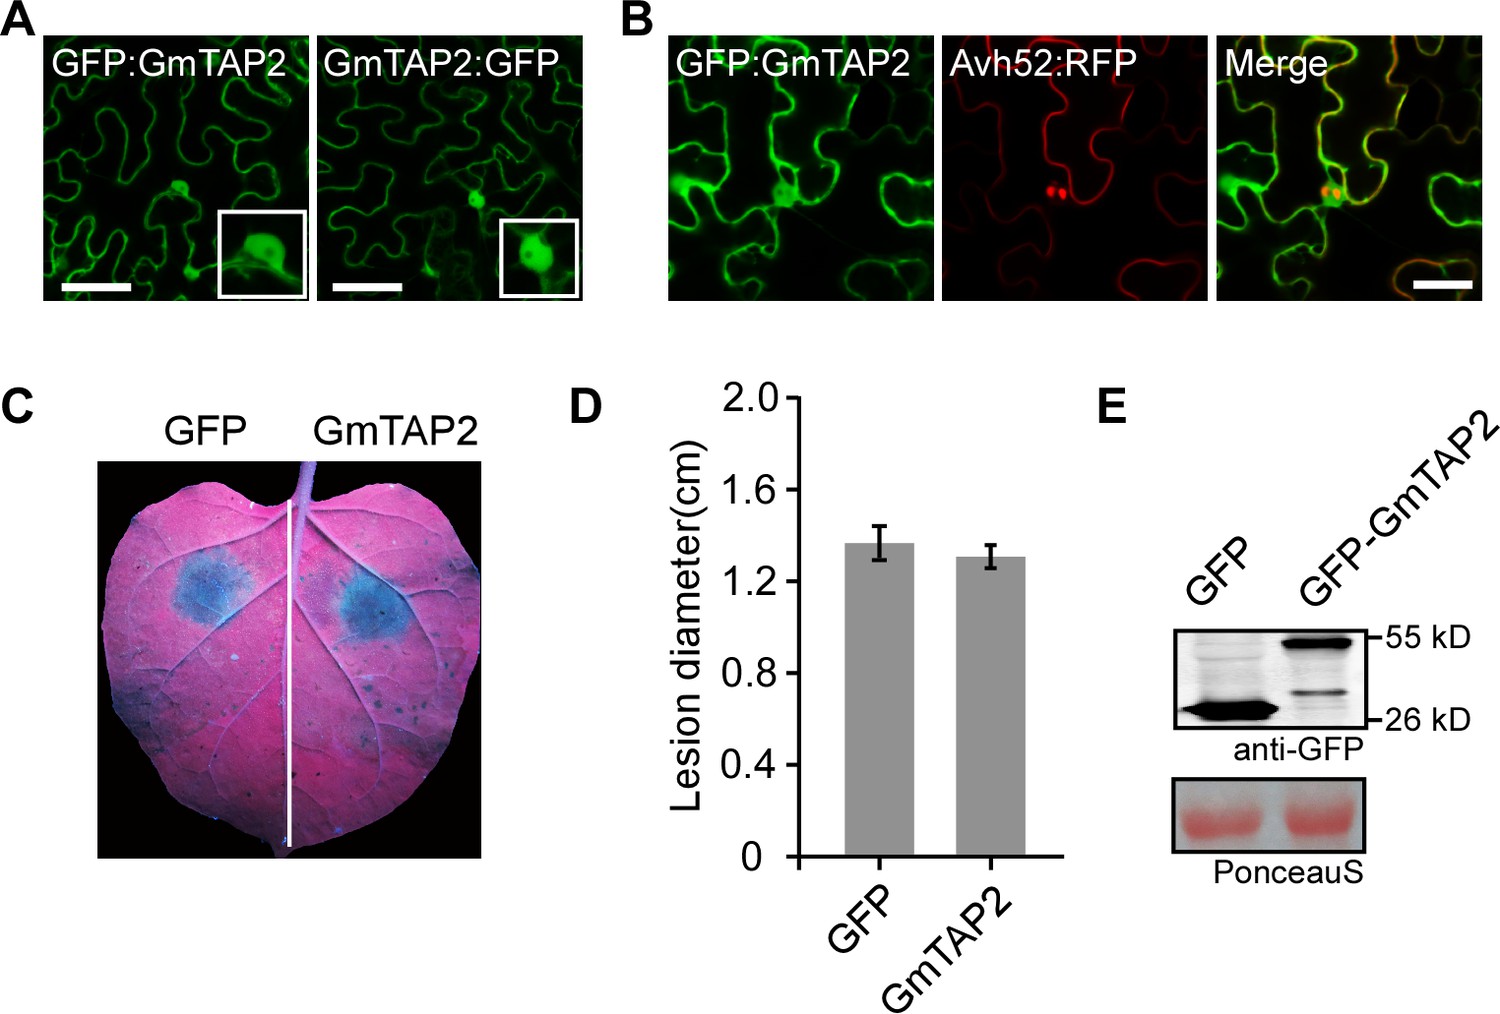
Localization and effect on P.capsici susceptibility of GmTAP2 following transient expression in N. benthamiana leaves.
(A) Localization of GFP-labeled GmTAP2 after 48 hr expression in N. benthamiana cells. Scale bars = 50 µm. (B) Localization of GFP-GmTAP2 in the presence of PsAvh52-RFP after expression in N. benthamiana cells. Scale bars = 20 µm. (C, D) P. capsici lesion diameters on N. benthamiana leaves following 48 hr transient expression of GFP-GmTAP2 or GFP. (C) Representative image of a single leaf after 2 days. (D) Statistical comparison. Data are the means ± s.d. of three independent biological replicates. No significant differences were observed based on Student’s t test. (D) Protein levels in N. benthamiana leaves following 48 hr transient expression of GFP-GmTAP2 or GFP, determined using western blots with anti-GFP antibodies.
Figure 5 with 1 supplement
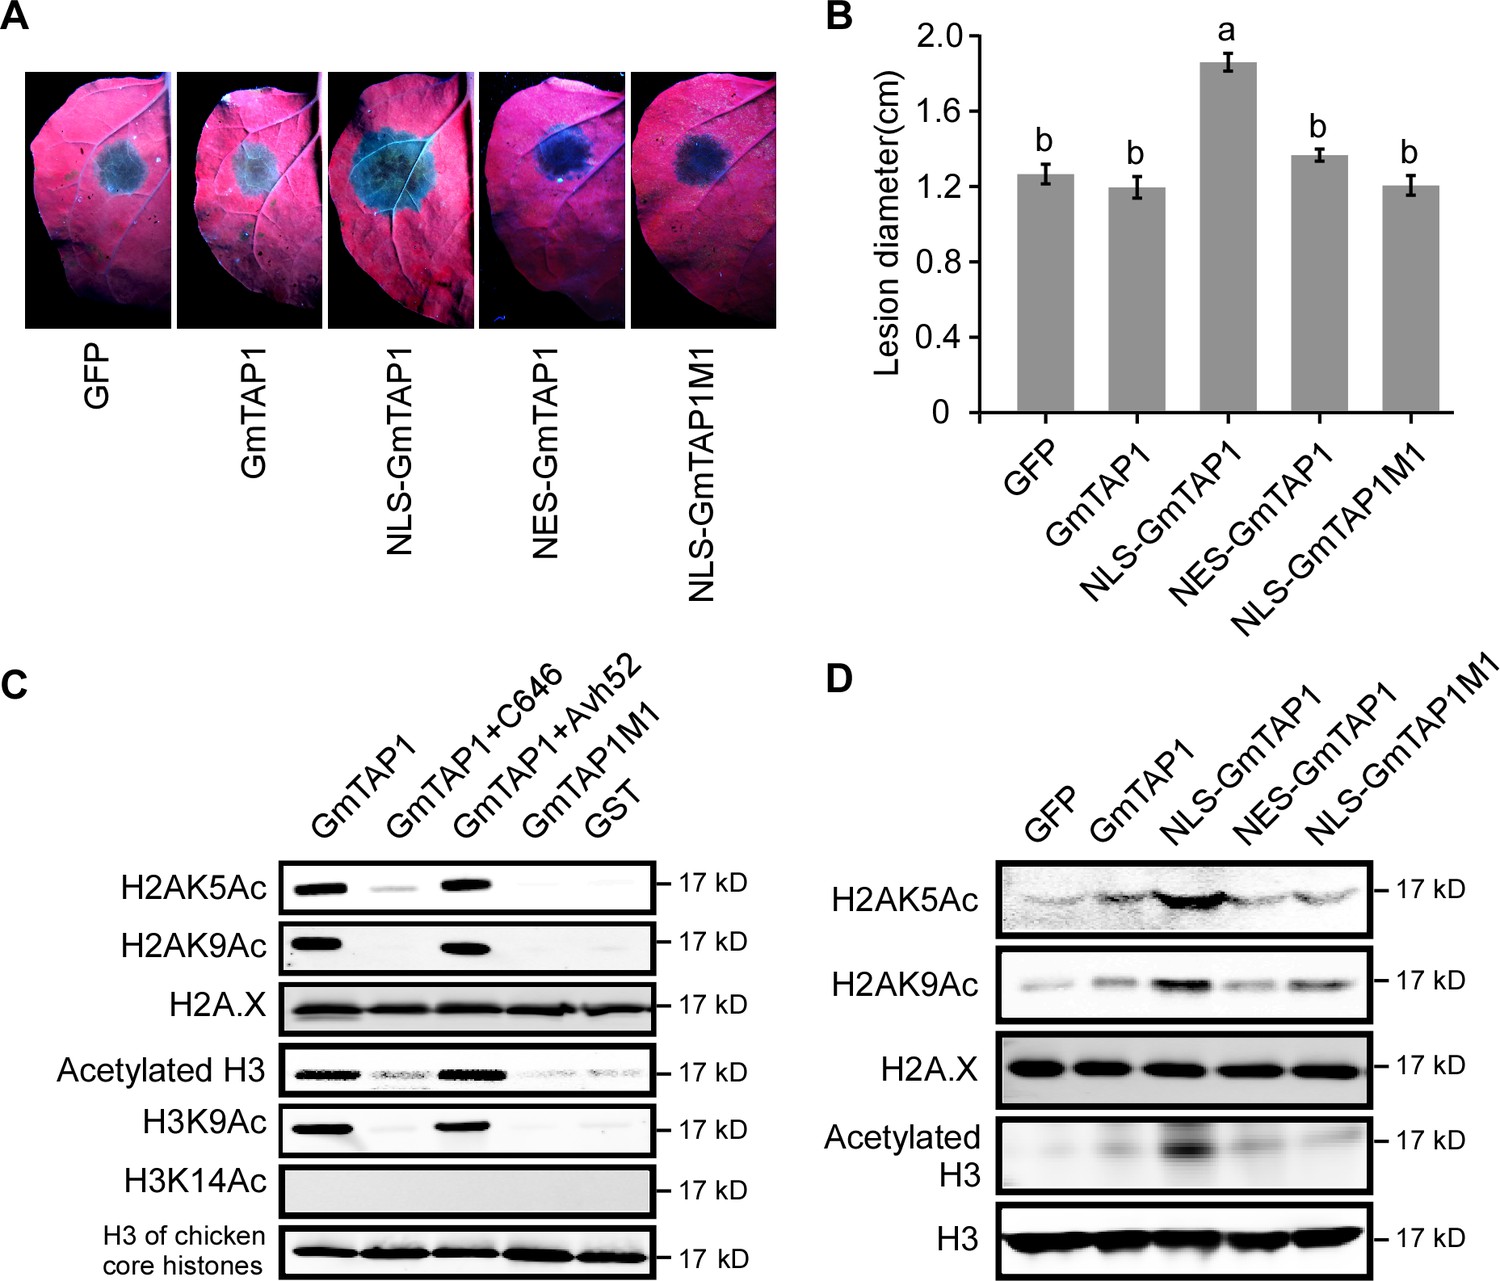
Localization to the nucleus and histone acetyltransferase activity of GmTAP1 are essential for enhancing Phytophthora infection.
(A, B) P. capsici infection of N. benthamiana leaves expressing GmTAP1 fused to a nuclear localization signal (NLS), a nuclear exclusion signal (NES), and/or carrying an acetlytransferase-minus mutation (GmTAP1M1), compared to control leaves expressing GmTAP1 or GFP. Infection lesions were observed 48 hr after inoculation with P. capsici strain LT263. (A) Representative photographs under UV (B) Lesion diameters; means ±s.d. of three independent experiments. Different letters indicate statistically significant differences among the samples (p < 0.01, Duncan’s multiple range test). (C, D) Histone acetyltransferase activity of GmTAP1. (C) In vitro assays using chicken core histones as substrate. Acetylation was determined by western blotting using the indicated H3ac, H2Aac, H2A.X or H3 antibodies. C646 is a chemical inhibitor of histone acetyltransferase. (D) In vivo assays following expression of GFP, GmTAP1, NLS-GmTAP1, NES-GmTAP1, or NLS-GmTAP1M1 in N. benthamiana leaves. After 2 days of expression, nuclear proteins were extracted and the levels of histone acetylation were detected by western blotting as in (D). All experiments in (C) and (D) were repeated three times with similar results.
-
Figure 5—source data 1
Source data for Figure 5.
- https://doi.org/10.7554/eLife.40039.020
Figure 5—figure supplement 1
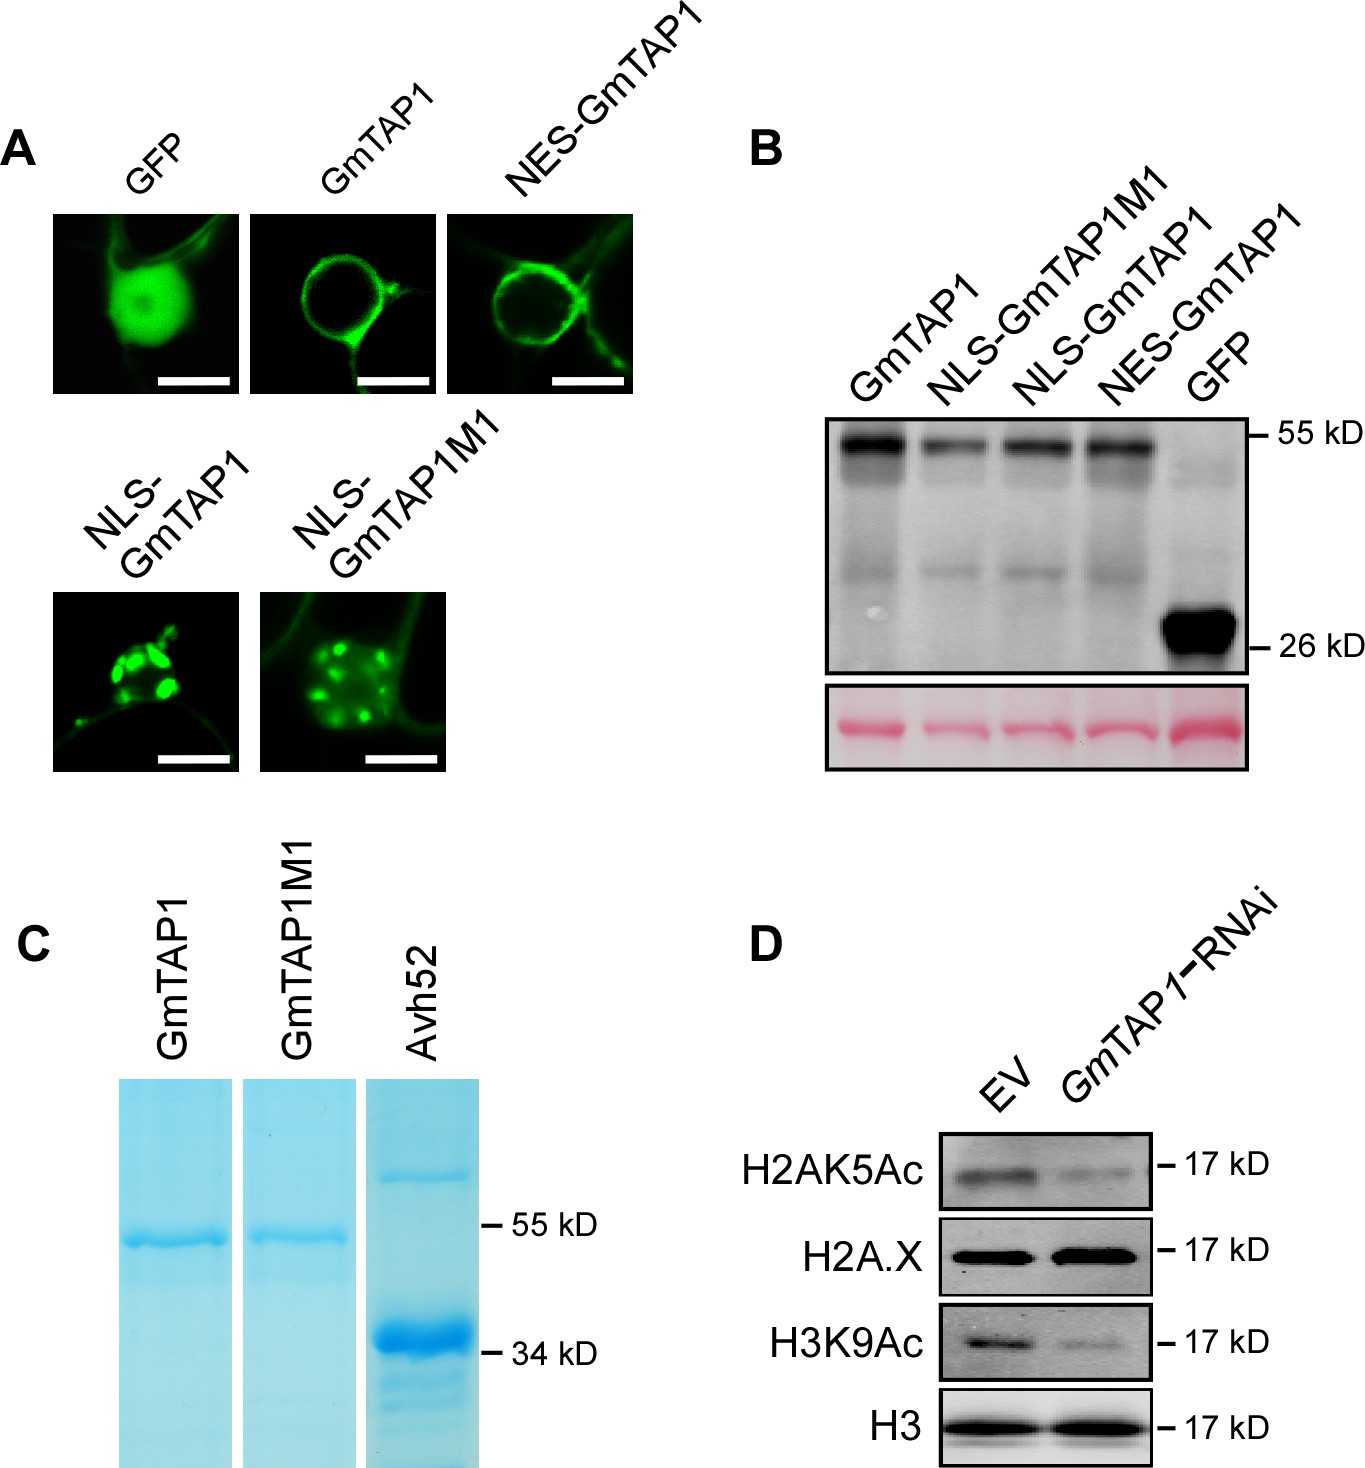
Localization and expression of various GFP-GmTAP1 fusion proteins .
(A) Localization of GFP and indicated GFP-GmTAP1 fusion proteins after 48 hr expression in N.benthamiana cells. Scale bars = 10 µm. (B) Protein levels of GFP and indicated GFP fusion proteins after 48 hr expression in N. benthamiana cells, as determined by western blotting using anti-GFP antibodies. (C) GmTAP1, GmTAP1M1, and PsAvh52 purified from E. coli for the histone acetyltransferase assays shown in Figure 5C. (D) Silencing of GmTAP genes attenuated the level of soybean histone acetylation during P. sojae infection. Soybean hairy roots expressing a GmTAP-silencing construct or carrying an EV control were inoculated with P. sojae wild type. Histones were extracted from the infected tissue 6 hr later and assayed for acetylation by western blotting as indicated.
Figure 6 with 2 supplements
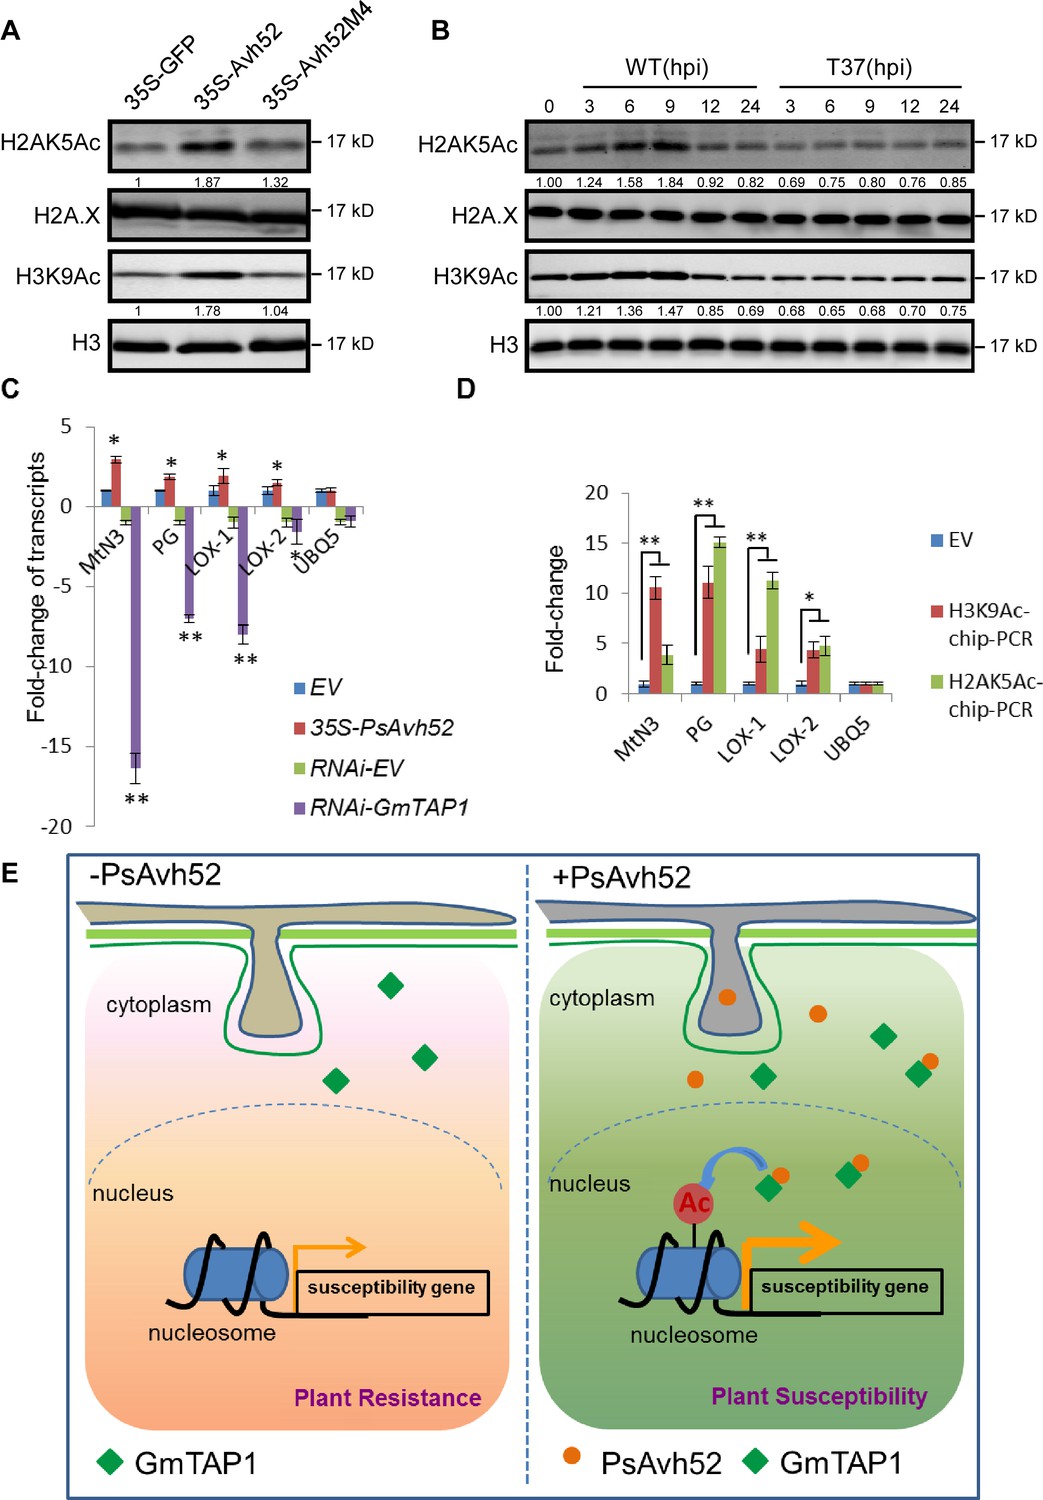
PsAvh52 increases the acetylation of soybean histones in planta and modulates host gene expression.
(A) Acetylation levels of H2AK5 and H3K9 in soybean hairy roots expressing PsAvh52, PsAvh52M4, or GFP. (B) Acetylation levels of H2AK5 and H3K9 in soybean hypocotyl lesions infected by P. sojae WT or deletion mutant T37 at different time points. In (A) and (B), acetylated histones, and the controls H3 and H2A.X were detected in the nuclear protein fraction by western blotting with the corresponding antibodies. (C) Relative transcript levels of putative susceptibility genes in PsAvh52-expressing and GmTAP-silenced soybean hairy roots after infection with WT P. sojae strain P6497 for 6 hr. Levels were normalized to the levels in the EV overexpression control (+1) or to the RNA-EV silencing control (−1). Data are the means ± s.d. of three independent biological replicates. Asterisks denote significant differences between treatment and control (*p < 0.05 or **p < 0.01, Student’s t test). (D) The histone acetylation levels of selected putative susceptibility genes were analyzed by ChIP-qPCR. Immunoprecipitation of H2AK5Ac and H3K9Ac were performed on nuclear proteins from PsAvh52-expressing or EV-carrying soybean hairy roots infected by P. sojae WT for 6 hr. Precipitation was quantitated by qPCR with specific primers, normalized to the values of the inputs, and then divided by the normalized values of the EV controls, to produce the enrichment values. Data are the means ± s.d. of three independent biological replicates. Asterisks denote significant differences between treatments and EV control (*p < 0.05 or **p < 0.01, Student’s t test). (E) Working model of PsAvh52 action. PsAvh52 recruits cytoplasmically-localized GmTAP1 into nuclear speckles, where it acetylates histones H2A and H3, elevating transcription of susceptibility genes to promote P. sojae infection.
-
Figure 6—source data 1
Source data for Figure 6.
- https://doi.org/10.7554/eLife.40039.024
Figure 6—figure supplement 1
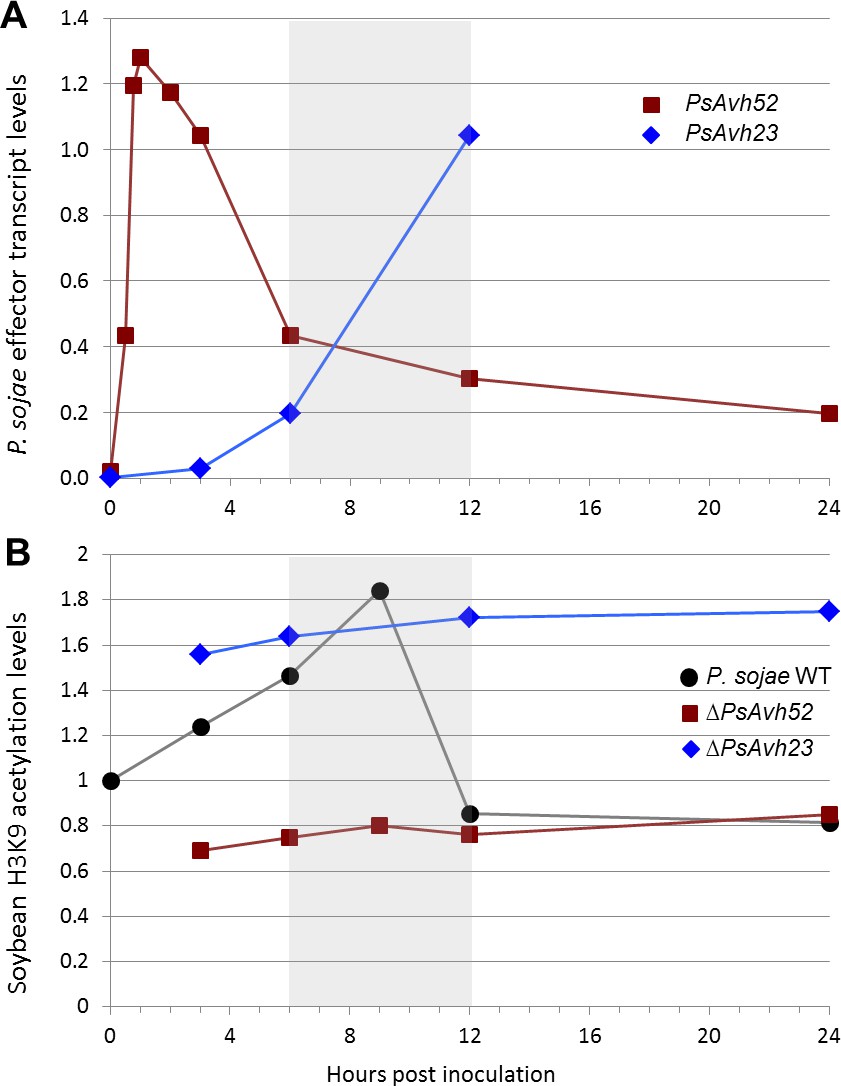
Expression patterns of PsAvh52 and PsAvh23 correlate with changes in soybean histone H3 acetylation during P.sojae infection.
(A) Transcript levels of PsAvh52 and PsAvh23 relative to a basket of constitutive reference genes, during P. sojae infection of soybean hypocotyls. Data are adapted from Figure 5 of Wang et al., 2011 and Figure 8C of Ma et al., 2015. (B) Soybean histone H3K9 acetylation levels during infection of soybean hypocotyls by P. sojae wildtype P6497, and by strains carrying PsAvh52 and PsAvh23 deletions. Data are from Figure 5C of Kong et al., 2017 and Figure 6B of this publication. Shaded box indicates the time interval during which PsAvh23 transcript levels first exceed those of PsAvh52, and when H3K9 levels drop below pre-infection levels.
Figure 6—figure supplement 2
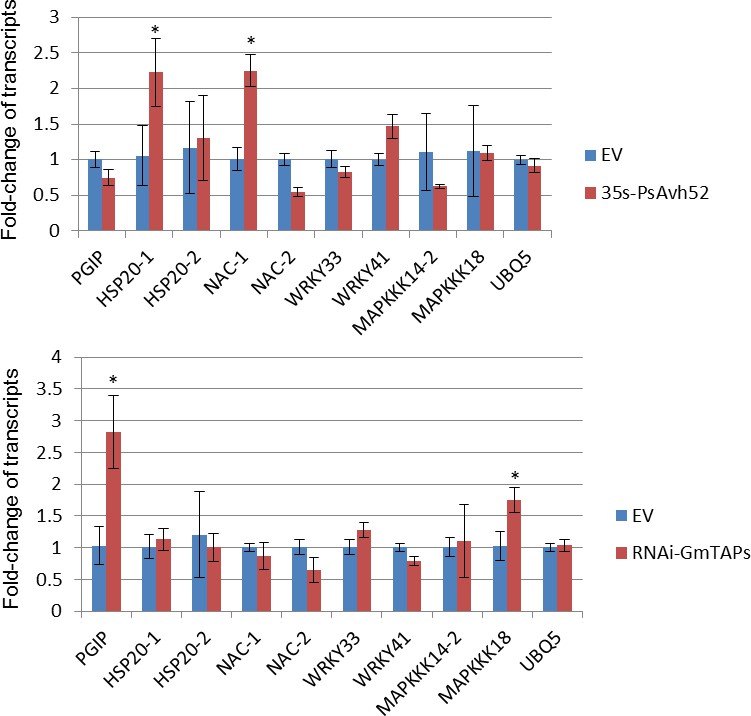
PsAvh52 and GmTAP1 do not regulate genes that are co-regulated by PsAvh23 and SAGA.
Total RNAs were extracted from PsAvh52-expressing or GmTAP-silenced soybean hairy roots, six hours after inoculation with P. sojae strain P6497. The transcript levels of the indicated genes were measured by qRT-PCR, and normalized to the level of the transcript in the EV control plants. The genes assayed were ones shown by Kong et al., 2017 to be significantly decreased in hairy roots expressing PsAvh23 or silenced for GmADA2 or GmGCN5. Data are the means ± s.d. of three independent biological replicates. Asterisks denote significant differences between treatment and control (EV) pairs (*p < 0.05, Student’s t test).
Tables
Key resources table
| Reagent type (species) or resource | Designation | Source or reference | Identifiers | Additional information |
|---|---|---|---|---|
| Strain (Phytophthora sojae) | P6497 | PMID: 1128796 | ||
| Strain (Phytophthora capsici) | LT263 | PMID: 28318979 | ||
| Gene (Phytophthora sojae) | PsAvh52 | JGI Physo3 database | ID:356704 | |
| Gene (Glycine max) | GmTAP1 | Phytozome database | ID: Glyma.18G216900.1 | |
| Antibody (Mouse monoclonal) | anti-GST | Abmart | M20007 | Western bloting (1:5000 dilution) |
| Antibody (Mouse monoclonal) | anti-His | Abmart | M30111 | Western bloting (1:5000 dilution) |
| Antibody (Mouse monoclonal) | anti-GFP | Abmart | M20004 | Western bloting (1:5000 dilution) |
| Antibody (Rat monoclonal) | anti-RFP | Chromotek | 5f8 | Western bloting (1:5000 dilution) |
| Antibody (Mouse monoclonal) | Anti-Flag | Sigma | F3165 | Western bloting (1:5000 dilution) |
| Antibody (Rabbit polyclonal) | anti-H3ac | Millipore | 382158 | Western bloting (1:2500 dilution) |
| Antibody (Rabbit polyclonal) | anti-H3K9ac | Millipore | 06–942 | Western bloting (1:2500 dilution) |
| Antibody (Rabbit monoclonal) | anti-H3K14ac | Abcam | ab52946 | Western bloting (1:2500 dilution) |
| Antibody (Rabbit monoclonal) | anti-H2K5ac | Abcam | ab45152 | Western bloting (1:2500 dilution) |
| Antibody (Rabbit monoclonal) | anti-H2AK9ac | Abcam | ab177312 | Western bloting (1:2500 dilution) |
Additional files
-
Supplementary file 1
Primers used in this study.
- https://doi.org/10.7554/eLife.40039.025
-
Transparent reporting form
- https://doi.org/10.7554/eLife.40039.026
Download links
A two-part list of links to download the article, or parts of the article, in various formats.
Downloads (link to download the article as PDF)
Open citations (links to open the citations from this article in various online reference manager services)
Cite this article (links to download the citations from this article in formats compatible with various reference manager tools)
A Phytophthora effector recruits a host cytoplasmic transacetylase into nuclear speckles to enhance plant susceptibility
eLife 7:e40039.
https://doi.org/10.7554/eLife.40039


