CNTN5-/+or EHMT2-/+human iPSC-derived neurons from individuals with autism develop hyperactive neuronal networks
- The Hospital for Sick Children, Canada
- The Centre for Applied Genomics, The Hospital for Sick Children, Canada
- Stem Cell and Cancer Research Institute, McMaster University, Canada
- Lunenfeld-Tanenbaum Research Institute, Mount Sinai Hospital, Canada
- University of Toronto, Canada
- Canadian Institute for Advanced Research (CIFAR), Canada
Figures
Figure 1
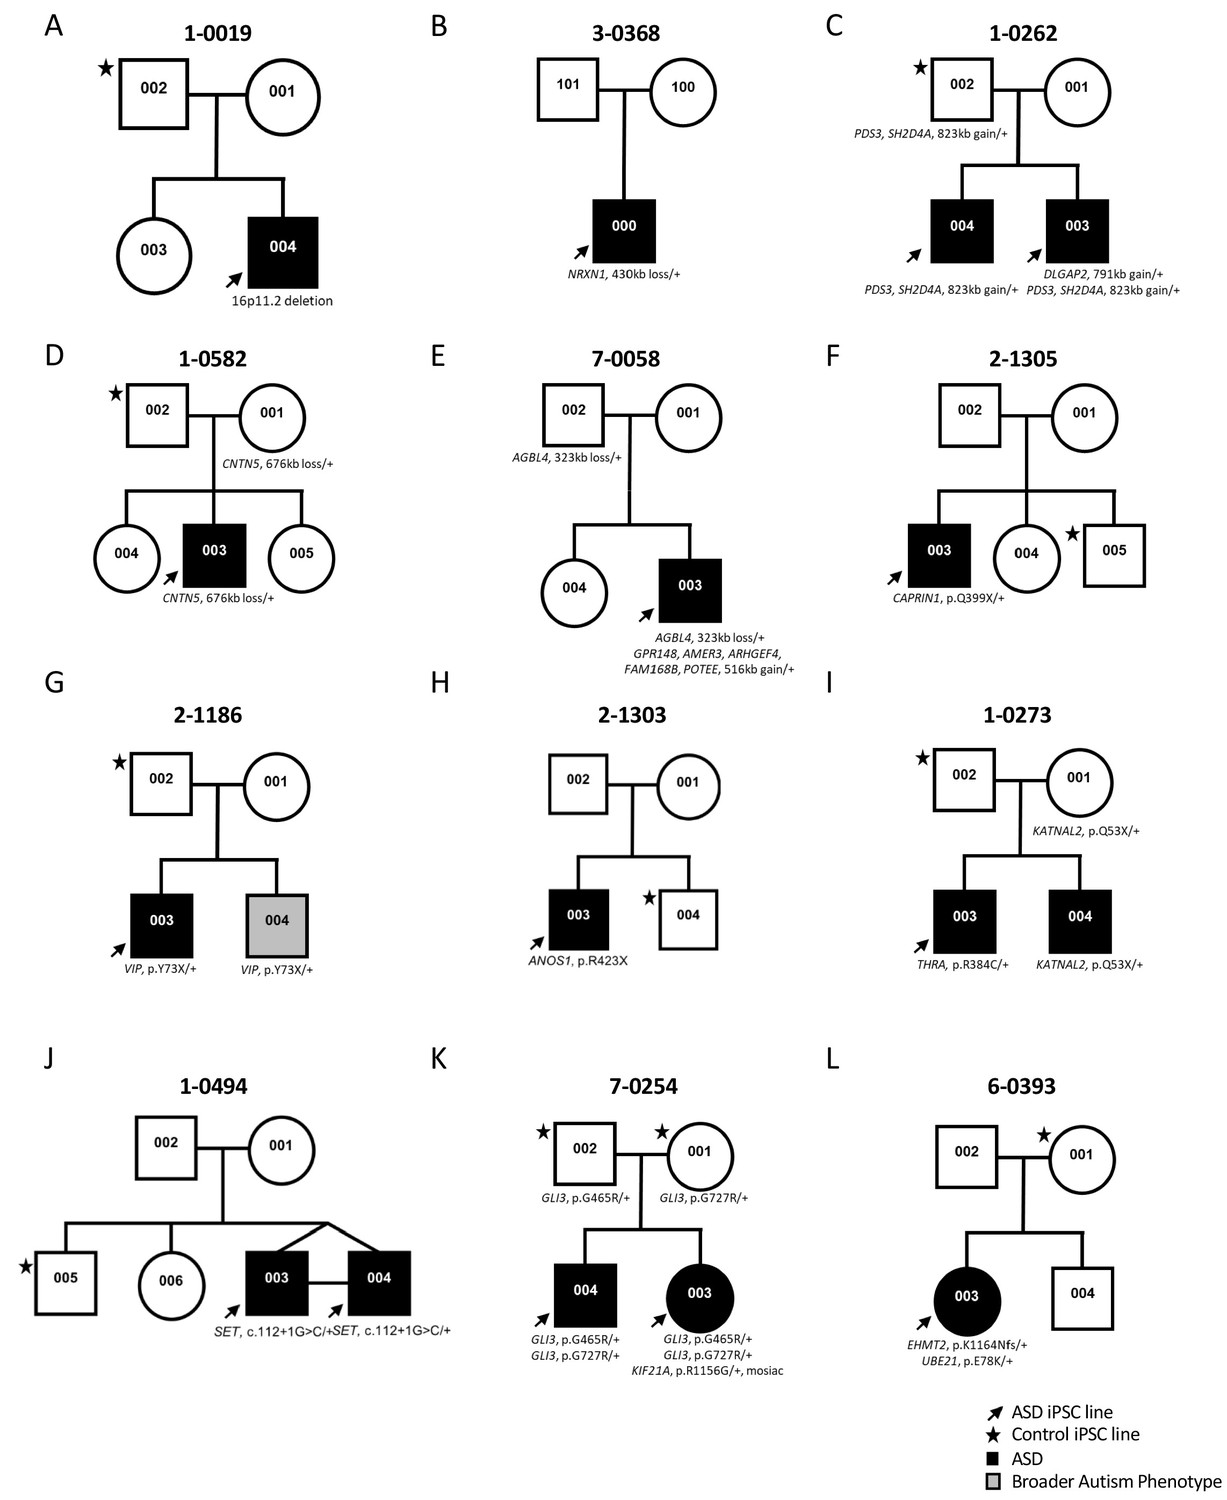
Genetic pedigrees of the participant families with identified genetic variants.
One ASD-affected (black arrow) and one sex-matched unaffected (black star) members were typically selected for iPSC reprogramming. ASD-affected children are represented with a black box; note that line 1-0019-002 (19-2) in A) was used as a control and was described previously (Deneault et al., 2018).
Figure 2 with 1 supplement
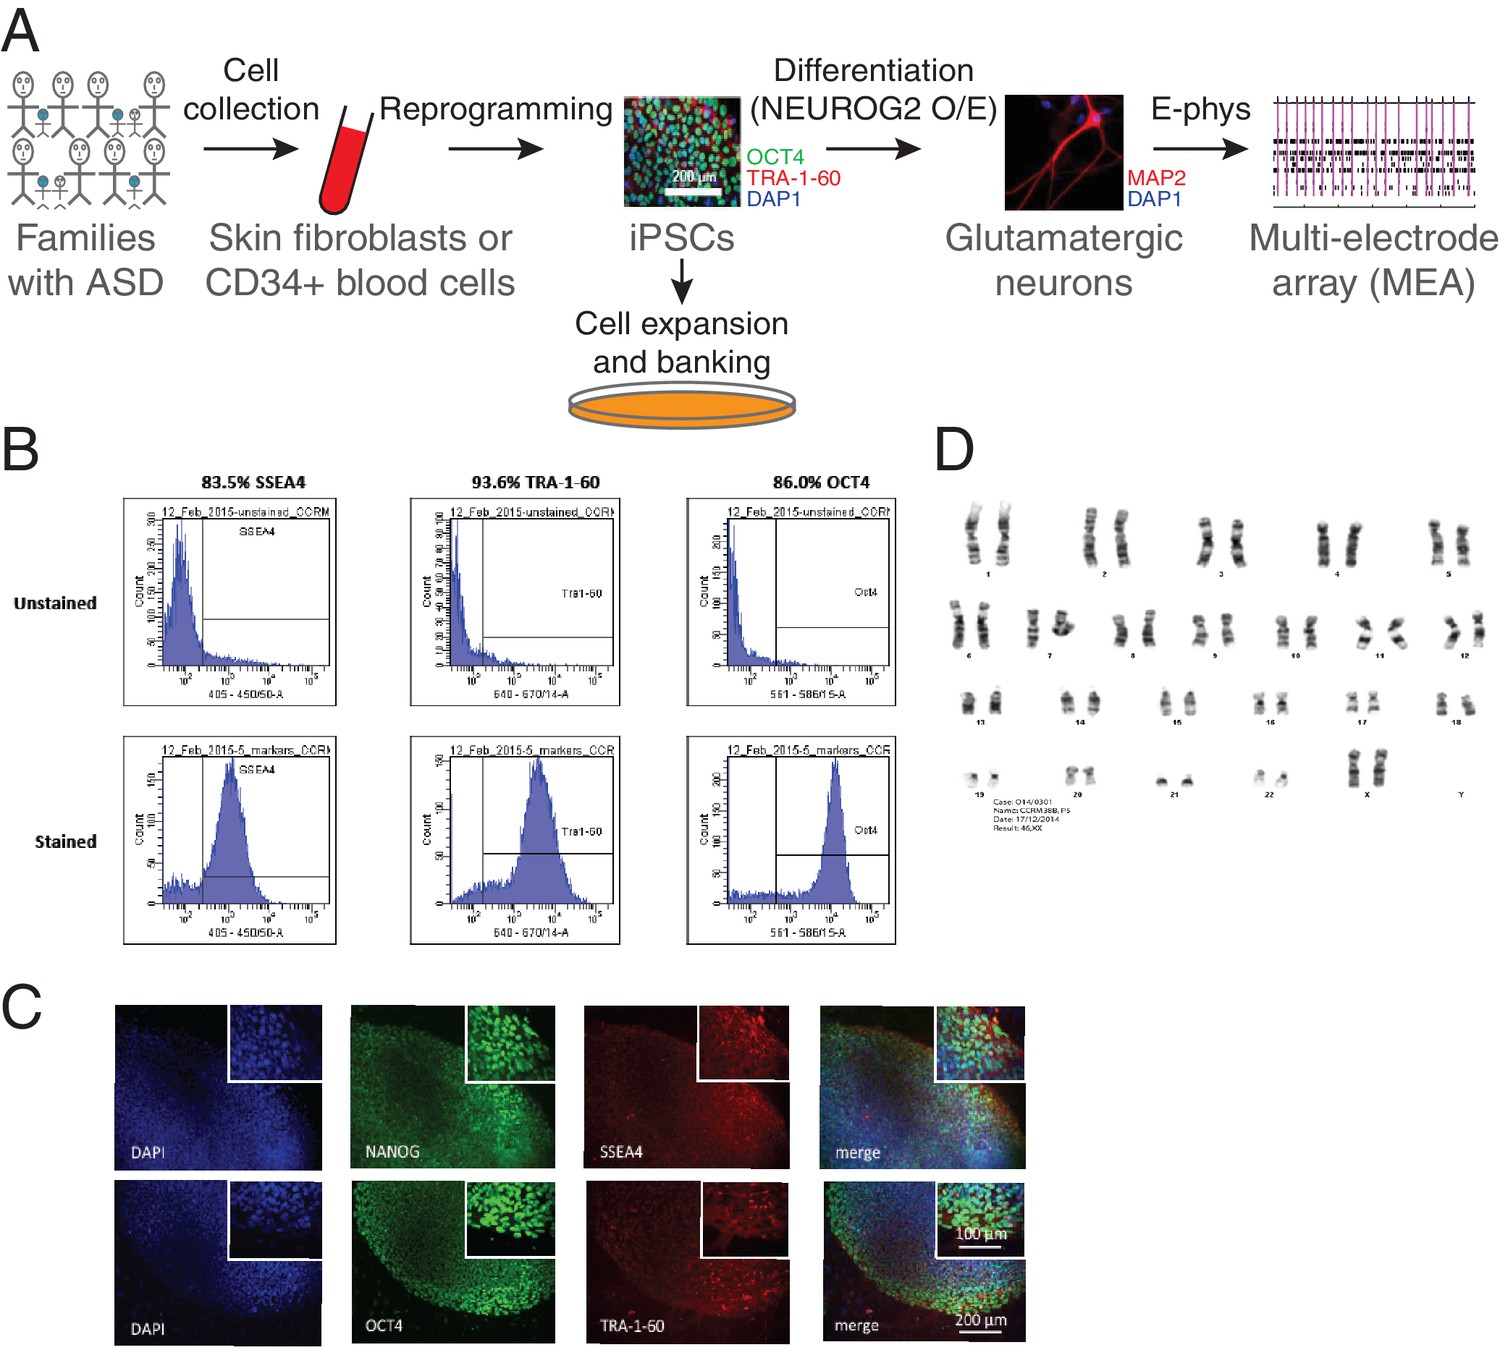
Generation of iPSCs and neurons.
(A) Schematic representation of the experimental procedure to find specific electrophysiological signatures associated with genetic variants of clinical significance to autism spectrum disorder (ASD). Fibroblasts or blood cells were reprogrammed into iPSCs from a cohort of 25 probands and unaffected family members. Differentiation of iPSCs into glutamatergic neurons was achieved with NGN2 7 day transient overexpression, and electrophysiological properties were monitored using a multi-electrode array (MEA) device. (B) Flow cytometry and (C) Immunohistochemistry revealing expression of the pluripotency markers NANOG, SSEA4, OCT4 and TRA-1–60 in a representative iPSC line. (D) Representative normal male karyotype in iPSC; 20 cells were examined.
Figure 2—figure supplement 1
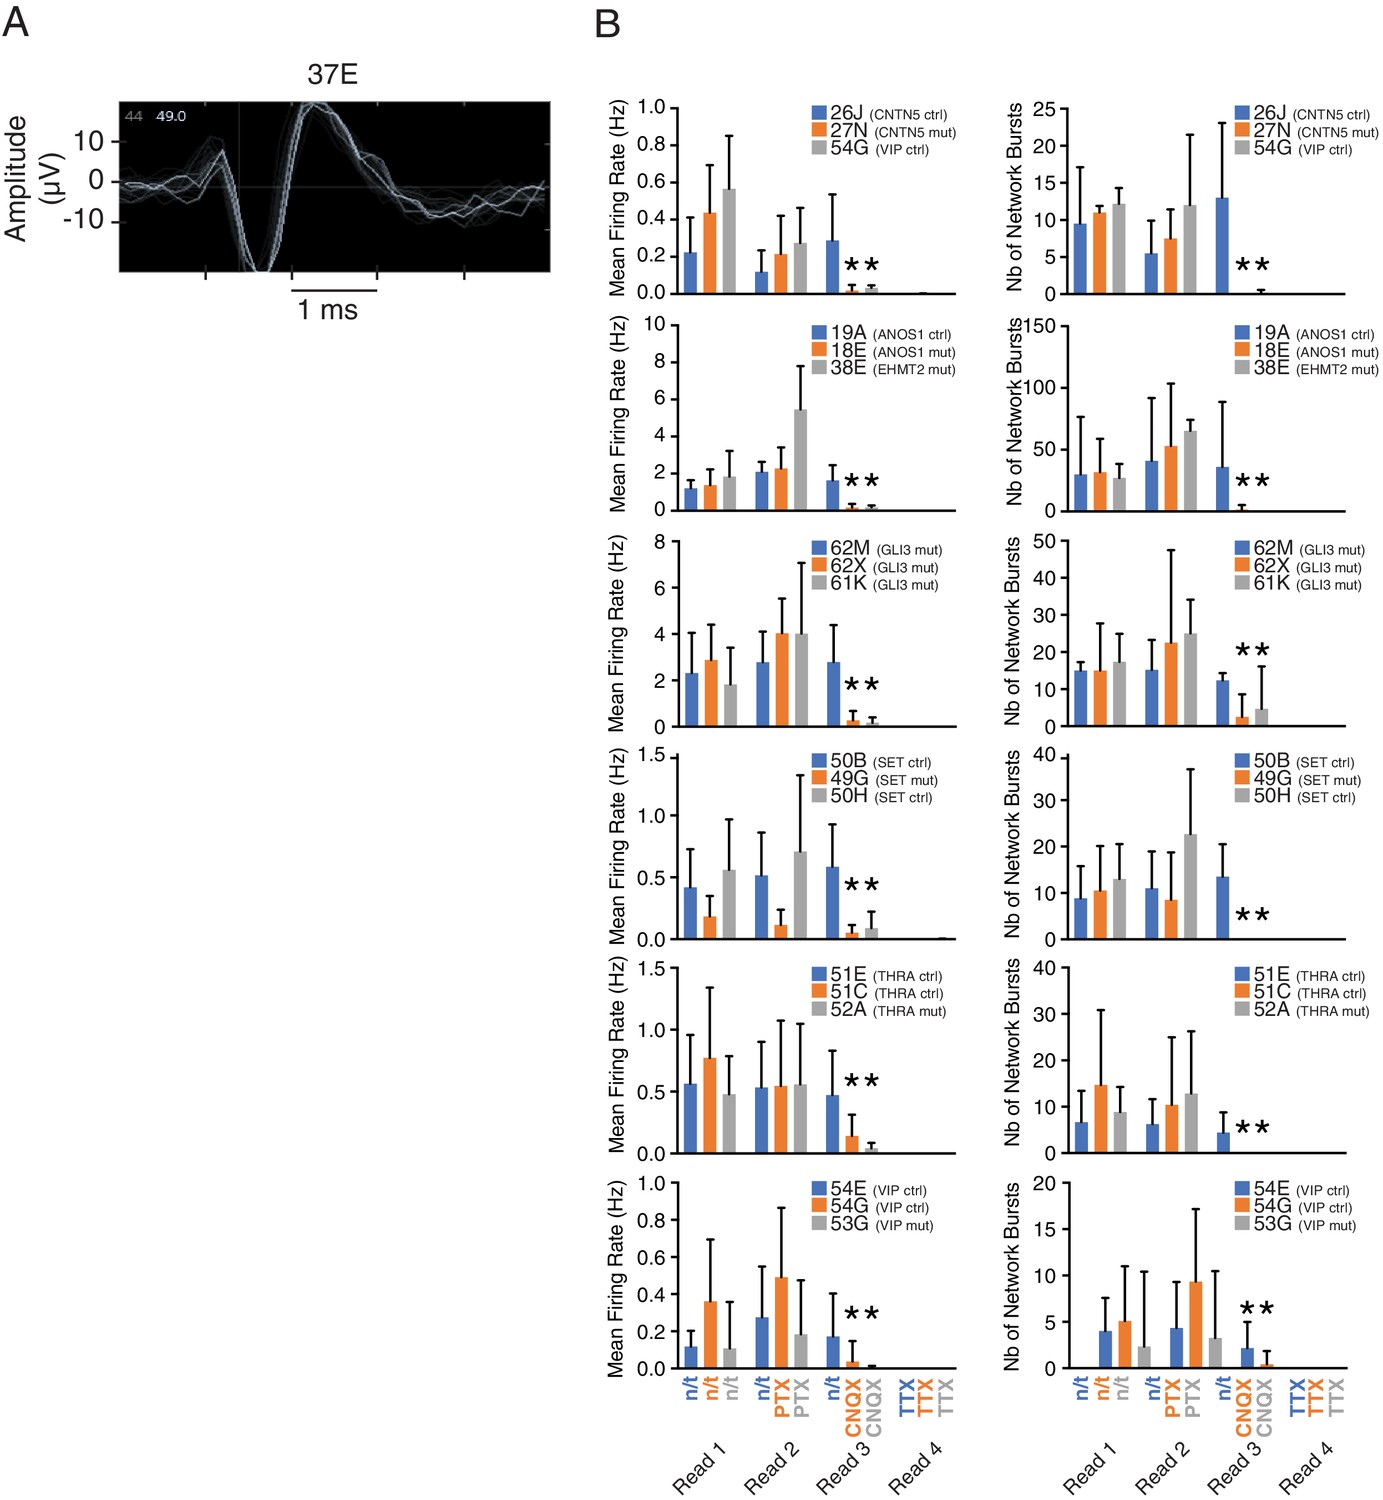
Multi-electrode array (MEA) monitoring of iPSC-derived neurons.
(A) Representative trace of the amplitude of an action potential during time, detected by one electrode from one well populated with line 37E. (B) MEA recordings of the MFR and number of network bursts of different iPSC-derived neuronal lines upon treatments with different receptor inhibitors. Values were acquired in four consecutive readings, that is, before (read 1) and after addition of GABA receptor inhibitor PTX (read 2), after addition of AMPA receptor inhibitor CNQX (read 3), and after addition of sodium channel blocker TTX (read 4). At least 60 min recovery was allowed after each reading, which were performed 5–10 min after treatment with neurotoxins. 6–8 wells were recorded for each group at week 8 PNI. Values are presented as mean ± SD from a single experiment; *p<0.05 between n/t and CNQX for all samples; PTX, Picrotoxin; CNQX, 6-Cyano-7-nitroquinoxaline-2,3-dione; TTX, Tetrodotoxin; n/t, not treated; μV, microvolt; Hz, hertz; ctrl, control; mut, mutant.
Figure 3 with 1 supplement
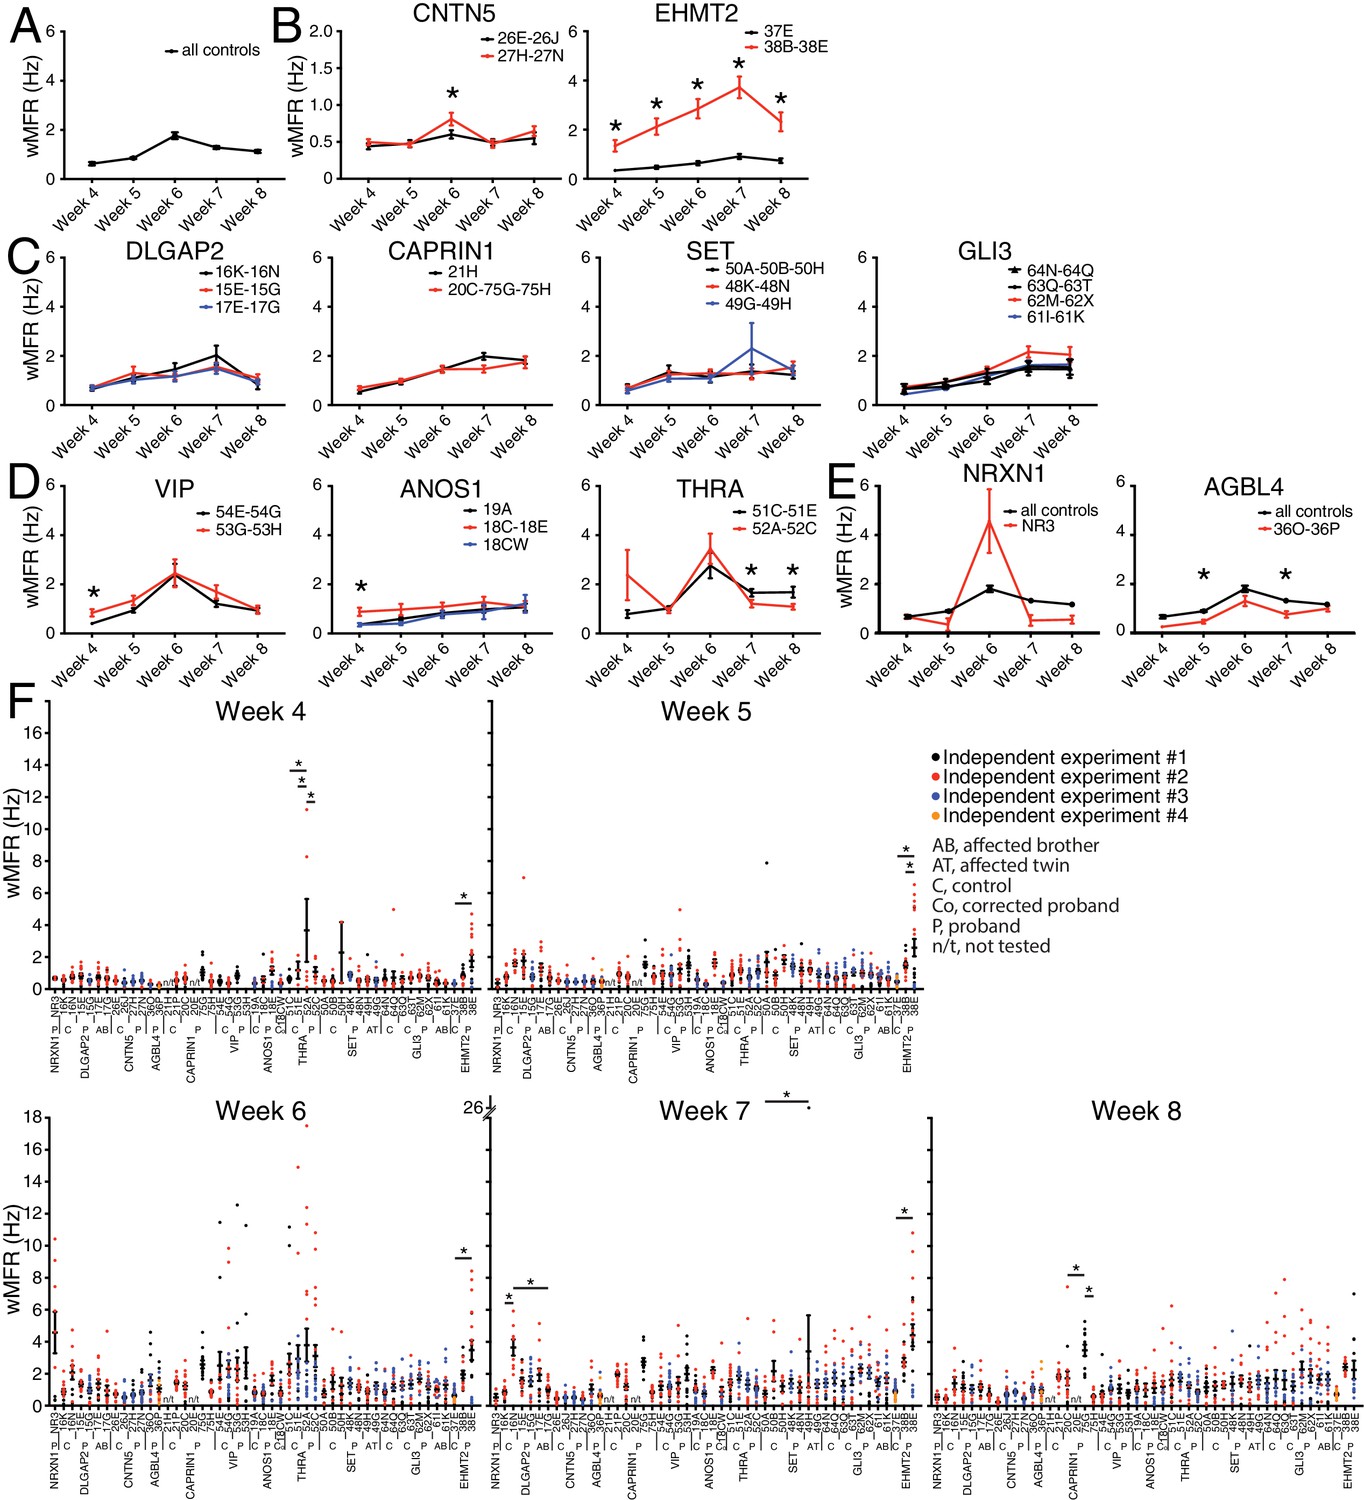
Multi-electrode array monitoring of iPSC-derived glutamatergic neurons.
(A–E) Weighted mean firing rate (wMFR) of pooled cell lines from control and KO neurons for each family from week 4 to 8 PNI. (F) Dot plots showing wMFR of each cell line from week 4 to 8 PNI; each dot represents the wMFR of one well, and the color reflects independent experiments. Values are presented as mean ± SEM of several technical and biological replicates, as presented in Supplementary file 3; ‘all controls’ represents the pool of 311 different control wells from 17 independent experiments; *p<0.05 from multiple t test comparison with Holm-Sidak correction (B), and without correction (C–E), and one-way ANOVA Tukey test pointing to intra- or inter-individual variability per family (F).
-
Figure 3—source data 1
Weighted mean firing rate values for each cell line at each timepoint.
- https://doi.org/10.7554/eLife.40092.009
Figure 3—figure supplement 1

Mean firing rates recorded by MEA from iPSC-derived glutamatergic neurons.
(A) Pooled cell lines from control and KO neurons for each family, from weeks 4 to 8 PNI. (B) Dot plots of each cell line recorded from weeks 4 to 8 PNI; each dot represents the MFR of one well, and the color reflects independent experiments. Values are presented as mean ± SEM of several technical and biological replicates, as presented in Supplementary file 3; *p<0.05 from multiple t test comparison without correction (A), and one-way ANOVA Tukey test pointing to intra- or inter-individual variability per family (B).
-
Figure 3—figure supplement 1—source data 1
Mean firing rate values for each cell line at each timepoint.
- https://doi.org/10.7554/eLife.40092.008
Figure 4
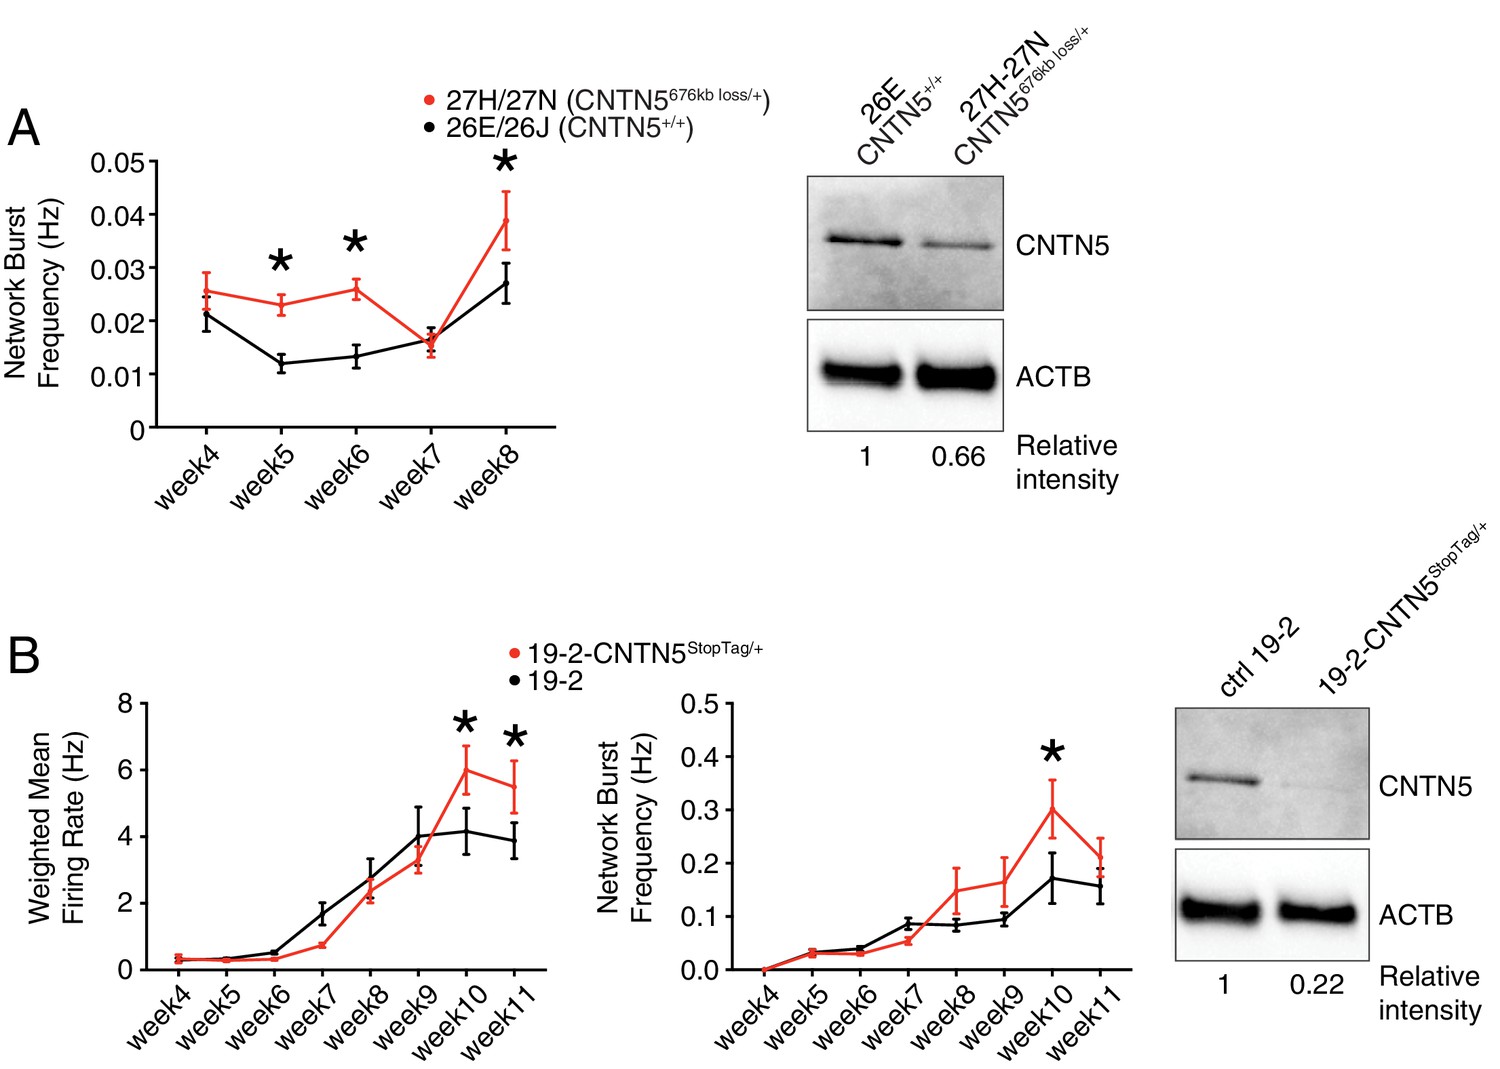
Validation of CNTN5-mutant neuron hyperactivity.
(A) The network burst frequency was recorded from the CNTN5 family from weeks 4–8 PNI, with corresponding protein levels by western blot on the right panel; *p<0.05 from multiple t test comparison with Holm-Sidak correction at weeks 6 and 8. (B) Both wMFR and network burst frequency were recorded from the 19–2-CNTN5 isogenic pair from weeks 4–11 PNI, with protein levels. The iPSC IDs and genotypes are indicated above each graph; values are presented as mean ± SEM of different lines per participant, and of several technical and biological replicates, as presented in Supplementary file 3; actin beta (ACTB) was used as a loading control for the western blots and the relative intensity of each band is indicated below the blots; *p<0.05 from multiple t test comparison with Holm-Sidak correction.
-
Figure 4—source data 1
Multielectrode array values for familial CNTN5 lines.
- https://doi.org/10.7554/eLife.40092.011
-
Figure 4—source data 2
Multielectrode array values for isogenic CNTN5 lines.
- https://doi.org/10.7554/eLife.40092.012
Figure 5
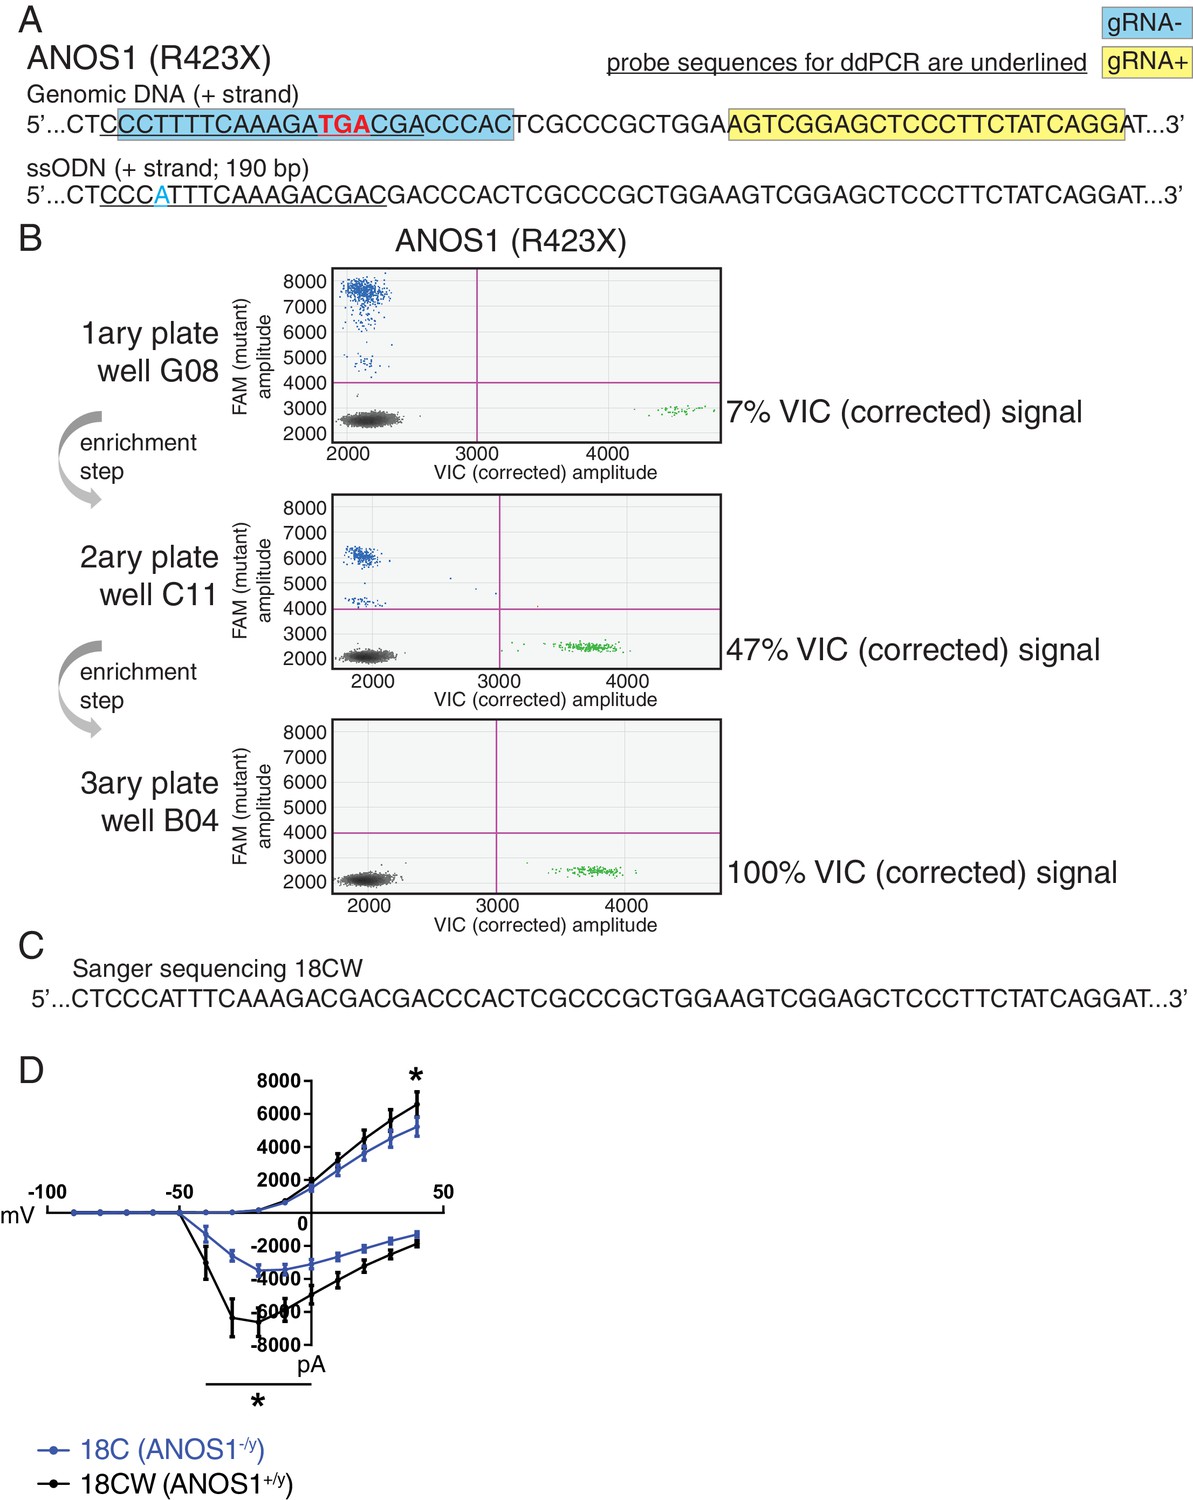
Correction of point mutation in ANOS1 in iPSCs using CRISPR editing.
(A) Design of gRNAs, ssODNs and ddPCR probes for correction of R423X in ANOS1; one sgRNA for each genomic DNA strand, that is, gRNA- in blue and gRNA +in yellow, was devised in close proximity for the double-nicking system using Cas9D10A; the non-sense mutations in ANOS1 is depicted in bold red; a silent mutation was introduced in ssODN (in blue) for ddPCR probe (underlined) specificity and to prevent nicking. (B) ddPCR absolute quantification coupled with two consecutive limiting-dilution enrichment steps were necessary to isolate a 100% corrected line, that is, 100% VIC signal. (C) Sanger sequencing confirmed proper correction of non-sense mutation R423X in line 18C back to wt; this newly corrected line was named 18CW. (D) Outward and inward membrane current detected by patch-clamp recordings; total number of recorded neurons was 15 for both 18C and 18CW; values are presented as mean ± SEM of three independent differentiation experiments, recorded at day 21–25 PNI. *p<0.05 from multiple t test comparison with Holm-Sidak correction.
-
Figure 5—source data 1
Inward/outward current values for familial ANOS1 lines.
- https://doi.org/10.7554/eLife.40092.014
Figure 6 with 2 supplements
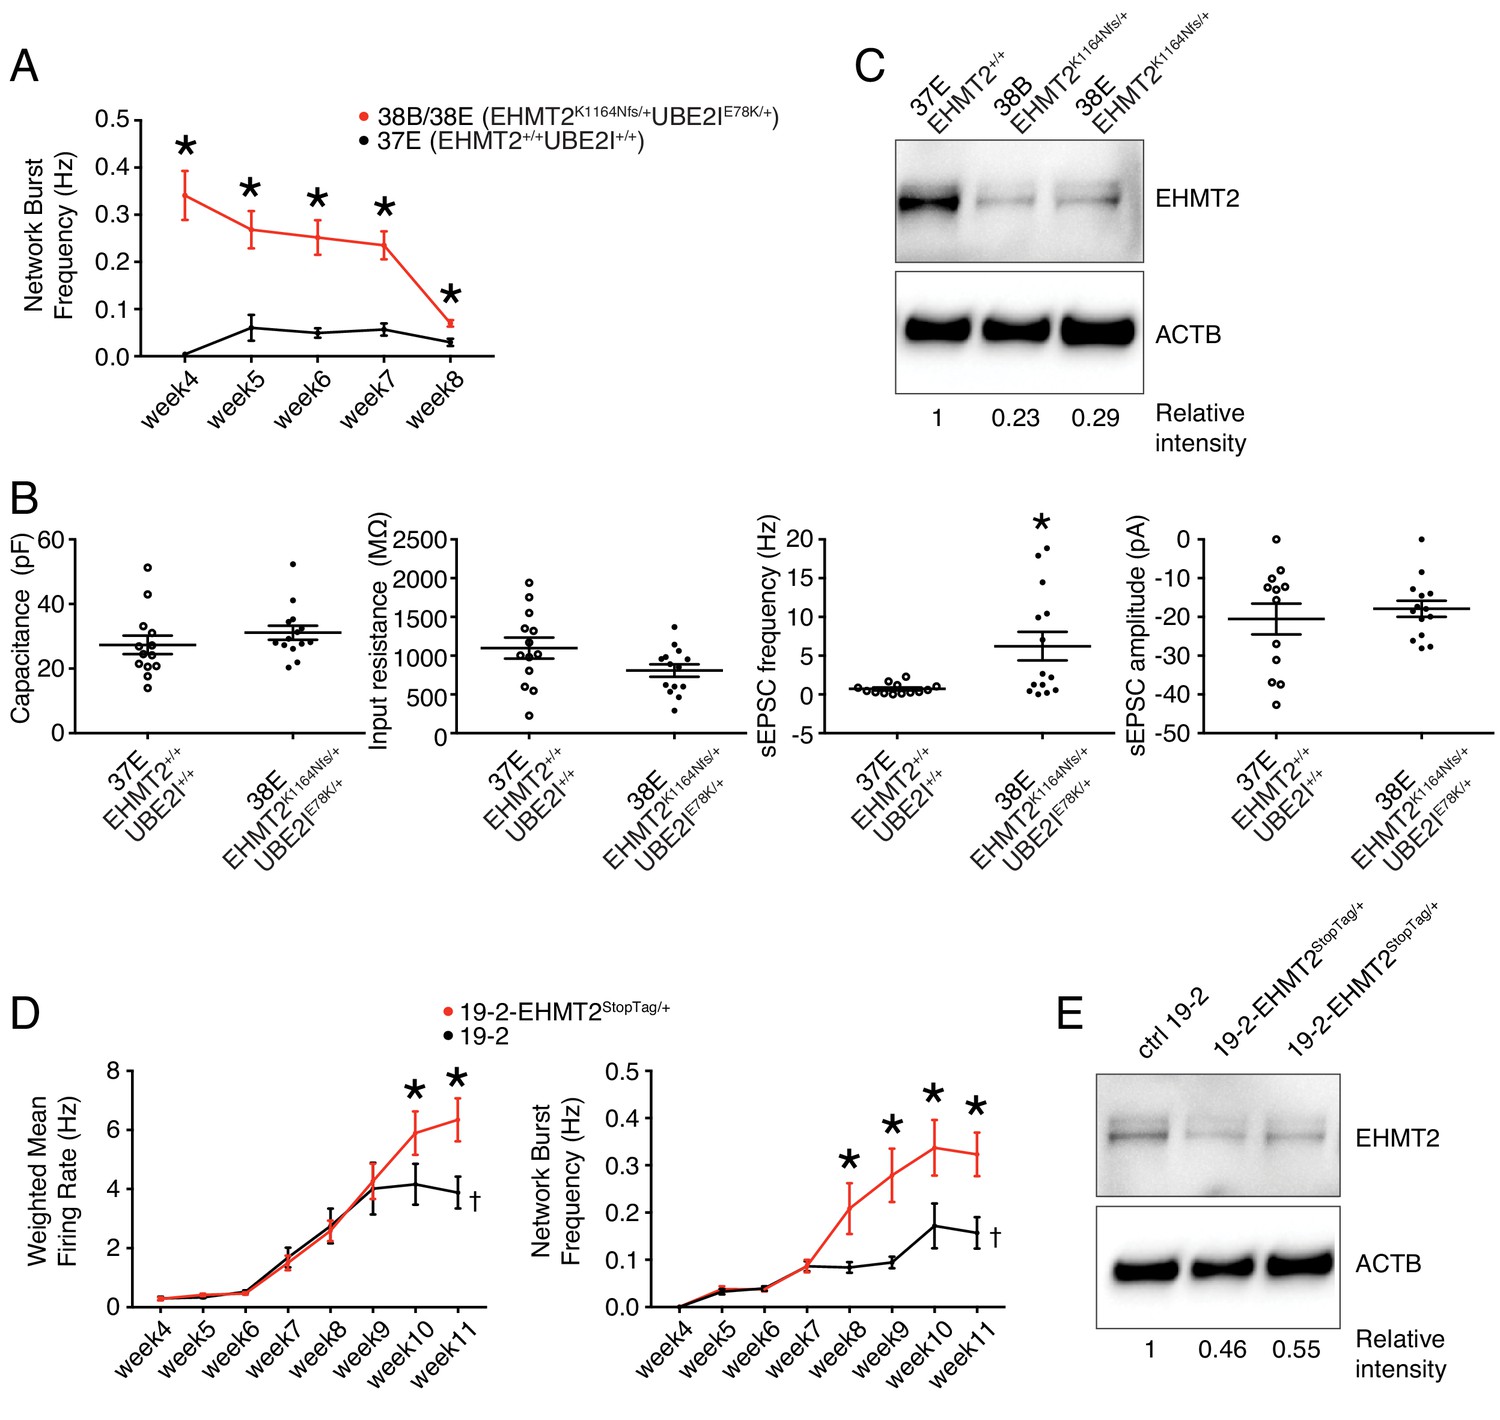
Electrophysiological and protein level variations in EHMT2-deficient neurons.
(A) Network burst frequency was recorded using MEA from the EHMT2/UBE2I family from weeks 4–8 PNI; values are presented as mean ± SEM of several technical and biological replicates, as presented in Supplementary file 3; *p<0.05 from multiple t test comparison with Holm-Sidak correction. (B) Patch-clamp recordings of two selected lines, that is, 37E (control) and 38E (mutant); values are presented as mean ± SEM of 14 different neurons from two independent differentiation experiments; *p<0.05 from from unpaired t test two-tailed. (C) Western blot showing a decrease in EHMT2 protein levels in mutant neurons (38B and 38E) compared to their respective control neurons (37E). (D) MEA recordings of the isogenic pair 19–2 and 19–2-EHMT2StopTag/+ iPSC-derived neurons from weeks 4–11 PNI; values are presented as mean ± SEM of eight different wells for each three independent differentiation experiments; †note that the same data for control 19–2 was used in Figure 4B since it was generated within the same experiments, that is, plates 26, 33 and 37 (see Supplementary file 3); *p<0.05 from multiple t test comparison with Holm-Sidak correction at week 11 (weighted mean firing rate) and weeks 9–11 (network burst frequency). (E) Western blot showing a decrease in EHMT2 protein levels in mutant neurons 19–2-EHMT2StopTag/+ compared to their respective control (ctrl) neurons 19–2; actin-beta (ACTB) was used as a loading control and the relative intensity of each band is indicated below the blots; pF, picofarad; MΩ, megaohm; Hz, hertz; pA, picoampere.
-
Figure 6—source data 1
Multielectrode array values for familial EHMT2 lines.
- https://doi.org/10.7554/eLife.40092.019
-
Figure 6—source data 2
Patch-clamp recording values for familial EHMT2 lines.
- https://doi.org/10.7554/eLife.40092.020
Figure 6—figure supplement 1
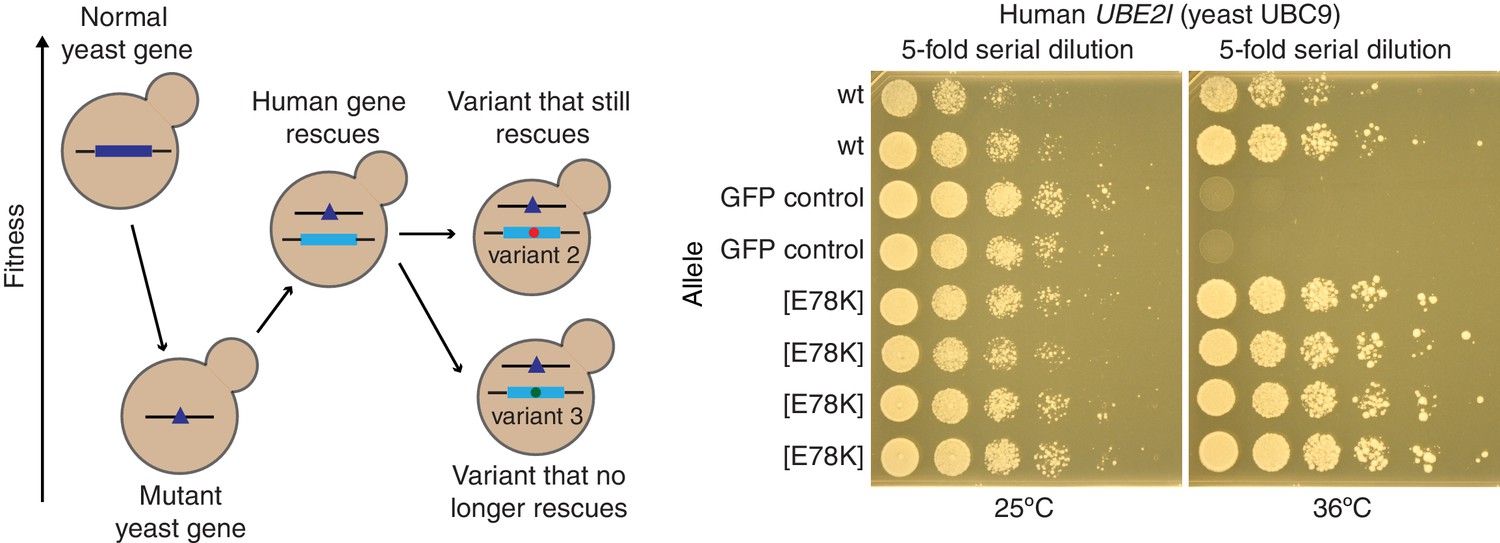
Yeast complementation assay to estimate the pathogenicity of the missense mutation E78K in the human gene UBE2I.
(i) Disruption of a yeast gene gives rise to a yeast phenotype (e.g., decreased fitness). (ii) The yeast phenotype is rescued by wild-type human alleles. (iii) Functional effects of human variants are evaluated based on their ability to rescue the phenotype relative to the wild type allele. A human variant may be deemed pathogenic if it cannot rescue the phenotype as well as wild type. Right panel shows growth assays on solid media for UBE2I[E78K] variant. The yeast cells were temperature-sensitive mutants of the yeast UBC9 gene, expressing either wild type or E78K allele of the UBE2I gene, or the GFP gene as a control. Five-fold serial dilutions of yeast cells were spotted onto plates and incubated at 24°C and 36°C for 2 days.
Figure 6—figure supplement 2
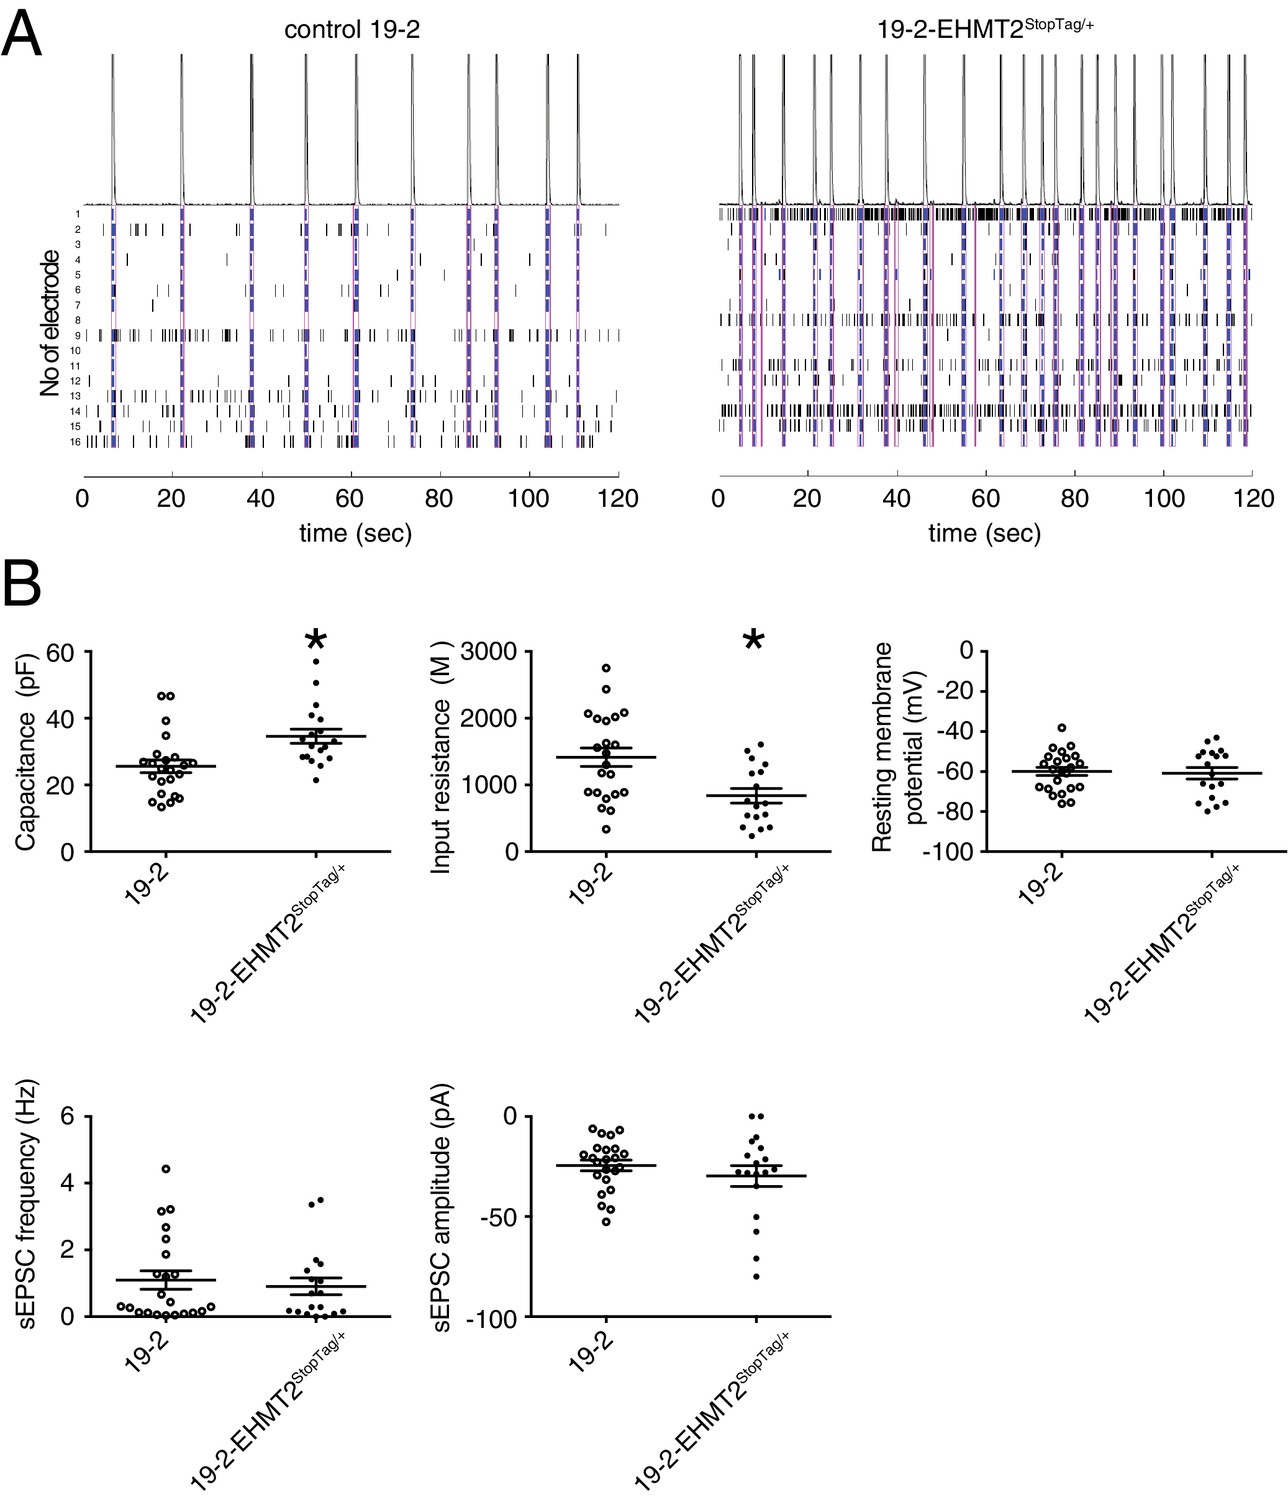
Electrophysiology of the isogenic pair 19–2 and 19–2-EHMT2StopTag/+.
(A) Representative raster plots of the first 120 sec of a 300 sec total MEA recording of the control 19–2 and the 19–2-EHMT2 heterozygous knockout lines, at week 11 PNI; a network burst (pink box or line) was identified as a minimum of 10 spikes, with a maximum inter-spike interval of 100 ms, detected by at least four different electrodes; sec, second; ms, millisecond. (B) Patch-clamp recordings of the isogenic pair 19–2 and 19–2-EHMT2StopTag/+ iPSC-derived neurons at day 21–25 PNI; values are presented as mean ± SEM of 21 different neurons from three independent differentiation experiments. pF, picofarad; MΩ, megaohm; Hz, hertz; pA, picoampere; *p<0.05 from from unpaired t test two-tailed.
-
Figure 6—figure supplement 2—source data 1
Patch-clamp recording values for isogenic EHMT2 lines.
- https://doi.org/10.7554/eLife.40092.018
Author response image 1
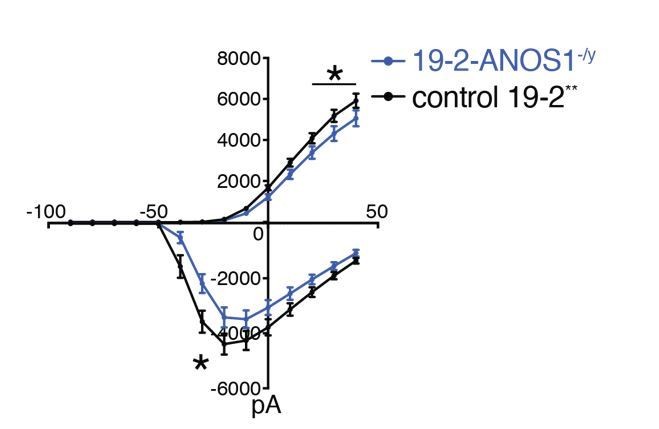
Outward and inward membrane current detected by patch-clamp recordings; total number of recorded neurons was 20 for 19-2-ANOS-/y and 33 for control 19-2; values are presented as mean+SEM of three independent differentiation experiments, recorded at day 21-25 PNI.
*p < 0.05 from multiple t test comparison; ** note that control 19-2 profile was previously reported in Deneault et al., 2018
Tables
Table 1
List of participants with ASD or unaffected controls, with the genetic variant(s) involved, and the different iPSC lines derived.
*The 1 bp deletion in EHMT2 would result in a frameshift 47 codons before the end of the protein and disruption of the stop-codon, potentially leading to the inclusion of a total of 221 incorrect amino acids; more information corresponding to the different genetic variants are presented in Supplementary file 1; MZ, monozygotic; Retro, retrovirus; N/A, not available
| Family ID | MSSNG Id | Status | Primary genetic variant(s) | Sex | Age at reprogramming (year) | Cell of origin | Reprogramming method | iPSC ID | Reference |
|---|---|---|---|---|---|---|---|---|---|
| ASD Candidate Gene - CNVs | |||||||||
| A | 1-0019-002 | Unaffected father | Family and study control | M | 44 | Skin | Retro | 19–2 | Deneault et al., 2018 |
| 1-0019-004 | ASD-affected | 16p11.2 deletion/+ | M | 15 | Skin | Retro | 19-4 | Marshall et al., 2008 | |
| B | 3-0368-000 | ASD-affected | NRXN1 430 kb deletion/+ | M | 8 | Skin | Retro | NR3 | Tammimies et al., 2015 |
| C | 1-0262-002 | Unaffected father | Family control | M | 49 | Skin | Sendai | 16K, 16N | --- |
| 1-0262-003 | ASD-affected | DLGAP2 791 kb duplication/+ | M | 10 | Skin | Sendai | 15E, 15G | Marshall et al., 2008 | |
| 1-0262-004 | Affected brother | Family control | M | 14 | Skin | Sendai | 17E, 17G | --- | |
| D | 1-0582-002 | Unaffected father | Family control | M | 37 | Skin | Sendai | 26E, 26J | --- |
| 1-0582-003 | ASD-affected | CNTN5 676 kb deletion | M | 9 | Skin | Sendai | 27H, 27N | N/A | |
| E | 7-0058-003 | ASD-affected | AGBL4 323 kb deletion/+ | M | 4 | Skin | Sendai | 36O, 36P | N/A |
| ASD Candidate Gene – SNVs | |||||||||
| F | 2-1305-005 | Unaffected brother | Family control | M | 7 | Skin | Sendai | 21H, 21P | --- |
| 2-1305-003 | ASD-affected | CAPRIN1 p.Q399X/+ | M | 12 | Skin | Sendai | 20C, 20E, 75G, 75H | Jiang et al., 2013 | |
| G | 2-1186-002 | Unaffected father | Family control | M | 43 | Blood | Sendai | 54E, 54G | --- |
| 2-1186-003 | ASD-affected | VIP p.Y73X/+ | M | 12 | Blood | Sendai | 53G, 53H | Jiang et al., 2013 | |
| H | 2-1303-004 | Unaffected brother | Family control | M | 13 | Skin | Sendai | 19A | --- |
| 2-1303-003 | ASD-affected | ANOS1 p.R423X | M | 19 | Skin | Sendai | 18C, 18E | Jiang et al., 2013 | |
| 2-1303-003 | Corrected ASD-affected | CRISPR-corrected ANOS1 p.X423R | M | 19 | Skin | Sendai | 18CW | --- | |
| I | 1-0273-002 | Unaffected father | Family control | M | 45 | Blood | Sendai | 51C, 51E | --- |
| 1-0273-003 | ASD-affected | THRA p.R384C/+ | M | 14 | Blood | Sendai | 52A, 52C | Yuen et al., 2015 | |
| Functional ASD Candidate Genes - SNVs | |||||||||
| J | 1-0494-005 | Unaffected brother | Family control | M | 12 | Blood | Sendai | 50A, 50B, 50H | --- |
| 1-0494-003 | ASD-affected MZ twin | SET c.112 + 1G>C/+ | M | 9 | Blood | Sendai | 48K, 48N | N/A | |
| 1-0494-004 | ASD-affected MZ twin | SET c.112 + 1G>C/+ | M | 9 | Blood | Sendai | 49H, 49G | N/A | |
| K | 7-0254-001 | Unaffected mother | GLI3 p.G727R/+ | F | 37 | Blood | Sendai | 64N, 64Q | --- |
| 7-0254-002 | Unaffected father | GLI3 p.G465R/+ | M | 41 | Blood | Sendai | 63Q, 63T | --- | |
| 7-0254-003 | ASD-affected | GLI3 p.G727R/+, mat GLI3 pG465R/+, pat KIF21A p.R1156G/+ (mosaic 23%) | F | 7 | Blood | Sendai | 62M, 62X | N/A | |
| 7-0254-004 | Affected brother | GLI3 p.G727R/+ GLI3 pG465R/+ | M | 9 | Blood | Sendai | 61I, 61K | N/A | |
| L | 6-0393-001 | Unaffected mother | Family control | F | 54 | Skin | Sendai | 37E | --- |
| 6-0393-003 | ASD-affected | *EHMT2 p.K1164Nfs/+ UBE2I p.E78K/+ | F | 18 | Skin | Sendai | 38B, 38E | N/A | |
Additional files
-
Supplementary file 1
Genomic coordinates of the genetic variant(s) associated with each participant.
- https://doi.org/10.7554/eLife.40092.021
-
Supplementary file 2
Characterization of pluripotency, differentiation potential and karyotype of iPSC lines. n/a, not available; STR, short tandem repeat.
- https://doi.org/10.7554/eLife.40092.022
-
Supplementary file 3
Number of different wells per sample for each different MEA plates. *Independent experiments imply independent infections with NGN2 viruses of iPSCs at different passages, entailing completely independent inductions.
- https://doi.org/10.7554/eLife.40092.023
-
Transparent reporting form
- https://doi.org/10.7554/eLife.40092.024
Download links
A two-part list of links to download the article, or parts of the article, in various formats.
Downloads (link to download the article as PDF)
Open citations (links to open the citations from this article in various online reference manager services)
Cite this article (links to download the citations from this article in formats compatible with various reference manager tools)
CNTN5-/+or EHMT2-/+human iPSC-derived neurons from individuals with autism develop hyperactive neuronal networks
eLife 8:e40092.
https://doi.org/10.7554/eLife.40092


